Disrupted-in-schizophrenia-1 is required for normal pyramidal cell–interneuron communication and assembly dynamics in the prefrontal cortex
- Institute for Physiology I, Faculty of Medicine, University of Freiburg, Germany
Figures
Figure 1 with 6 supplements
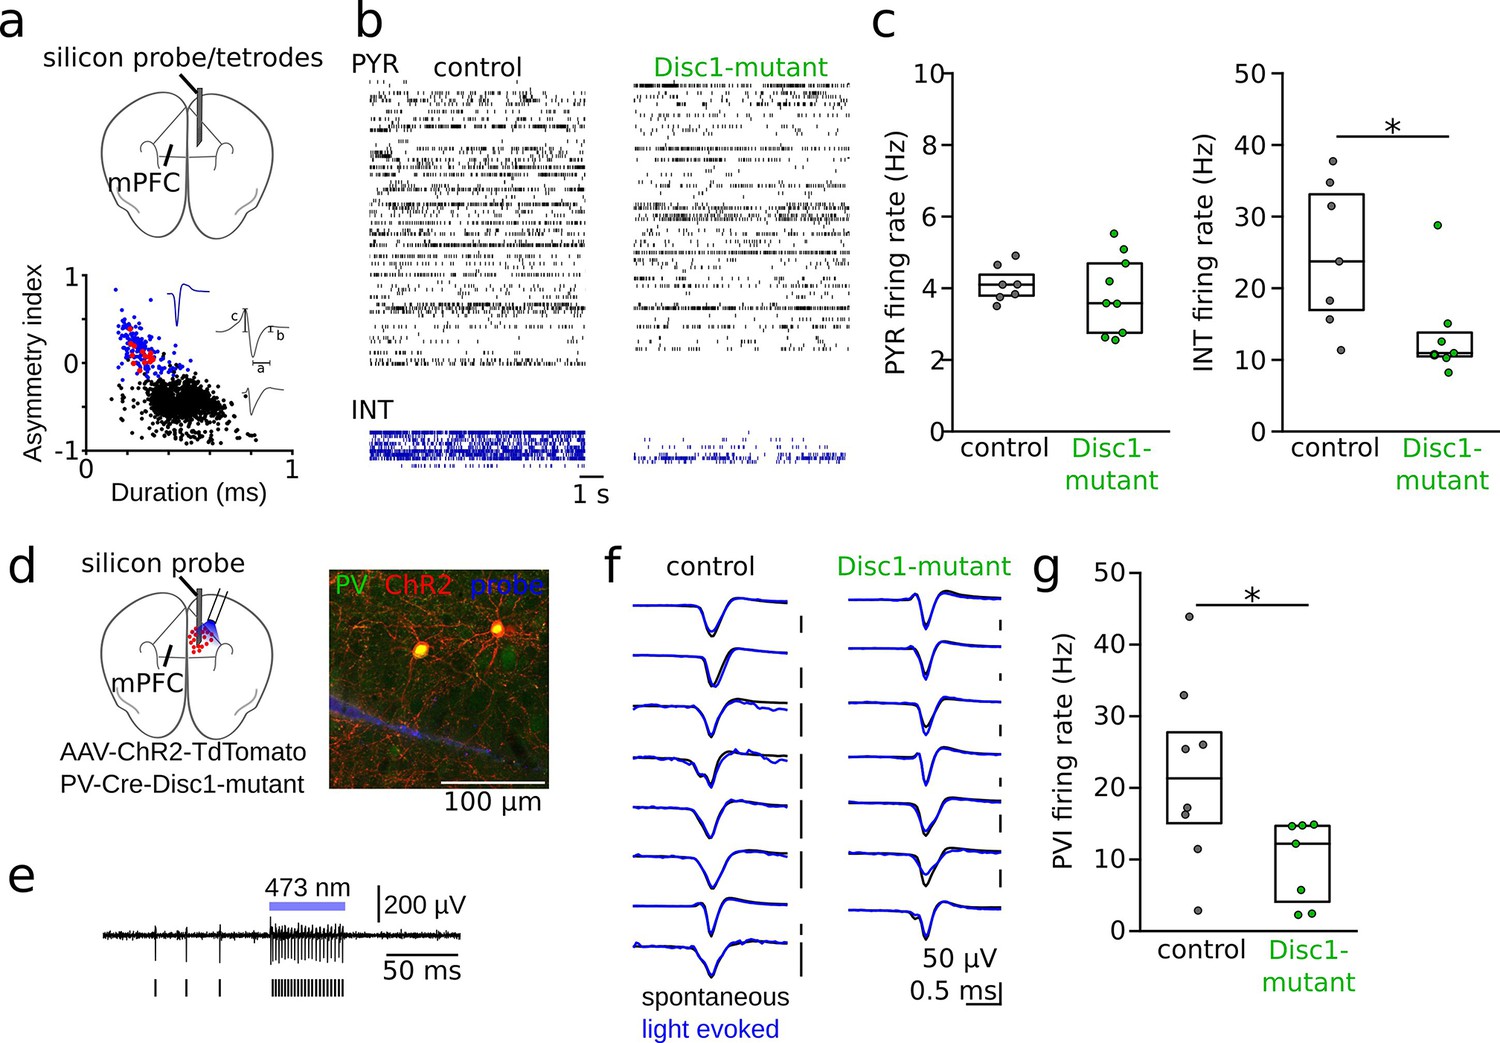
Reduced interneuron (INT) activity in the medial prefrontal cortex (mPFC) of Disc1-mutant mice.
(a) Schematic of the recording configuration. Silicon probes or tetrode microdrives were targeted to the mPFC of freely moving mice. Bottom: identification of pyramidal cells (PYRs, black) and INTs (blue) based on duration (a) and asymmetry index (b – c)/(b + c) of filtered action potential waveforms. Red dots show optogenetically identified parvalbumin-positive interneurons (PVIs, see d–g). Blue and gray insets show an average unfiltered spike of an INT and PYR, respectively. (b) Example raster plots of PYR and INT activity in a freely moving control (black) and Disc1-mutant mouse (green). Each line shows the time series of spikes of a single neuron. (c) Decreased spike rates of INTs (Mann–Whitney U-test) but not PYRs (unpaired t-test) in the Disc1-mutant mPFC. Data points show averages of individual mice. (d) Schematic of the experimental strategy to label PVIs with ChR2. (e) Optogenetic identification of PVIs during blue laser illumination in awake head-fixed mice. Top: 0.3–6 kHz-filtered recording of one channel of the silicon probe (a single channel is shown for clarity). Bars indicate spike times of the unit. (f) Comparable average waveforms of light-triggered and spontaneous spikes of PVIs in both control (left) and Disc1-mutant mice (right). (g) Reduced spontaneous spiking of optogenetically identified PVIs in head-fixed PV-Cre-Disc1-mutant animals (Mann–Whitney U-test). Data points are individual PVIs. Boxes show median and upper/lower quartiles of the data distribution, *p<0.05.
Figure 1—figure supplement 1
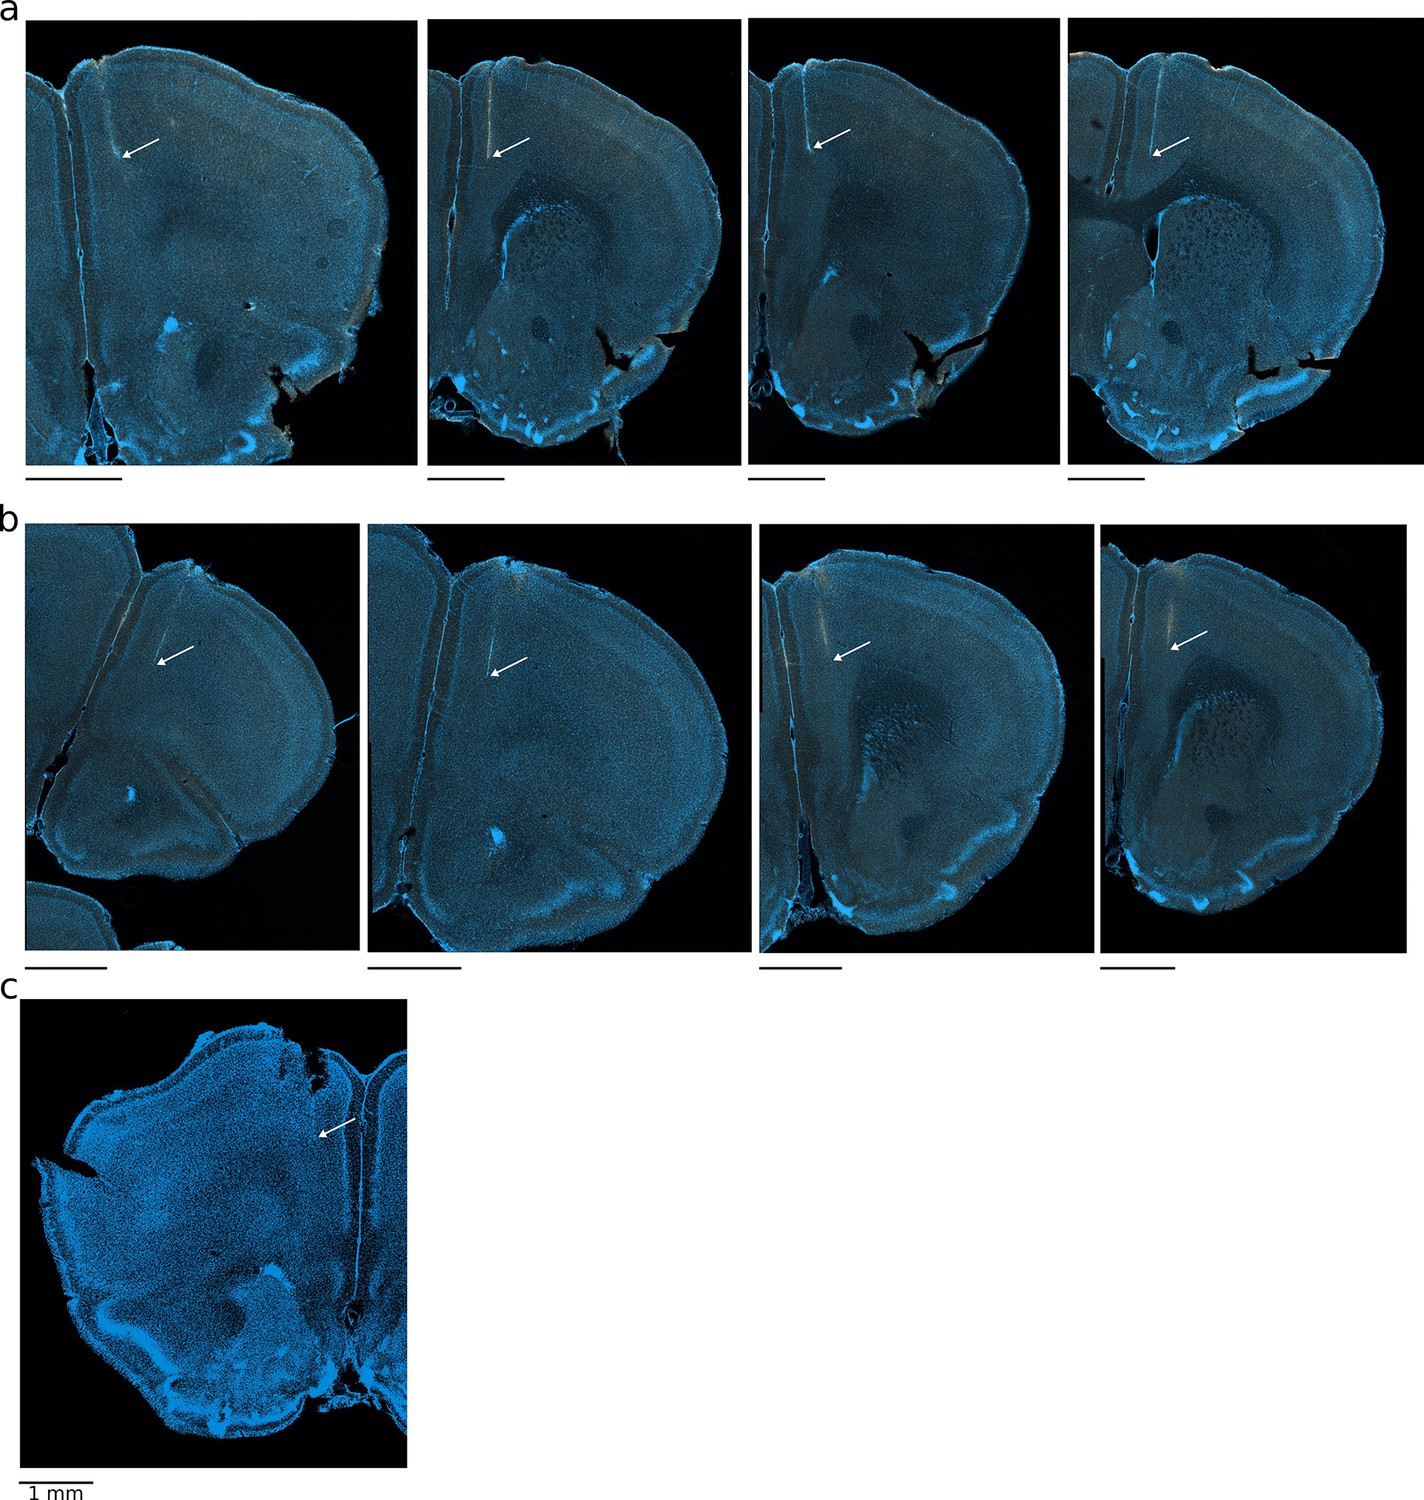
Histological verification of recording sites in the medial prefrontal cortex (mPFC).
Examples of recording sites of four-shank silicon probes (a, b) and tetrode recordings (c). Arrow points to the tip of the shank/tetrode track.
Figure 1—figure supplement 2
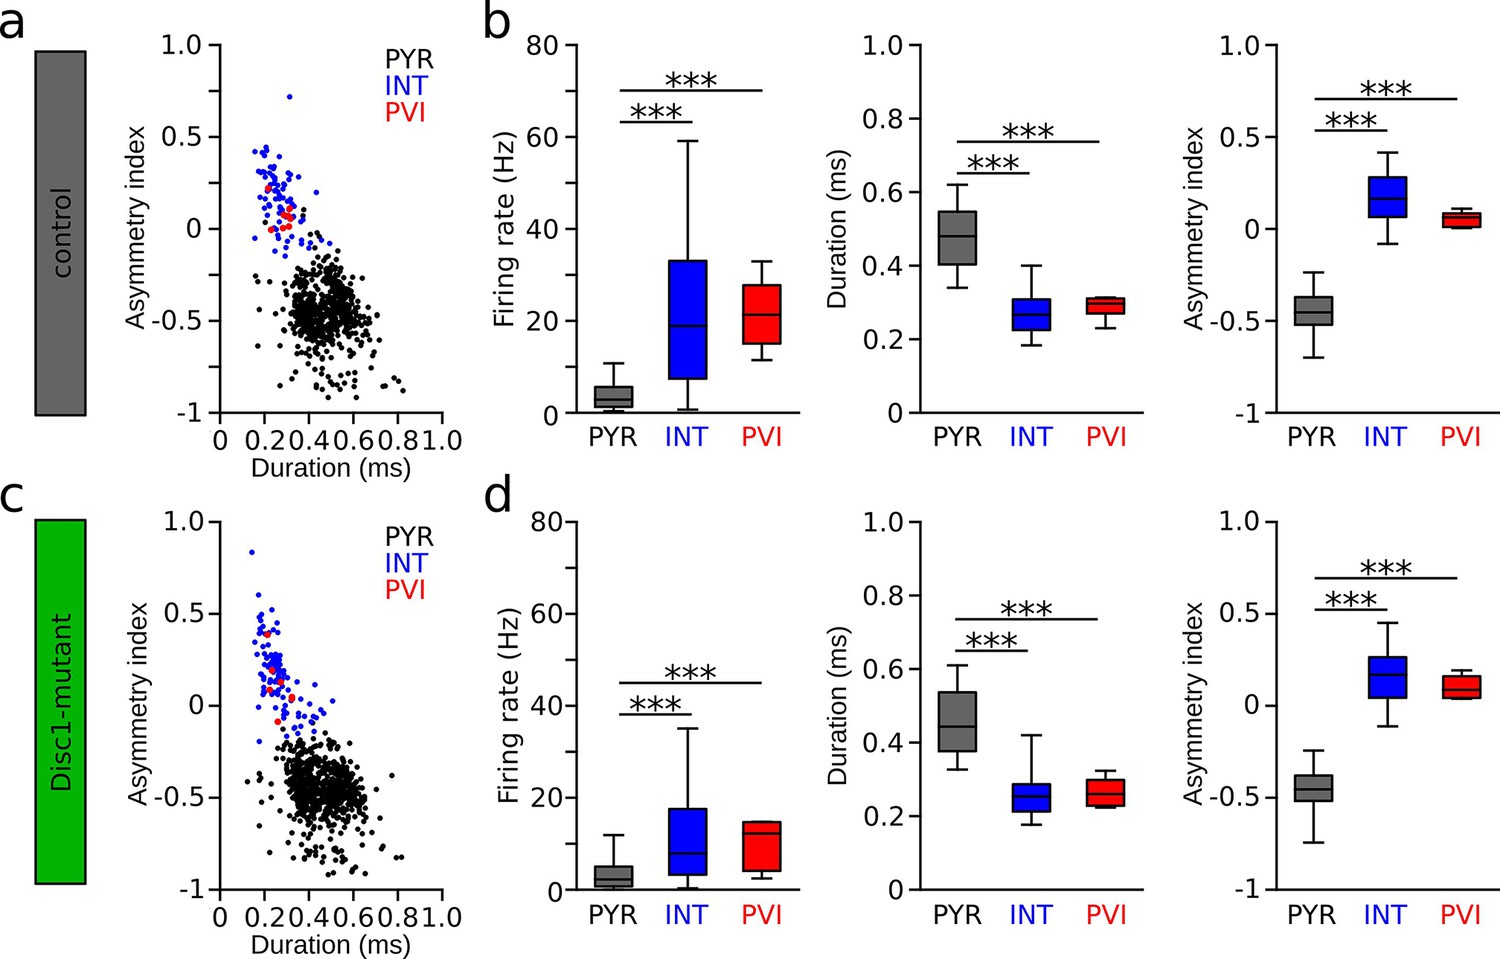
Identification of pyramidal cells (PYR), interneuron (INT), and parvalbumin-positive interneurons (PVIs) in Disc1-mutant and control mice.
(a, c) Spike waveform plot of PYR (black), INTs (blue), and PVIs (red) in control (a) and Disc1-mutant mice (c). (b, d) Irrespective of genotype, firing rates of pyramidal cells (control: n = 613, Disc1-mutant: n = 720) were significantly lower than those of INT (control: t = −21.949, p=0, n = 79, Disc1-mutant: t = −13.909, p=0, n = 104) or PVIs (control: t = −7.182, p=0, n = 8, Disc1-mutant: t = −2.777, p=0.015, n = 7). In contrast, firing rates of INT and PVIs did not differ from each other (control: t = 0.184, p=0.982, Disc1-mutant: t = 1.036, p=0.554, one-way ANOVAs followed by Tukey tests). Similarly, we found significantly longer waveform duration and lower asymmetry indices in PYRs compared to INTs (duration: control: t = 18.107, p=0, Disc1-mutant: t = 18.973, p=0; asymmetry: control: t = −35.492, p=0, Disc1-mutant: t = −42.701, p=0) and PVIs (control: t = 5.780, p=0, Disc1-mutant: t = 5.228, p=0; asymmetry: control: t = −10.070, p=0, Disc1-mutant: t = −10.809, p=0) while INTs and PVIs did not differ from each other (duration: control: t = −0.29, p=0.955, Disc1-mutant: t = −0.012, p=1; asymmetry: control: t = 1.776, p=0.178, Disc1-mutant: t = 0.959, p=0.603, one-way ANOVAs followed by Tukey tests). Boxes show median and upper/lower quartiles of the data distribution, ***p<0.001.
Figure 1—figure supplement 3
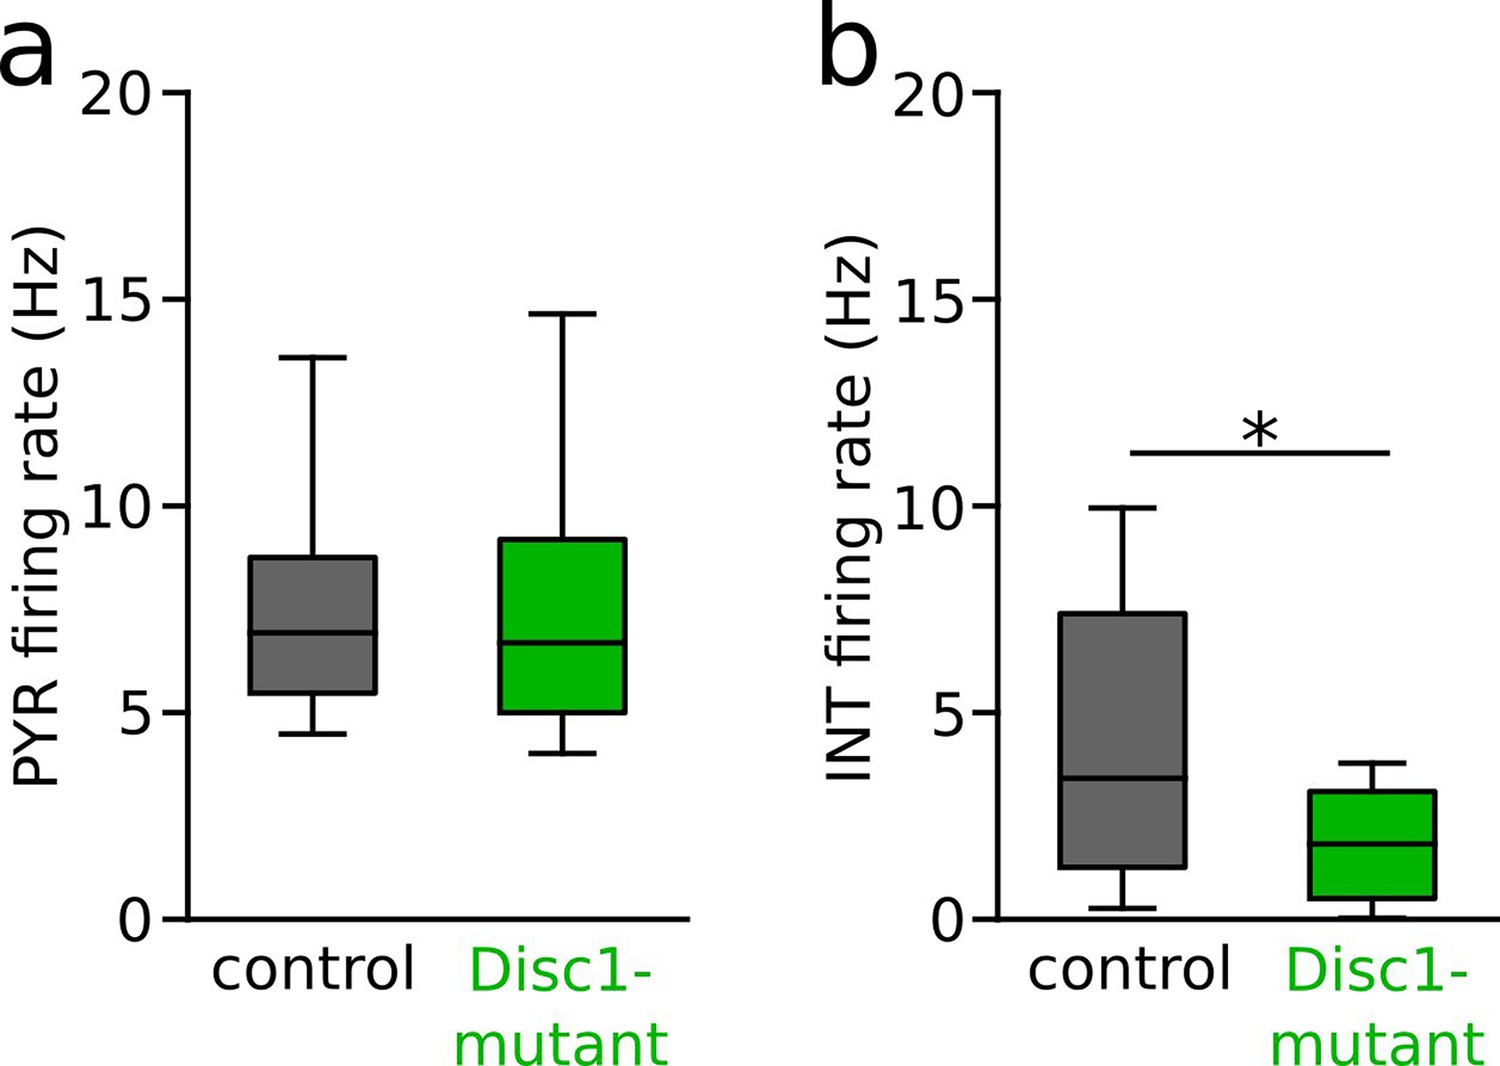
Preserved interneuron (INT) but not pyramidal cell (PYR) rate differences in data subsampled by firing rate.
(a) Comparison of PYR firing rates considering only units of the largest 33% of the firing rate distribution. Note that similar to the full dataset rates of this subsampled population do not differ between control and Disc1-mutant mice (t = 0.052, p=0.955, n = 209 control and 245 Disc1-mutant PYRs, Welch’s test). (b) Comparison of INT firing rates considering only units of the lowest 33% of the firing rate distribution. Note that similar to the full dataset reduced rates of cell of Disc1-mutant mice persist in this subsampled population (U = 609, p=0.013, n = 26 control and 34 Disc1-mutant PYRs, Mann–Whitney U-test). Boxes show median and upper/lower quartiles of the data distribution, *p<0.05.
Figure 1—figure supplement 4

Specific expression of ChR2 in parvalbumin-positive interneurons (PVIs) and comparable running speeds during head fixation.
(a) Immunostaining against PV in a ChR2-infected mouse was used to determine colocalization of PVI and ChR2. (b) Quantification of colocalization from confocal images revealed high specificity of the viral approach (top) with the majority of ChR2-positive cells coexpressing PVI. On average, ~30% of PVIs were labeled by ChR2 with our approach (bottom). Circles are averages of individual Disc1-mutant (green) and control mice (black). (c) Quantification of average running speed during head fixation of mice exposed to a circular maze (‘Methods’) revealed no difference between Disc1-mutant (green) and control mice (black). U = 4.0, p=0.298, n = 3 mice each, Mann–Whitney U-test. Symbols represent individual mice.
Figure 1—figure supplement 5
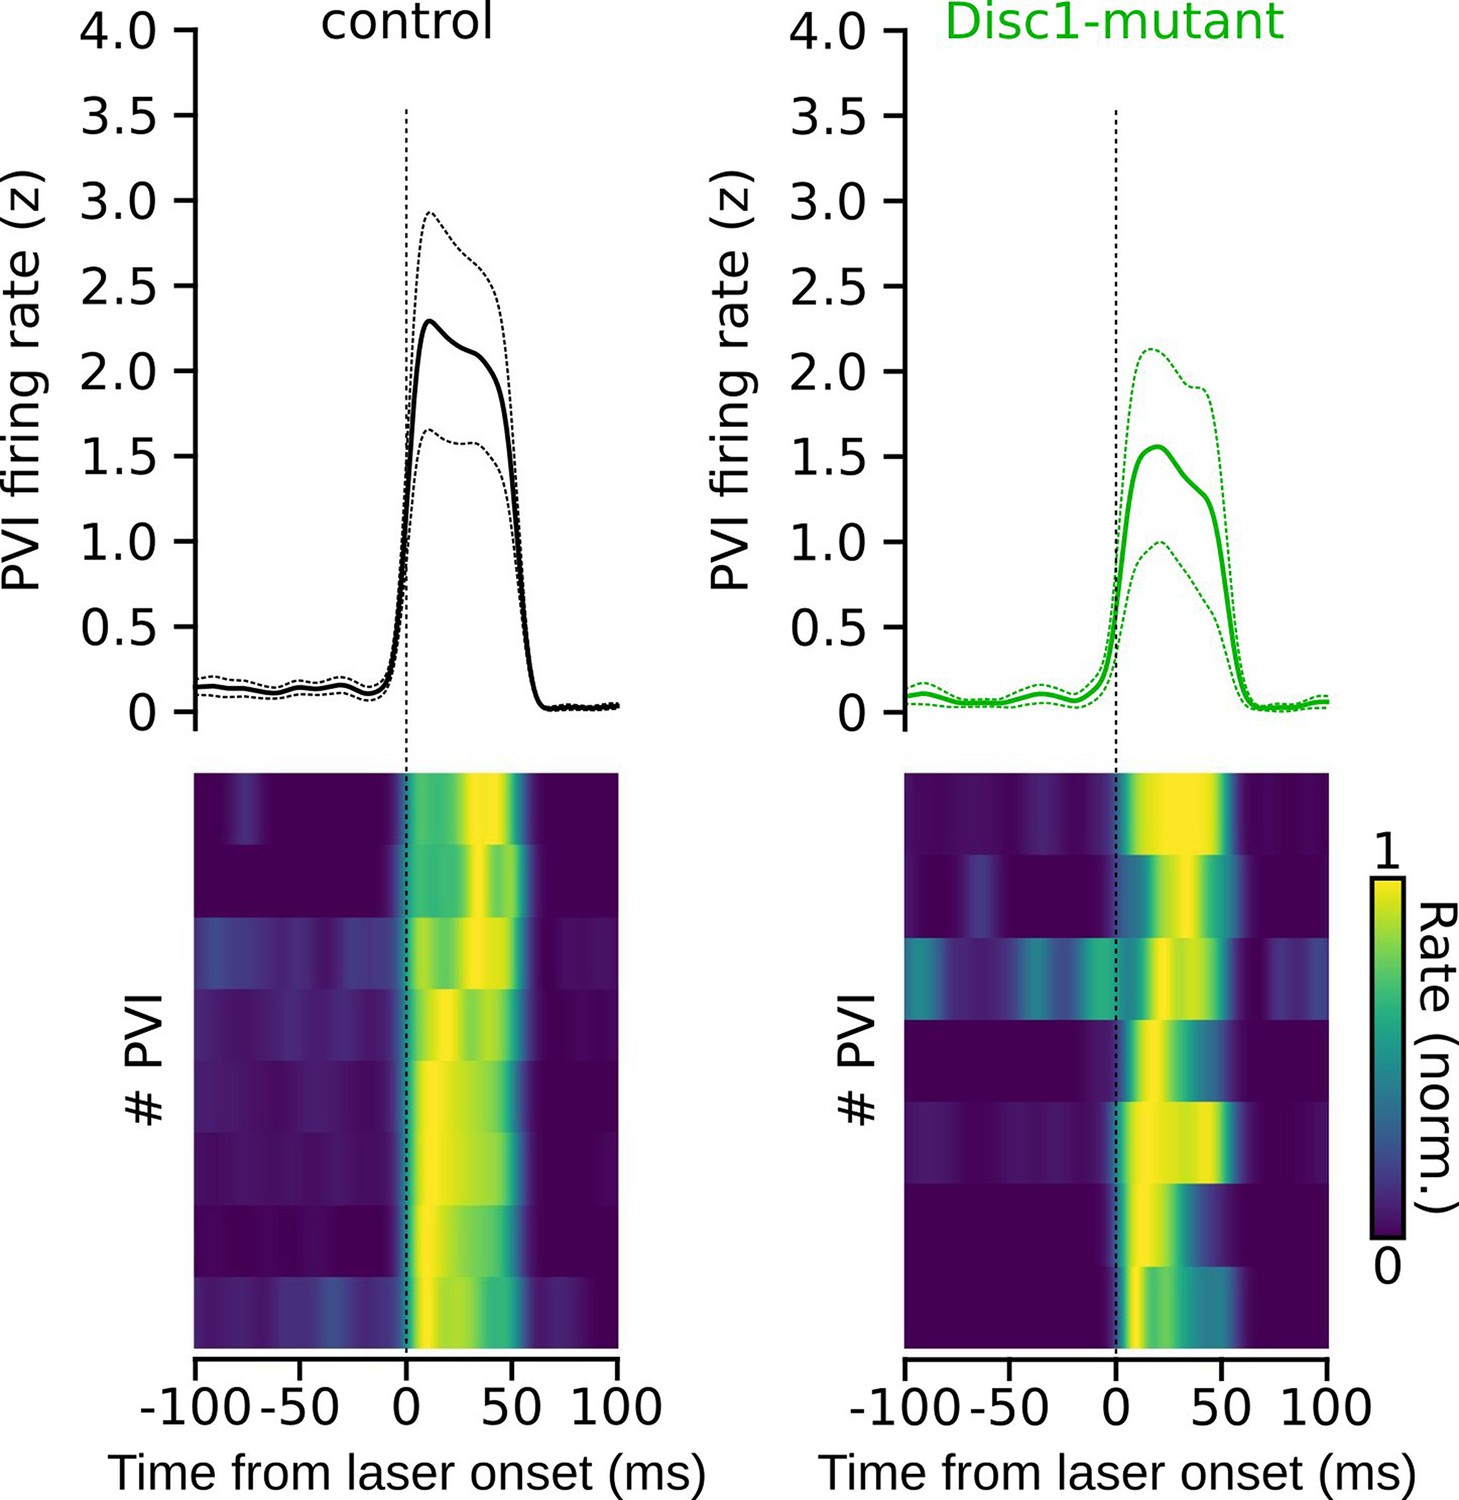
Kinetics of firing rate increase of parvalbumin-positive interneurons (PVIs) upon laser onset.
Average firing rate increase (top, dotted lines: sem) and normalized responses of individual PVIs aligned with laser onset (bottom). Note the rapid increase in firing rate upon light application.
Figure 1—figure supplement 6

Reduced firing rate of optogenetically identified parvalbumin-positive interneurons (PVIs) during UP-states under ketamine anesthesia.
(a) Schematic of the recording strategy. The medial prefrontal cortex (mPFC) of PV-Cre-Disc1-mutant-mice was stereotaxically injected with AAV-flex-ChR2-tdT. A silicon probe was acutely inserted into the mPFC of ketamine-anesthetized mice. (b) Example co-labeling of PV antibody staining (green) and tdT-expression in the mPFC. (c) Quantification of tdT-ChR2 coexpression revealed that ChR2 expression was highly specific for PVIs. Each dot represents one control (black) or Disc1-animal (green). N = 64 ChR2-positive and n = 349 PV-positive cells were used for coexpression analysis. (d) Spike trains of simultaneously recorded neurons from one mouse under ketamine anesthesia. Firing is characterized by dense activity during neocortical UP-states intermingled with periods of relative silence. Blue laser light was applied through an optical fiber to excite ChR2-positive PVIs for optogenetic identification (blue bar). (e) Average UP-state firing rate of optogenetically identified PVIs (control: n = 11, Disc1: n = 8, two mice each, p=2.419, p=0.027, unpaired t-test). *p<0.05.
Figure 2
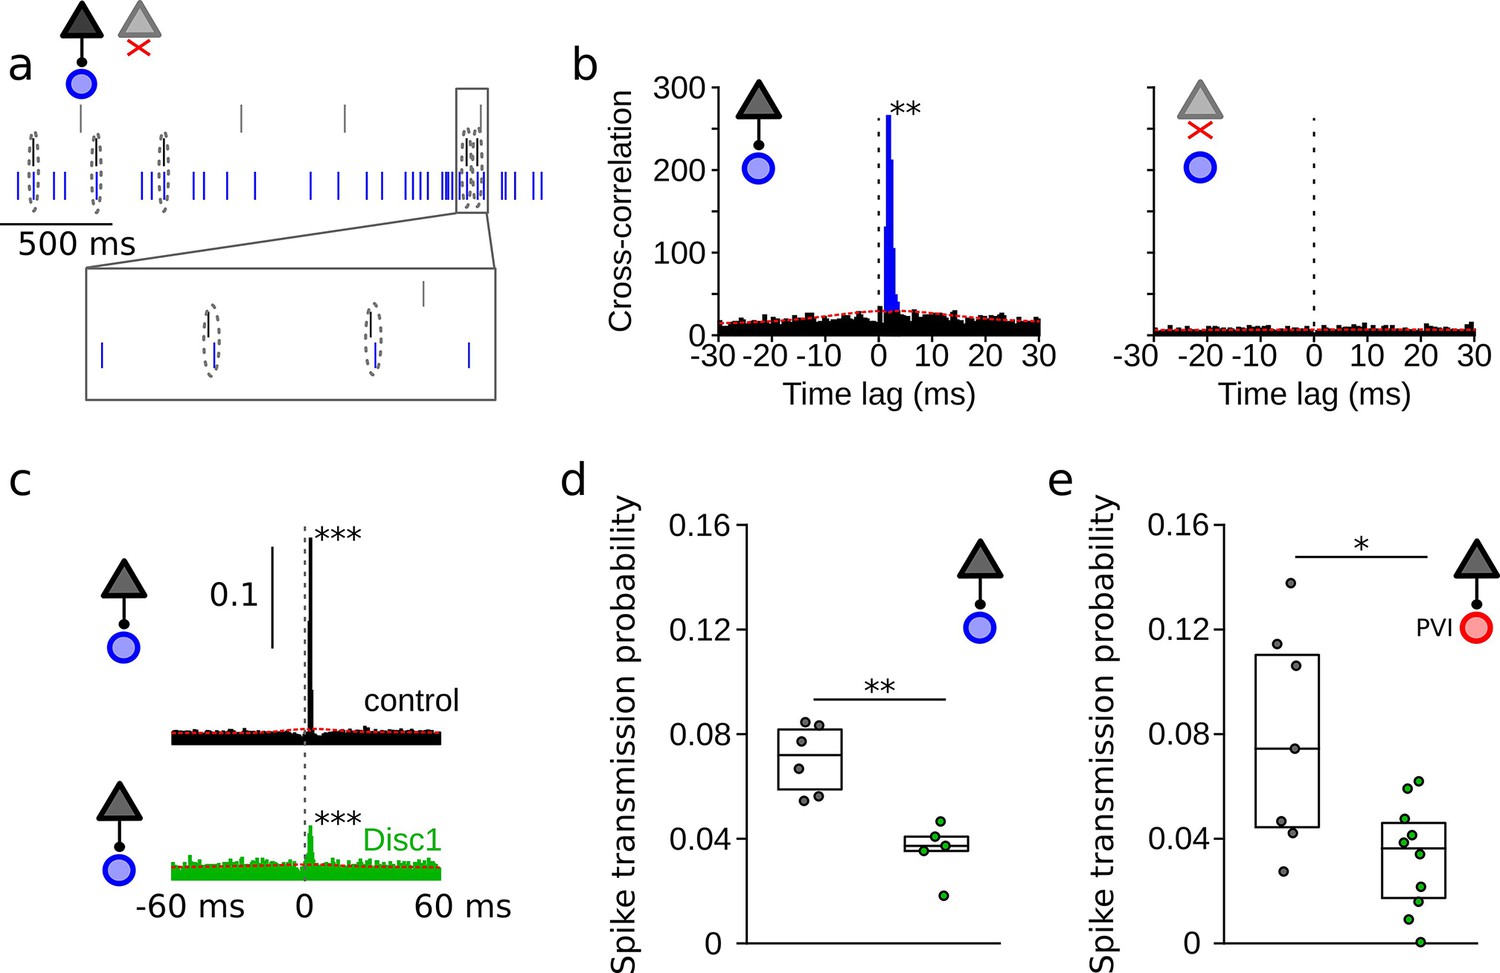
Reduced spike transmission at pyramidal cell–interneuron (PYR-INT) connections in the Disc1-mutant medial prefrontal cortex (mPFC).
(a) Short segment of spike trains of a PYR with (black) and without (gray) monosynaptic excitatory connection onto a GABAergic fast-spiking INT (blue). Note that spiking in the black PYR consistently occurs briefly before an action potential in the INT. (b) Cross-correlograms of the units shown in (a) reveal a sharp peak at 1–2 ms latency for the connected pair (left) but not for a non-connected pair of cells (right). Blue region shows short-latency spikes significantly exceeding the slowly co-modulated baseline (red dotted line, see ‘Methods’). (c) Example spike transmission probability histograms for a connected PYR-INT pair in control (black) and Disc1-mutant mPFC (green). A significant synaptic connection was detected in both cases (p<0.001). (d) Summary of spike transmission probabilities of all PYR-INT pairs in freely moving mice (unpaired ttest). Circles show mouse averages (e) Summary of spike transmission probabilities of identified PYR-PVI connections in head-fixed mice (Welch’s test). Circles represent individual connections. Boxes show median and upper/lower quartiles of the data distribution, *p<0.05, **p<0.01.
Figure 3 with 1 supplement
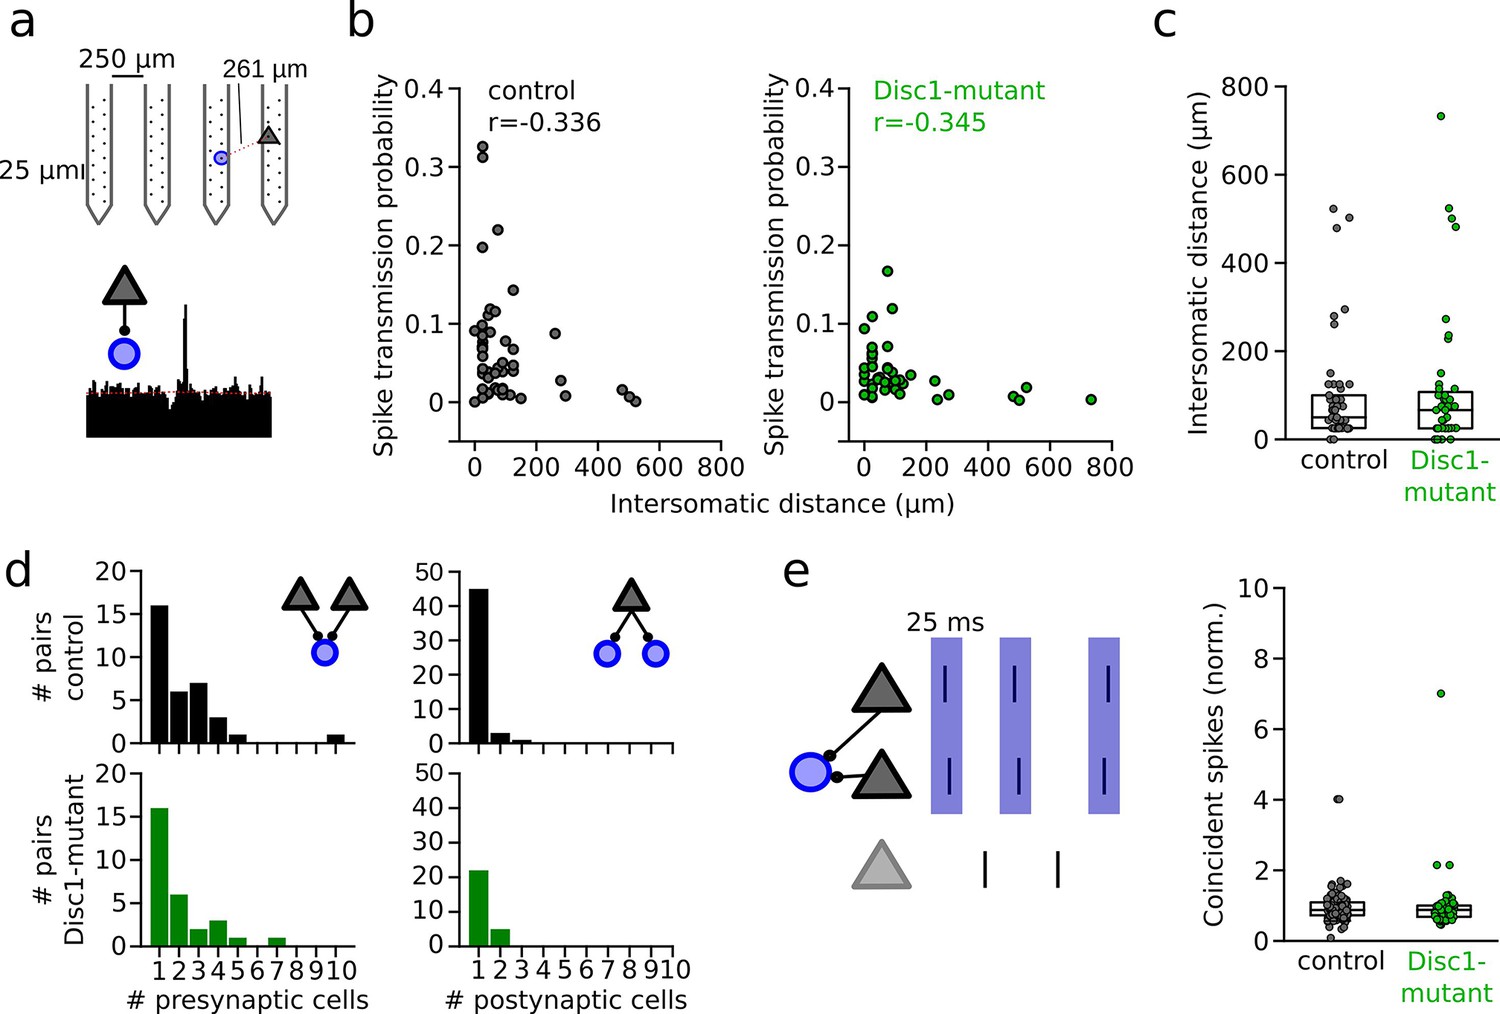
Unaltered network structure and presynaptic cooperativity of pyramidal cell–interneuron (PYR-INT) connections.
(a) Example of distance calculation and corresponding cross-correlogram for a connected pair. (b) Summary of spike transmission probability as a function of intersomatic distance. Spike transmission inversely depends on intersomatic distance in both control (black) and Disc1-mutant pairs (green) (Spearman’s correlation coefficients). Circles are individual PYR-INT pairs. (c) Summary of intersomatic distances of all PYR-INT pairs (Welch’s test). (d) Quantification of the number of presynaptic (left) and postsynaptic partners (right) revealed comparable convergence and divergence, respectively (Mann–Whitney U-tests). (e) Left: schematic of synchronization of PYRs impinging on a shared postsynaptic INT. Right: summary of coincident spiking between convergent PYRs within 25 ms (Welch’s test). Circles in (b–e) represent individual cells/cell pairs. Boxes show median and upper/lower quartiles of the data distribution.
Figure 3—figure supplement 1
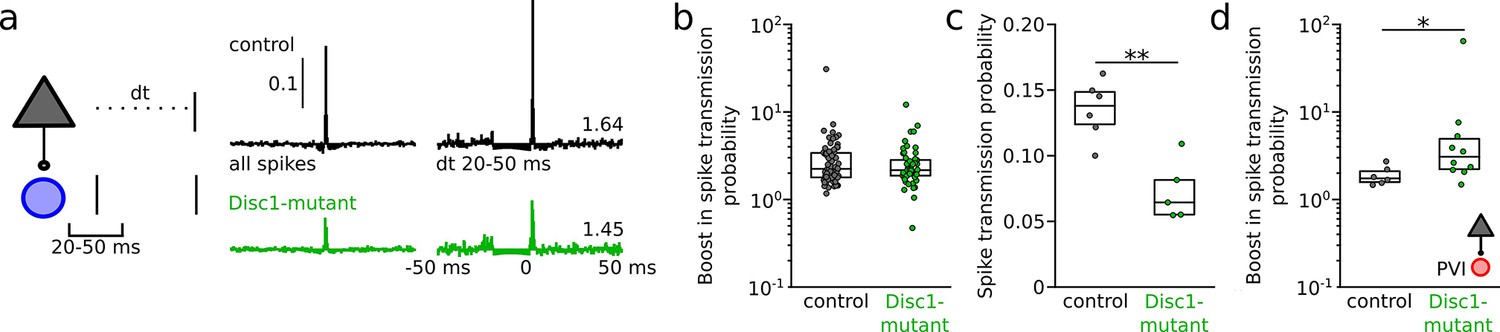
Increased resonance boosting at pyramidal cell (PYR)-fast-spiking interneuron (INT) connections in Disc1-mutant mice.
(a) Left: schematic illustrating the quantification of spike transmission probability in vivo during a defined interspike interval. Right: examples of transmission gain for spikes at a resonance time window of 20–50 ms. Values indicate fold gain in the resonance time window. (b) Summary of the boost in spike transmission probability for PYR-INT pairs (Welch’s test). (c) Summary of spike transmission probability in the resonance time window (unpaired t-test). (d) Summary of resonance boosting at PYR-PVI connections recorded in awake head-fixed mice (U(15) = 11, p=0.022, Mann–Whitney U-test). Symbols are mouse averages (c) or individual connections (b, d). Boxes show median and upper/lower quartiles of the data distribution, *p<0.05, **p<0.01.
Figure 4 with 2 supplements
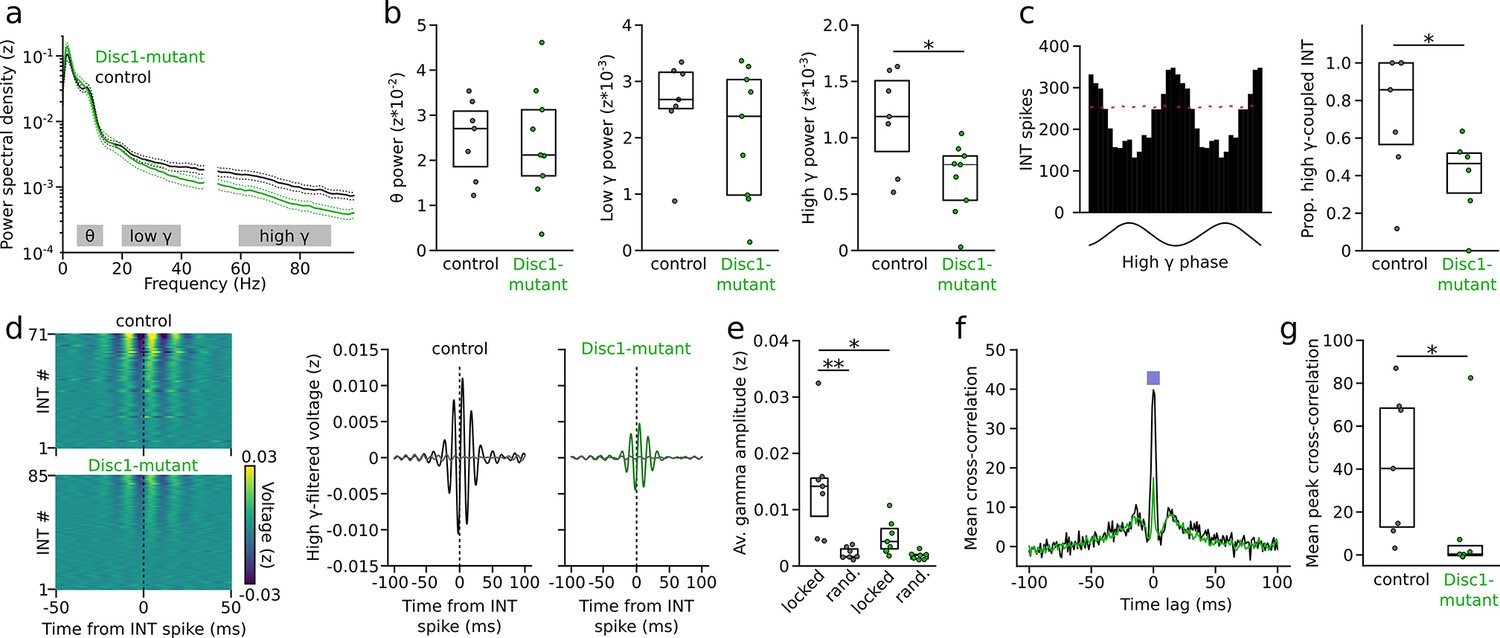
Impaired gamma oscillations and gamma phase-coupling of interneurons (INTs) in Disc1-mutant mice.
(a) Average power spectral density of z-scored prefrontal local field potentials (LFPs) in control (black) and Disc1-mutant mice (green). Power at 50 Hz is omitted. Gray areas: Theta (6–12 Hz), low-gamma (20–40 Hz), and high-gamma bands (60–90 Hz) chosen for quantification of spectral power. (b) Average power in the theta, low-gamma, and high-gamma band. Circles are averages of individual mice (unpaired t-tests). (c) Left: example histogram showing the spike number of an INT as a function of high-gamma phase (shown on the bottom). Red line indicates the 95th percentile of the random distribution obtained by shuffling the interspike intervals (500 iterations). Crossing of the 95th percentile was used to determine significant phase-coupling. Right: reduced proportion of INTs with significant phase-coupling to high gamma in Disc1-mutant mice (unpaired t-test). (d) Left: average high-gamma-filtered LFP triggered by INT spiking (analyzed for all INTs with >1000 spikes). The data are sorted by the magnitude of the LFP deflection at the INT spike time. Right: grand averages of high-gamma oscillations aligned with INT spiking (solid lines) or at random time points (dashed lines). (e) Reduced INT spiking-triggered high-gamma amplitude in Disc1-mutant mice. Gamma amplitude triggered by INT spiking (locked) exceeded amplitude at random time points (rand.) in control but not Disc1-mutant mice (one-way ANOVA followed by Tukey tests). (f) Cross-correlation of the spike trains of simultaneously recorded INTs. The graph shows the grand average over all INTs (n = 432 and 215 pairs in Disc1-mutant and control mice, respectively). The inset illustrates the time window for the quantification of INT synchronization. (g) Reduced INT synchronization in a 10 ms time window in Disc1-mutant mice (Mann–Whitney U-test). Circles in (b, c, e, g) show averages of individual mice. Boxes show median and upper/lower quartiles of the data distribution, *p<0.05, **p<0.01.
Figure 4—figure supplement 1
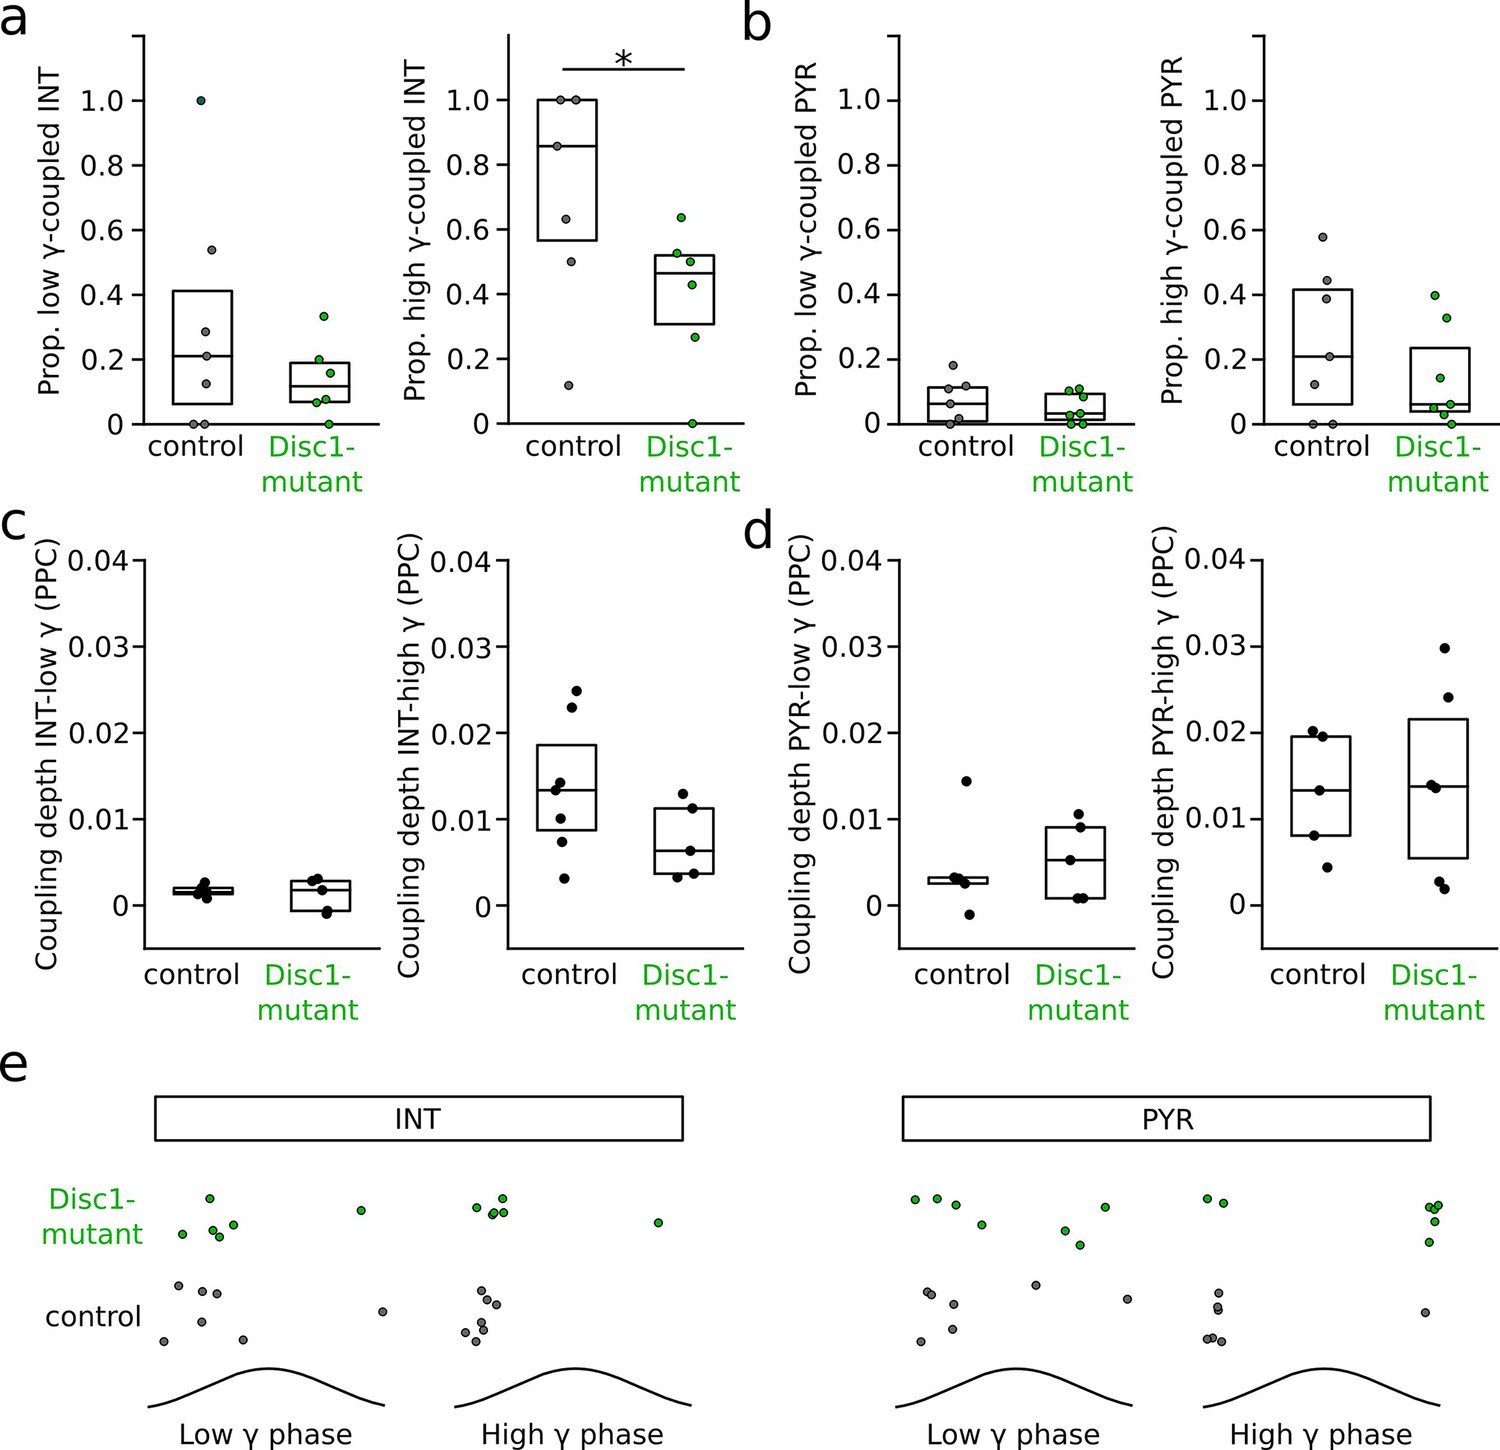
Phase-coupling of pyramidal cells (PYRs) and interneurons (INTs) to gamma oscillations.
(a) Selective reduction in the proportion of INTs significantly phase-coupled to high- but not low-frequency gamma oscillations (unpaired t-tests). Data for high-gamma oscillations are replotted from Figure 4c. (b) Unchanged proportion of significantly phase-coupled PYRs to both low- and high-frequency gamma. (c) Phase-coupling analysis of INTs to low- and high-frequency gamma oscillations revealed comparable coupling depth, quantified as pairwise phase consistency (PPC; low gamma: t = 0.897, p=0.393, n = 5 mice each; high gamma: t = 1.577, p=0.146, n = 7 control and 5 Disc1-mutant mice, unpaired t-tests). (d) Same as (c) but for PYRs (low gamma: t = −2.262, p=0.8, n = 5 mice each; high gamma: t = −0.214, p=0.835, n = 5 control and 6 Disc1-mutant mice, unpaired t-tests). (e) PYRs and INTs of control and Disc1-mutant mice discharged at similar preferred phase angles during low- (PYR: p=0.567, n = 5 mice each, INT: p=0.588, n = 7 control and 6 Disc1-mutant mice, angle permutation tests) and high-frequency gamma oscillations (PYR: p=0.112, n = 5 control and 6 Disc1-mutant mice, INT: p=0.684, n = 7 control and 5 Disc1-mutant mice, angle permutation tests). Circles show averages of individual mice. Boxes show median and upper/lower quartiles of the data distribution, *p<0.05.
Figure 4—figure supplement 2
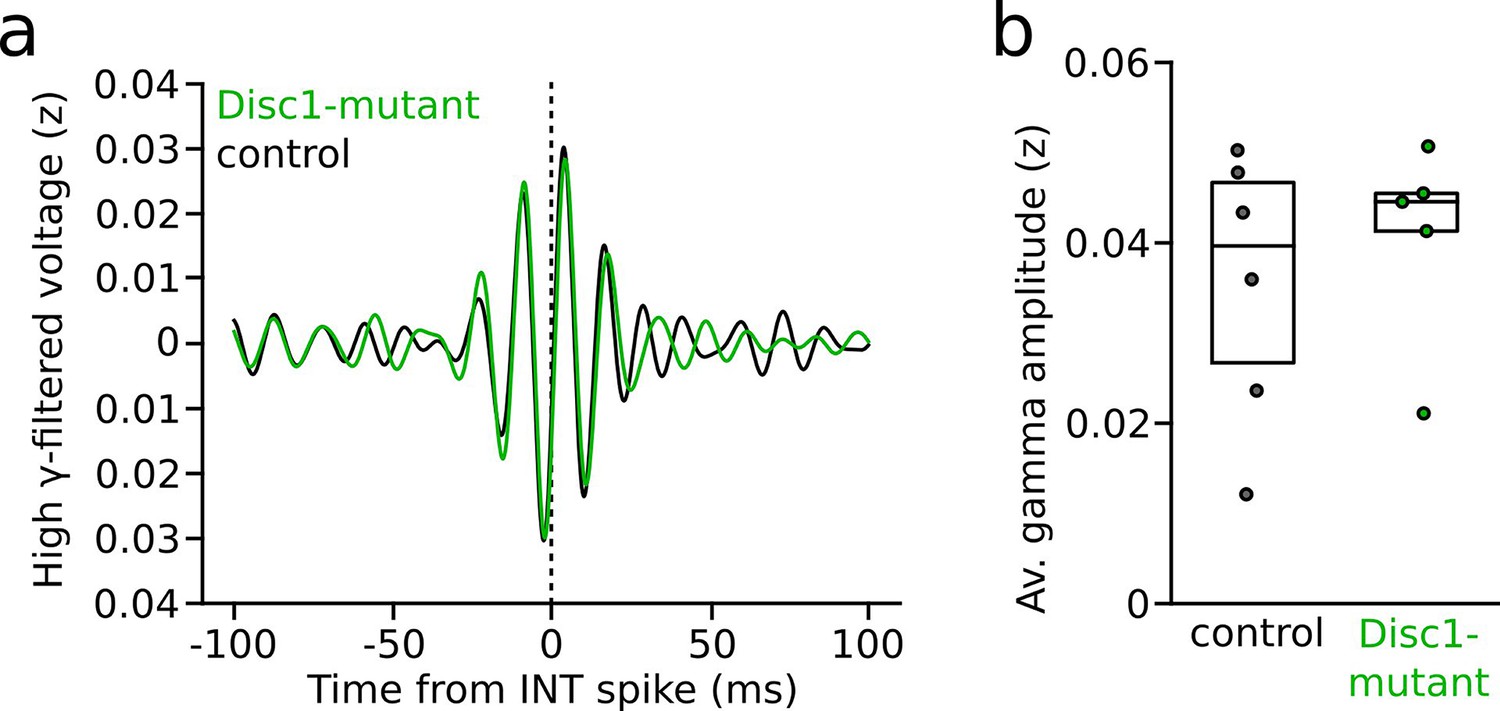
Spike-triggered local field potential (LFP) gamma oscillations during interneuron (INT) spiking following presynaptic pyramidal cell (PYR) activity.
(a) Grand average of high gamma-filtered LFP triggered by INT spikes (time point 0). Only INT spikes that followed presynaptic spiking within 2 ms in identified synaptically connected PYR-INT pairs were considered (n = 77 control and 58 Disc1-mutant INTs). (b) Average spike-triggered high-gamma amplitude (t = 0.625, p=0.547, n = 6 control and 5 Disc1-mutant mice, unpaired t-test). Circles show averages of individual mice. Boxes show median and upper/lower quartiles of the data distribution.
Figure 5

Enhanced synchronization and assembly activations in the Disc1-mutant medial prefrontal cortex (mPFC).
(a) Left: schematic of synchronization of pyramidal cells (PYRs). Right: summary of coincident spiking within 25 ms (Welch’s test). Solid line: mean, dashed lines: quartiles. (b) Detection of assembly patterns. Coactive patterns were extracted from spike covariance matrices (left) to retrieve assembly weight vectors (right). Data show examples from one control and Disc1-mutant mouse. (c) Neurons with high weight in an assembly pattern show stronger co-firing than neurons with low contribution (Welch’s tests). (d) Assemblies activate on average at the same frequency in both genotypes (unpaired t-test). (e) Assembly activation strength is enhanced in Disc1-mutant mice (Mann–Whitney U-test). Circles in (d) and (e) show averages of individual mice. Boxes show median and upper/lower quartiles of the data distribution, *p<0.05, ***p<0.001.
Additional files
Download links
A two-part list of links to download the article, or parts of the article, in various formats.
Downloads (link to download the article as PDF)
Open citations (links to open the citations from this article in various online reference manager services)
Cite this article (links to download the citations from this article in formats compatible with various reference manager tools)
Disrupted-in-schizophrenia-1 is required for normal pyramidal cell–interneuron communication and assembly dynamics in the prefrontal cortex
eLife 11:e79471.
https://doi.org/10.7554/eLife.79471


