Inhibition is a prevalent mode of activity in the neocortex around awake hippocampal ripples in mice
- Canadian Centre for Behavioral Neuroscience, University of Lethbridge, Canada
- Laboratory for Neuronal Circuit Dynamics, Imperial College London, United Kingdom
- Department of Physics, Hong Kong Baptist University, Hong Kong
- Department of Neurobiology and Behavior, University of California, United States
Figures
Figure 1 with 1 supplement
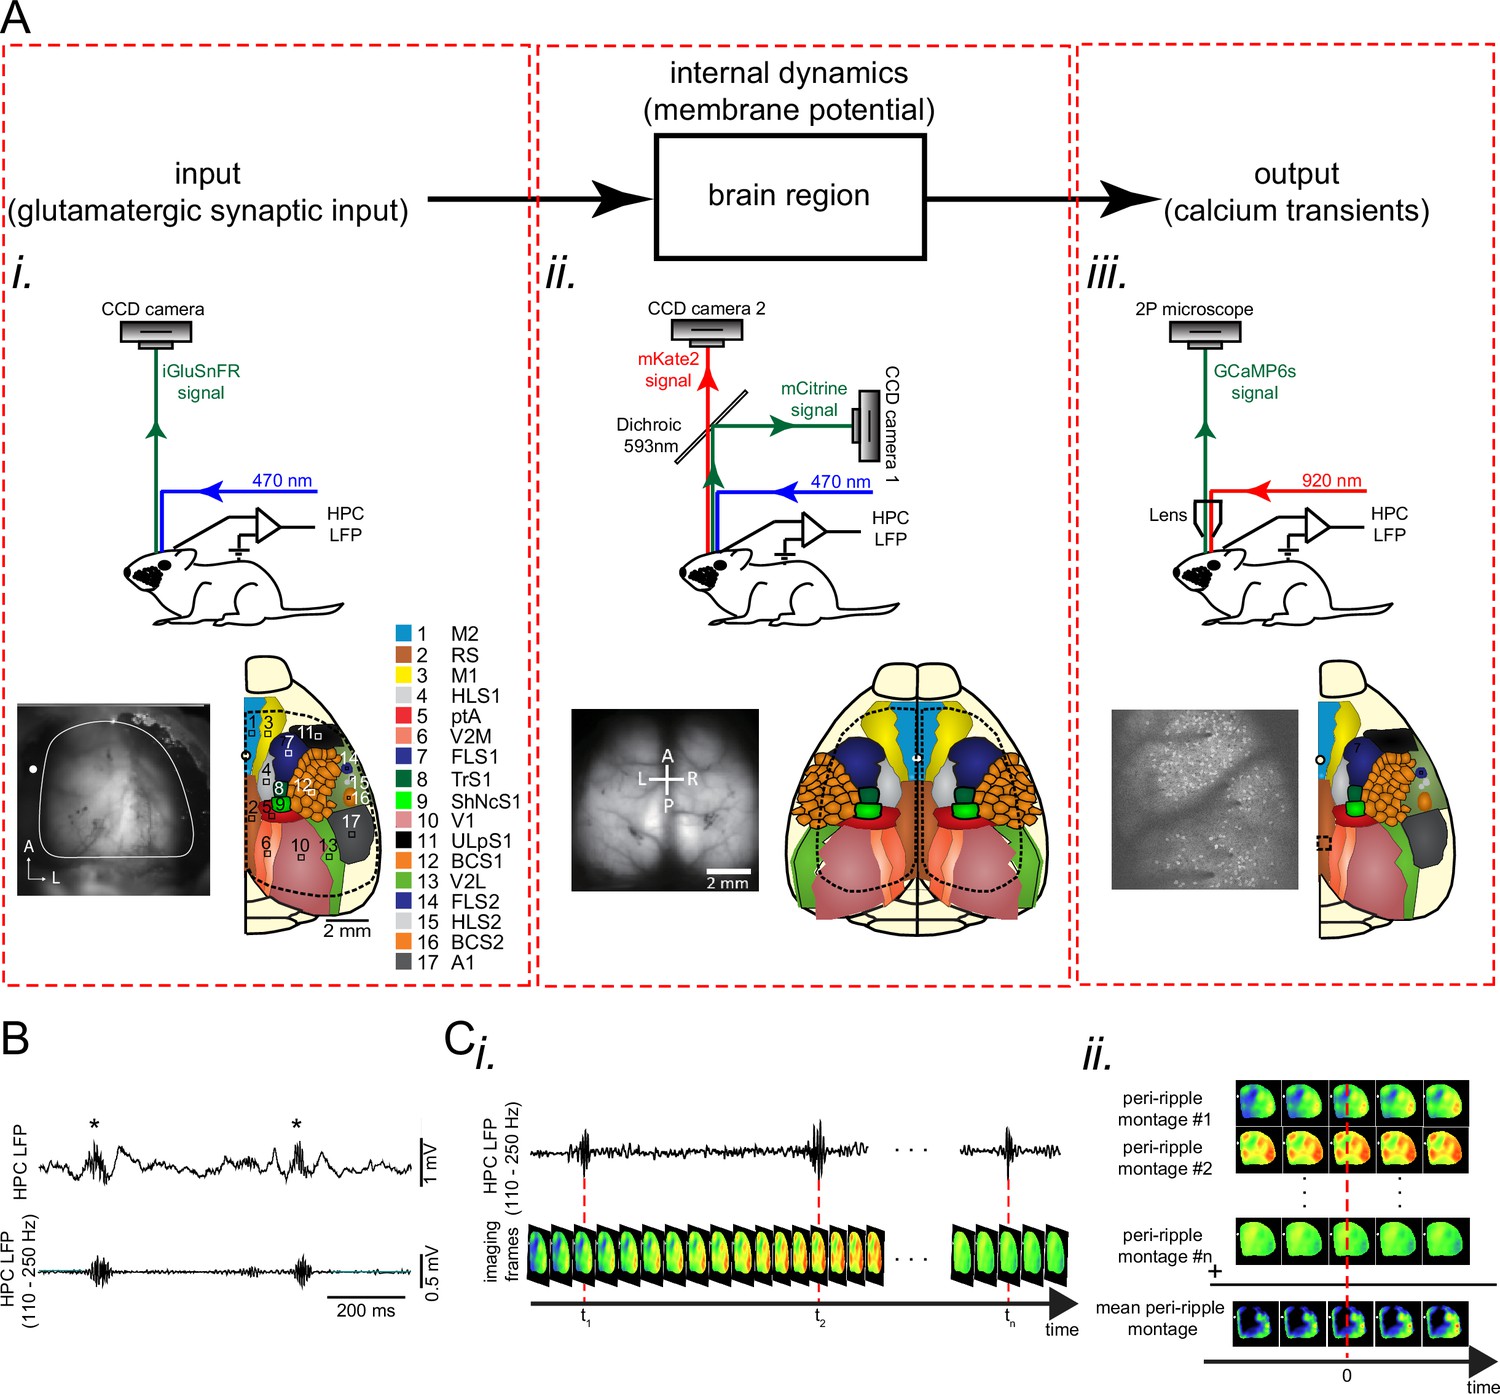
Experimental protocol for investigating peri-ripple neocortical activity during the awake state.
(A) Top: each region could be modeled as an input-output block with internal dynamics. Bottom (i-iii): experimental setups, exemplar imaging windows, and schematic of the regions included in the windows for unilateral wide-field glutamate imaging (i), bilateral wide-field voltage imaging (ii), and two-photon calcium imaging (iii) which were conducted for monitoring input, internal dynamics, and output, respectively. (B) Top: an exemplar local field potential (LFP) trace recorded from the pyramidal layer of the CA1 subfield of the dorsal hippocampus. Asterisks denote detected ripples. Bottom: ripple-band (110–250 Hz) filtered version of the top trace. (C) Schematic of peri-ripple (ripple-triggered) averaging analysis. (i) Schematic of concurrently recorded LFP and imaging signals. Red dashed lines indicate the timestamp of the center of detected ripples. (ii) The imaging frames around the timestamp of the detected ripples are aligned with respect to the ripple centers and averaged. This figure has one figure supplement.
Figure 1—figure supplement 1
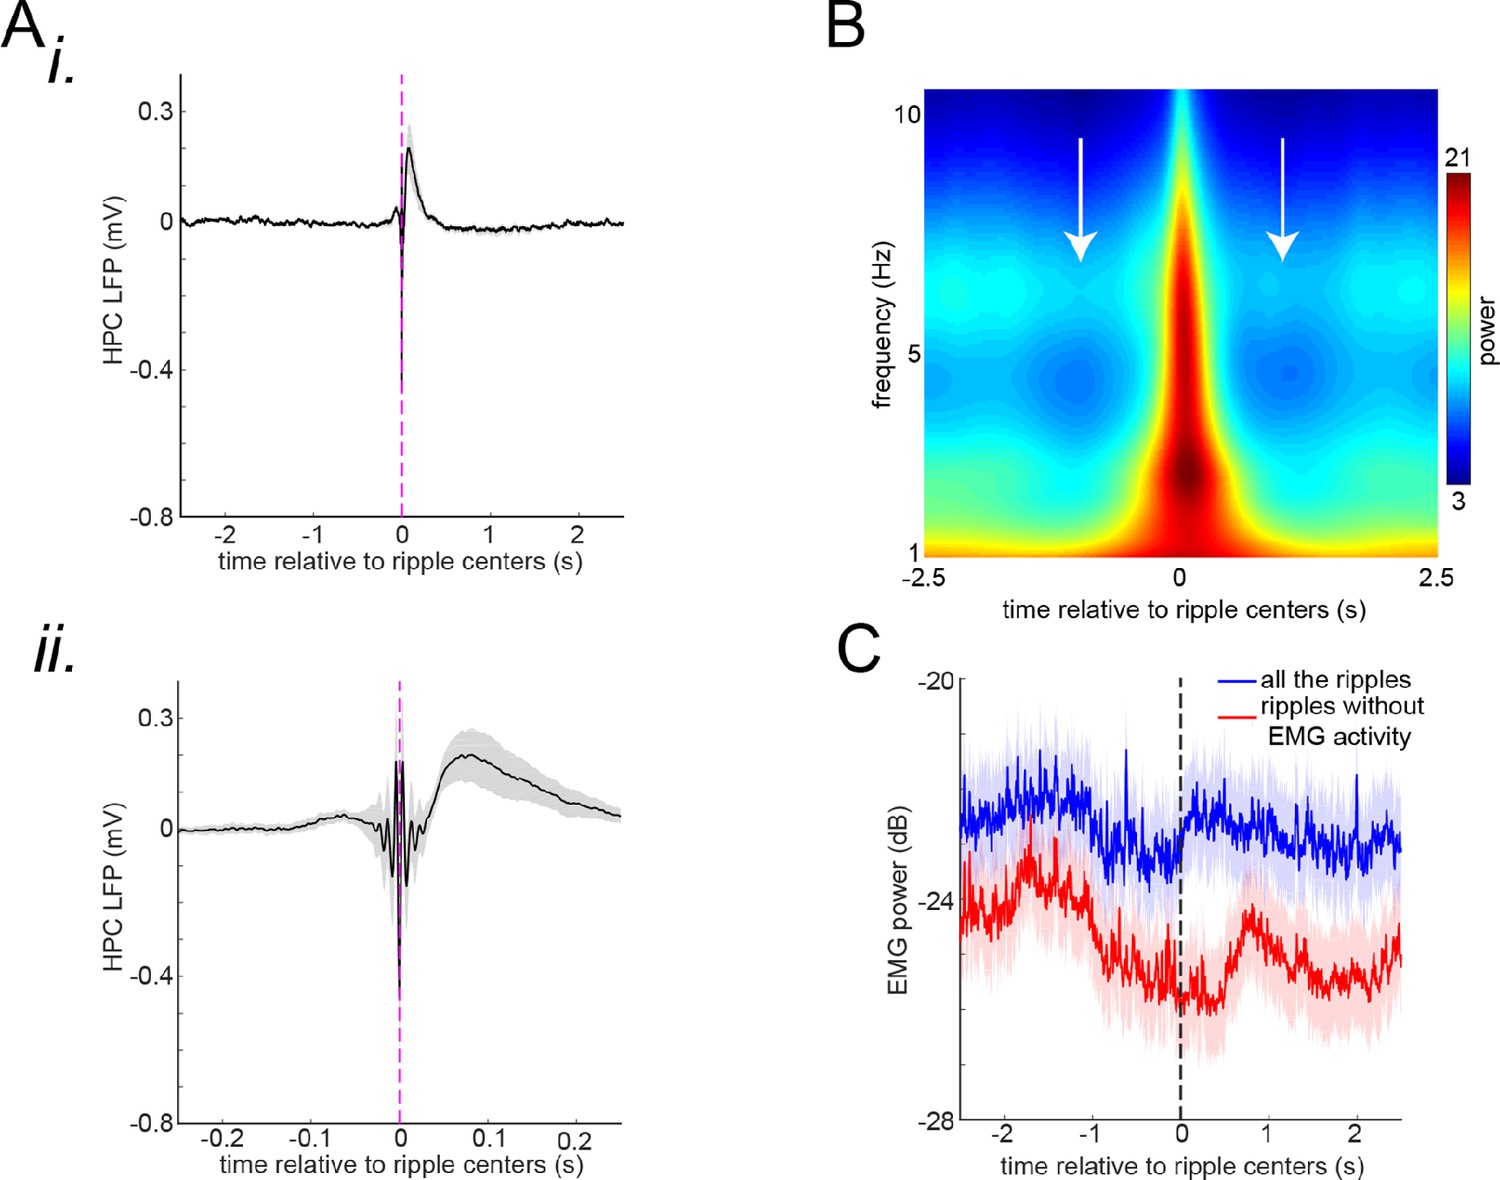
Peri-ripple theta and EMG activity.
(A) (i) The mean peri-ripple hippocampal local field potential (HPC LFP) was first averaged in individual animals and then averaged across 25 animals. (ii) The zoomed-in version of (i). (B) The mean spectrogram of peri-ripple HPC LFP was first averaged in individual animals and then averaged across 25 animals. Note the high power of ~3 Hz close to 0 time corresponding to the post-ripple large deflection apparent in (A). Moreover, note the reduction of theta power (~6 Hz; white arrows) before and after the ripple centers time (0 time). (C) The mean peri-ripple EMG signal was first averaged in individual animals and then averaged across 19 animals. The blue trace is associated with all the detected ripples, and the red trace is associated with all the ripples around which (± 500 ms) no EMG activity was detected. Note that both traces show a significant reduction right before the ripple centers (0 time). Note also that the blue trace shows an elevation right after the ripple centers indicating that the animals start moving right after a proportion of ripples (0.2847±0.1576; mean±std; n=19 animals). The shadings represent the standard error of the mean.
Figure 2 with 7 supplements

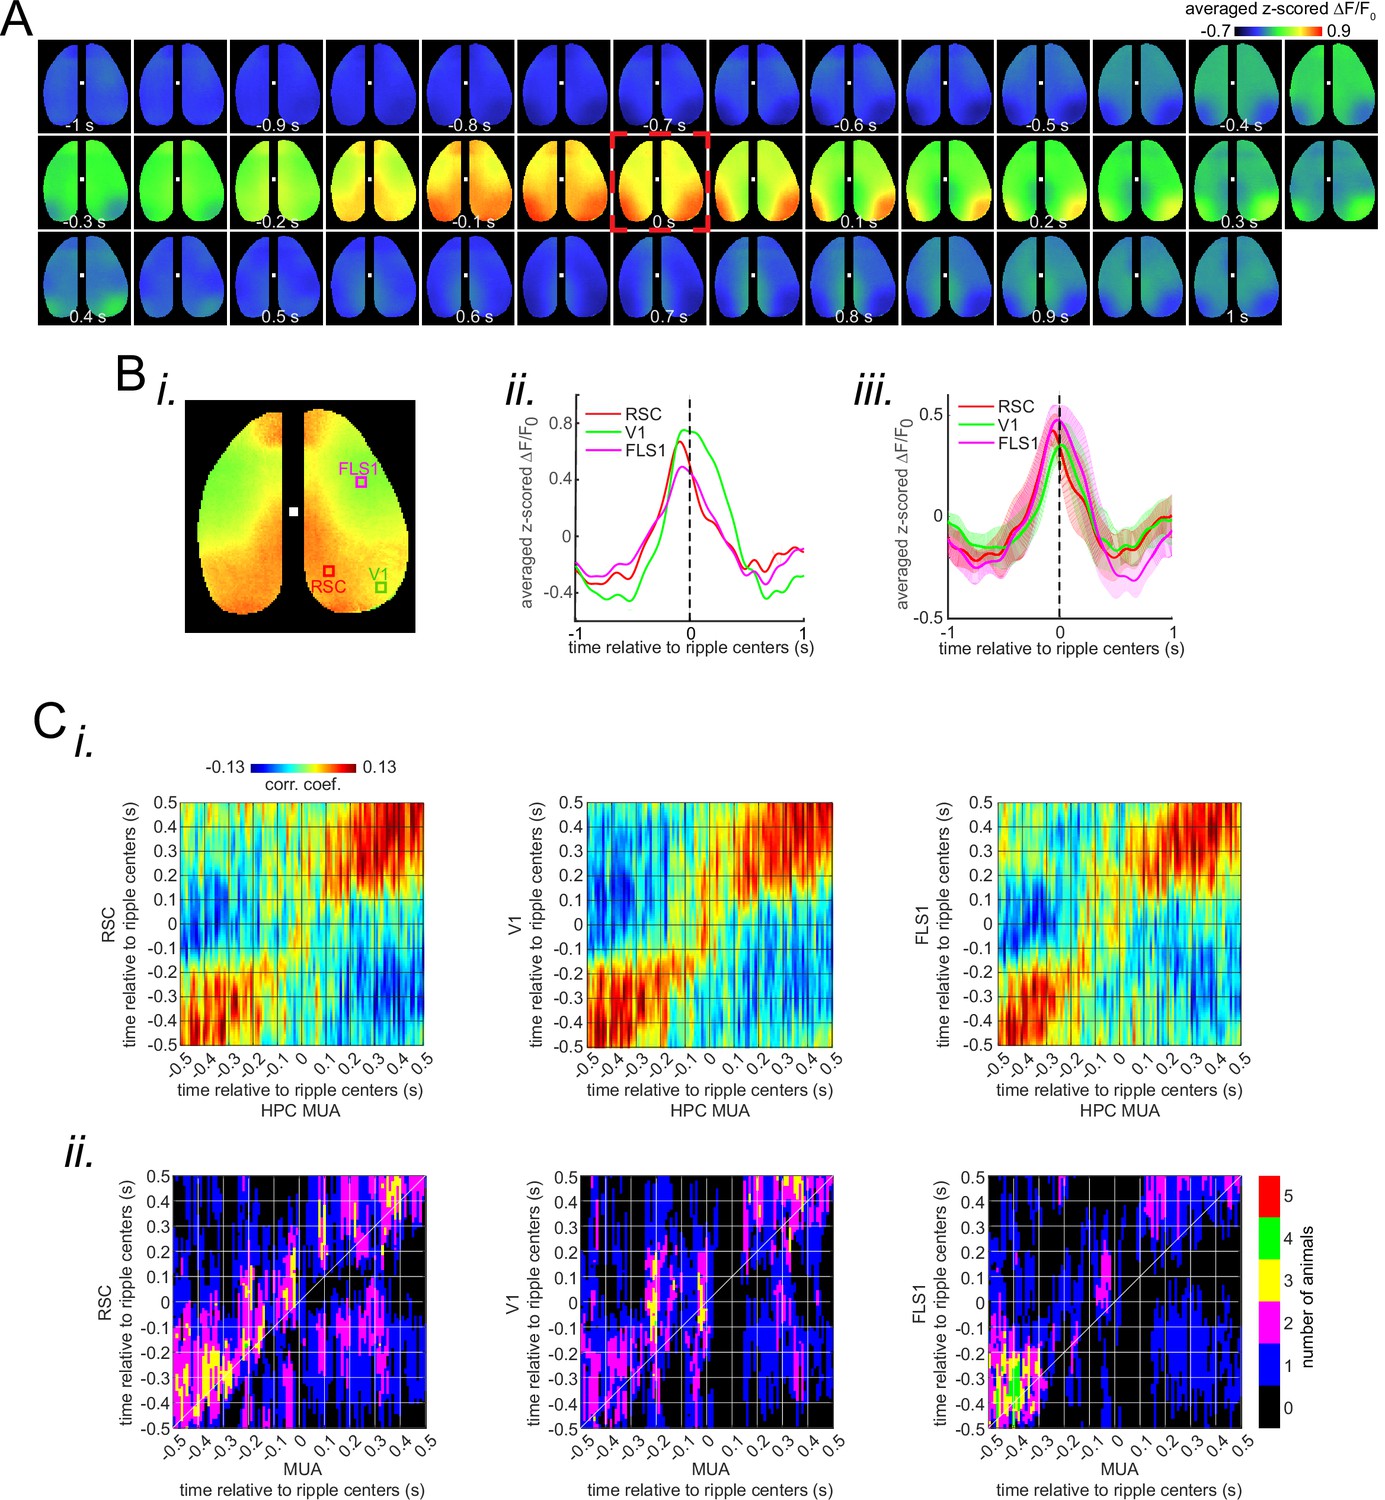
Deactivation and activation dominate the neocortical voltage and glutamate activity, respectively, during awake ripples.
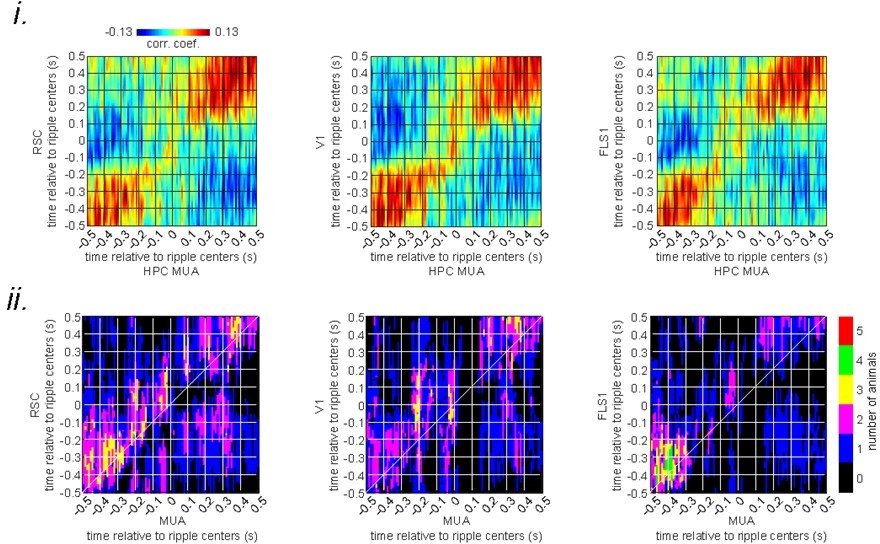
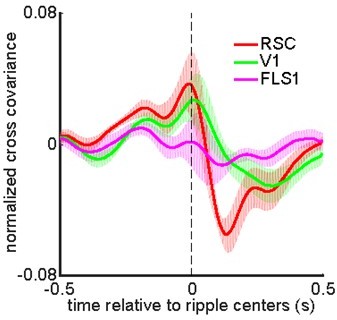
(A) (i–ii) Montage of average voltage (i) and glutamate (ii) activity 1 s before and after ripple centers in two representative animals. Zero time (red dashed square) represents the timestamp of the center of ripples. Note the reduction of voltage signal across neocortical regions during ripples and the elevation of voltage activity before ripples. The deactivation is the strongest in the agranular retrosplenial cortex (aRSC), the dark area in the posterior-medial part of the imaging window which is noticeable in the frame associated with the time 100 ms in (i). Glutamate activity, on the other hand, showed a strong activation during ripples in all the regions. (B) (i–ii) A representative frame chosen from the hyperpolarization period in (A–i) along with peri-ripple mean voltage time-series of three regions of interest chosen from the aRSC, primary visual cortex (V1), and primary forelimb somatosensory cortex (FLS1). The data represented in time-series format is the same data shown in (A–i). (iii) Peri-ripple mean voltage and hippocampal multi-unit activity (HPC MUA) time-series averaged across six voltage-sensitive fluorescent protein (VSFP) mice. The shading represents the standard error of the mean (SEM). aRSC shows the strongest and fastest deactivation compared with other regions. (iv–vi) Ensemble-wise correlation coefficient function of the peri-ripple voltage activity of the neocortical regions and HPC MUA. Rows and columns of the matrices represent time (in seconds) relative to ripple centers. (C) The same as (B) but for iGlu-Ras animals (n=4) with extra regions of interest from primary lip somatosensory cortex (ULpS1), primary barrel cortex (BC), and primary auditory cortex (Aud). The glutamate signal from aRSC shows the fastest and latest onset of elevation. Note the presence and absence of enhanced correlation between aRSC and HPC MUA in the time interval (0,100 ms) in the voltage and glutamate activity, respectively.
Figure 2—figure supplement 1
Peri-ripple voltage activity under urethane anesthesia.
(A) Montage of average voltage activity 1 s before and after ripple centers under urethane anesthesia (as a model of sleep) in the same representative animal as in Figure 2a–i. Zero time (red dashed square) represents the timestamp of the center of ripples. Note the elevation of voltage signal (depolarization) across neocortical regions during ripples which is in sharp contrast with the result in Figure 2a–i. (B) (i–ii) A representative frame chosen from the depolarization period in (a) along with peri-ripple mean voltage time-series of three regions of interest chosen from the agranular retrosplenial cortex (aRSC), primary visual cortex (V1), and primary forelimb somatosensory cortex (FLS1). The data represented in time-series format is the same data shown in (A). (iii) Peri-ripple mean voltage time series under urethane anesthesia averaged across five voltage-sensitive fluorescent protein (VSFP) mice. The shading represents the SEM. (C) (i) Ensemble-wise correlation coefficient function of the peri-ripple voltage activity of the neocortical regions and hippocampal multi-unit activity (HPC MUA) recorded under urethane anesthesia (averaged across n=6 animals). Rows and columns of the matrices represent time (in seconds) relative to ripple centers. (ii) The number of VSFP animals showing significant regions in their correlation functions between peri-ripple HPC MUA and different neocortical regions based on cluster-based significant testing via temporal shuffling. The diagonal of the correlation functions is marked.
Figure 2—figure supplement 2
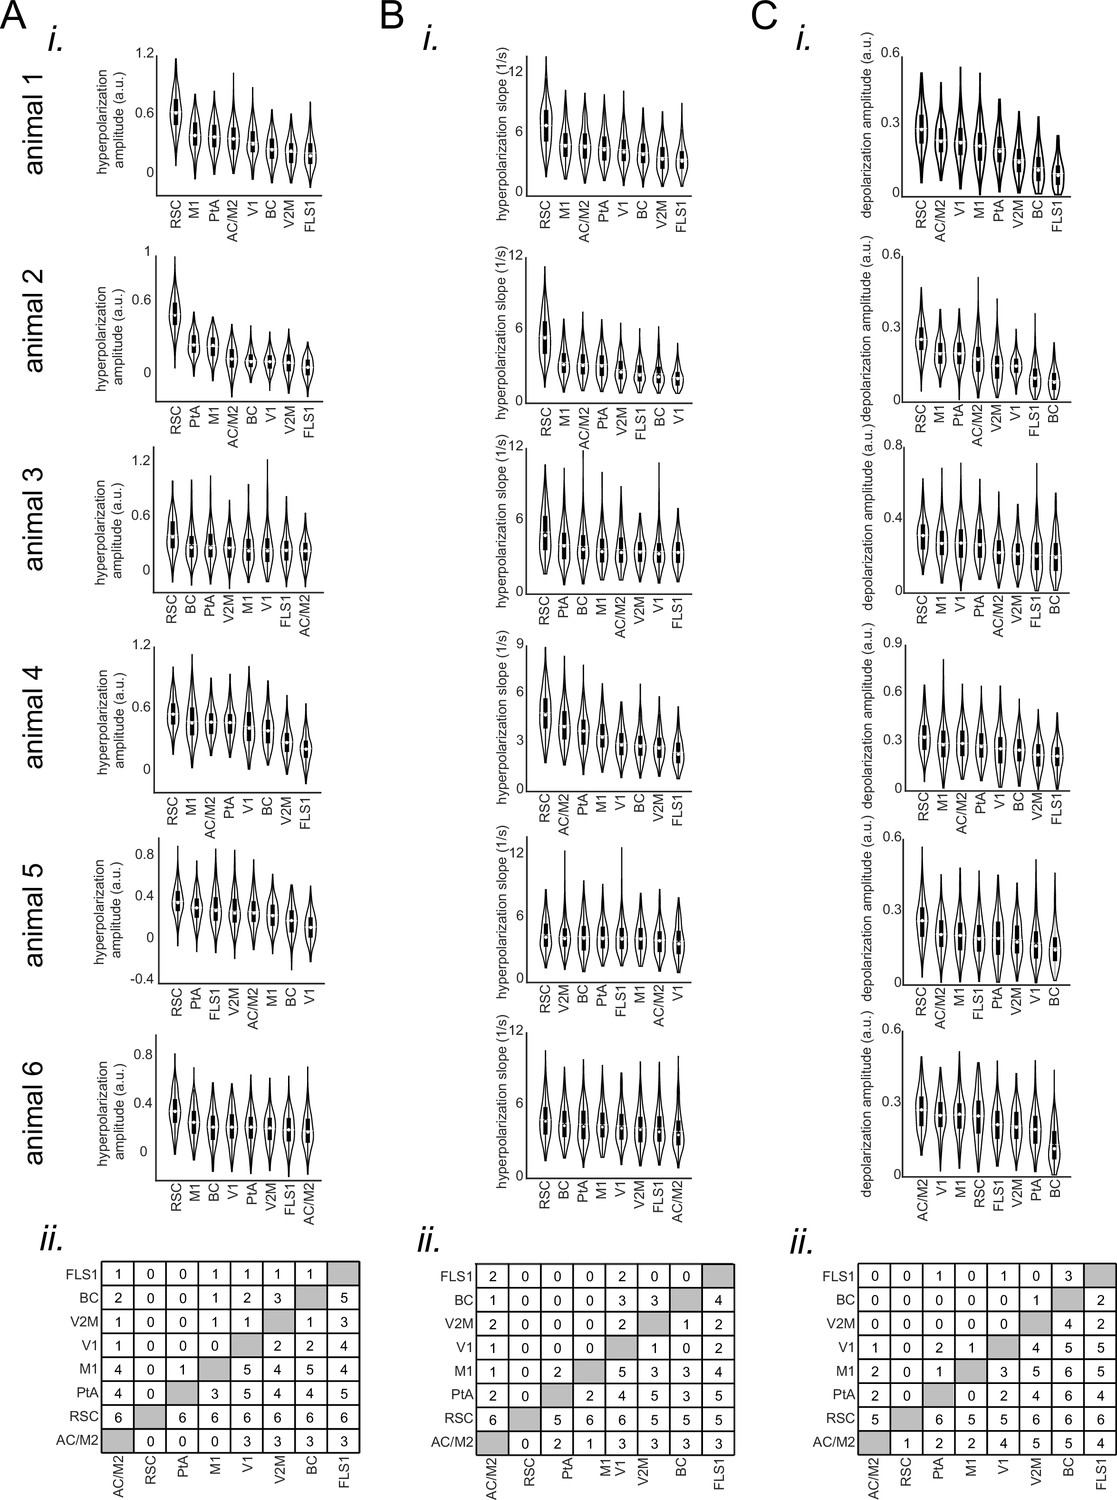
Comparing the features of the peri-ripple voltage activity across neocortical regions.
(A) (i) Bootstrap distribution of voltage reduction amplitude (with respect to the pre-ripple baseline) across imaged neocortical regions for individual voltage-sensitive fluorescent protein animals. The regions are sorted according to their distribution mean in descending order (repeated-measure ANOVA with df = 7 and n=231; from top to bottom: F=440.597, p-value = 1.0596 × 10–211; F=858.17, p=0; F=62.95, p=3.0723 × 10–46; F=202.86, p=1.578 × 10–86; F=163.62, p=1.797 × 10–82; F=115.303, p=2.703 × 10–97). (ii) The result of posthoc multiple comparisons following repeated-measure ANOVA, pooled across animals (six animals). The numbers at each entry of the matrix represent the number of mice for which the bootstrap distribution associated with the corresponding row region has statistically significant larger mean than column region. Significance alpha level of 0.05 was used as the threshold for statistical significance. (B–C) The same as (A) but for voltage reduction slope (mean over full-width at half-maximum of derivative of the voltage signal; repeated-measure ANOVA with df = 7 and n=231; from top to bottom: F=195.096, df = 7, p-value = 1.1431 × 10–128; F=291.61, p=1.32 × 10–161; F=63.9, p=4.56 × 10–55; F=240.13, p=1.36 × 10–146; F=7.35, p=4.06 × 10⁻⁶; F=20.24, p=1.43 × 10⁻²⁰) and pre-ripple voltage elevation amplitude (mean over full-width at half-maximum; repeated-measure ANOVA with df = 7 and n=231; from top to bottom: F=288.5488, df = 7, p-value = 1.8389 × 10–142; F=316.86, p=1.79 × 10–213; F=92.71, p=4.53 × 10–74; F=62.03, p=4.88 × 10–37; F=58.77, p=2.3 × 10–50; F=134.77, p=2.37 × 10–123). Note that agranular retrosplenial cortex (aRSC), compared with all other imaged regions, shows largest voltage reduction amplitude, fastest rate of change of voltage reduction, and largest pre-ripple voltage elevation in at least five out of six animals.
Figure 2—figure supplement 3
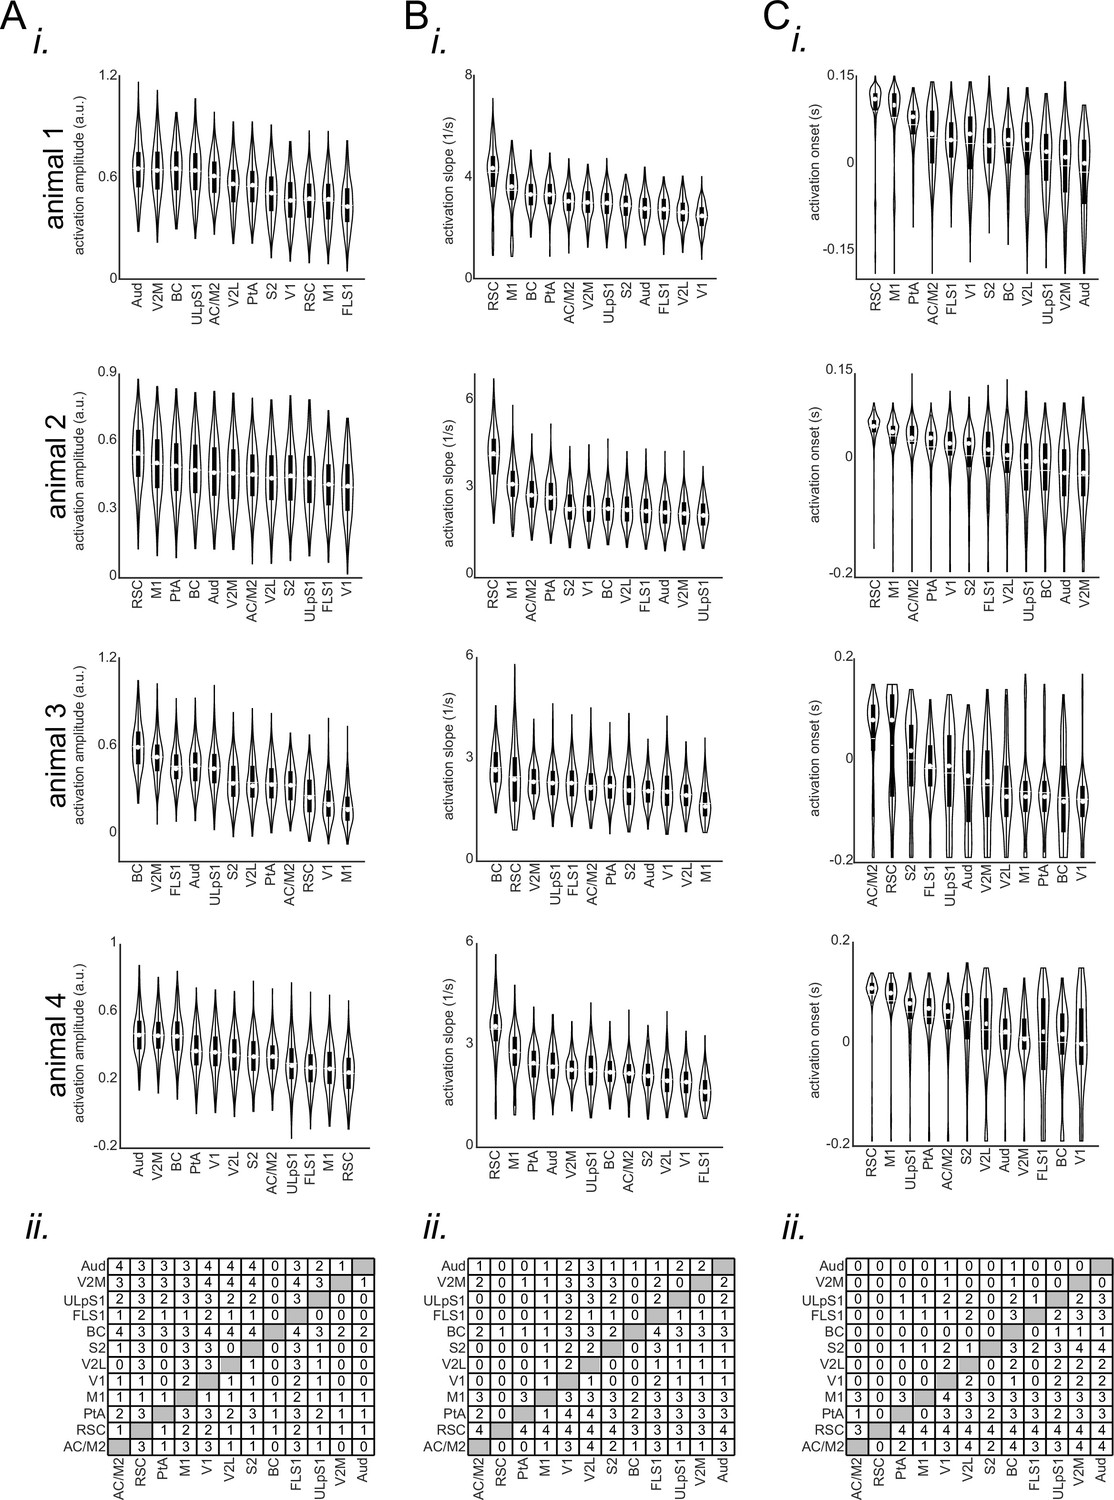
Comparing the features of the peri-ripple glutamate activity across neocortical regions.
(A) (i) Bootstrap distribution of glutamate activation amplitude (with respect to the pre-ripple baseline) across imaged neocortical regions for individual iGlu-Ras animals. The regions are sorted according to their distribution mean in descending order (repeated-measure ANOVA with df = 11 and n=270; from top to bottom: F=337.9781, df = 11, p-value = 3.6841 × 10–262; F=304.206, p=1.3 × 10–211; F=663.42, p=0; F=394.13, p=4.42 × 10–256). (ii) The result of post hoc multiple comparisons following repeated measure ANOVA, pooled across animals (four animals). The numbers at each entry of the matrix represent the number of mice for which the bootstrap distribution associated with the corresponding row region has a statistically significant larger mean than the column region. The significance alpha level of 0.05 was used as the threshold for statistical significance. (B–C) The same as (A) but for glutamate activation slope (mean over full-width at half-maximum of derivative of the glutamate signal repeated-measure ANOVA with df = 11 and n=270; from top to bottom: F=207.5245, P-value = 3.427 × 10–130; F=889.69, P=0; F=81.93, P=2.83 × 10–76; F=249.77, P=1.35 × 10–180) and glutamate activation onset (timestamp at which the derivative of iGluSnFR signal reaches its half-maximum for the first time; repeated-measure ANOVA with df = 11 and n=270; from top to bottom: F=113.0048, p-value = 7.705 × 10–149; F=142.93, p=3.53 × 10–187; F=86.56, p=2.53 × 10–119; F=57.1, p=5.78 × 10–80). Note that agranular retrosplenial cortex (aRSC), compared with all other imaged regions, shows the fastest rate of change and the latest onset of glutamate activation in at least three out of four animals.
Figure 2—figure supplement 4
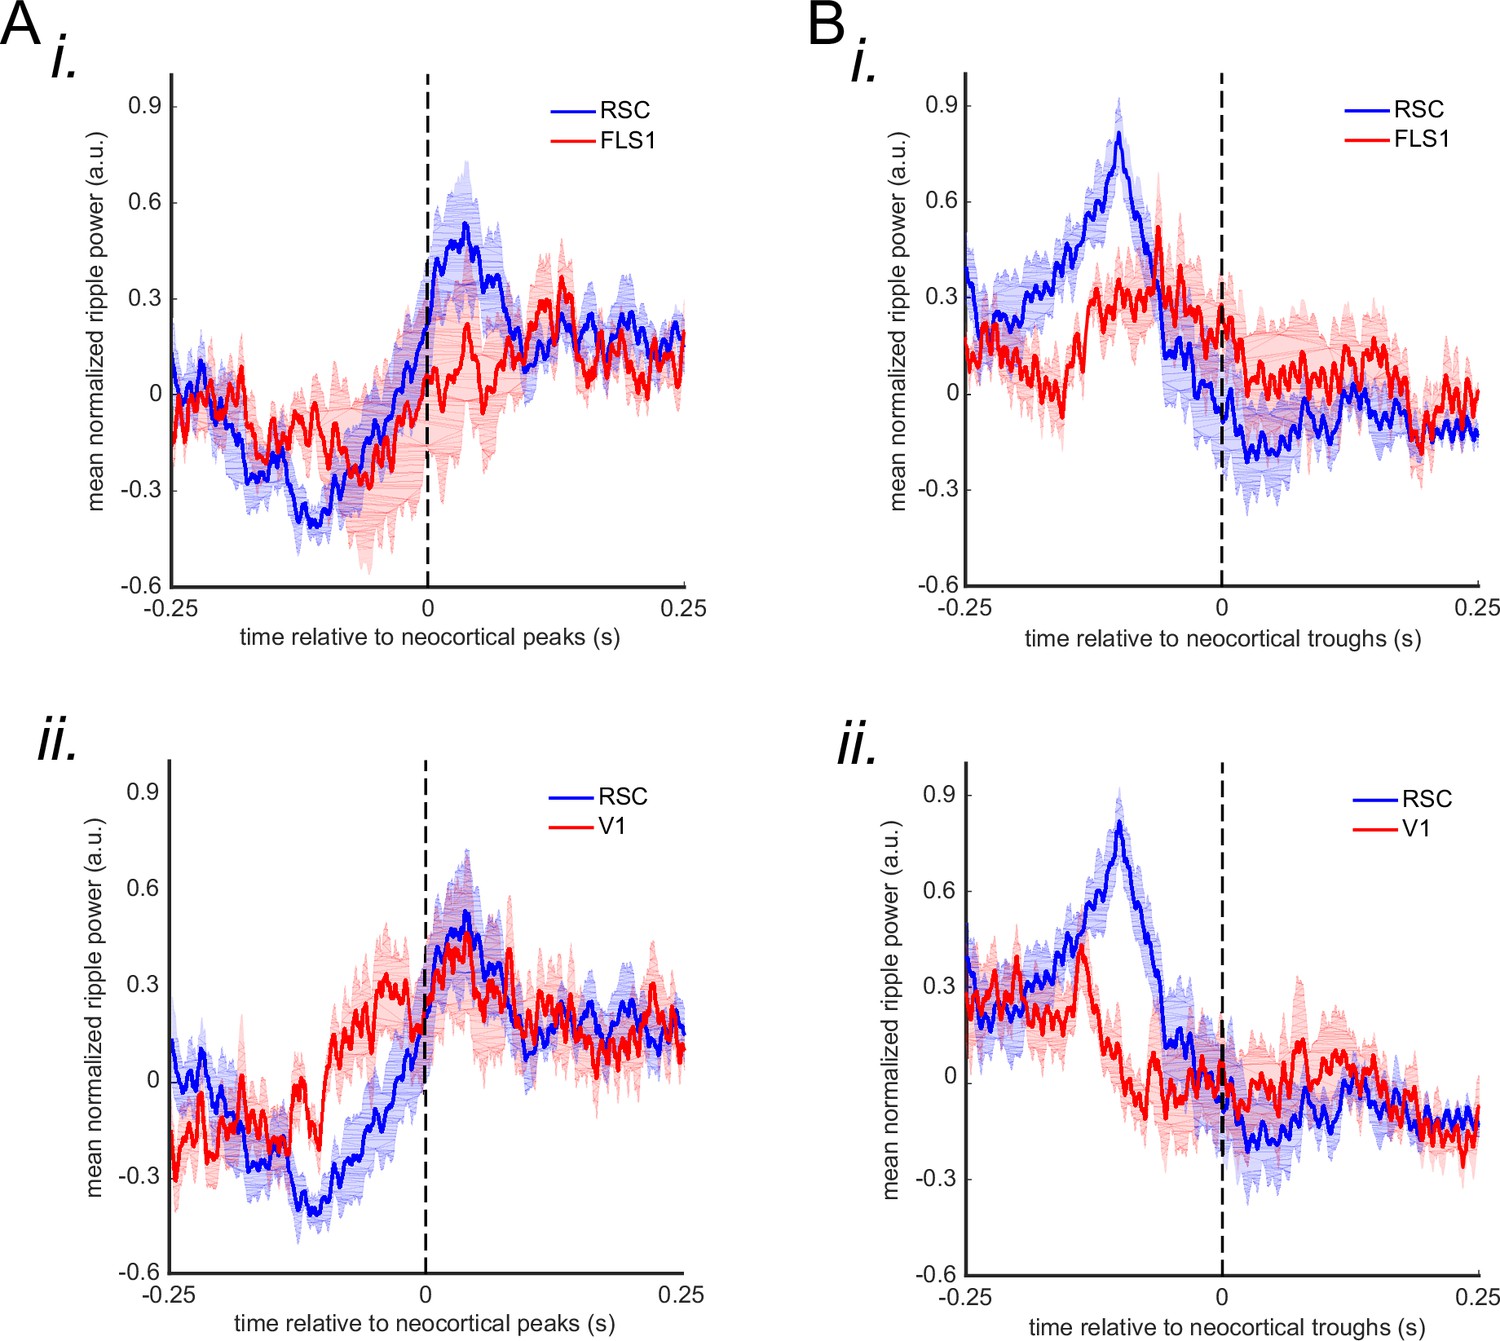
Mean ripple power triggered by peaks (A) and troughs (B) of the voltage signal captured from agranular retrosplenial cortex, V1, and forelimb somatosensory cortex 1.
Zero time represents the timestamp of the neocortical troughs/peaks. The shading represents SEM (n=6 animals).
Figure 2—figure supplement 5

The relationship between the ripple power and the post-ripple voltage drop amplitude.
(A) (i) The ripples were divided into eight subgroups using eight quantiles of their power distribution. Peri-ripple agranular retrosplenial cortex (aRSC) voltage trace was triggered on ripple centers in the odd-numbered ripple power subgroups for each animal and then averaged across six animals. The standard errors of the mean were not shown for the sake of simplicity. (ii) The same as the (i) panel but for only the lowest and highest power subgroups. The shading represents the standard error of the mean. (B) The scatter plots of the ripple power and pre-ripple aRSC voltage amplitude for individual animals. The black lines in each graph represent the linear regression line. The blue circles in each graph are associated with one ripple. The Pearson’s correlation values (ρ) and the p-value of their corresponding statistical significance are represented on top of each graph. (C) The same as (B) graphs but for post-ripple aRSC amplitude. To check that the correlation results were not influenced by the extreme values of the ripple power and aRSC voltage, we repeated the same correlation analysis after removing the ripples associated with top and bottom 5% of the ripple power and aRSC voltage values. According to this analysis, one out of six animals showed a negative correlation (ρ=–0.13), and five animals did not show a statistically significant correlation (p-value >0.05) between ripple power and pre-ripple aRSC voltage amplitude. Moreover, two out of six animals showed a negative correlation (same animals that showed a negative correlation before removing the extreme values; ρ=–0.12 and –0.14), one animal showed a positive correlation (ρ=0.1), and three animals did not show a statistically significant correlation (p-value >0.05) between ripple power and post-ripple aRSC voltage amplitude.
Figure 2—figure supplement 6
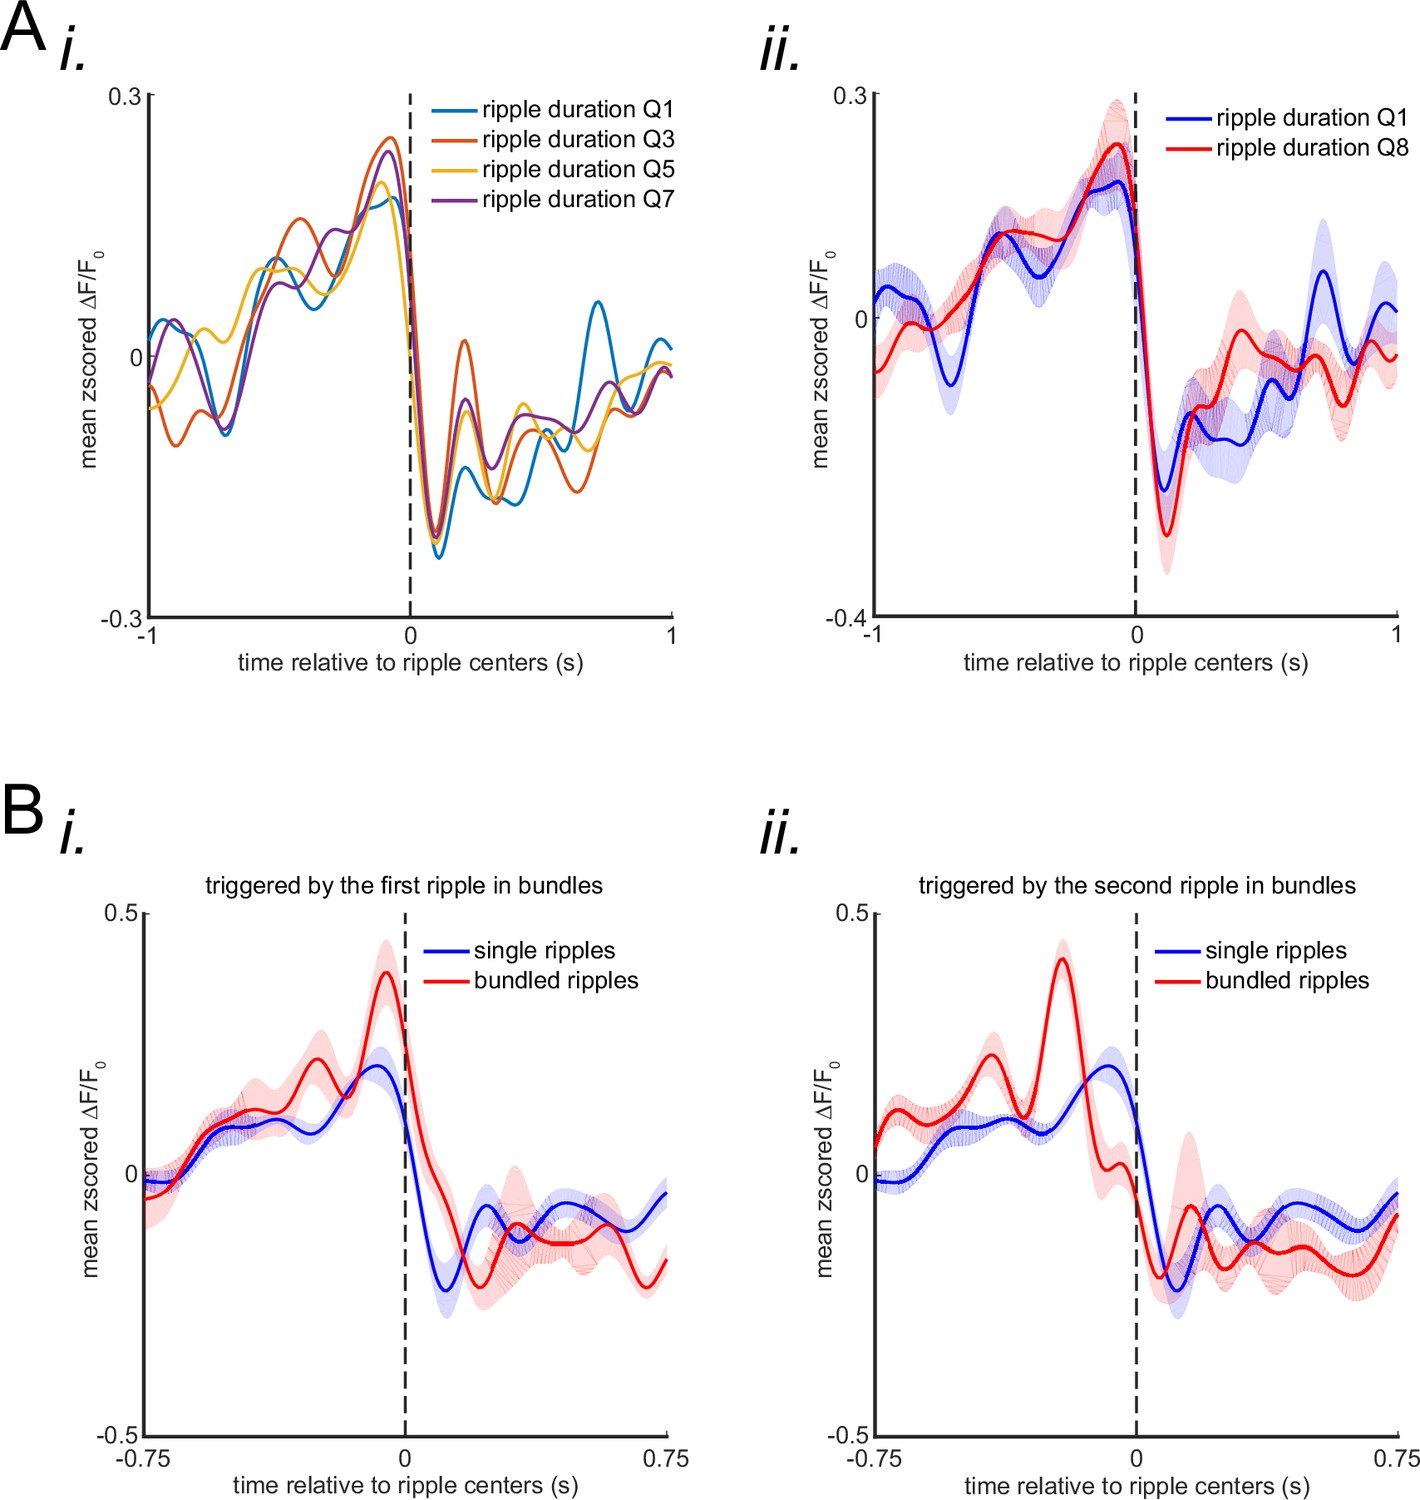
The relationship between the ripple duration and the post-ripple voltage drop amplitude.
(A) (i) The ripples were divided into eight subgroups using eight quantiles of their duration distribution. Peri-ripple agranular retrosplenial cortex (aRSC) voltage trace was triggered on ripples in the odd-numbered ripple duration subgroups for each animal and then averaged across six animals. The standard errors of the mean were not shown for the sake of simplicity. (ii) The same as the (i) panel but for only lower and highest duration subgroups. The shading represents the standard error of the mean. (B) (i) The animal-wise average of mean peri-ripple aRSC voltage trace triggered by centers of the single and centers of the first ripple in the bundled ripples. (ii) Same as (i) but triggered by the centers of the second ripple in the bundled ripples.
Figure 2—figure supplement 7
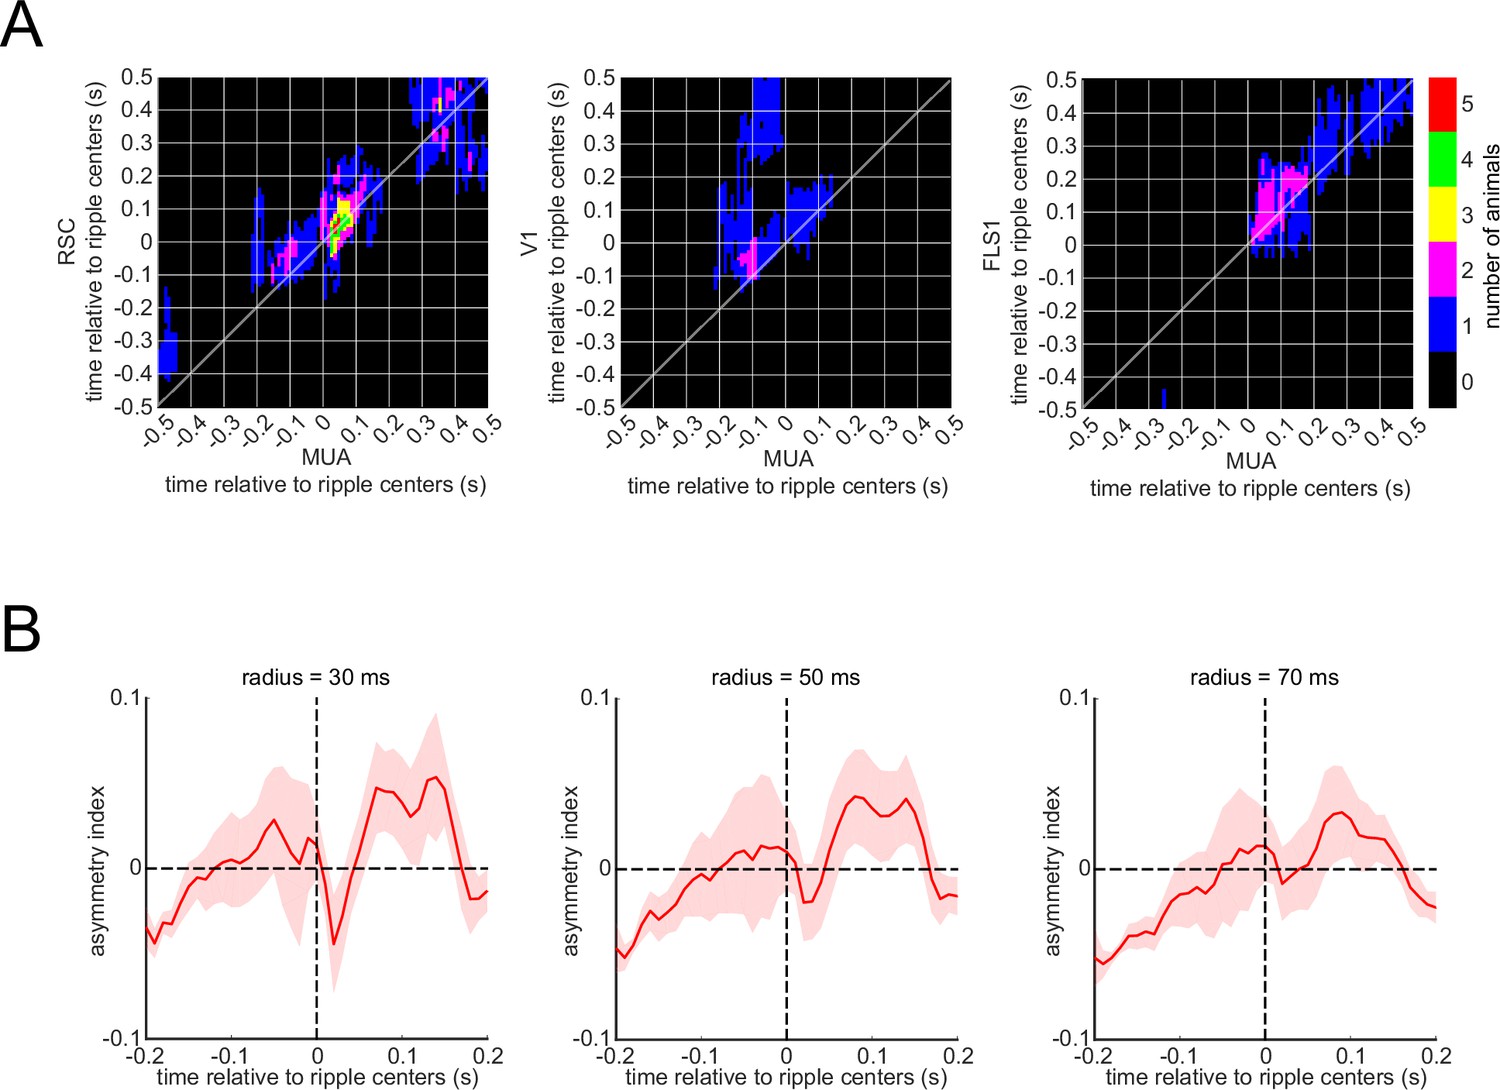
The statistical significant testing of the values of the correlation function.
(A) The number of voltage-sensitive fluorescent protein animals showing significant regions in their correlation functions between peri-ripple hippocampal multi-unit activity (MUA) and different neocortical regions based on cluster-based significant testing via temporal shuffling. The diagonal of the correlation functions is marked. (B) The asymmetry index of the ensemble-wise correlation function was calculated for each time point t relative to the ripple times (t=0) for each animal and then averaged across six animals. The shading represents the standard error of the mean. The index at time t equals the average correlation value from (t − r, t+r) to (t, t) minus the average correlation value from (t, t) to (t+r, t − r) where r varies from 0 to a radius value mentioned on the top of each graph. According to this definition, a positive asymmetry index value means the hippocampal leads the neocortex, and a negative value means otherwise.
Figure 3 with 2 supplements
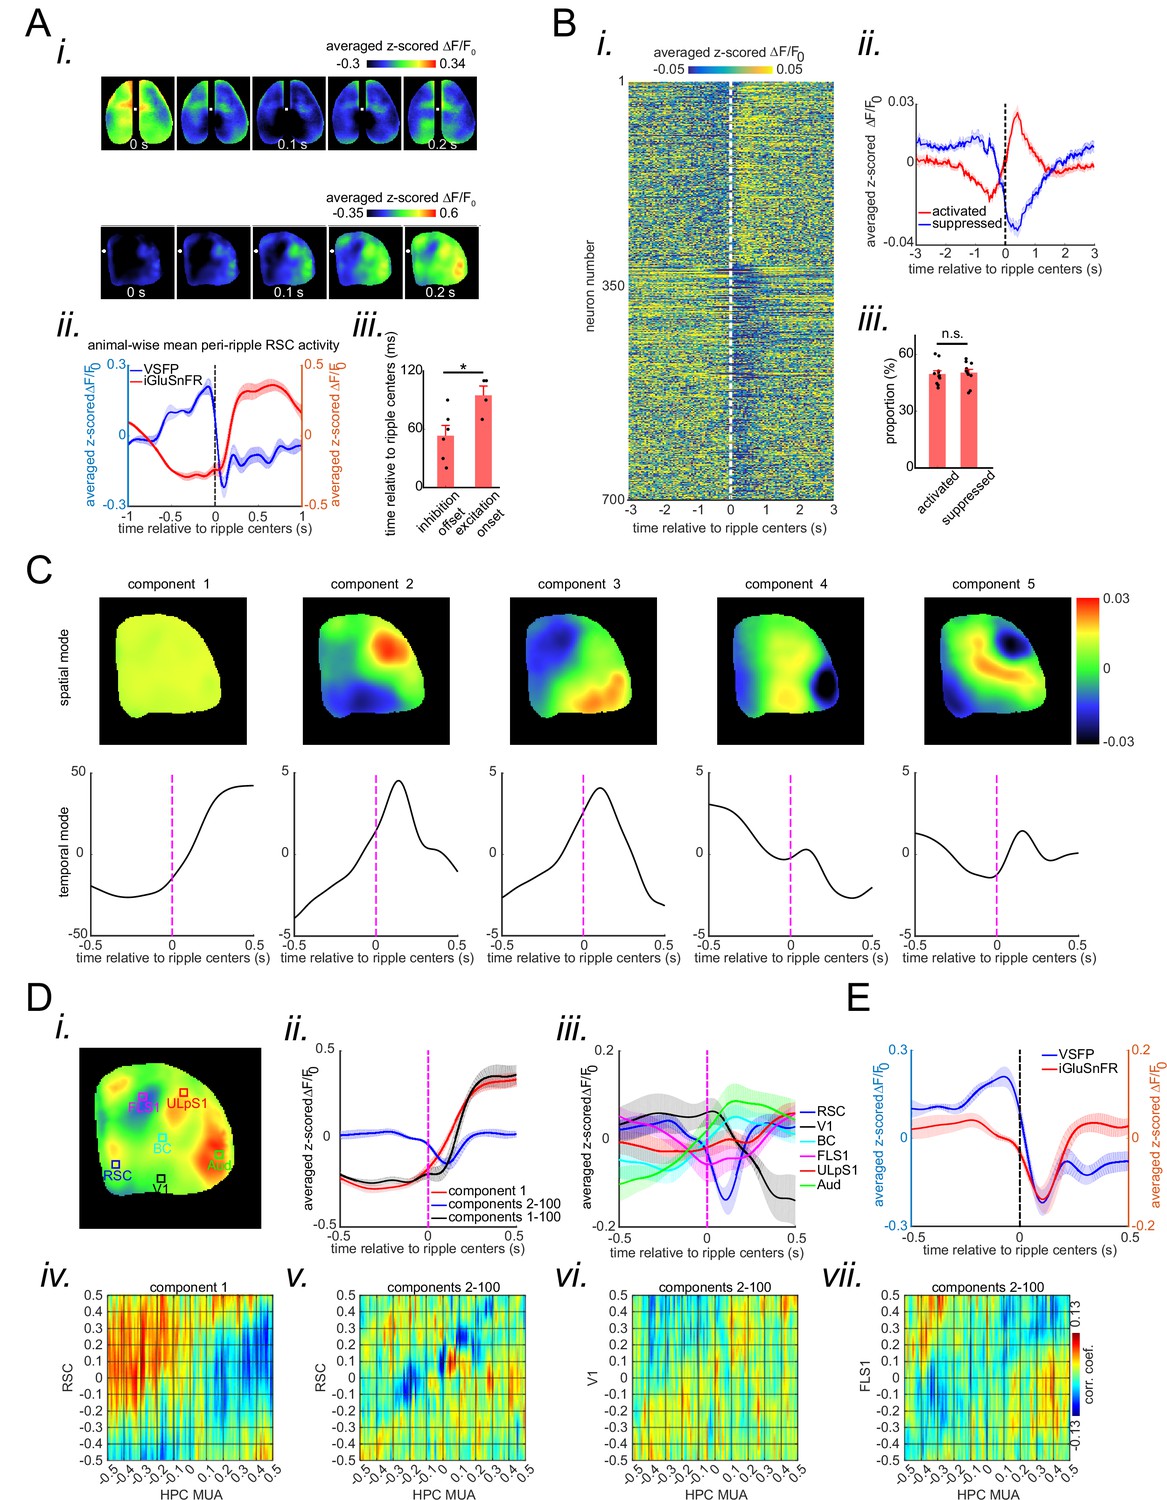
A subpopulation of agranular retrosplenial cortex (aRSC) neurons fire during awake ripples despite the strong voltage reduction.
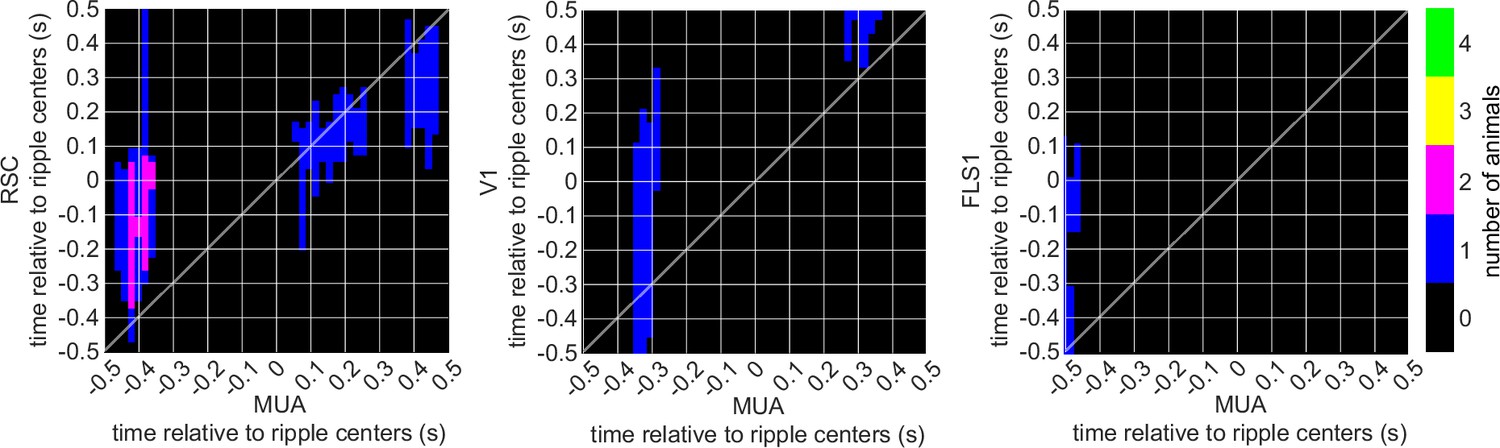
(A) (i) Five frames taken from the montages shown in Figure 2ai–ii aligned with respect to the ripple center timestamps (zero time). Note the elevation of the glutamate signal as voltage suppression eases. Also, note that voltage reduction is strongest and glutamate activation onset is the latest in aRSC compared with other regions. (ii) Time-series representation of the aRSC voltage (blue) and glutamate (red) signals shown in (i). Note that the onset of glutamate activation is around the offset of voltage suppression. (iii) Statistical comparison of the voltage suppression offset time in voltage-sensitive fluorescent protein (VSFP) mice (n=6) and glutamate onset time in iGlu-Ras mice (n=4). There is a statistically significant difference between the two (two-sample t-test; p=0.02). (B) (i) Average calcium trace (ΔF/F0) for individual neurons 3 s before and after ripple centers in a representative Thy1-GCamp animal. The neurons’ calcium traces are grouped into two clusters and are sorted based on their cluster membership. During ripples, the neurons in clusters 1 and 2 show elevation and suppression of calcium signal, respectively. (ii) Peri-ripple calcium traces are averaged across neurons in each cluster in each animal and then averaged across 11 animals. The shading represents the standard error of the animal-wise mean. (iii) Statistical comparison of the proportion of neurons in clusters 1 (activated) and 2 (suppressed). There is no significant difference between the two proportions (paired t-test; p>0.05). Comparing the results in (A–ii) and (B–ii) suggests that the majority of neurons in clusters 1 and 2 are likely modulated by the excitatory and inhibitory forces applied to aRSC, respectively. (C) Spatial and temporal modes associated with the first five largest singular values (components) of the concatenated stack of peri-ripple iGluSnFR activity in the representative iGlu-Ras animal presented in Figure 2aii. Note that the spatial mode of the first component does not show a specific topography, and the corresponding temporal mode is dominated by post-ripple elevation of the iGluSnFR signal. Also, the amplitude of the first component temporal mode is an order of magnitude larger than that in other components. (D) (i) A representative frame chosen from (A) with six regions of interest (ROIs) chosen from six different neocortical regions. (ii) Three animal-wise (n=4) averages of the reconstructed mean peri-ripple glutamate signals captured from the aRSC ROI in (D-i). The signals were reconstructed using first (red), second-to-hundredth (blue), and first-to-hundredth (black) components in (C). The black signal is the summation of the red and blue ones. Note that the red signal (first component) captured almost all of the elevation seen in the black signal while the blue signal (2–100 components) shows a post-ripple dip. (iii) Animal-wise average of the reconstructed mean peri-ripple glutamate signals captured from all the ROIs in (D-i) color-coded according to the ROIs. The signals were reconstructed using second-to-hundredth components. Note that only aRSC shows a post-ripple dip. (iv) Ensemble-wise correlation coefficient function of the peri-ripple aRSC glutamate activity (only first component) and hippocampal multi-unit activity (HPC MUA). Rows and columns of the matrices represent time (in seconds) relative to ripple centers. (v-vii) The same as (iv) but for glutamate activity of three regions reconstructed from components 2–100. Note the presence and absence of enhanced correlation between aRSC and HPC MUA in the time interval (0,100 ms) in (iv) and (v), respectively. (E) Animal-wise average of mean peri-ripple signals captured from aRSC in all VSFP (blue; n=6) and iGlu-Ras (red; n=4) animals. The signals in iGlu-Ras animals were reconstructed from 2–100 components. Note that the timing of the dips in both signals matches, suggesting they both represent the same phenomenon.
Figure 3—figure supplement 1
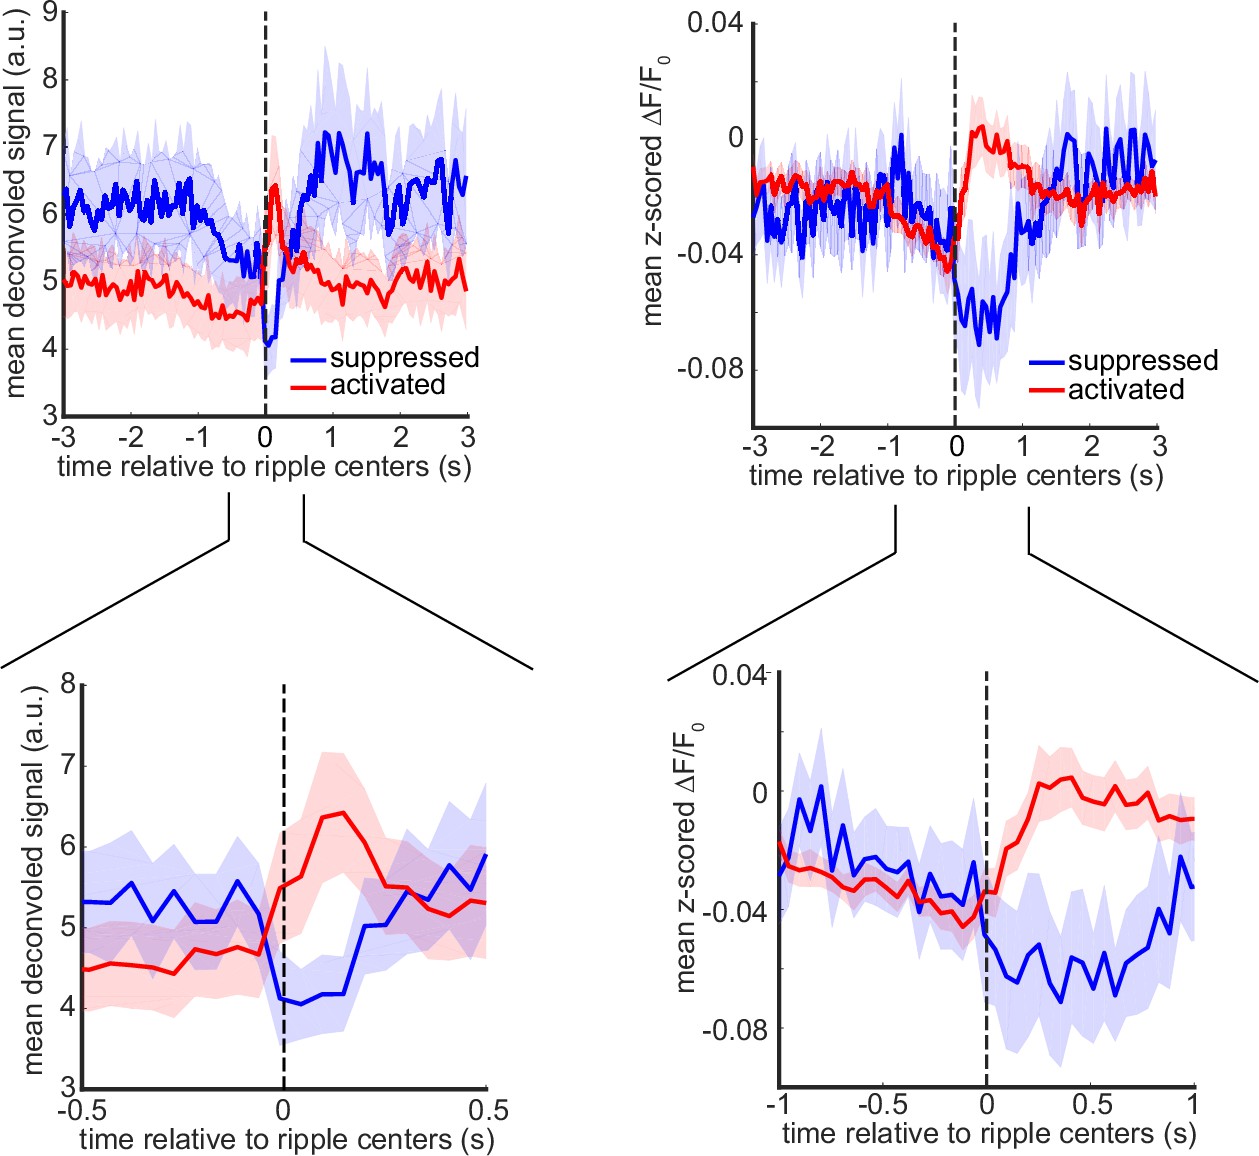
Mean peri-ripple deconvolved and calcium traces, averaged across up- or down-modulated neurons, determined based on deconvolved signal (see Methods), for each mouse and then averaged across 11 mice.
The shading represents SEM.
Figure 3—figure supplement 2
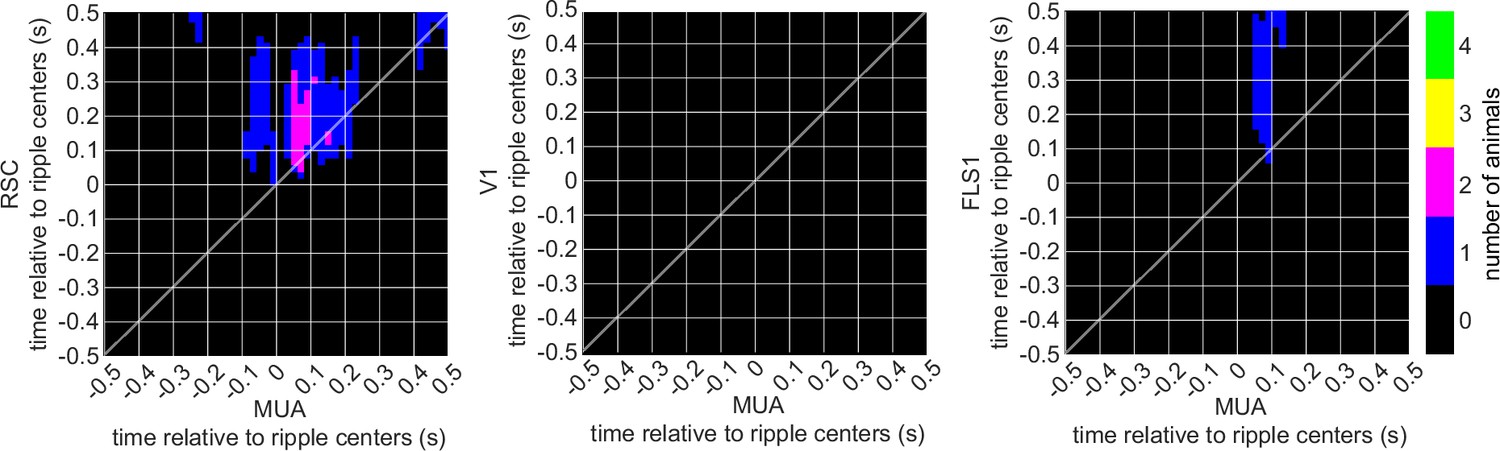
The number of iGluSnFR-Ras animals showing significant regions in their correlation functions between peri-ripple hippocampal multi-unit activity (MUA) and different neocortical regions based on cluster-based significant testing via temporal shuffling.
The diagonal of the correlation functions is marked.
Figure 4 with 1 supplement

Peri-ripple glutamatergic transmission in neocortical superficial layers is delayed compared with that in deep layers.
(A) Montage of average iGluSnFR activity 1 s before and after ripple centers in a representative iGlu-EMX animal. Zero time (red dashed square) represents the timestamp of the center of ripples. Note the elevation of glutamate signal across neocortical regions around ripple times. (B) (i–ii) A representative frame chosen from the elevation period in (A) along with peri-ripple mean iGluSnFR time-series of six regions of interest chosen from the agranular retrosplenial cortex (aRSC), primary visual cortex (V1), and primary forelimb somatosensory cortex (FLS1), primary lip somatosensory cortex (ULpS1), primary barrel cortex (BC), and primary auditory cortex (Aud). The data represented in time-series format is the same data shown in (A). (iii) Peri-ripple mean iGluSnFR and hippocampal multi-unit activity (HPC MUA) time-series averaged across four mice. The shading represents the standard error of the mean (SEM). The glutamate signals in iGlu-EMX animals are shifted to the left (precede) compared with those in iGlu-Ras animals represented in Figure 2a–ii , and c. (iv–vi) Ensemble-wise correlation coefficient function of the peri-ripple glutamate activity of the neocortical regions and HPC MUA. Rows and columns of the matrices represent time (in seconds) relative to ripple centers. (C) (i) Three animal-wise (n=4) averages of the reconstructed mean peri-ripple glutamate signals captured from the aRSC region of interest (ROI) in (B–i). The signals were reconstructed using first (red), second-to-hundredth (blue), and first-to-hundredth (black) components. The black signal is the summation of the red and blue ones. Note that the red signal (first component) captured almost all of the elevation seen in the black signal while the blue signal (2–100 components) shows a post-ripple dip. (ii) Animal-wise average of the reconstructed mean peri-ripple glutamate signals captured from all the ROIs in (B–i) color-coded according to the ROIs. The signals were reconstructed using second-to-hundredth components. Note that only aRSC shows a post-ripple dip. (iii) Ensemble-wise correlation coefficient function of the peri-ripple aRSC glutamate activity (only first component) and hippocampal HPC MUA. (iv-vi) The same as (B iv-vi) but for signals reconstructed from components 2–100. Note the presence and absence of enhanced correlation between aRSC and HPC MUA in the time interval (0,100 ms) in (iii) and (iv), respectively. (D) (i) Animal-wise (n=4) average of reconstructed (using first component) mean peri-ripple glutamate activity in iGlu-Ras (blue; n=4) and iGlu-EMX (red; n=4) animals. (ii) The statistical comparison of onset time in iGlu-Ras and iGlu-EMX signals in (i) (two-way ranksum test). (E) (i) Animal-wise average of reconstructed (using 2–100 components) mean peri-ripple glutamate activity in iGlu-Ras (blue) and iGlu-EMX (red) animals. (ii) The statistical comparison of onset time in iGlu-Ras and iGlu-EMX signals in (i) (two-sided ranksum test).
Figure 4—figure supplement 1
The number of iGluSnFR-EMX animals showing significant regions in their correlation functions between peri-ripple hippocampal multi-unit activity (MUA) and different neocortical regions based on cluster-based significant testing via temporal shuffling.
The diagonal of the correlation functions is marked.
Author response image 1

The asymmetry index of the ensemble-wise correlation function was calculated for each time point t relative to the ripple times (t = 0) for each animal and then averaged across 6 animals.
The shading represents the standard error of the mean. The index at time t equals the average correlation value from (t – r, t + r) to (t, t) minus the average correlation value from (t, t) to (t + r, t – r) where r varies from 0 to a radius value mentioned on the top of each graph. According to this definition, a positive asymmetry index value means the hippocampal leads the neocortex, and a negative value means otherwise.
Author response image 2
(i) Ensemble-wise correlation coefficient function of the peri-ripple voltage activity of the neocortical regions and hippocampal multi-unit activity (MUA) recorded under urethane anesthesia (averaged across n = 6 animals).
Rows and columns of the matrices represent time (in seconds) relative to ripple centers. (ii) The number of VSFP animals showing significant regions in their correlation functions between peri-ripple HPC MUA and different neocortical regions based on cluster-based significant testing via temporal shuffling. The diagonal of the correlation functions are marked.
Author response image 3
Additional files
Download links
A two-part list of links to download the article, or parts of the article, in various formats.
Downloads (link to download the article as PDF)
Open citations (links to open the citations from this article in various online reference manager services)
Cite this article (links to download the citations from this article in formats compatible with various reference manager tools)
Inhibition is a prevalent mode of activity in the neocortex around awake hippocampal ripples in mice
eLife 12:e79513.
https://doi.org/10.7554/eLife.79513


