Filamentation modulates allosteric regulation of PRPS
- School of Life Science and Technology, ShanghaiTech University, China
- Department of Physiology, Anatomy and Genetics, University of Oxford, United Kingdom
Figures
Figure 1 with 8 supplements
with 8 supplements.
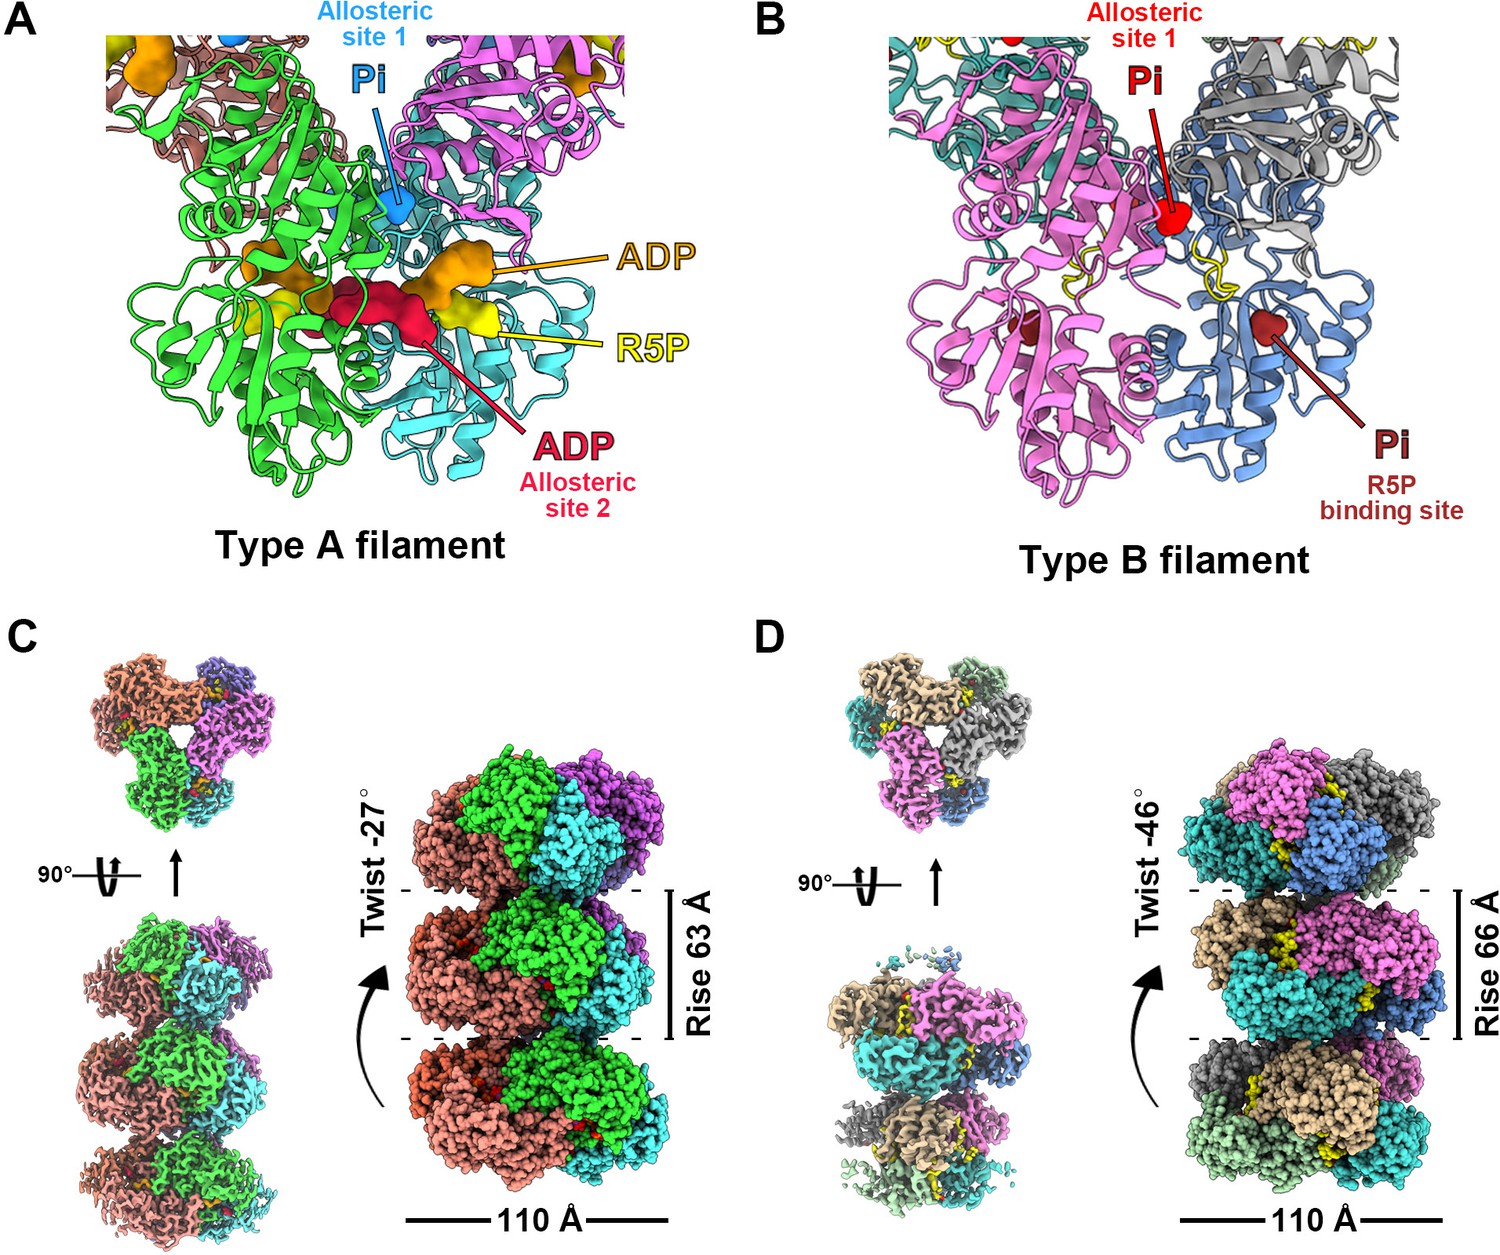
Overall structures of E. coli PRPS type A and type B filaments. (A) Type A filament ligands. The unit of E. coli PRPS type A filaments is hexamer with D3 symmetry. The hexamer has six identical ligand binding sites, one of which is shown in the figure. Different ligands are labeled with different colors. In type A filament, phosphate ion (Pi) binds to allosteric site 1, ADP binds to allosteric site 2 (red), and ATP binds to active site (brown). R5P also can be seen in the active site. (B) Type B filament ligands. The unit of type B filament is similar to that of type A filament, and one of the six identical ligand binding sites is shown here. In type B filament, the ATP binding site of active site is not bound by any ligand, while the R5P binding site and allosteric site 1 are bound by Pi. (C) Cryo-EM reconstruction of type A filament (C, 2.3 Å resolution). On the left is the electron density map of type A filament. On the right is the reconstruction structure of type A filament. The diameter and rise of type A filament are 110 Å and 63 Å, respectively. When hexamers are aggregated into type A filament, the adjacent hexamer us twisted by 27°. (D) Cryo-EM reconstructions of type B filament (2.9 Å resolution). On the left is electron density map of type A filament. On the right is the reconstruction structure of type A filament. The diameter of type B filament is same as that of type A filament. The rise and twist of type B filament are 66 Å and 46°, respectively.
Figure 1—figure supplement 1
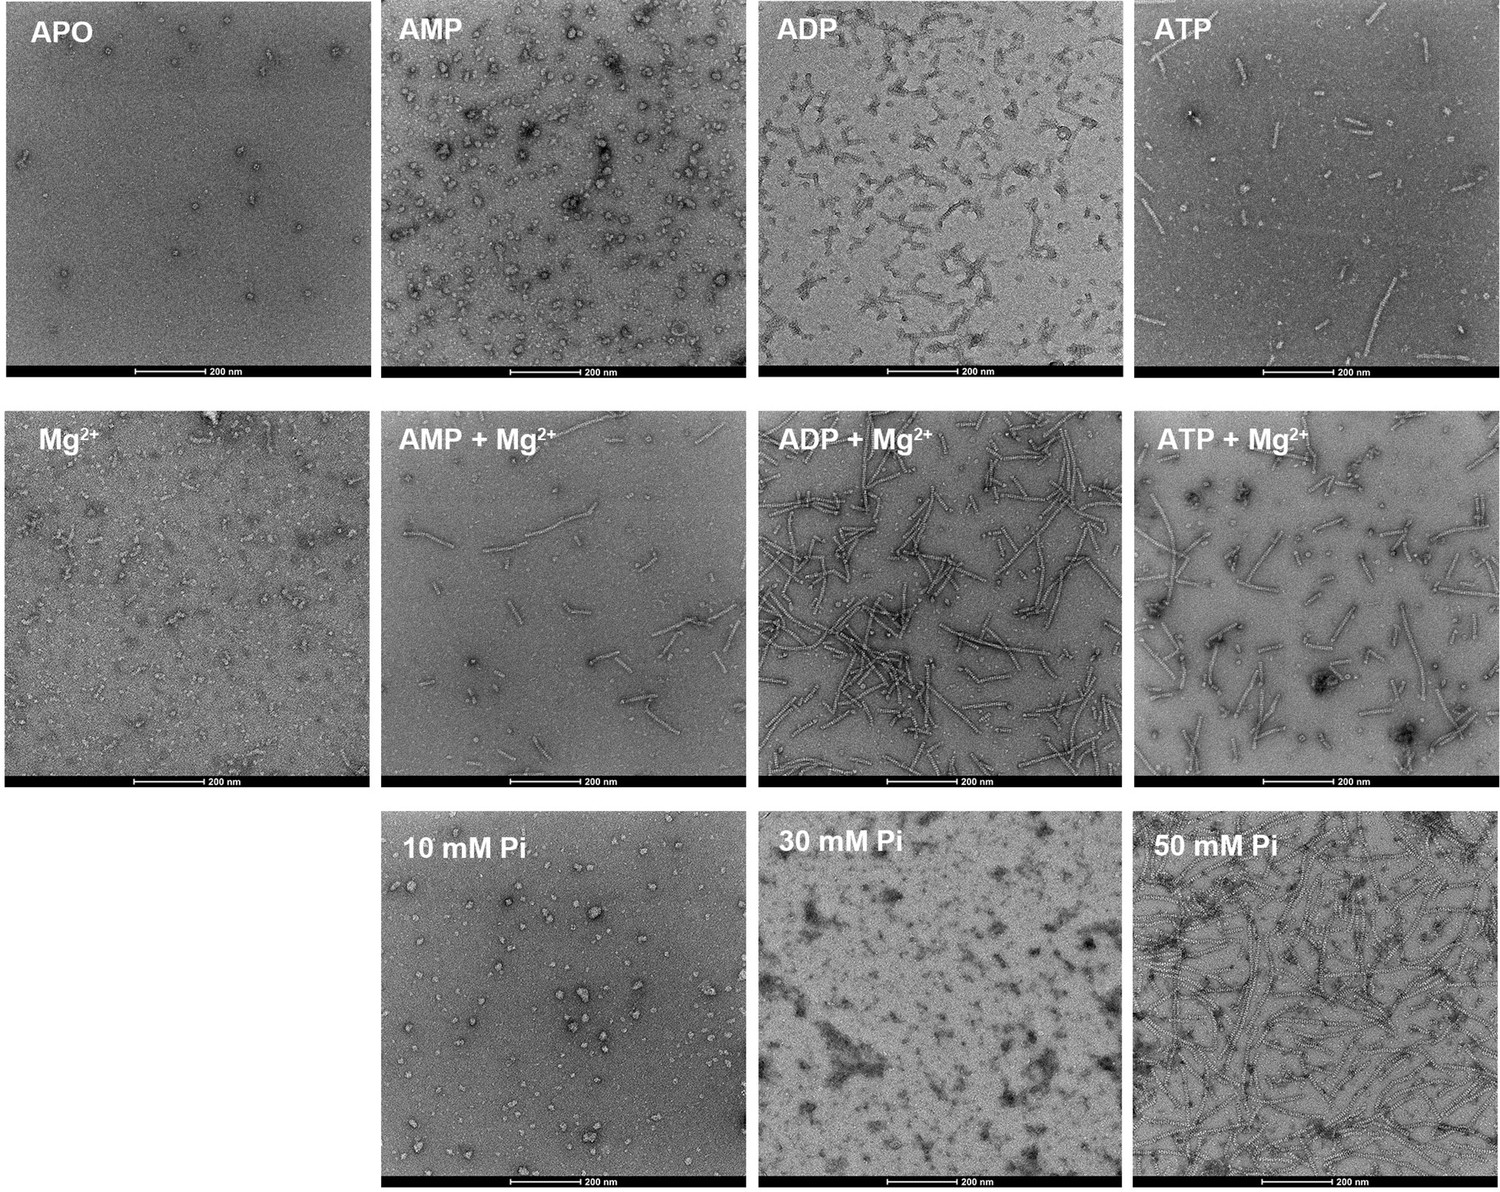
E. coli PRPS is assembled into filaments in vitro.
Negative staining electron microscopic images of purified E. coli PRPS (1 μM) incubated in various conditions. The concentrations of nucleotides and Mg2+ are 2 mM and 10 mM, respectively.
Figure 1—figure supplement 2

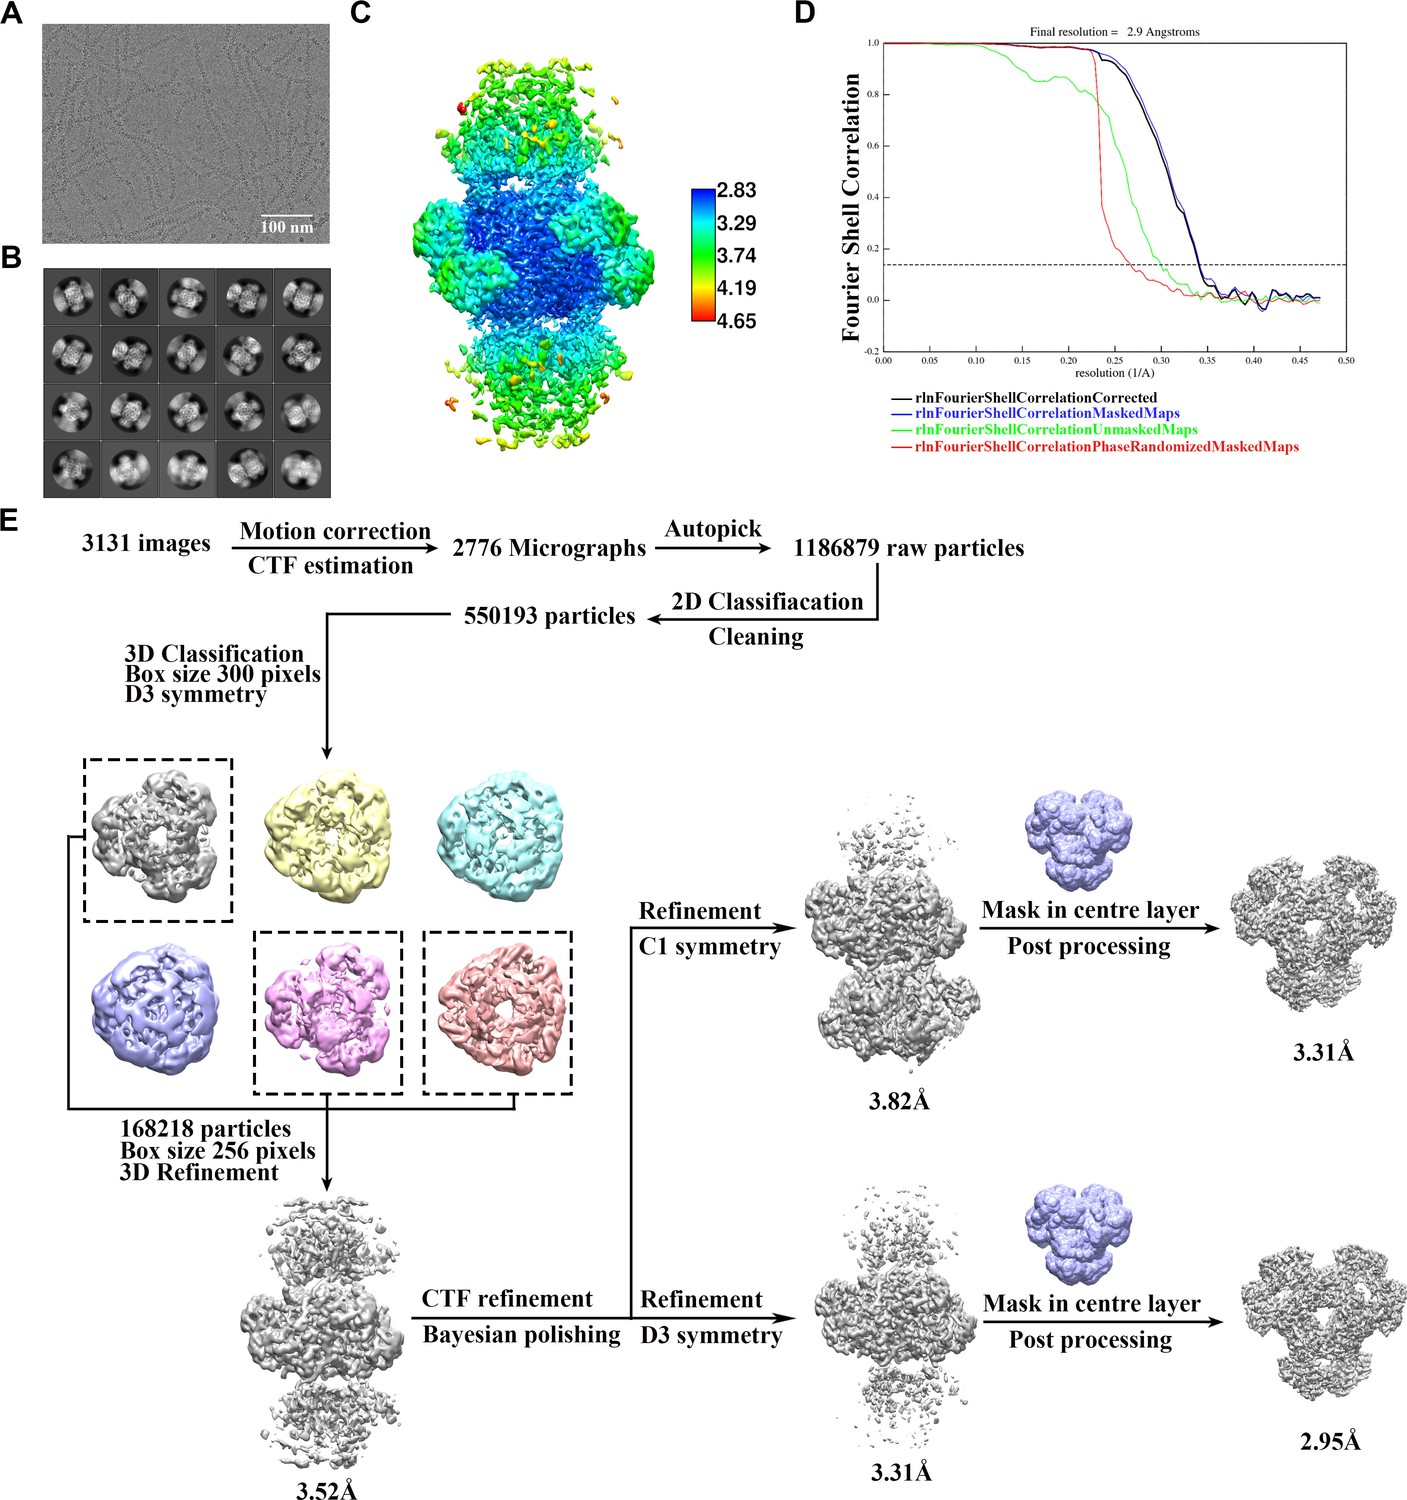
Cryo-EM data processing of PRPS type A filament.
(A) Representative Cryo-EM image of PRPS type A filament. (B) Representative 2D averages of PRPS type A filament in different views. (C) Local resolution of the type A filament final density map. (D) Gold-standard FSC curves of central hexamer in type A filament density map (dash line shows FSC = 0.143). The final average resolution of hexamer is estimated to be 2.3 Å. (E) Flow chart of PRPS type A filament image processing.
Figure 1—figure supplement 3
Cryo-EM data processing of PRPS type B filament.
(A) Representative Cryo-EM image of PRPS type B filament. (B) Representative 2D averages of PRPS type B filament in different views. (C) Local resolution of the type B filament final density map. (D) FSC curves of central hexamer in type B filament density map (dash line shows FSC = 0.143). The final average resolution of hexamer is estimated to be 2.9 Å. (E) Flow chart of PRPS type B filament image processing.
Figure 1—figure supplement 4
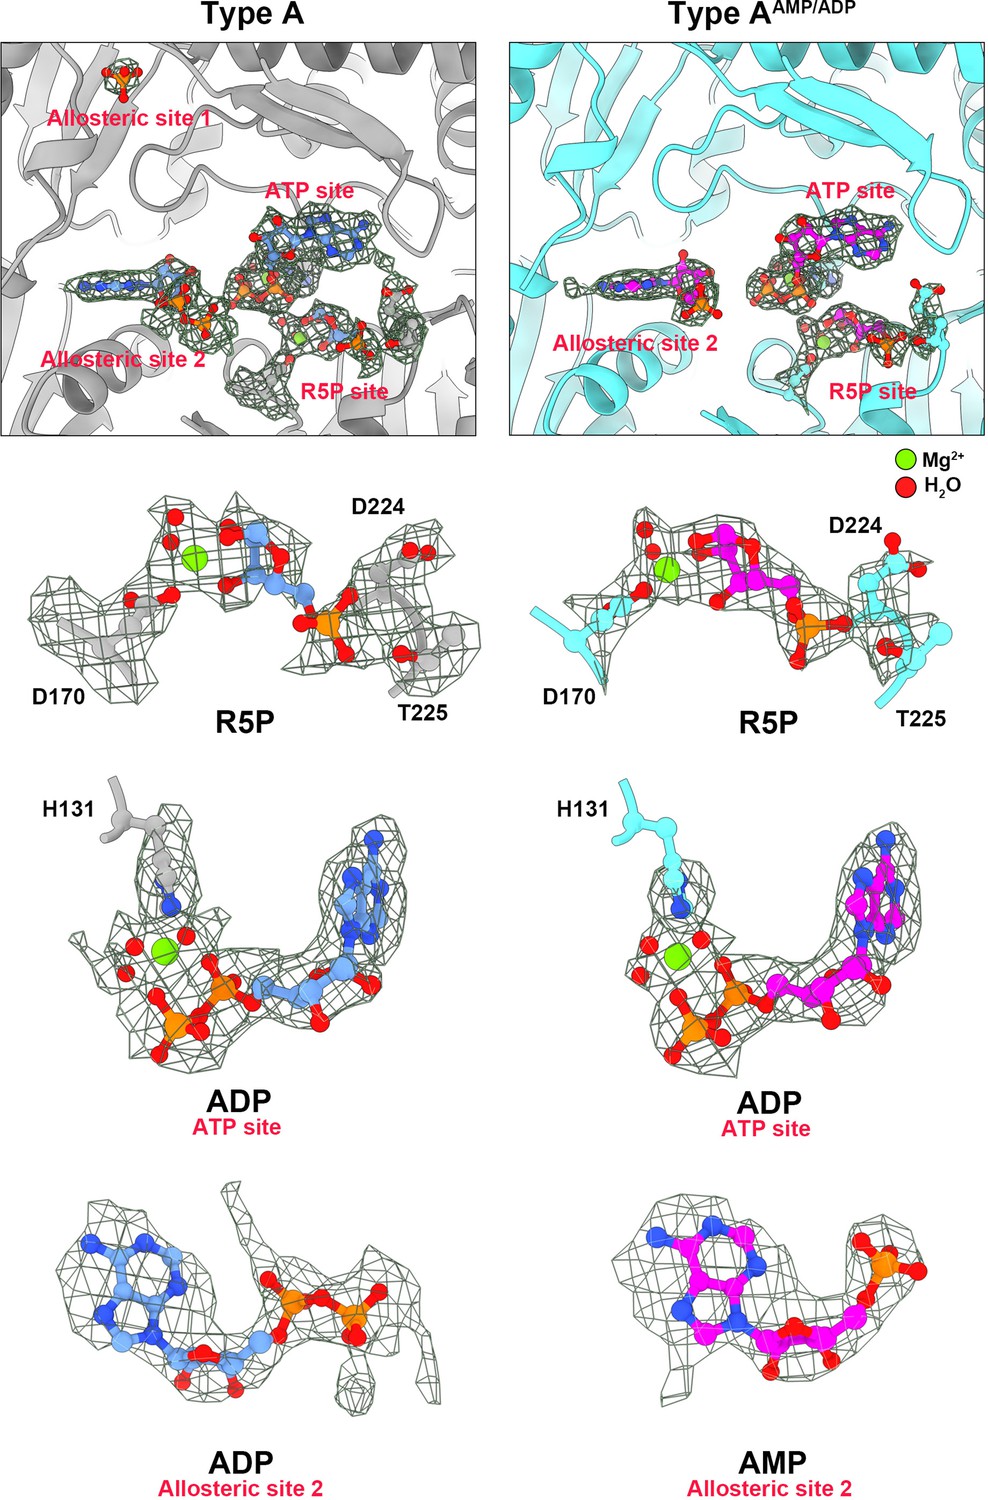
Electron density maps of type A and type AAMP/ADP in allosteric site and active site.
On the left are ligands of type A filament (chains are gray). On the right are ligands of type A AMP/ADP filament (chains are cyan). All ligands in the electron density map are listed separately. Red spheres indicate H2O and green spheres indicate Mg2+.
Figure 1—figure supplement 5
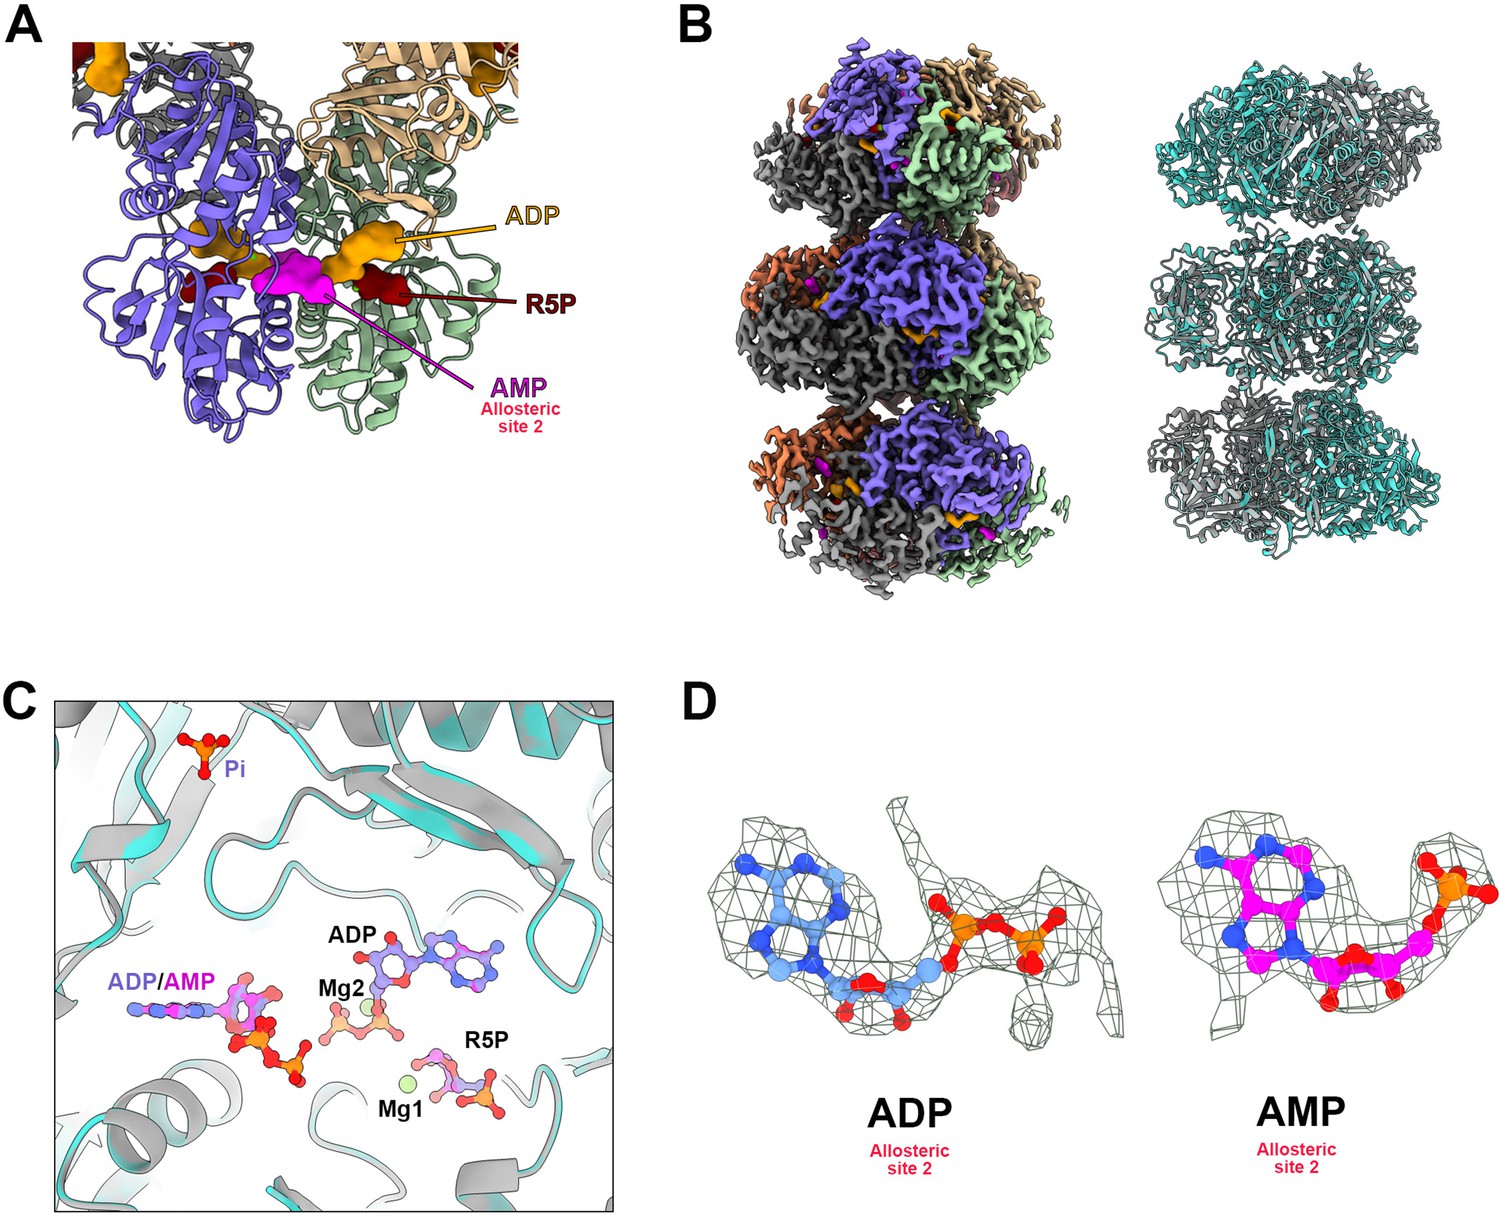
Structure analysis of PRPS type AAMP/ADP filament.
(A) The model of E. coli PRPS parallel dimer in type AAMP/ADP polymer . (B) Cryo-EM reconstruction of type AAMP/ADP (2.6 Å resolution) PRPS polymers (left). Comparison of overall structures of type A (gray) and type AAMP/ADP (cyan) filaments. (C) Comparison of ligands for type A (blue) and type AAMP/ADP (magenta) filaments. (D) Electron density map of ADP (type A) and AMP (type AAMP/ADP) in allosteric site 2.
Figure 1—figure supplement 6
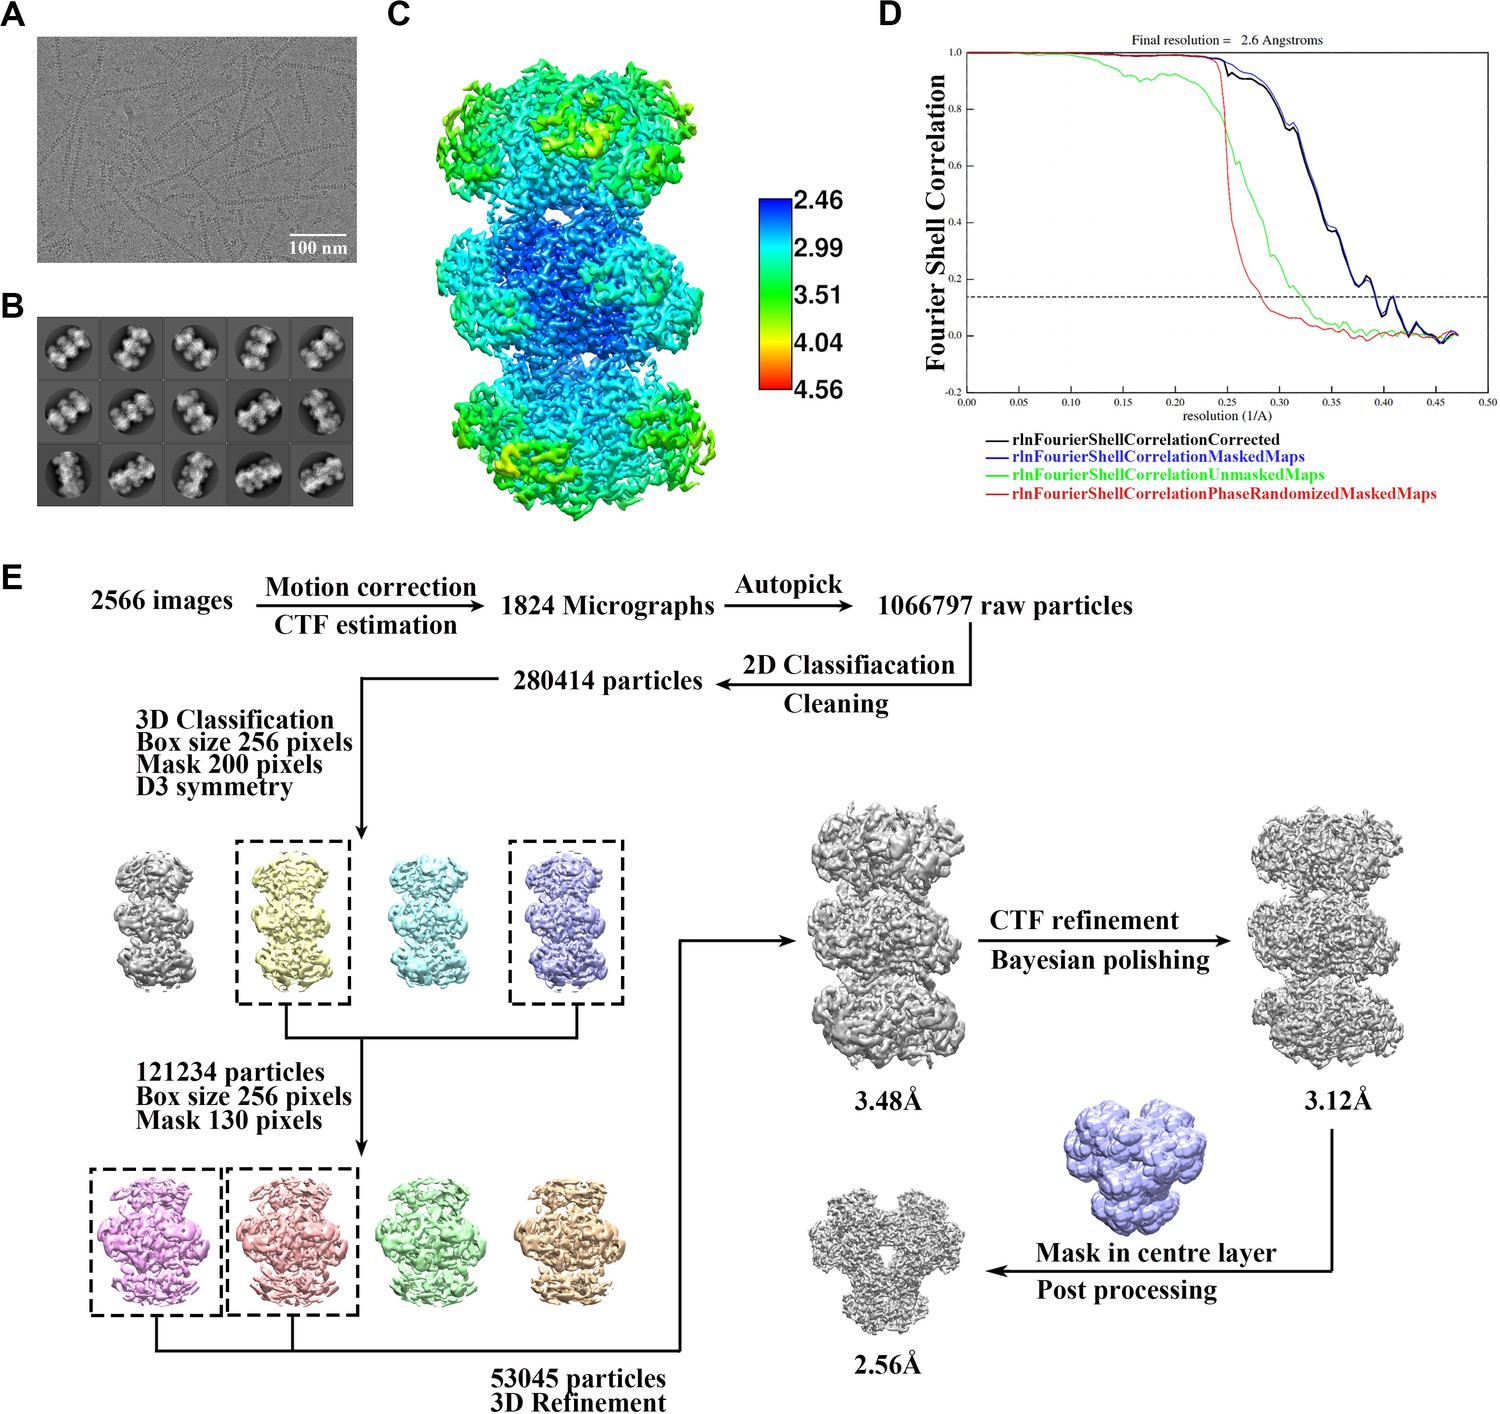
Cryo-EM data processing of PRPS type AAMP/ADP filament.
(A) Representative Cryo-EM image of PRPS type B filament. (B) Representative 2D averages of PRPS type AAMP/ADP filament in different views. (C) Local resolution of the type B filament final density map. (D) FSC curves of central hexamer in type AAMP/ADP filament density map (dash line shows FSC = 0.143). The final average resolution of hexamer is estimated to be 2.6 Å. (E) Flow chart of PRPS type AAMP/ADP filament image processing.
Figure 1—figure supplement 7
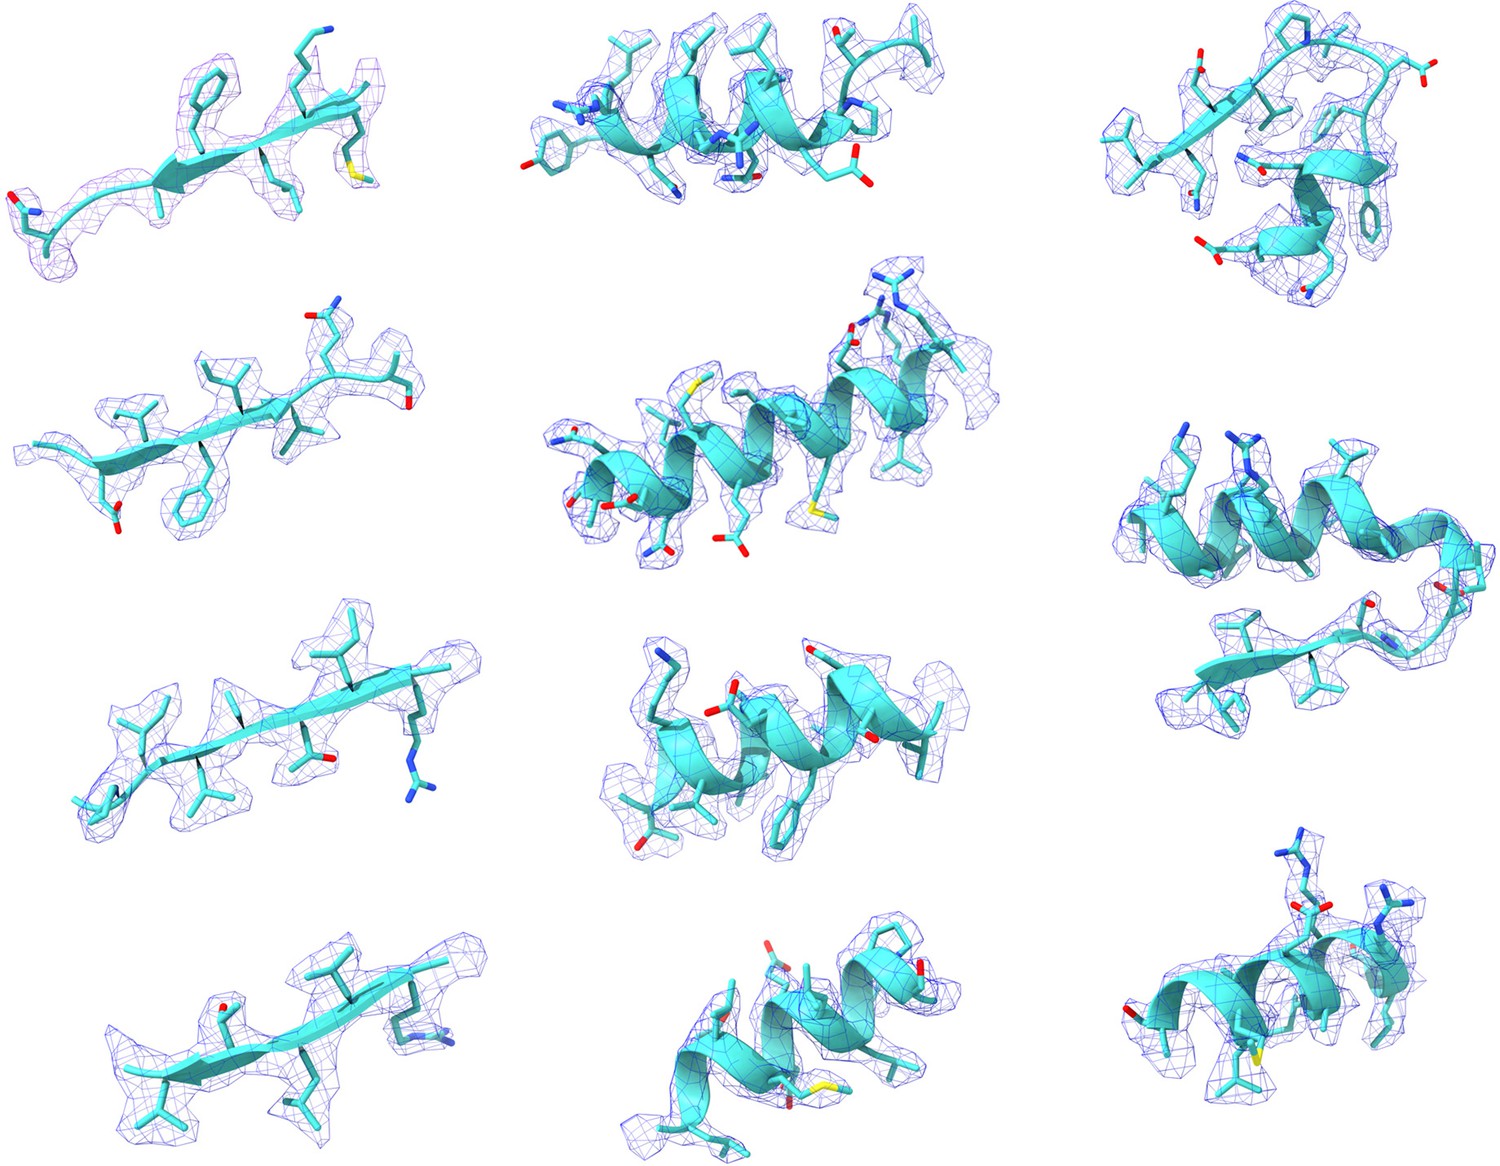
Representative Cryo-EM density maps of individual regions of the PRPS type A filament.
Figure 1—figure supplement 8
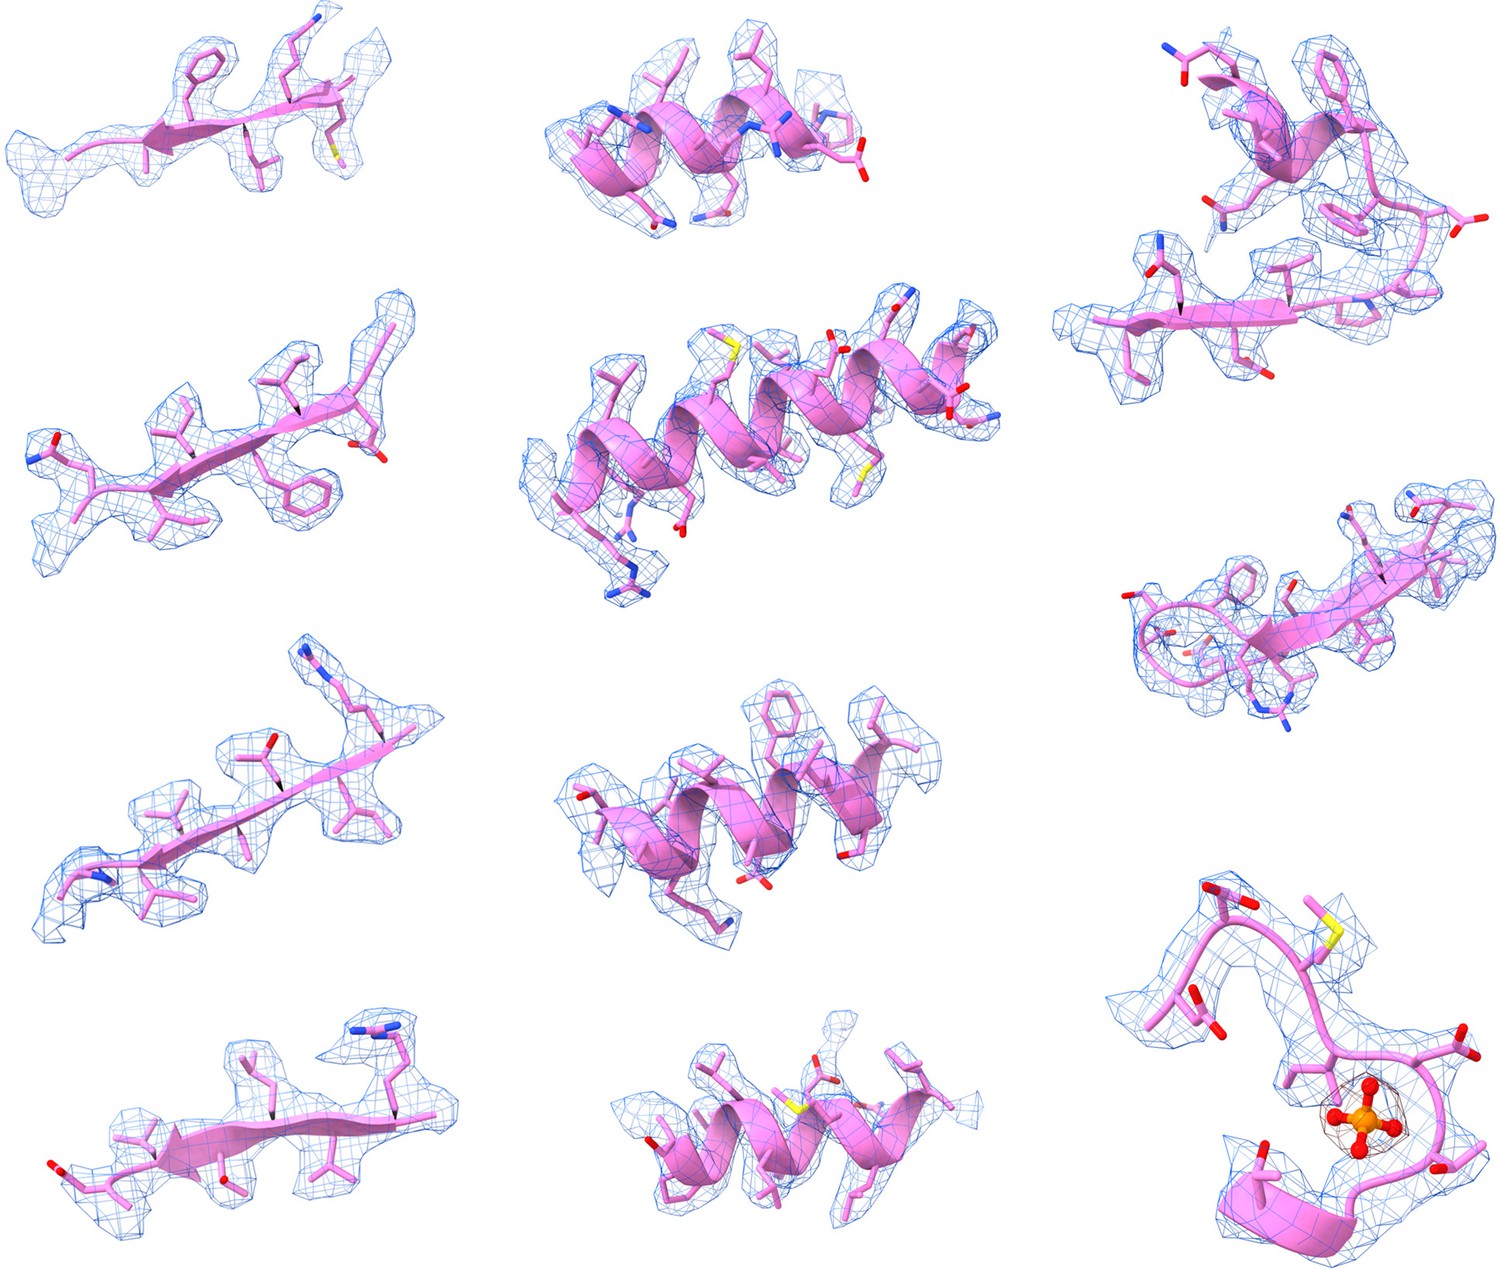
Representative Cryo-EM density maps of individual regions of the PRPS type B filament.
Figure 2 with 1 supplement
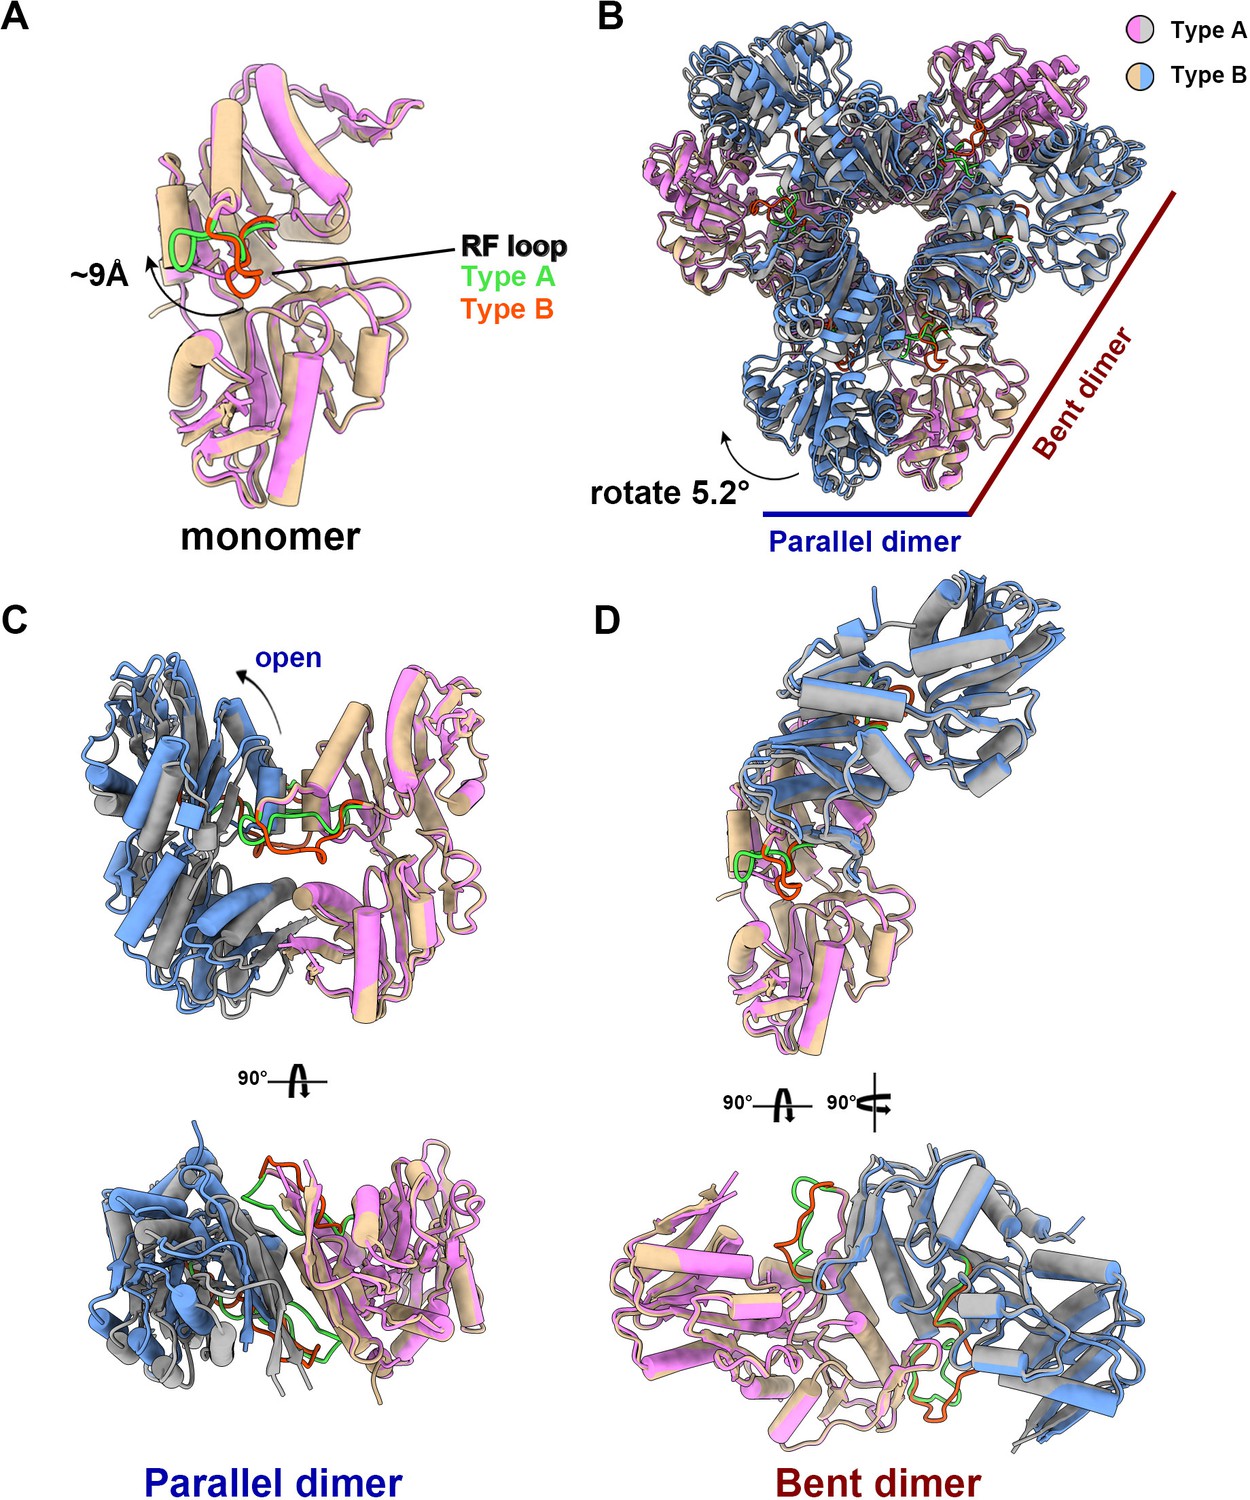
The structural comparison of E. coli PRPS type A and type B filaments.
(A) Monomers in the closed (pink for type A polymer) and open (yellow for type B polymer) hexamers. In the monomer of type A and type B polymers, the RF loop is green and red respectively. The shift of RF loop is about 9 Å. (B) Structural comparison of hexamers of the type A (pink and gray) and type B (yellow and blue). Structural comparison of parallel and bent dimers in of type A (C, pink and gray) and type B (D, yellow and blue) filament hexamers.
Figure 2—video 1
Structural transition of ecPRPS hexamer conformations in type A and type B polymers.
Morph from the ecPRPS hexamer of type A filament to the type B filament. RF loop is green (type A) and red (type B), respectively.
Figure 3 with 2 supplements

with 2 supplements.
Ligand binding modes in E. coli PRPS type A and type B filaments. (A) Hexamer of type A filament. Each chain is marked with a different color. (B) ADP and R5P are identified on the active site of PRPS in type A filament, while allosteric site 1 is bound by Pi and allosteric site 2 is bound by ADP. The residues that interact with ligands are indicated. Residues in chain A number with the # symbol and in chain C number with the * symbol. Residues in red are conserved in various organisms. Each chain is marked with a different color(dash lines in cyan indicate hydrogen bonds). (C) Ligands of the active site of type A filament. ADP and Mg2+ occupy ATP binding sites at active sites. R5P and Mg2+ can also be seen in the active site. Residues in red are conserved in various organisms. Each chain is marked with a different color. (D) ADP in allosteric site 2 of type A filament. Residues in red are conserved in various organisms. Each chain is marked with a different color. (E) Hexamer of type B filament. Each chain is marked with a different color. (F) In type B filament, the ATP binding site of the active site is not bound by any ligand, while the R5P binding site and allosteric site 1 are bound by Pi. Residues in chain A number with the # symbol and in chain C number with the * symbol. Residues in red are conserved in various organisms. Each chain is marked with a different color(dash lines in yellow indicate hydrogen bonds).
Figure 3—figure supplement 1
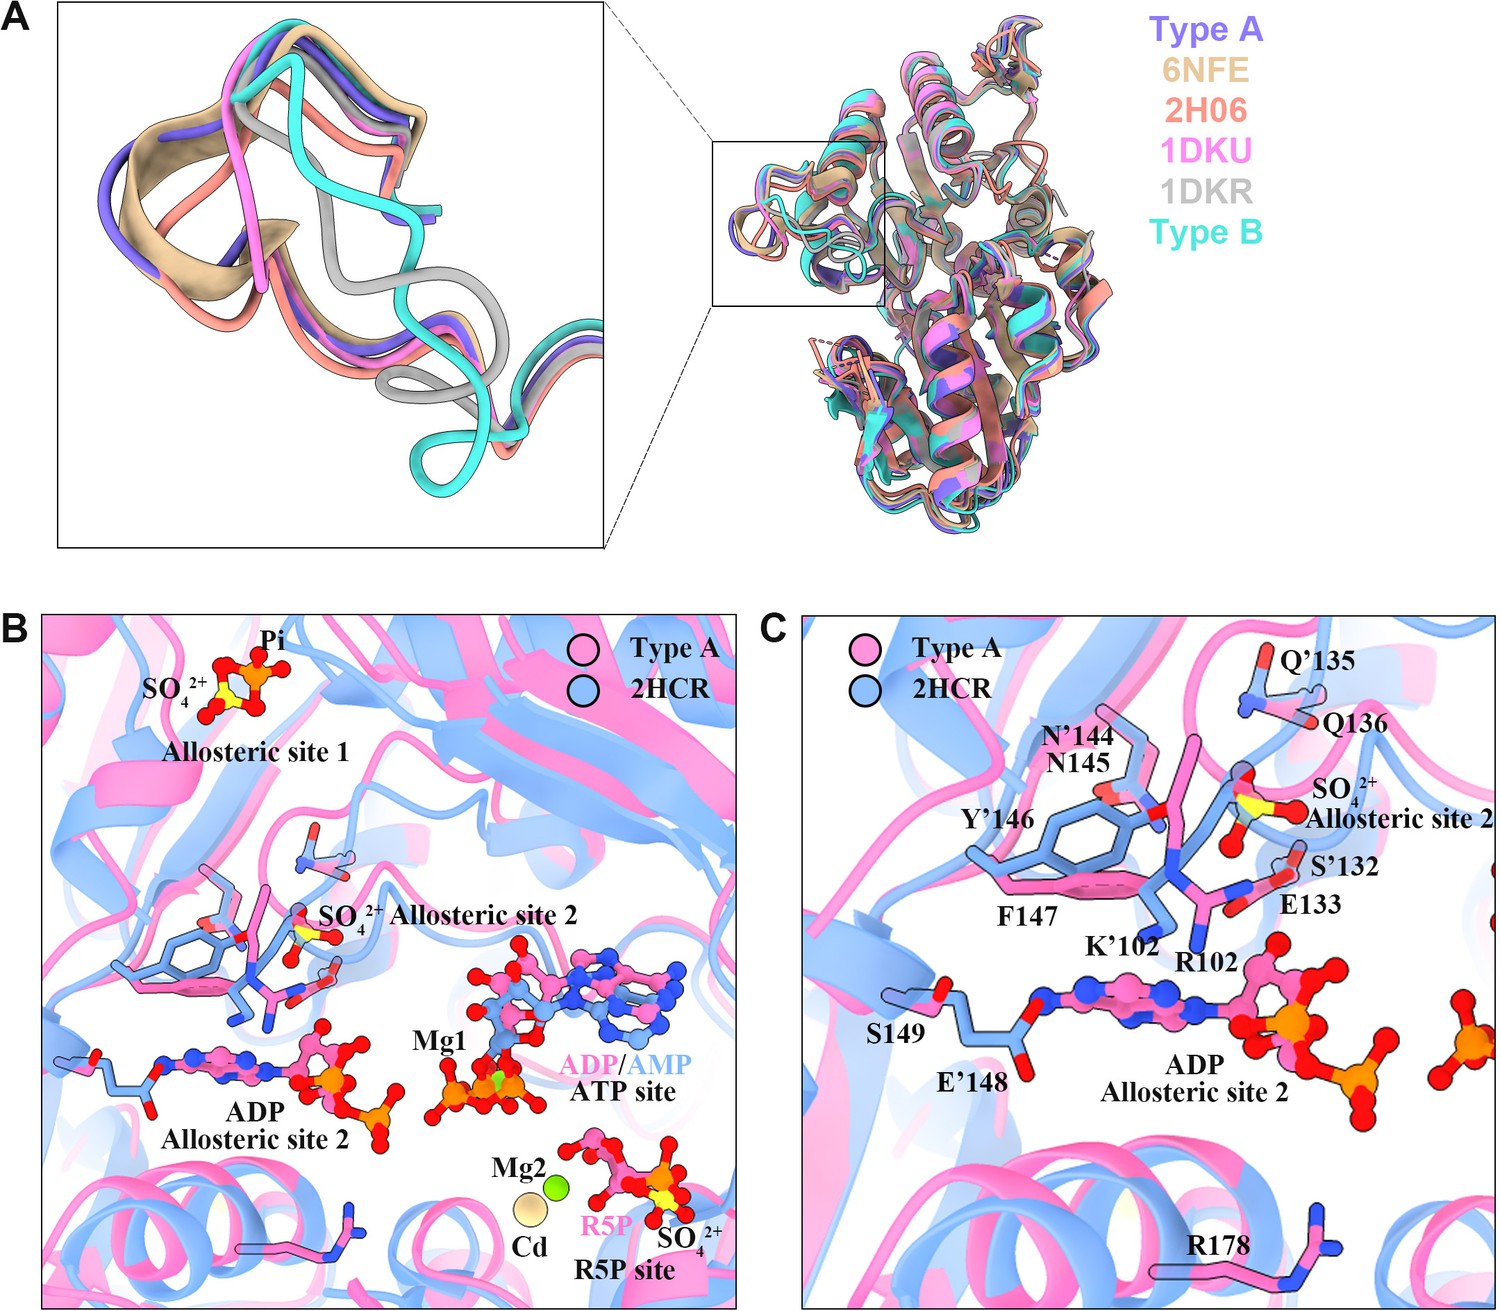
Structure comparison of PRPS in various organisms.
(A) Structural comparison of ecPRPS models in type A and type B polymers, Legionella pneumophila PRPS (6NFE), human PRPS1 (2H06), Bacillus subtilis PRPS (1DKU) bound with phosphomethylphosphonic acid adenosyl ester and methyl phosphonic acid adenosine ester, and Bacillus subtilis PRPS (1DKR) containing sulfate ion. (B and C) Structure comparison of ecPRPS models in type A polymers and human PRPS1(2HCR). Ligands of the active sites and allosteric sites were displayed in (B). In the structure of human PRPS1(2HCR), AMP occupy ATP binding sites, SO42+ and Cd2+ bind in the R5P binding region. SO42+ can also be seen in the allosteric site 1 and allosteric site 2. In the structure of ecPRPS hexamer in type A polymers, ADP and Mg2+ occupy ATP binding sites, R5P and Mg2+ bind in the R5P binding region. Pi bind in the allosteric site 1, and ADP can be seen in the allosteric site 2. (C) Structure comparison of the allosteric 2 in ecPRPS type A polymers and human PRPS1. The residues that interact with ligands are indicated. Residues in the human PRPS1 structure number with the ’ symbol.
Figure 3—figure supplement 2
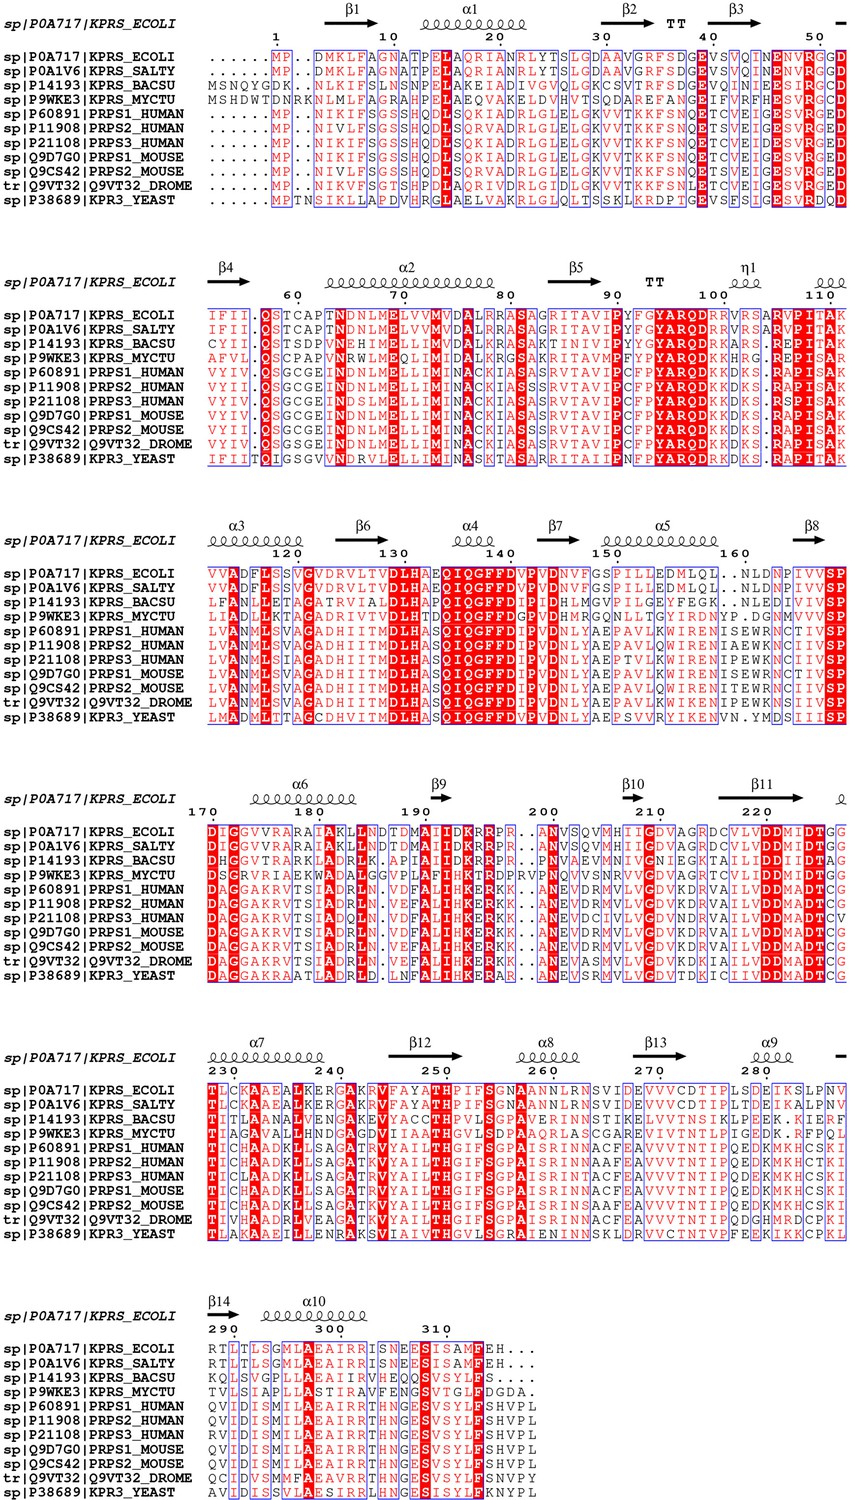
Comparison of PRPS sequences of various organisms.
Sequence alignment of Escherichia coli (strain K12), Salmonella typhimurium (strain LT2 /SGSC1412/ATCC 700720), Bacillus subtilis (strain 168), Mycobacterium tuberculosis (strain ATCC 25618/H37 Rv), Homo sapiens (Human), Mus musculus (Mouse) and Saccharomyces cerevisiae (strain ATCC 204508/S288 c) (Baker’s yeast). The conserved residues are indicated in red, and secondary structure elements are indicated above.
Figure 4
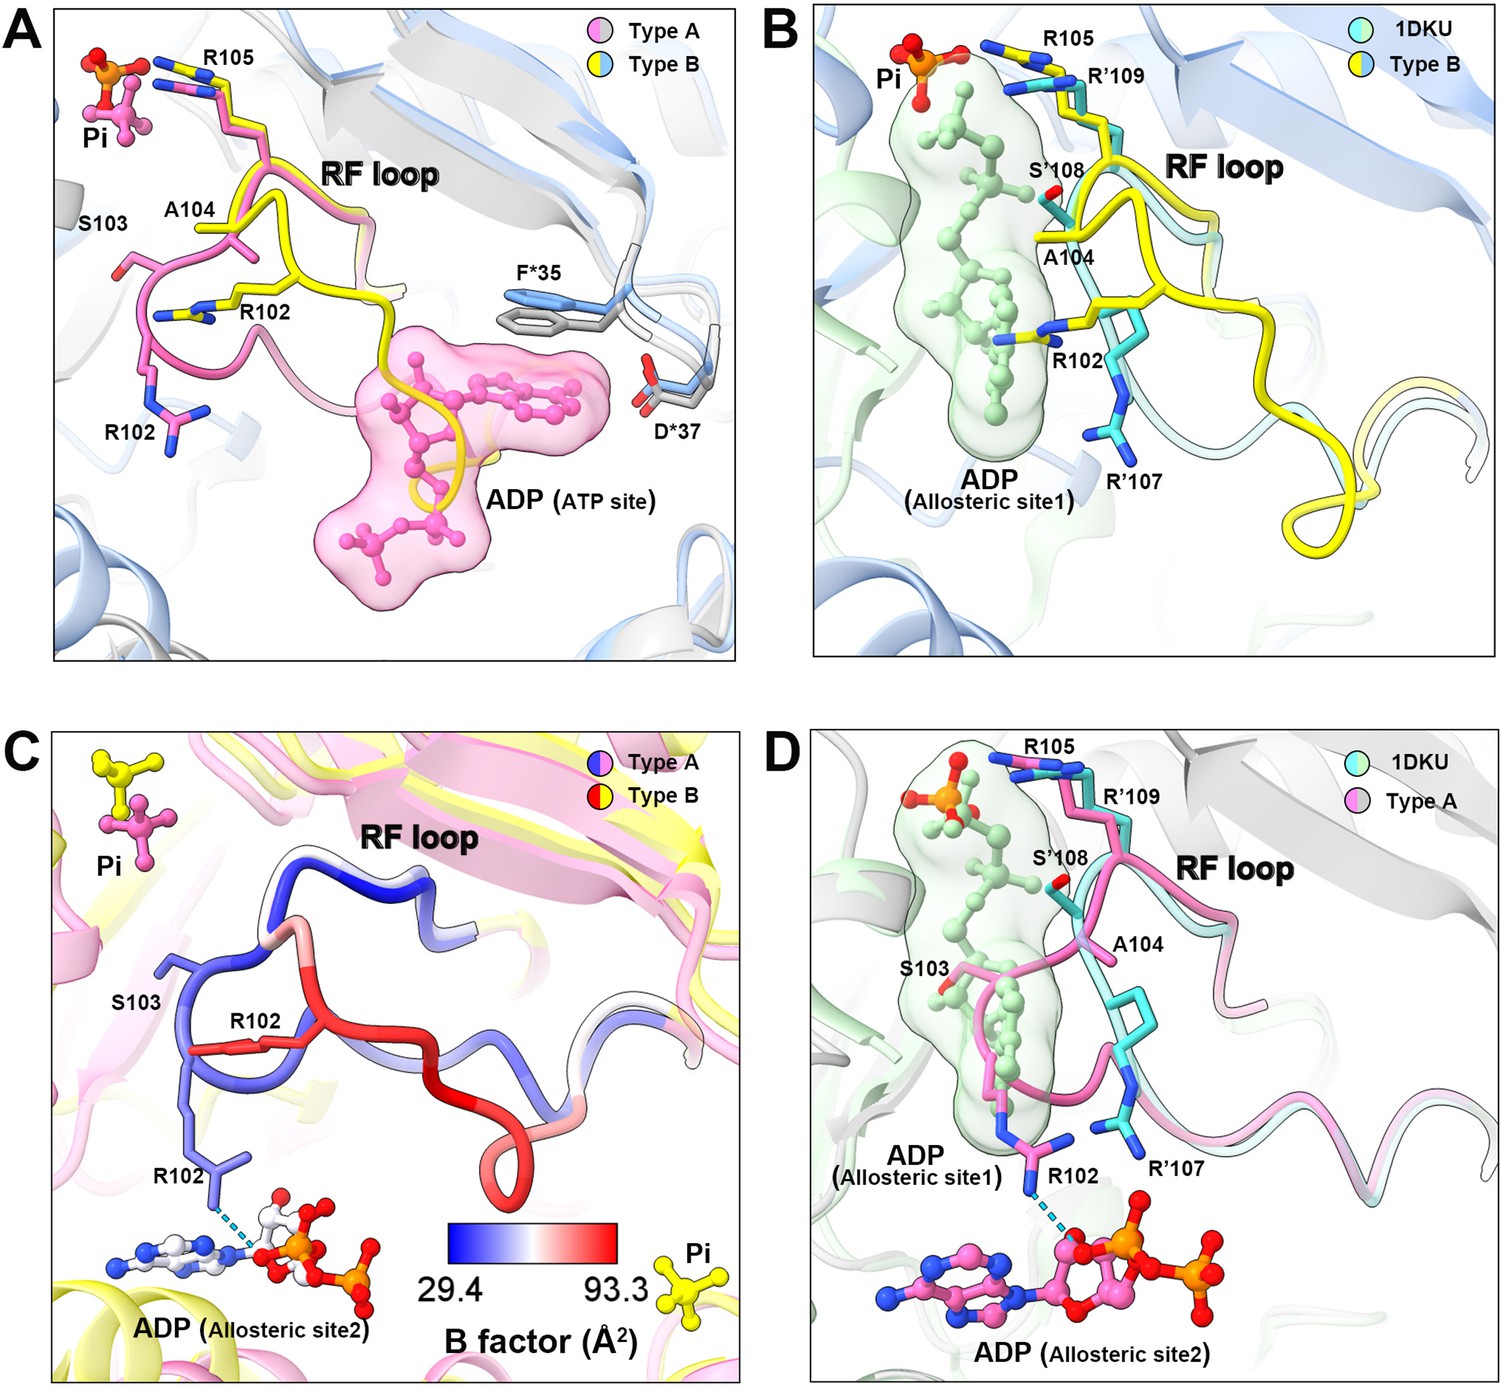
Conformational changes of the RF loop.
(A) Comparison of RF loop structures in type A (pink and gray) and type B (yellow and blue) filaments. In type B filament, the RF loop partially occupies the active site that blocks nucleotide binding. (B) Comparison of RF loop structures between type B filament and Bacillus substilis PRPS (PDB ID: 1DKU). Residues in 1DKU number with the ’ symbol. (C) B factors are shown on the RF loop of type A and type B filament models. (D) Structural comparison shows that the Bacillus substilis PRPS (PDB ID: 1DKU) model, the RF loop in type A filament overlaps with ADP at allosteric site 1. Residues in 1DKU number with the ’ symbol.
Figure 5

Distinct contacts of hexamers in E. coli PRPS type A and B filaments.
(A and B) Maps and models of type A (A) and type B (B) filaments reveal distinct interfaces between adjacent hexamers in the two types of filaments. Residues responsible for the interactions are indicated. Residues in another hexamer number with the * symbol.
Figure 6 with 1 supplement
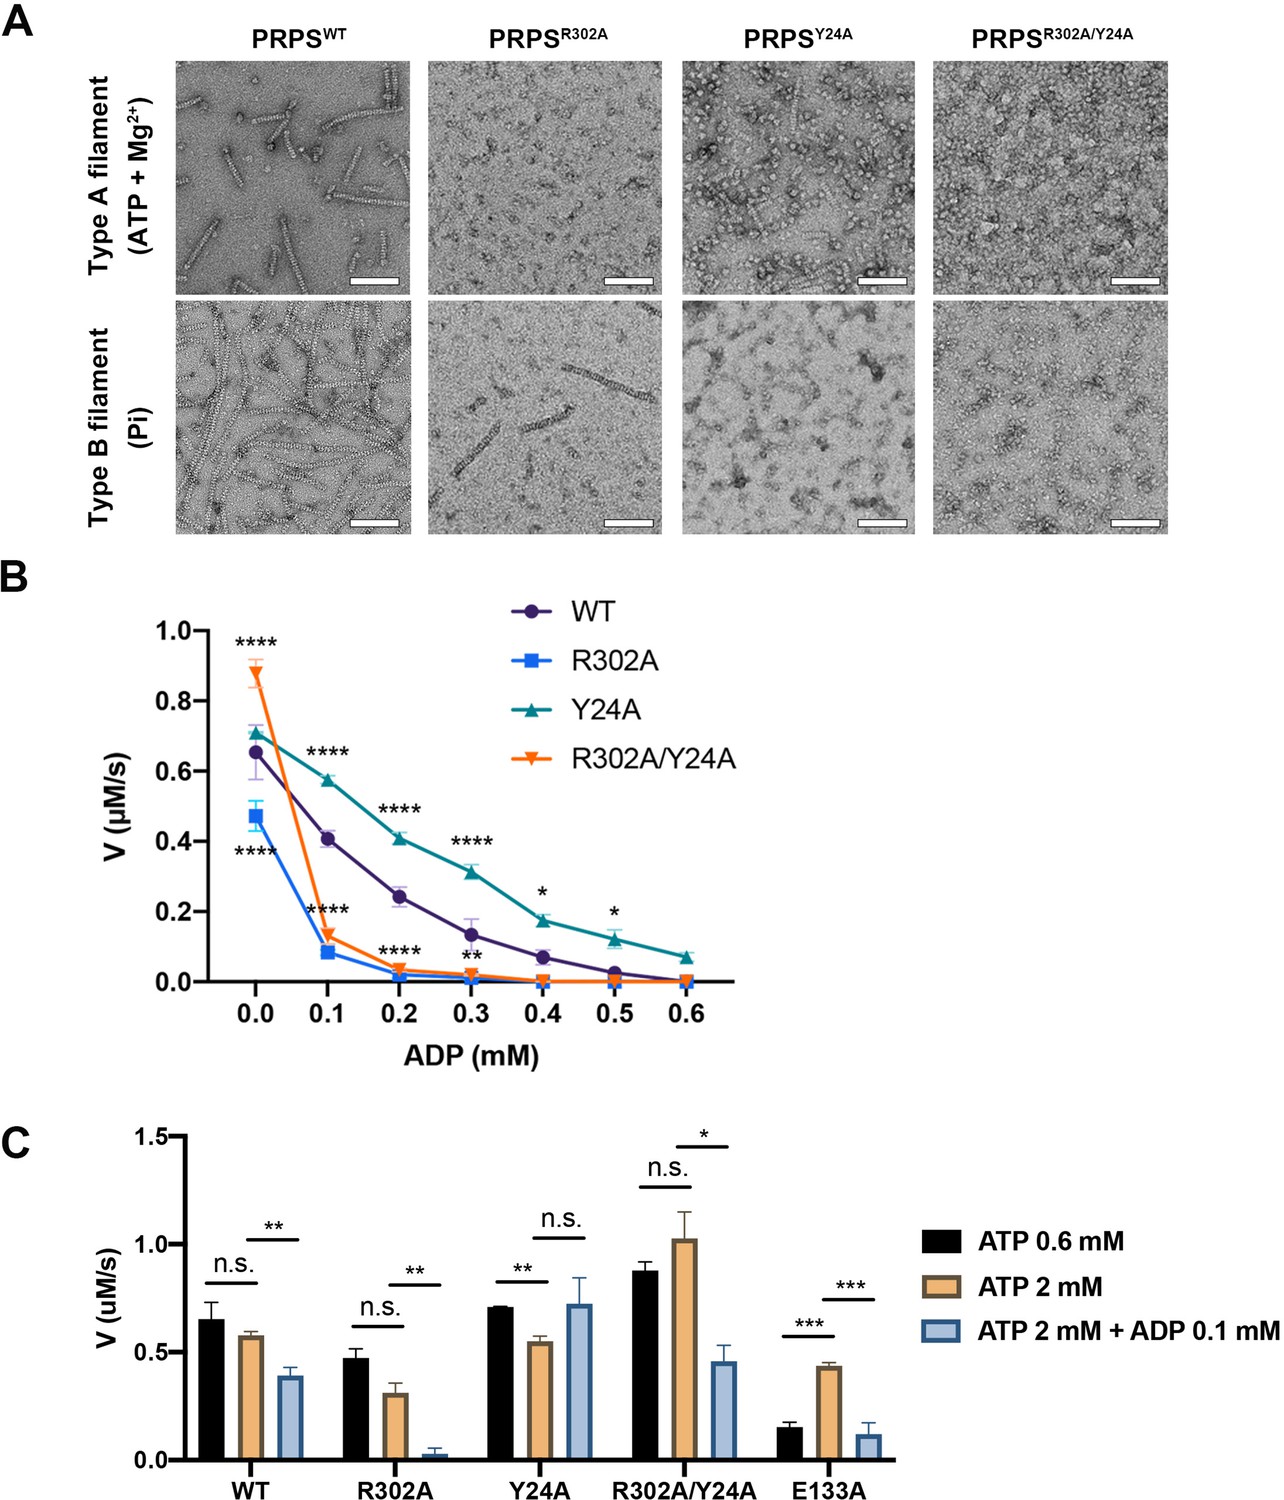
Filamentation regulates allosteric inhibition of E. coli PRPS.
(A) Under the condition of inducing type A and type B filaments, the negative staining electron microscopic images of wild-type and mutant E. coli PRPS. Scale bars = 100 nm. (B) The graph shows the catalytic activity of wild-type and mutant E. coli PRPS with various amounts of ADP (Tukey’s test). (C) Bar graph shows the catalytic activity of wild-type and mutant E. coli PRPS in the reaction mixtures containing different amounts of ATP and ADP (Student’s t-test). Error bars = standard error of the mean (S.E.M.). *p<0.05, ** p<0.01, *** p<0.001 and **** p<0.0001.
Figure 6—figure supplement 1
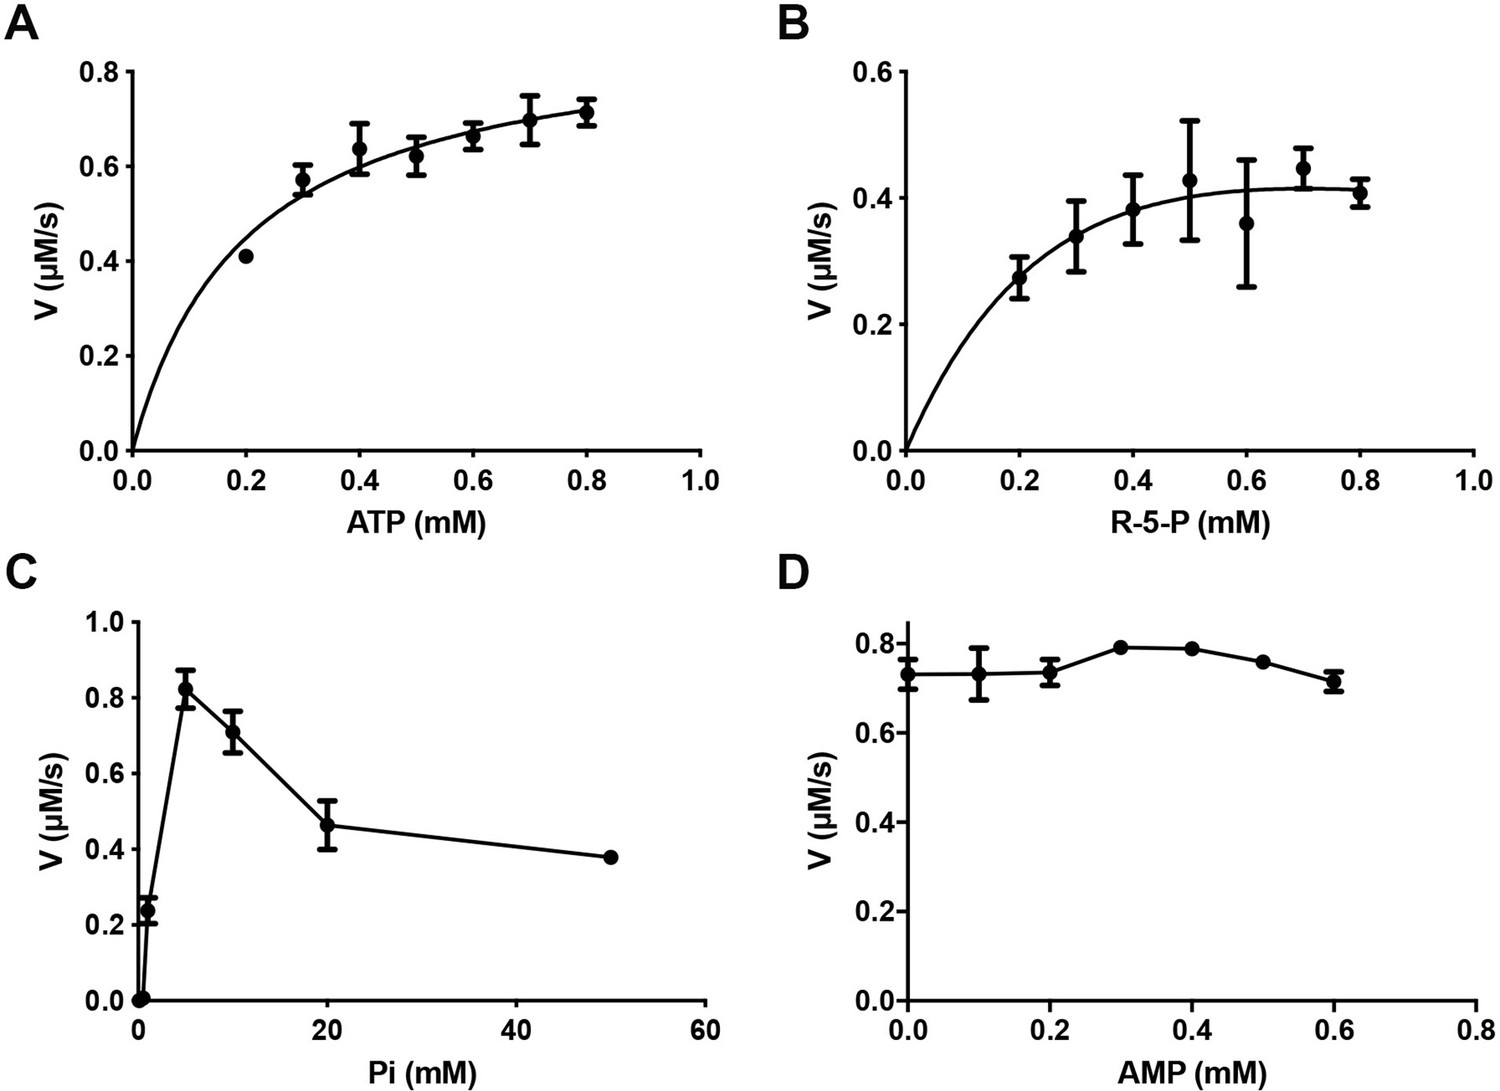
Catalytic activity of E. coli PRPS with different concentrations of ligands.
Graphs show the catalytic activity of wild-type E. coli PRPS in the presence of different amounts of ATP (A), R5P (B), phosphate ion (C), and AMP (D). Error bars = standard error of the mean (S.E.M.). All tests are repeated three times.
Figure 7
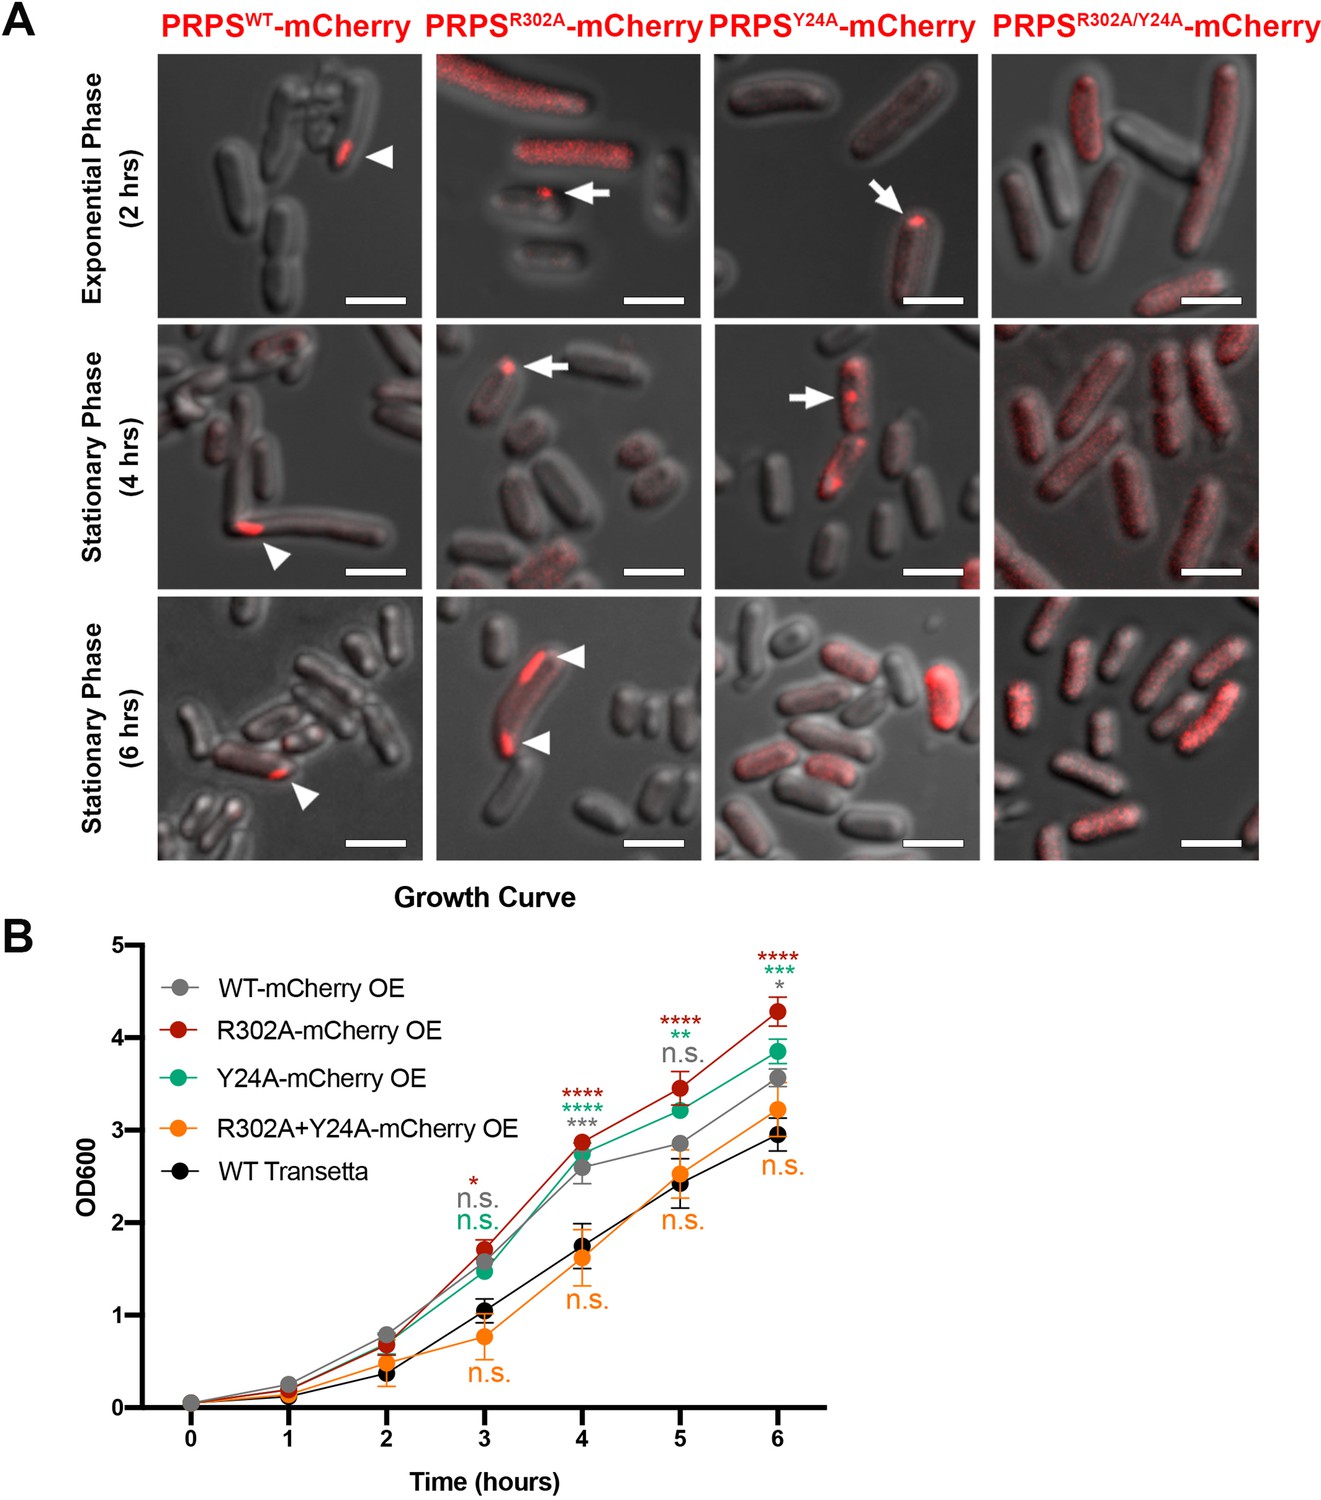
E. coli PRPS forms type A and type B filaments in vivo.
(A) Representative images of Transetta E. coli strains overexpressing wild-type PRPS-mCherry and mutant PRPS-mCherry fusion proteins. Filamentous cytoophidia and punctate aggregates are indicated by arrowheads and arrows, respectively. Scale bars = 2 μm. (B) Growth curves of wild-type Transetta cells and cells overexpressing wild-type PRPS-mCherry and mutant PRPS-mCherry fusion proteins (Tukey’s test). Error bars = S.E.M. *p<0.05, ** p<0.01, *** p<0.001 and **** p<0.0001.
Figure 8

Schematic model of regulation and function of E. coli PRPS filaments.
E. coli PRPS can form type A filament and type B filament to precisely regulate enzyme activity. ADP and phosphate (Pi) are allosteric regulators of PRPS. They can bind at allosteric sites or active sites. When incubated with ATP, ADP or AMP and R5P and Mg2+, PRPS can form type A filament to disrupt allosteric inhibition. When incubated with Pi, PRPS can form type B filament to increase allosteric inhibition.
Tables
Table 1
Statistics of Cryo-EM structures in this study.
| ecPRPS type A filament | ecPRPS type B filament | ecPRPS type AAMP/ADP filament | |
|---|---|---|---|
| (EMD-33305, PDB 7XMU) | (EMD-33309, PDB 7XN3) | (EMD-33306, PDB 7XMV) | |
| Data collection and processing | |||
| EM equipment | Titan Krios | Titan Krios | Titan Krios |
| Detector | K3 camera | K3 camera | K3 camera |
| Magnification | 22,500 x | 22,500 x | 22,500 x |
| Voltage (kV) | 300 | 300 | 300 |
| Electron exposure ((e–/Å2)) | 60 | 60 | 60 |
| Defocus range(μm) | –1.0 to –2.5 | –1.0 to –2.5 | –1.0 to –2.5 |
| Pixel size(Å) | 0.53 | 0.53 | 0.53 |
| Symmetry imposed | D3 | D3 | D3 |
| Number of collected movies | 3,474 | 3,131 | 2,566 |
| Initial particle images (no.) | 887,654 | 1186879 | 1066797 |
| Final particle images (no.) | 70,541 | 168,218 | 53,045 |
| Map resolution (Å) | 2.3 | 2.9 | 2.6 |
| FSC threshold | 0.143 | 0.143 | 0.143 |
| Map resolution range (Å) | 2.3–3.4 | 2.8–4.7 | 2.5–4.6 |
| Refinement | |||
| Initial model used (PDB code) | 4S2U | 4S2U | 4S2U |
| Map sharpening B-factor(Å2) | –45 | –98 | –51 |
| Model composition | |||
| Non-hydrogen atoms | 15,294 | 14,016 | 15,228 |
| Protein residues | 1,842 | 1,830 | 1,842 |
| Ligands | ADP, HSX, PO4, MG | PO4 | AMP, HSX, ADP, MG |
| Waters | 822 | 54 | 810 |
| Ions | 18 | 12 | 12 |
| B factors(Å2) | |||
| Protein | 49 | 65 | 57 |
| Ligand | 55 | 67 | 58 |
| Water | 50 | 57 | 57 |
| R.m.s. deviations | |||
| Bond lengths (Å) | 0.005 | 0.005 | 0.008 |
| Bond angles (°) | 0.736 | 0.609 | 0.800 |
| Validation | |||
| MolProbity score | 1.48 | 2.11 | 1.58 |
| Clashscore | 4.23 | 6.13 | 5.31 |
| Poor rotamers (%) | 1.57 | 2.37 | 1.18 |
| Ramachandran plot | |||
| Favored (%) | 97.36 | 92.08 | 96.37 |
| Allowed (%) | 2.64 | 7.92 | 3.63 |
| Disallowed (%) | 0 | 0 | 0 |
Key resources table
| Reagent type (species) or resource | Designation | Source or reference | Identifiers | Additional information |
|---|---|---|---|---|
| Gene (Drosophila melanogaster) | PRPS | Genbank | P0A717 | |
| Strain, strain background (Escherichia coli) | Transetta (DE3) | TransGen Biotech | ||
| Recombinant DNA reagent | pRSFDuet-6His | In house | ||
| Commercial assay or kit | BCA Protein Concentration Determination Kit (Enhanced) | Beyotime | P0010 | |
| Chemical compound, drug | Benzamidine hydrochloride | Sigma-Aldrich | 434760–5 G | |
| Chemical compound, drug | Pepstatin A | Sigma-Aldrich | P5318-25MG | |
| Chemical compound, drug | Leupeptin hydrochloride microbial | Sigma/Aldrich | L9783-100MG | |
| Chemical compound, drug | PMSF | MDBio | P006-5g | |
| Chemical compound, drug | Ni-NTA Agarose | QIAGEN | 30,250 | |
| Chemical compound, drug | Orotic acid | Adamas | 01102798 (74736A) | |
| Chemical compound, drug | ATP | Takara | 4,041 | |
| Chemical compound, drug | D-Ribose 5 phosphate disodium salt | BIOSYNTH CARBOSYNTH | R-5600 | |
| Chemical compound, drug | 5-phospho-D-ribose 1-diphosphate penta-sodium salt | Sigma | P8296-25 mg | |
| Chemical compound, drug | Adenosine 5'-monophosphate | solarbio | A9860-1 | |
| Chemical compound, drug | Adenosine 5'-diphosphate sodium salt | Sigma | A2754-100MG | |
| Other | Nitinol mesh | Zhenjiang Lehua Electronic Technology | M024-Au300-R12/13 | Cryo-EM grid preparation |
| Other | Holey Carbon Film | Quantifoil | R1.2/1.3, 300 Mesh, Cu | Cryo-EM grid preparation |
| Other | 400 mesh reinforced carbon support film | EMCN | BZ31024a | Negative staining |
| Software, algorithm | UCSF Chimera | https://doi.org/10.1002/jcc.20084 | https://www.cgl.ucsf.edu/chimera | |
| Software, algorithm | UCSF Chimera X | https://doi.org/10.1002/pro.3235 | https://www.cgl.ucsf.edu/chimerax/ | |
| Software, algorithm | Relion | https://doi.org/10.7554/eLife.42166 | https://relion.readthedocs.io/en/latest/index.html# | |
| Software, algorithm | Coot | https://doi.org/10.1107/S0907444910007493 | https://www2.mrc-lmb.cam.ac.uk/personal/pemsley/coot/ | |
| Software, algorithm | Phenix | https://doi.org/10.1107/S2059798318006551 | https://phenix-online.org/ |
Additional files
Download links
A two-part list of links to download the article, or parts of the article, in various formats.
Downloads (link to download the article as PDF)
Open citations (links to open the citations from this article in various online reference manager services)
Cite this article (links to download the citations from this article in formats compatible with various reference manager tools)
Filamentation modulates allosteric regulation of PRPS
eLife 11:e79552.
https://doi.org/10.7554/eLife.79552


