Diverse states and stimuli tune olfactory receptor expression levels to modulate food-seeking behavior
- Picower Institute for Learning and Memory, Department of Brain and Cognitive Sciences, Massachusetts Institute of Technology, United States
- MIT Biology Graduate Program, Massachusetts Institute of Technology, United States
- Department of Biology and Biotechnology, Worcester Polytechnic Institute, United States
Figures
Figure 1 with 1 supplement
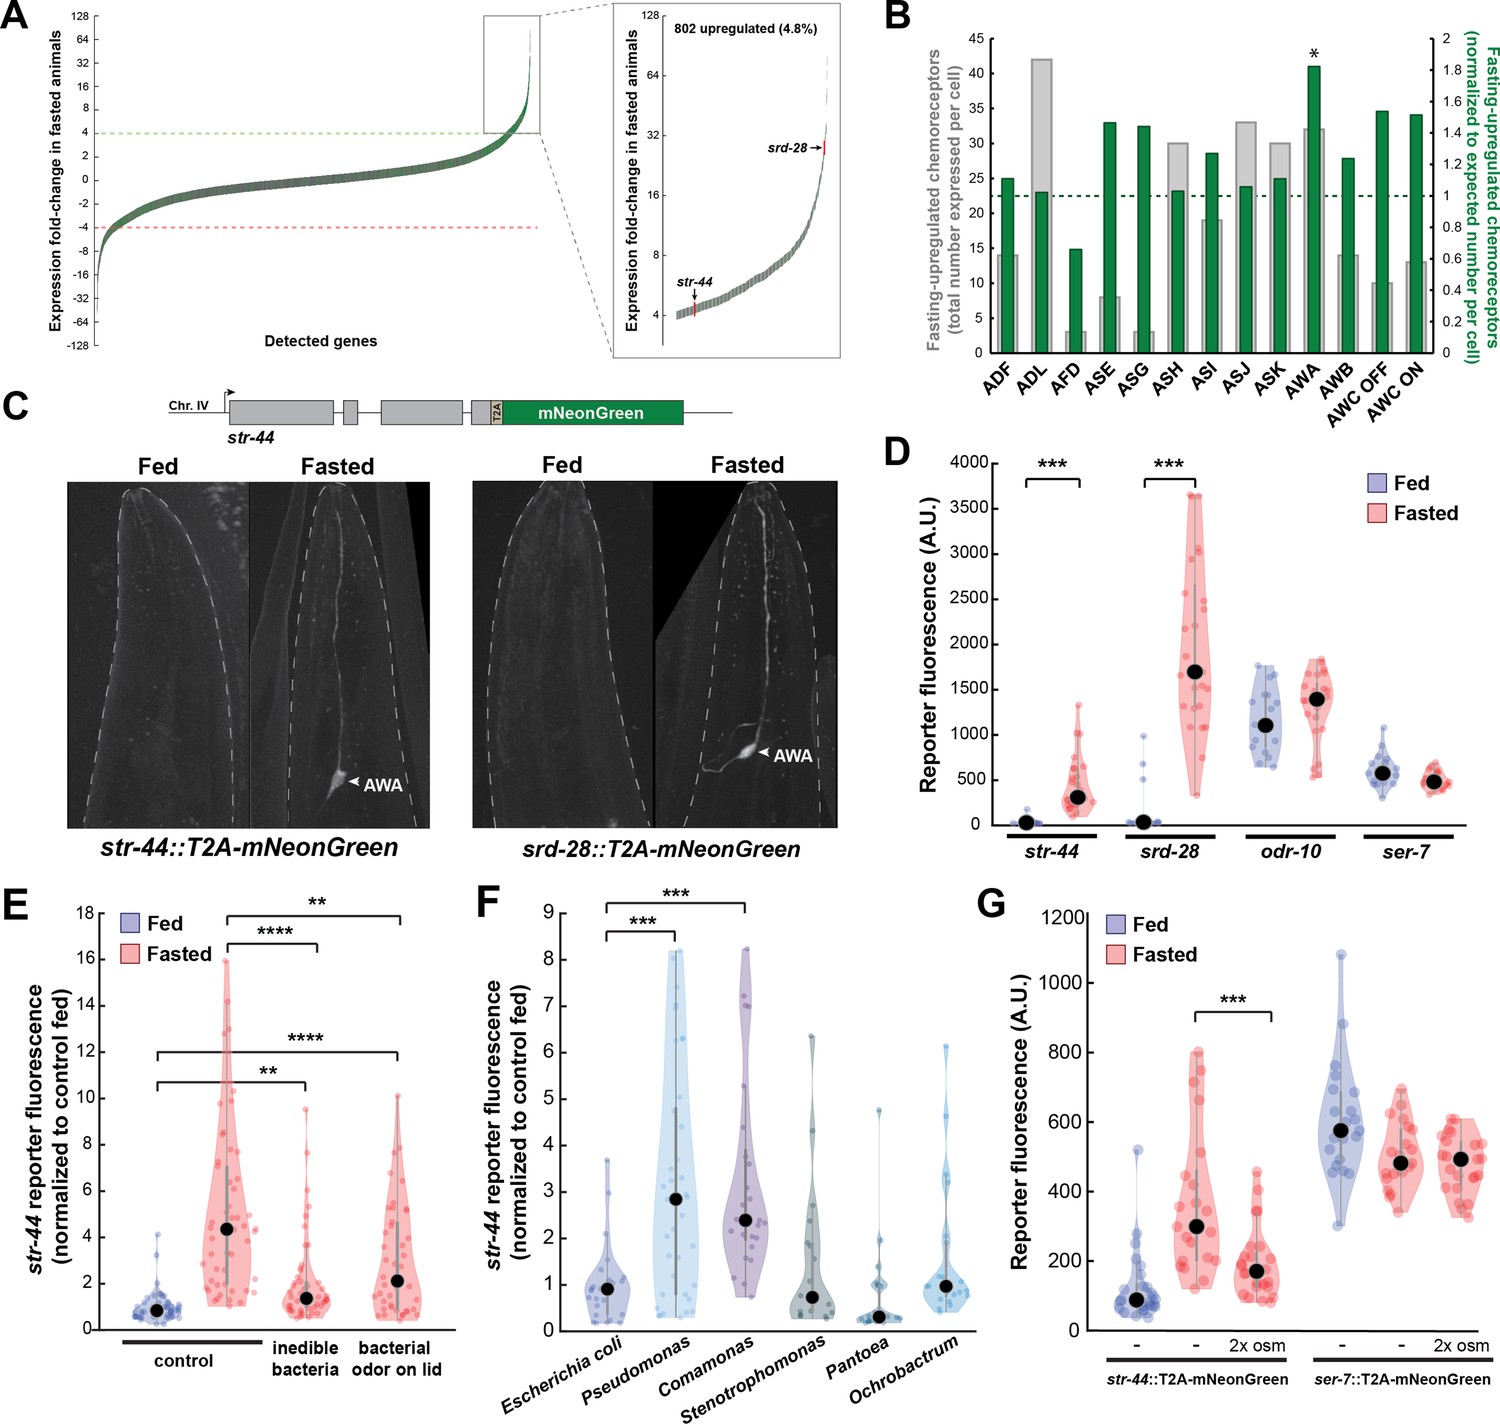
Diverse states and stimuli influence the expression of chemosensory G-protein-coupled receptors (GPCRs) in the AWA olfactory neuron.
(A) Fold-change of transcript levels for all detected genes (n = 16,591) after 3 hr of fasting compared to well-fed condition. Dashed lines represent the fold-change cutoff for upregulated (green) or downregulated (red) genes. Green: chemoreceptors; gray: all other genes. Inset: zoomed view of upregulated genes. (B) Number of upregulated chemoreceptors in each of the 12 amphid neurons, based on the CeNGEN expression database. Gray bars: total number of upregulated chemoreceptor genes expressed per neuron. Dark green bars: fraction of upregulated chemoreceptors per neuron, divided by the fraction of all chemoreceptors expressed in that neuron (i.e., enrichment of fasting-upregulated chemoreceptors in each neuron, compared to number expected by chance based on total number of chemoreceptors in the neuron). *p<0.05, Bonferroni-corrected chi-squared test. (C) Top: endogenous CRISPR/Cas9 tagging strategy to visualize chemoreceptor gene expression in vivo, in which a T2A-mNeonGreen reporter sequence was inserted immediately before the stop codon. Bottom: example images of reporter strains in fed and fasted states. AWA neuron is indicated by arrowhead. (D) Quantification of chemoreceptor reporter gene fluorescence for two state-dependent chemoreceptors (str-44 and srd-28), the known AWA chemoreceptor odr-10, and a control GPCR (ser-7) that is not upregulated by fasting. Note that there is no significant difference between fed and fasted for odr-10 and ser-7 reporters. (E) Relative expression of str-44::T2A-mNeonGreen in animals fed or fasted for 3 hr, animals exposed to inedible aztreonam-treated bacteria for 3 hr, and animals fasted in the presence of odors from an unreachable bacterial lawn (on lid of plate). (F) Relative expression of str-44::T2A-mNeonGreen in animals reared on E. coli (OP50) then fed on different bacteria for 3 hr. Bacterial strains used: OP50 (E. coli), PA14 (Pseudomonas), DA1877 (Comamonas), JUb19 (Stenotrophomonas), BIGb0393 (Pantoea), and Myb71 (Ochrobactrum). (G) Expression of str-44::T2A-mNeonGreen and ser-7::T2A-mNeonGreen (negative control) fed, fasted for 3 hr, or fasted on 300 mOsm plates (nematode growth medium [NGM] supplemented with an extra 150 mM sorbitol). Note that there is no significant effect of mild osmotic stress on the ser-7 reporter. For (D–G), colored dots represent measurements from individual cells, black dots represent median values, and shaded area shows kernel density estimation for the data. Each condition measured in two independent sessions. ***p<0.001, **p<0.01, *p<0.05, two-tailed t-test with Bonferroni correction.
Figure 1—figure supplement 1
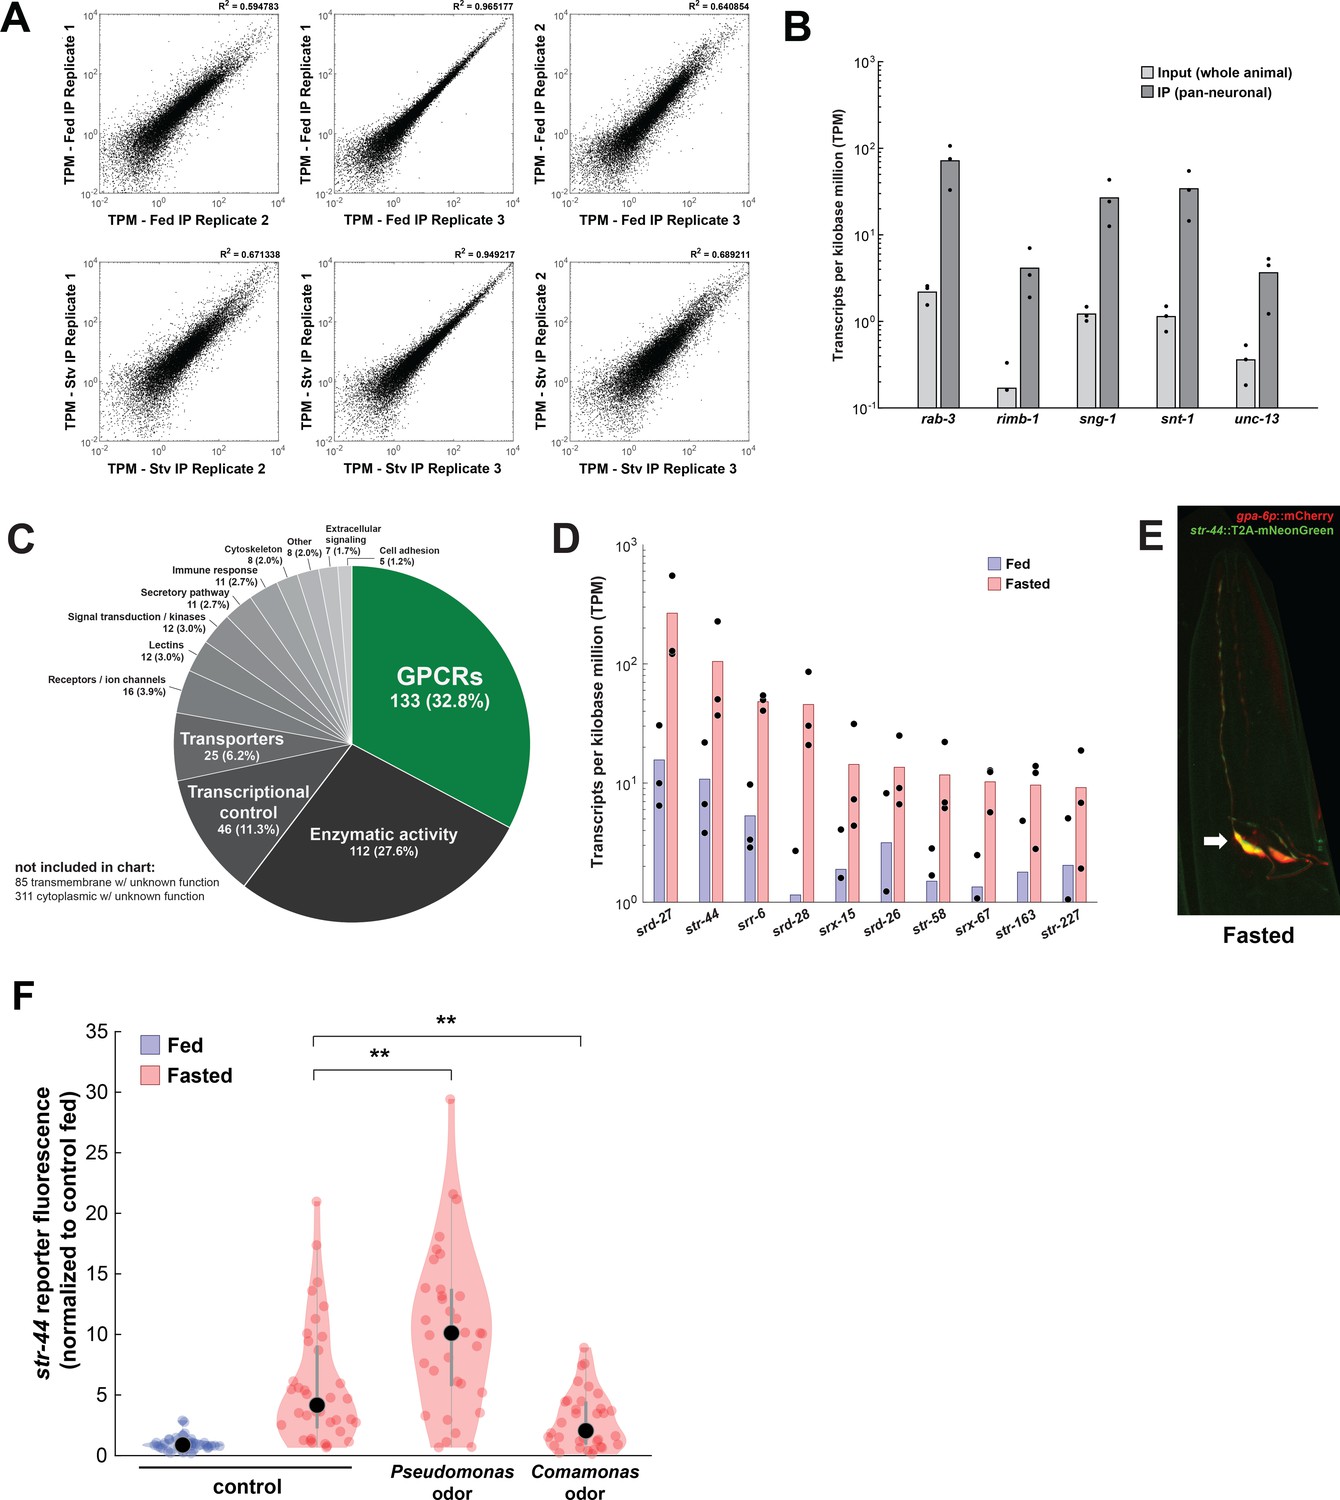
Identification of genes upregulated by fasting with pan-neural ribotagging.
(A) Correlation of expression values (shown as transcripts per kilobase million [TPM]) between each of three biological replicates of pan-neural ribotagging from well-fed (top row) and fasted (bottom row) animals. (B) Transcript levels of known pan-neuronal genes in input and pan-neural ribotagging samples, indicating enrichment of neuronal mRNAs in ribotag transcripts. (C) Pie chart showing gene ontology for genes upregulated by fasting. There is a significant enrichment of chemosensory G-protein-coupled receptors (GPCRs) compared to the overall prevalence of chemosensory GPCRs across the genome (p<0.001, Fisher’s exact test). (D) Expression levels (as TPM) for the top 10 fasting-upregulated chemoreceptors predicted to be expressed in AWA. Dots: measurement in each of three biological replicates; bars: means of replicates. Replicates not shown had no detected expression for that gene. (E) Co-expression of the AWA marker gpa-6p::mCherry (red) with the str-44::T2A-mNeonGreen (green) reporter in a fasted animal. Arrow indicates one of the two AWA neurons; str-44 is expressed in both left and right AWA neurons. (F) Relative expression of str-44::T2A-mNeonGreen in animals that were well-fed, fasted for 3 hr, or fasted for 3 hr in the presence of the inaccessible odors from the indicated bacterial species on the lid of the plate. str-44::mNeonGreen reporter expression was increased significantly compared to E. coli OP50 controls when animals were fed DA1877 or PA14 (Figure 1F). These changes could be due to differences in sensory cues and/or metabolic contents of these bacteria. To distinguish between these possibilities, we compared those results to conditions where the odors from these bacteria were present, but the bacteria could not be consumed, shown here. As is shown, adding PA14 odors on the lid of the plate increased str-44 reporter fluorescence beyond the levels in fasted controls, similar to when animals consumed PA14. This suggests that PA14 volatiles alone can increase str-44 expression. Adding DA1877 odors on the lid of the plate decreased str-44 expression compared to animals fasted without any bacterial odors. This result contrasts with our finding that edible DA1877 increased str-44 expression (Figure 1F) and suggests that DA1877 odors and metabolic contents drive opposing effects on str-44 expression, with odors decreasing str-44 expression and metabolic contents increasing it. **p<0.01 by two-tailed t-test with Bonferroni correction. Colored dots represent individual cells, black dots represent median values, and shaded area shows kernel density estimation for the data.
Figure 2 with 1 supplement
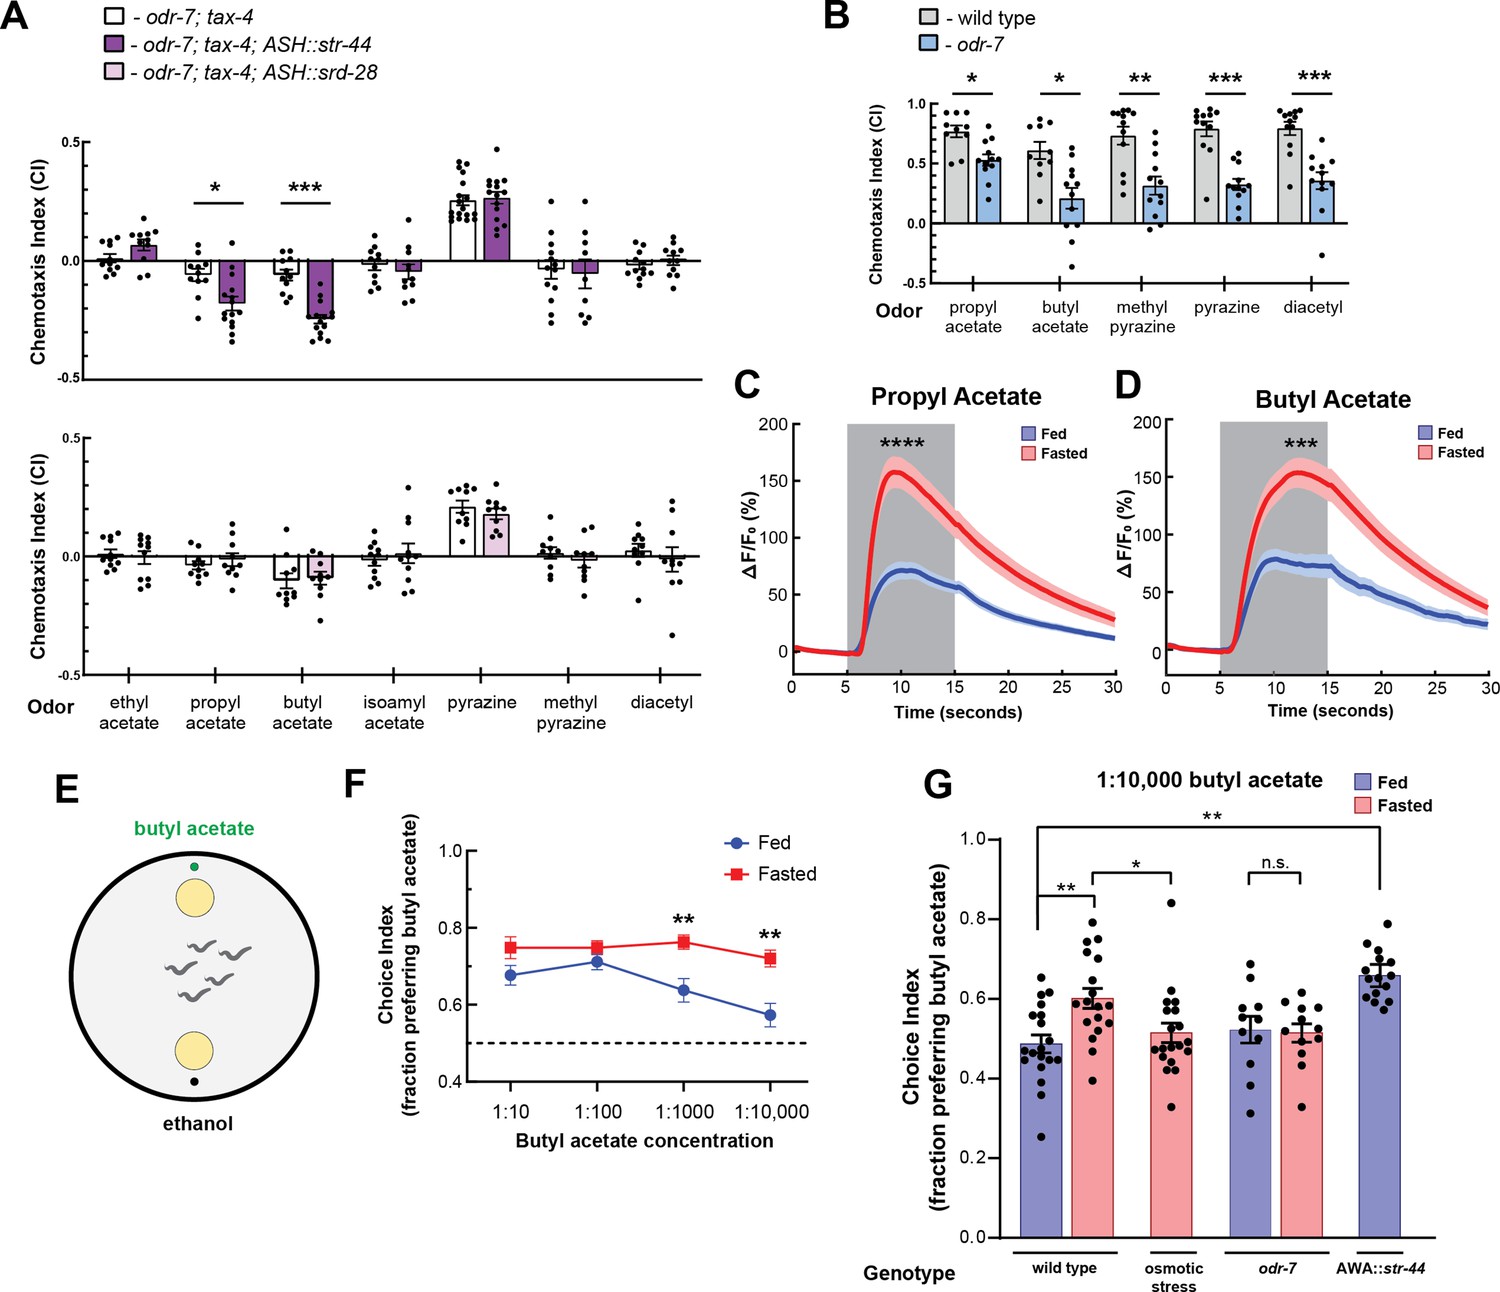
The state-dependent chemoreceptor str-44 responds to appetitive odors and controls state-dependent odor preference.
(A) Chemotaxis behavior in odr-7(ky4);tax-4(p678) animals, and odr-7;tax-4 animals expressing either str-44 or srd-28 in the nociceptive neuron ASH (sra-6p). Bars show mean ± SEM. n = 2–4 days, each with 3–6 assay plates per odor, and 50–200 animals per plate (*p<0.01, ***p<0.001, t-test with Bonferroni correction). (B) Chemotaxis behavior to odors of interest in wild-type and odr-7 mutants, which lack a functional AWA neuron. Bars show mean ± SEM. n = 2 days, each with 5–7 assay plates per odor (*p<0.01, **p<0.005, ***p<0.001, t-test with Bonferroni correction). odr-7 mutant chemotaxis to a wide range of other odors is not impaired (Sengupta et al., 1994). (C) AWA calcium imaging in response to a 10 s addition of 10–6 propyl acetate in fed (blue) and 3 hr fasted (red) worms. n = 31 fed animals, 13 fasted animals, two trials per animal. Plots show mean ± SEM. ****p<0.0001, t-test with Bonferroni correction. (D) AWA calcium imaging in response to 10 s addition of 10–6 butyl acetate in fed (blue) and 3 hr fasted (red) worms. n = 20 fed animals, 14 fasted animals, two trials per animal. Plots show mean ± SEM. ***p<0.001, t-test with Bonferroni correction. (E) Schematic of food choice assay. Animals are placed equidistant from two E. coli OP50 lawns, one with an adjacent drop of butyl acetate and one with an adjacent drop of ethanol (its dilutant). (F) Food choice behavior of fed and fasted animals, showing fraction of animals that chose the food lawn with a spot of butyl acetate at the indicated concentration. Plots show mean ± SEM. n = 9–20 plates per odor over two independent sessions, each with 40–200 animals. **p<0.01, t-test with Bonferroni correction. (G) Food choice behavior of fed and fasted WT or mutant animals, animals experiencing osmotic stress during fasting, and fed animals overexpressing str-44 in AWA (gpa-6p), showing fraction of animals that chose the food lawn with a spot of 1:10,000 butyl acetate. Bars show mean ± SEM. n > 12 plates per odor over two independent sessions, each with 40–200 animals. ****p<0.0001, **p<0.01, t-test with Bonferroni correction. Note that there is no significant effect between fed and fasted for odr-7 mutants.
Figure 2—figure supplement 1
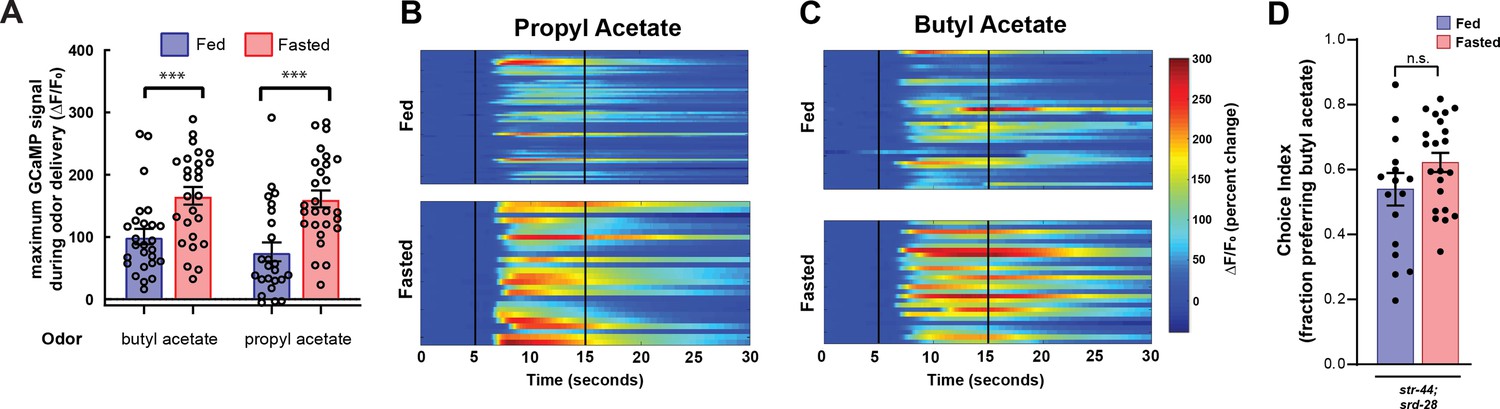
AWA calcium responses to butyl acetate and propyl acetate are potentiated by fasting, and state-dependent odor choice depends on AWA chemoreceptors.
(A) Quantification of odor-induced AWA calcium imaging data from Figure 2C and D. Dots show maximum GCaMP signal from each animal; bars show mean ± SEM. ***p<0.001, one-way ANOVA with Bonferroni’s multiple-comparisons test. (B) AWA calcium responses to propyl acetate in individual fed (top) and fasted (bottom) animals. Black vertical lines show stimulus onset and offset. Average traces are shown in Figure 2C. (C) AWA calcium responses to butyl acetate in individual fed (top) and fasted (bottom) animals. Black vertical lines show stimulus onset and offset. Average traces are shown in Figure 2D. (D) Food choice behavior in str-44;srd-28 mutant animals showing fraction of animals that chose the food lawn with a spot of 1:10,000 butyl acetate. Bars show mean ± SEM. n > 15 plates per odor over two independent sessions, each with 40–200 animals.
Figure 3 with 1 supplement
State-dependent AWA calcium responses and behavioral responses to bacterial food.
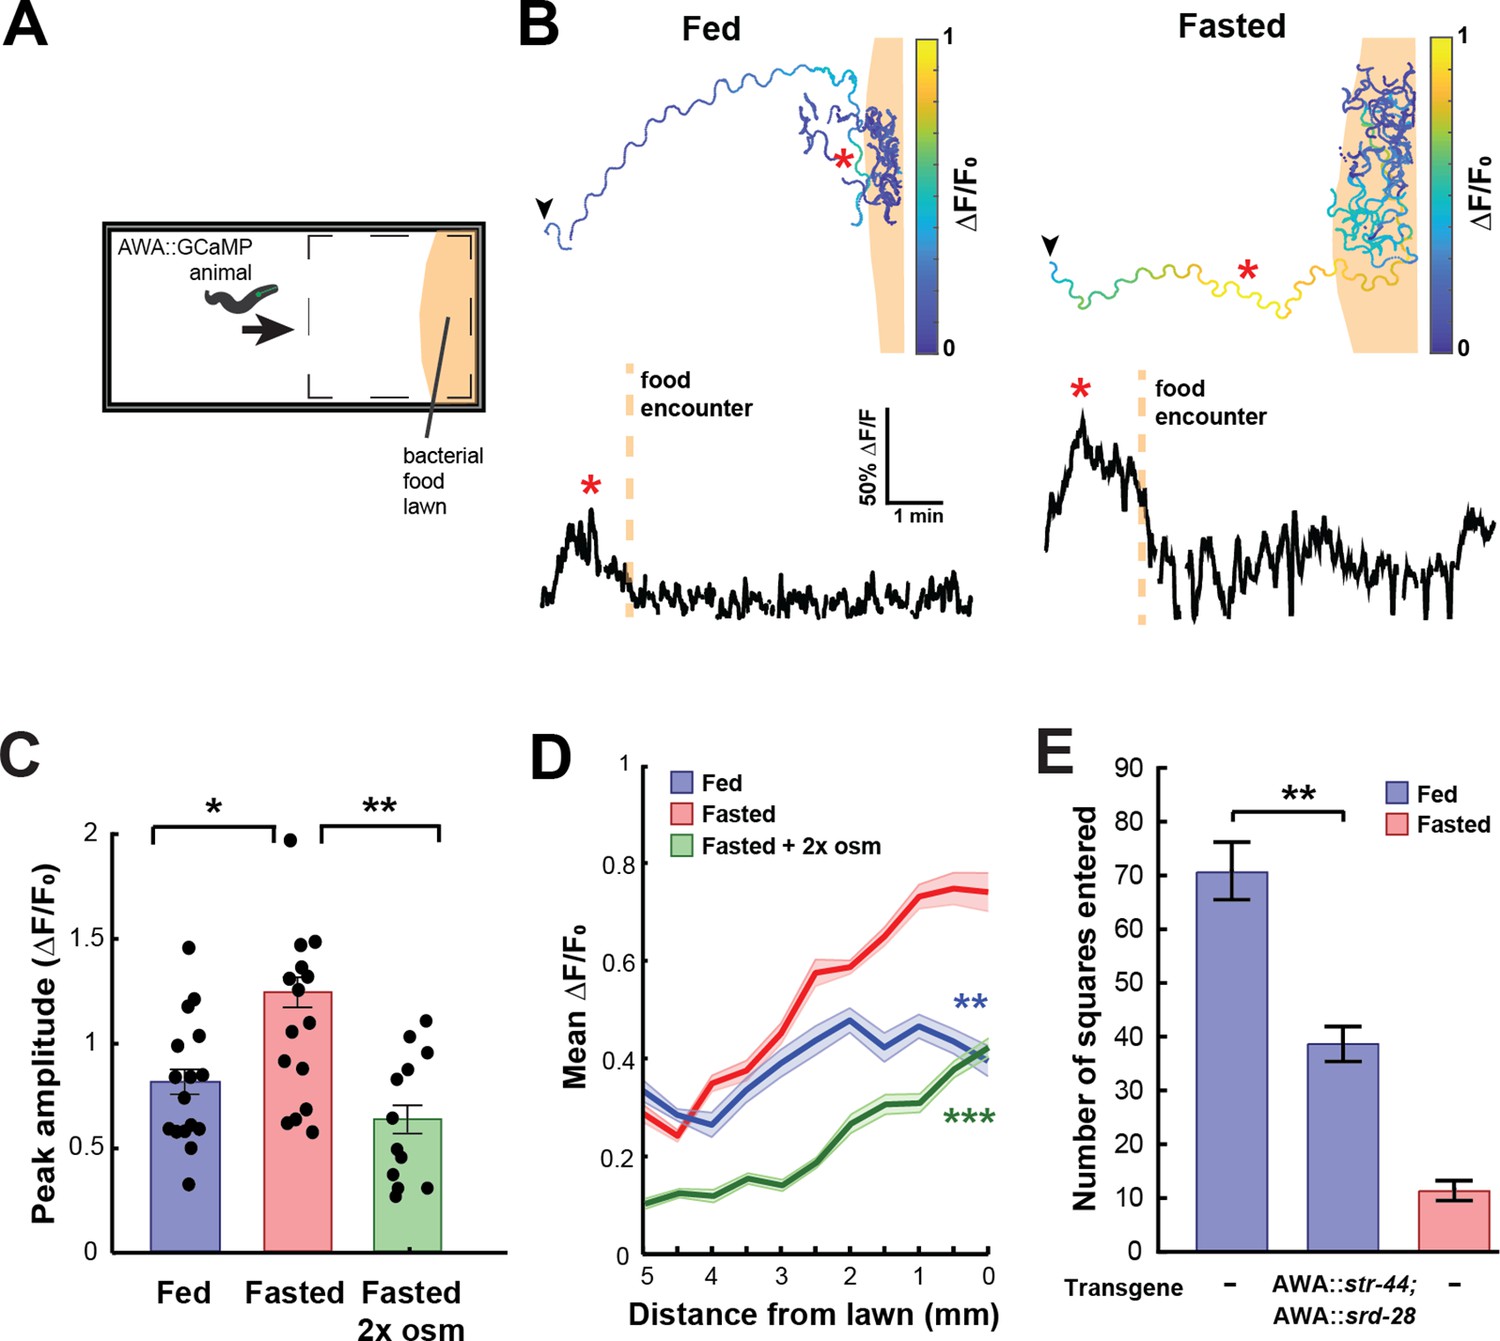
(A) Schematic of freely moving calcium imaging assay. Animals expressing AWA::GCaMP2.2b are picked to an agar pad and allowed to freely navigate to an E. coli OP50 lawn. Dashed box indicates field of view of the microscope. (B) Example AWA GCaMP recording of an individual fed (left) or fasted (right) animal. Top: movement trajectories of animals, with colors indicating AWA GCaMP fluorescence. Bottom: GCaMP trace for the same animals. Red asterisks: peak of GCaMP signal. Dashed line: time of food encounter. (C) Amplitude of each GCaMP peak in fed animals, fasted animals, and animals fasted in the presence of osmotic stress (300 mOsm). Bars show mean ± SEM. *p<0.05, **p<0.01, t-test with Bonferroni correction. (D) Mean GCaMP signal in fed or fasted animals binned by the animal’s distance from the lawn boundary (0.5 mm bins). n = 18 animals per condition. Plots show mean ± SEM. Two-way ANOVA, significant effect of feeding state (***p<0.001, **p<0.01). (E) On-food exploration assay comparing wild-type fed and fasted animals with fed animals overexpressing str-44 and srd-28 chemoreceptors in AWA (gpa-6p). n = 15–30 animals per condition. Plots show mean ± SEM. **p<0.01, t-test.
Figure 3—figure supplement 1
AWA GCaMP peak duration and locomotor controls.
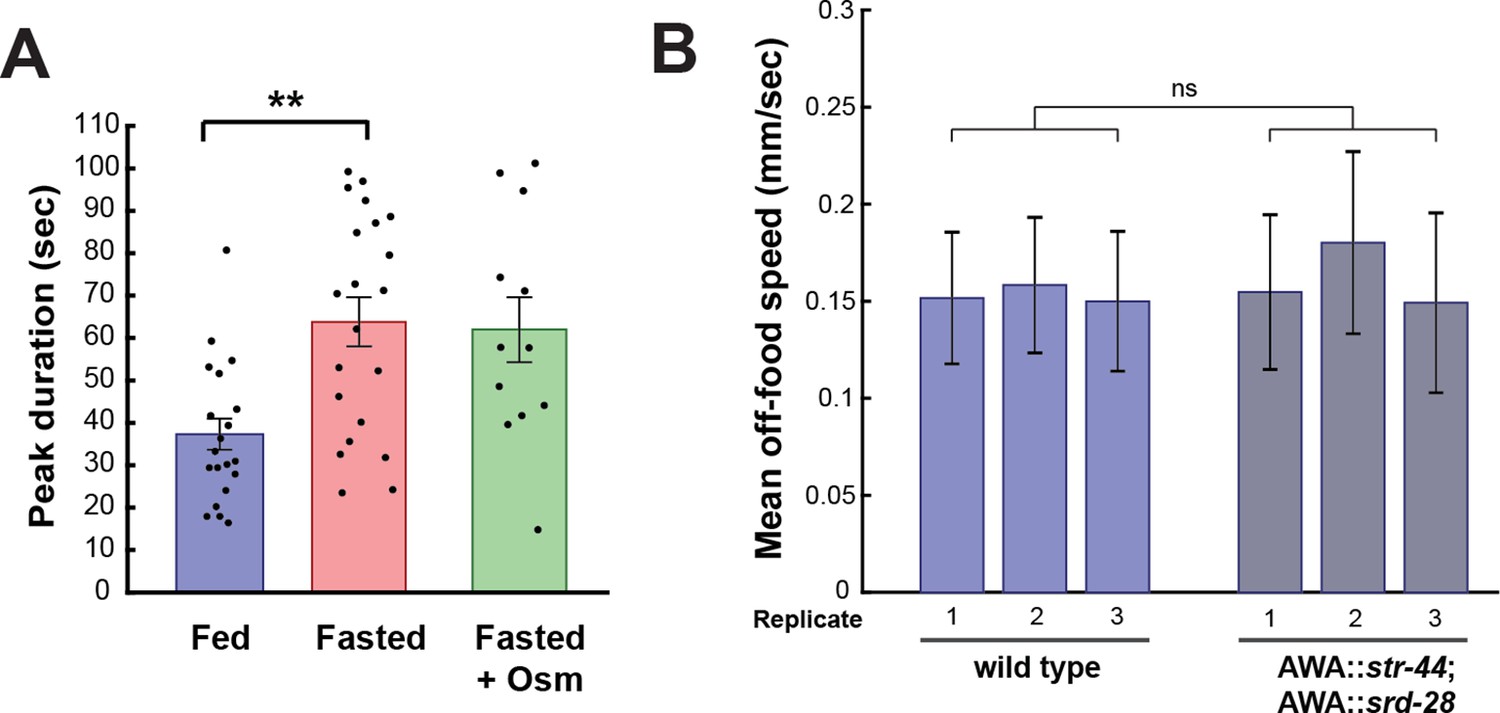
(A) Duration of each GCaMP peak in fed animals, fasted animals, and animals fasted in the presence of osmotic stress (300 mOsm). Bars show mean ± SEM. **p<0.01, t-test with Bonferroni correction. (B) Mean off-food locomotion in fed wild-type animals and fed animals overexpressing str-44 and srd-28 chemoreceptors in AWA (gpa-6p). Bars show mean ± SD. Three biological replicates are shown. There is no significant difference between experimental groups.
Figure 4 with 2 supplements
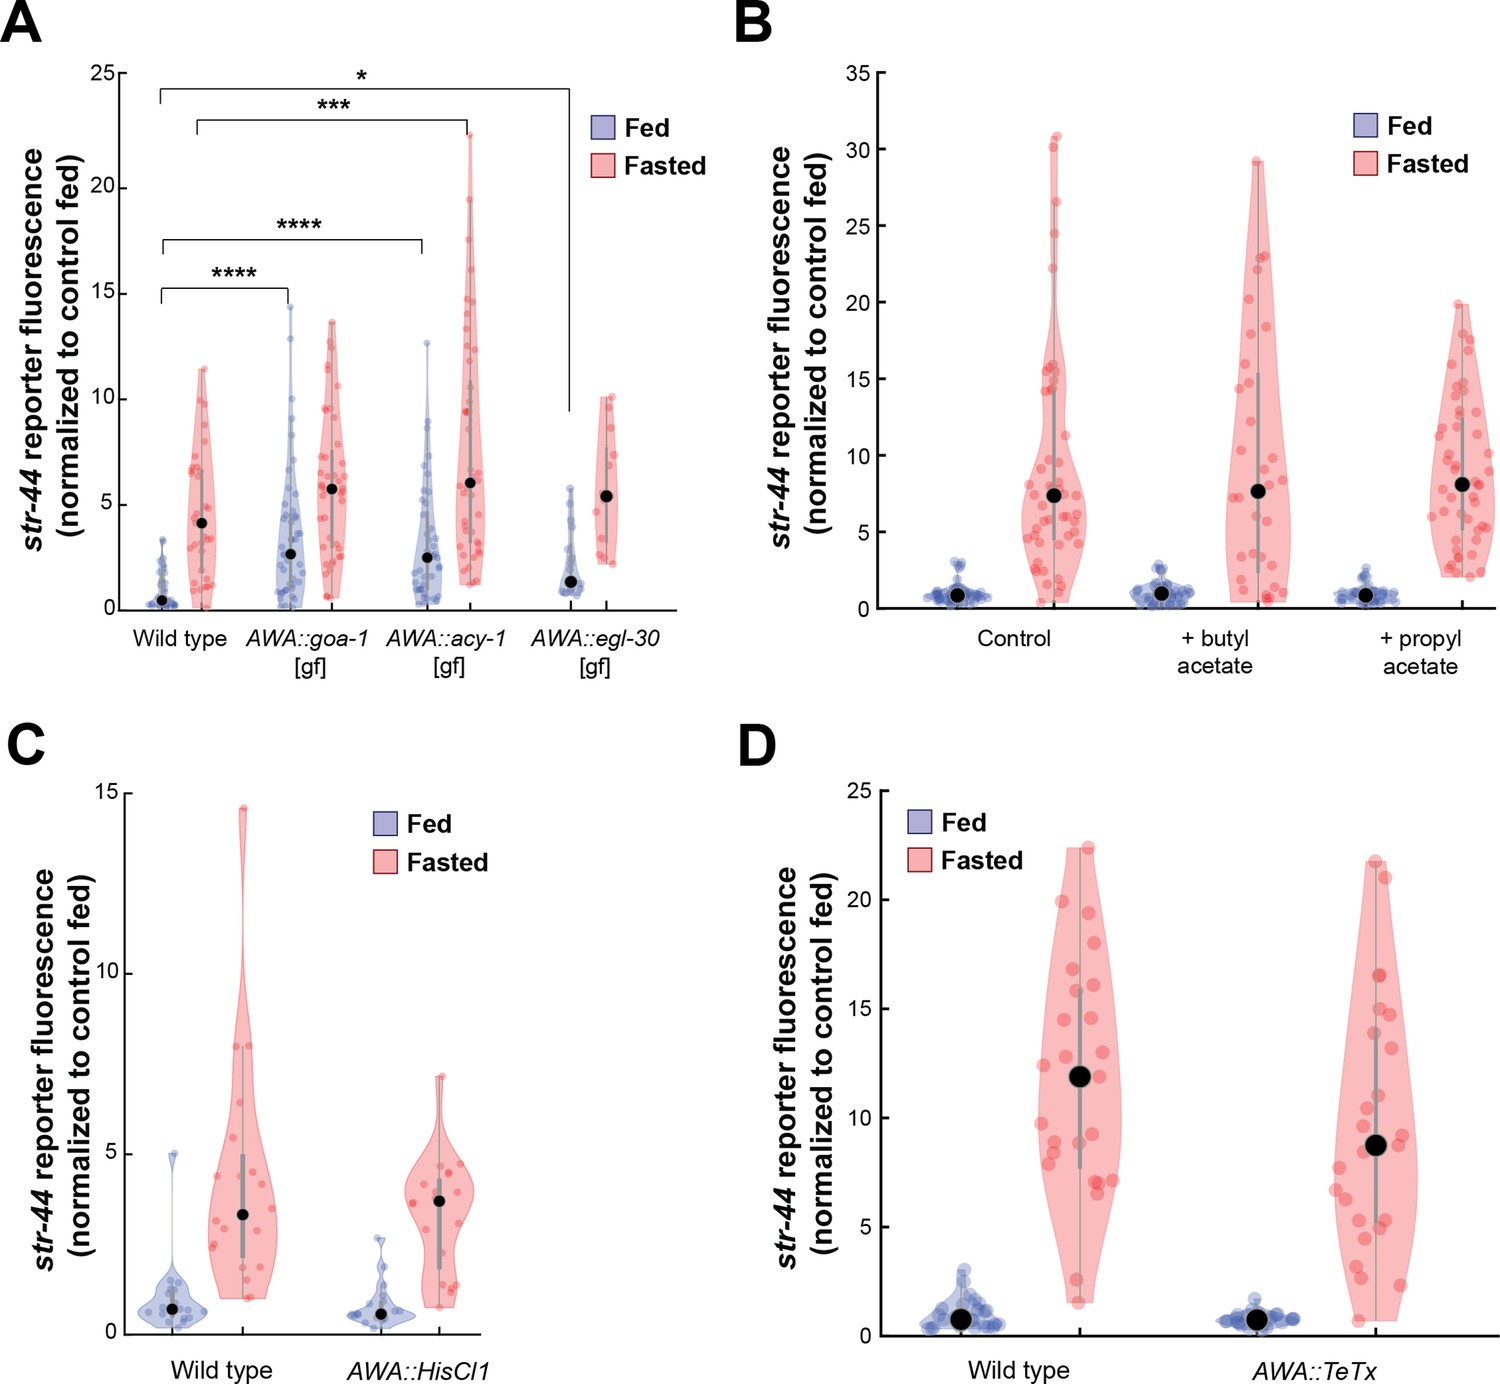
Signaling from food sensory neurons to AWA modulates str-44 expression via multiple pathways.
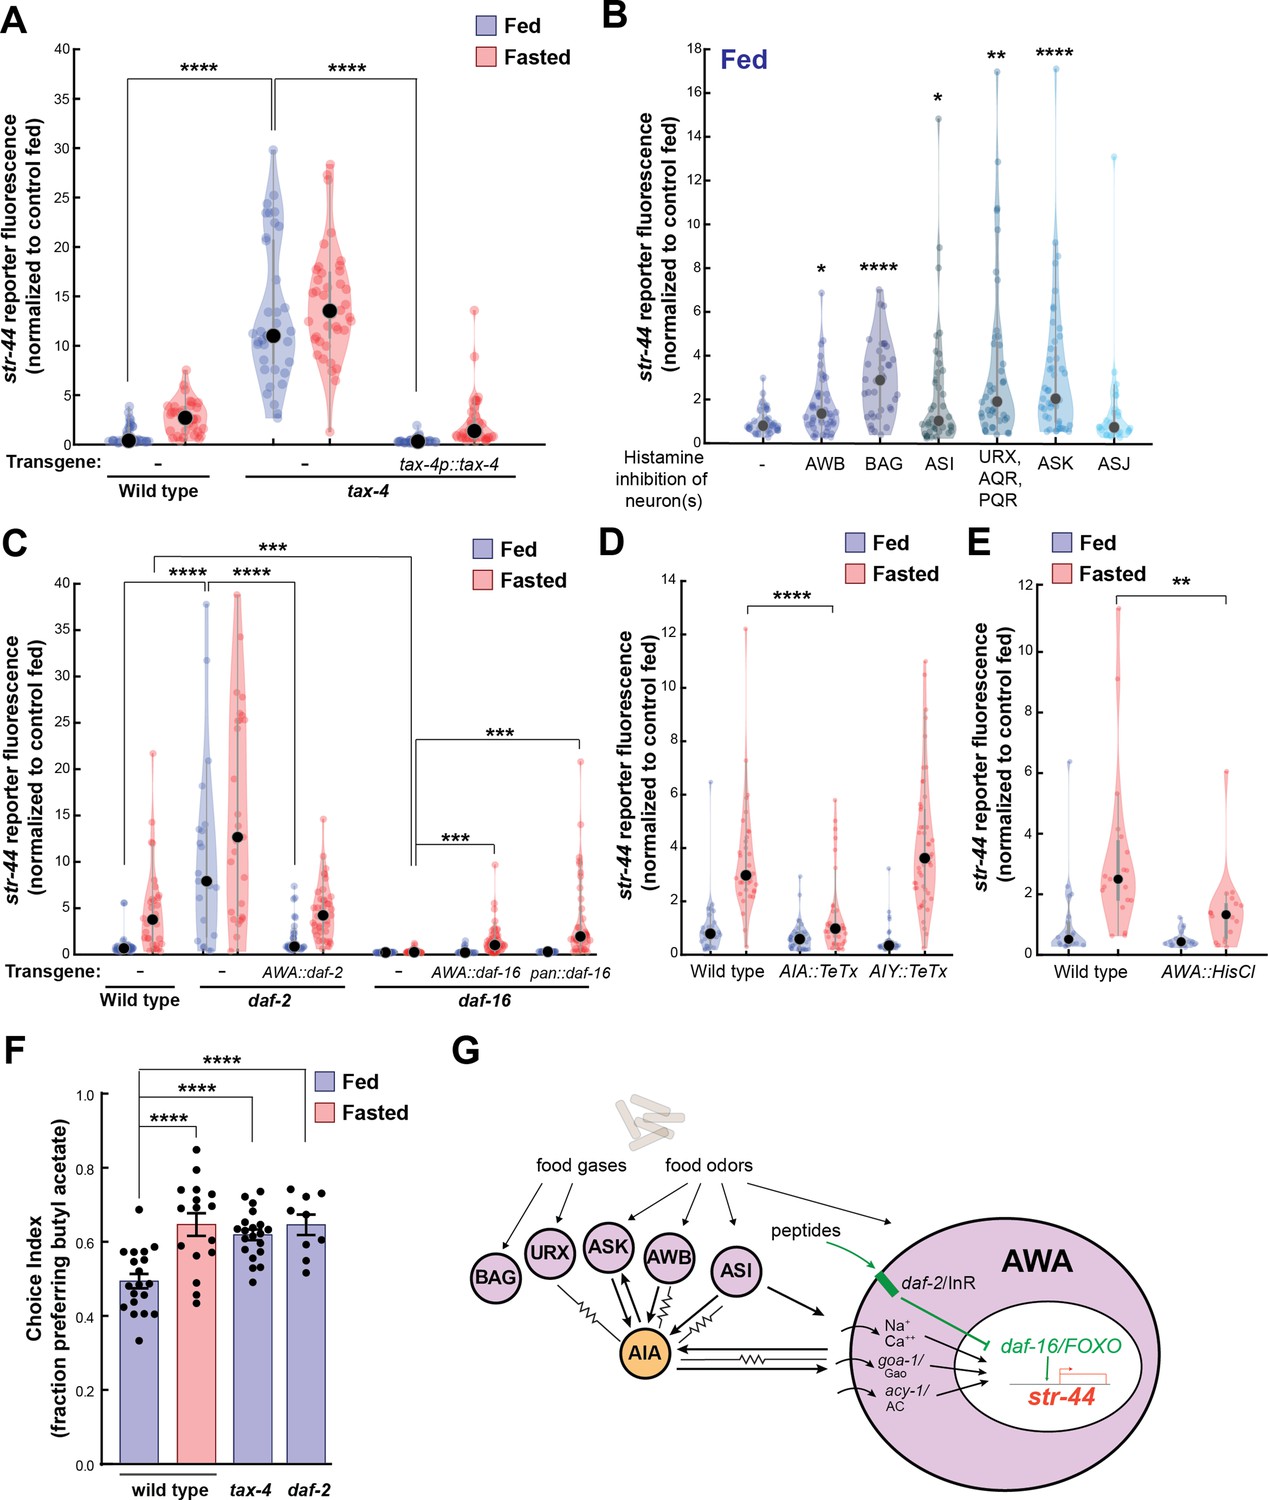
(A) Relative expression of str-44::T2A-mNeonGreen in tax-4(p678) mutants with and without tax-4::tax-4 rescue construct, compared to wild-type. ****p<0.0001, two-tailed t-test with Bonferroni correction. (B) str-44::T2A-mNeonGreen expression following 3 hr histamine-induced inhibition of sensory neurons while feeding. Histamine-gated chloride channel (HisCl1) transgenes expressed with cell-specific promoters: AWB (str-1p::HisCl1), BAG (gcy-33p::HisCl1), ASI (srg-47p::HisCl1), URX, AQR, PQR (gcy-36p::HisCl), ASK (sra-9p::HisCl1), and ASJ (srh-11p::HisCl1). *p<0.05, **p<0.01, ***p<0.001, ****p<0.0001, two-tailed t-test with Bonferroni correction. Note that there is no significant effect of ASJ silencing compared to controls. (C) Relative expression of str-44::T2A-mNeonGreen in daf-2(m41), and daf-16(mu86) mutants and mutants bearing transgenes for AWA-specific (gpa-6p) or pan-body (dpy-30p) rescues for daf-2 and daf-16. ***p<0.001, ****p<0.0001, two-tailed t-test with Bonferroni correction. (D) Relative expression of str-44::T2A-mNeonGreen in animals with synaptic silencing of AIA (gcy-28.dp::TeTx) or AIY (ttx-3p::TeTx). ****p<0.0001, two-tailed t-test with Bonferroni correction. Note that there is no significant effect of AIY synaptic silencing, compared to controls. (E) Relative expression of str-44::T2A-mNeonGreen following 3 hr histamine-induced inhibition of AWA (gpa-6p::HisCl1). **p<0.01, two-tailed t-test with Bonferroni correction. (F) Food choice behavior in wild-type, tax-4, or daf-2 mutant animals showing fraction of animals that chose the food lawn with a spot of 1:10,000 butyl acetate. Bars show mean ± SEM. n > 15 plates per odor over two independent sessions, each with 40–200 animals. ****p<0.0001, t-test with Bonferroni correction. (G) Model depicting the pathways that signal from food sensory neurons to AWA. Signaling occurs via insulin signaling, modulation of AWA activity, and modulation of AWA G protein signaling. For (A–E), colored dots represent measurements from individual cells, black dots represent median values, and shaded area shows kernel density estimation for the data. Each condition measured in two independent sessions.
Figure 4—figure supplement 1
Controls and additional mutants for single-neuron inhibition experiments, and srd-28 expression changes in relevant mutants.
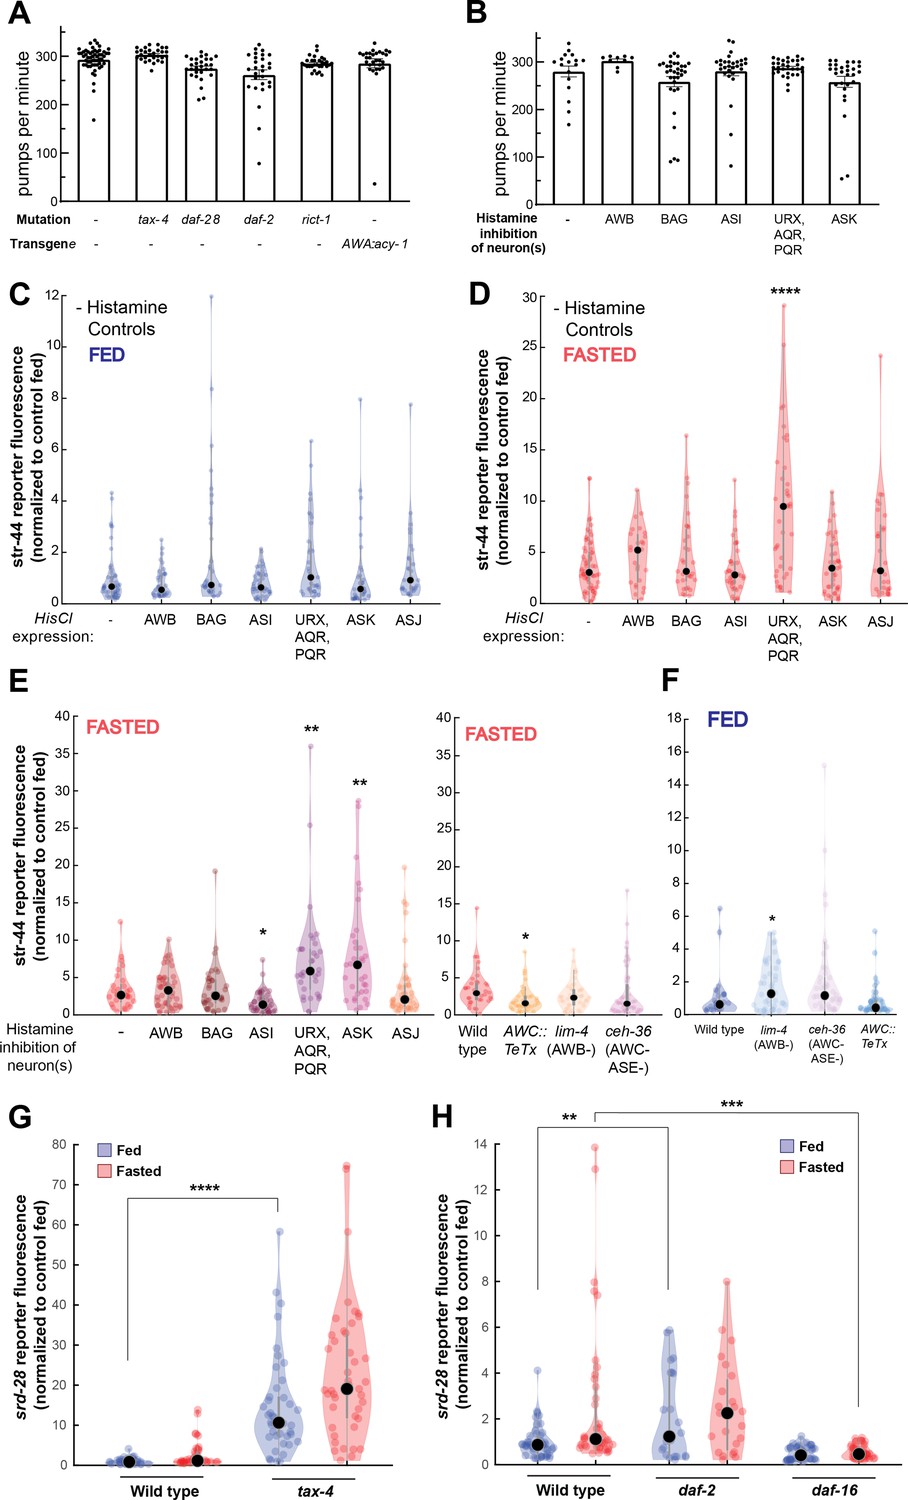
(A) Pharyngeal pumps per minute for mutants and transgenic strains that show enriched levels of str-44::T2A-mNeonGreen in the fed state. No significant differences observed, suggesting that the increased str-44 expression in fed animals is not due to a reduction in feeding. Bars show mean ± SEM. (B) Pharyngeal pumps per minute for HisCl-silencing lines after 1 hr on histamine plates with OP50. No significant differences observed, suggesting that the increased str-44 expression in fed animals is not due to a reduction in feeding. Bars show mean ± SEM. (C) Histamine-absent fed controls: relative expression of str-44::T2A-mNeonGreen for HisCl-silencing lines for AWB (str-1p::HisCl1), BAG (gcy-33p::HisCl1), ASI (srg-47p::HisCl1), URX, AQR, PQR (gcy-36p::HisCl), ASK (sra-9p::HisCl1), and ASJ (srh-11p::HisCl1) on nematode growth medium (NGM) plates without histamine added. No significant differences observed. (D) Histamine-absent starved controls: relative expression of str-44::T2A-mNeonGreen for HisCl-silencing lines for AWB (str-1p::HisCl1), BAG (gcy-33p::HisCl1), ASI (srg-47p::HisCl1), URX, AQR, PQR (gcy-36p::HisCl), ASK (sra-9p::HisCl1), and ASJ (srh-11p::HisCl1) on NGM plates without histamine added. Note that there is a significant increase in the URX/AQR/PQR::HisCl1 line in these starved animals, indicating that the increase detected in the presence of histamine (E) is not actually due to neural silencing. (E) Left: str-44::T2A-mNeonGreen expression following 3 hr histamine-induced inhibition of sensory neurons while fasting. Histamine-gated chloride channel (HisCl1) transgenes expressed with cell-specific promoters detailed in panel (D). Note that there is a significant increase in the URX/AQR/PQR::HisCl1 line in histamine-absent starved controls (D), indicating that the increase detected here in the presence of histamine is not actually due to neural silencing. Right: str-44::T2A-mNeonGreen expression following genetic ablation of sensory neurons (AWB: lim-4(ky403); AWC/ASE: ceh-36(ks86)) or synaptic silencing by tetanus toxin light chain (AWC::TeTx) in fasted animals. (F) str-44::T2A-mNeonGreen expression following genetic ablation of sensory neurons (AWB: lim-4(ky403); AWC/ASE: ceh-36(ks86)) or synaptic silencing by tetanus toxin light chain (AWC::TeTx) in well-fed animals. (G) srd-28::T2A-mNeonGreen expression in tax-4(p678) mutants compared to wild-type controls. (H) srd-28::T2A-mNeonGreen expression in daf-2(m41) and daf-16(mu86) mutants compared to wild-type controls. For (C–H), each condition measured in two independent sessions. ****p<0.0001, ***p<0.001, **p<0.01, *p<0.05 by two-tailed t-test with Bonferroni correction. Colored dots represent from individual cells, black dots represent median values, and shaded area shows kernel density estimation for the data.
Figure 4—figure supplement 2
Manipulations of AWA activity, but not str-44 ligand exposure or AWA synaptic transmission, modify str-44 expression.
(A) Relative expression of str-44::T2A-mNeonGreen in animals expressing the indicated constitutively active G proteins in AWA (gpa-6p). ****p<0.0001, ***p<0.001, *p<0.05 by two-tailed t-test with Bonferroni correction. (B) Relative expression of str-44::T2A-mNeonGreen in animals exposed to the putative str-44 ligands butyl acetate and propyl acetate during feeding or fasting (1:100 dilution on lid of plate). There is no significant difference between odor and non-odor conditions. (C) Histamine-absent controls: relative expression of str-44::T2A-mNeonGreen for AWA silencing line (gpa-6p::HisCl1) on nematode growth medium (NGM) plate lacking histamine. There is no significant difference between genotypes in this control (histamine-absent) condition. (D) Relative expression of str-44::T2A-mNeonGreen in animals with synaptic silencing of AWA (gpa-6p::TeTx). There is no significant difference between genotypes. For (A–D), each condition measured in two independent sessions. Colored dots represent from individual cells, black dots represent median values, and shaded area shows kernel density estimation for the data.
Figure 5

TORC2 signaling from the gut controls AWA str-44 expression and odor preference.
(A) Relative expression of str-44::T2A-mNeonGreen in cat-1(e1111), pdfr-1(ok3425), atgl-1(gk176565), mxl-3(ok1947), aak-1(tm1944);aak-2(gt33) mutants compared to wild-type. All mutant genotypes shown are statistically indistinguishable from the corresponding wild-type controls, and all fed versus starved comparisons within each genotype are significant at p<0.001 (two-tailed t-test). (B) Relative expression of str-44::T2A-mNeonGreen in raga-1(ok386) and rict-1(ft7) mutants and rict-1 mutant bearing transgene for intestinal-specific (ges-1p) rescue for rict-1(ft-7) compared to wild-type when fed and fasted. raga-1(ok386) fed versus starved comparison is not significant by two-tailed t-test (p>0.05). (C) Relative expression of str-44::T2A-mNeonGreen in animals fed on E. coli HT115 with empty RNAi vector, rict-1(RNAi), sgk-1(RNAi), pkc-2(RNAi), akt-1(RNAi), let-363(RNAi), skn-1(RNAi), or sinh-1(RNAi). Left: wild-type animals fed on RNAi. Right: rict-1(ft7) mutant animals fed on RNAi to identify suppressors. Unless otherwise marked, RNAi of genes resulted in no significant difference from controls. (D) Food choice behavior in wild-type or rict-1 mutant animals showing fraction of animals that chose the food lawn with a spot of 1:10,000 butyl acetate. Bars show mean ± SEM. n > 15 plates per odor over two independent sessions, each with 40–200 animals. ****p<0.0001, t-test with Bonferroni correction. For (A–C), each condition measured in two independent sessions. ****p<0.0001, **p<0.01by two-tailed t-test. Colored dots represent from individual cells, black dots represent median values, and shaded area shows kernel density estimation for the data.
Figure 6 with 1 supplement

Food sensory signals, gut-to-brain metabolic signals, and stress pathways act in a parallel, modular fashion to control str-44 expression.
(A) Relative expression of str-44::T2A-mNeonGreen in wild-type, daf-16, tax-4, tax-4;daf-16, ASI::HisCl. ASI::HisCl;daf-16, AWA::goa-1, AWA::goa-1;daf-16 animals. (B) Relative expression of str-44::T2A-mNeonGreen in wild-type, tax-4, daf-2, and rict-1 mutant animals fasted on standard nematode growth medium (NGM) plates (150 mOsm) or high osmolarity NGM plates (300 mOsm). (C) Relative expression of str-44::T2A-mNeonGreen in rict-1, daf-2, rict-1;daf-2, daf-16, and rict-1;daf-16 mutants compared to wild-type controls. (D) Schematic depicting the parallel pathways that converge on AWA to modulate str-44 expression, which in turn modulates food-seeking behavior. For (A–C), each condition measured in two independent sessions. ****p<0.0001, ***p<0.001, **p<0.01, *p<0.05 by two-tailed t-test with Bonferroni correction. Colored dots represent from individual cells, black dots represent median values, and shaded area shows kernel density estimation for the data.
Figure 6—figure supplement 1
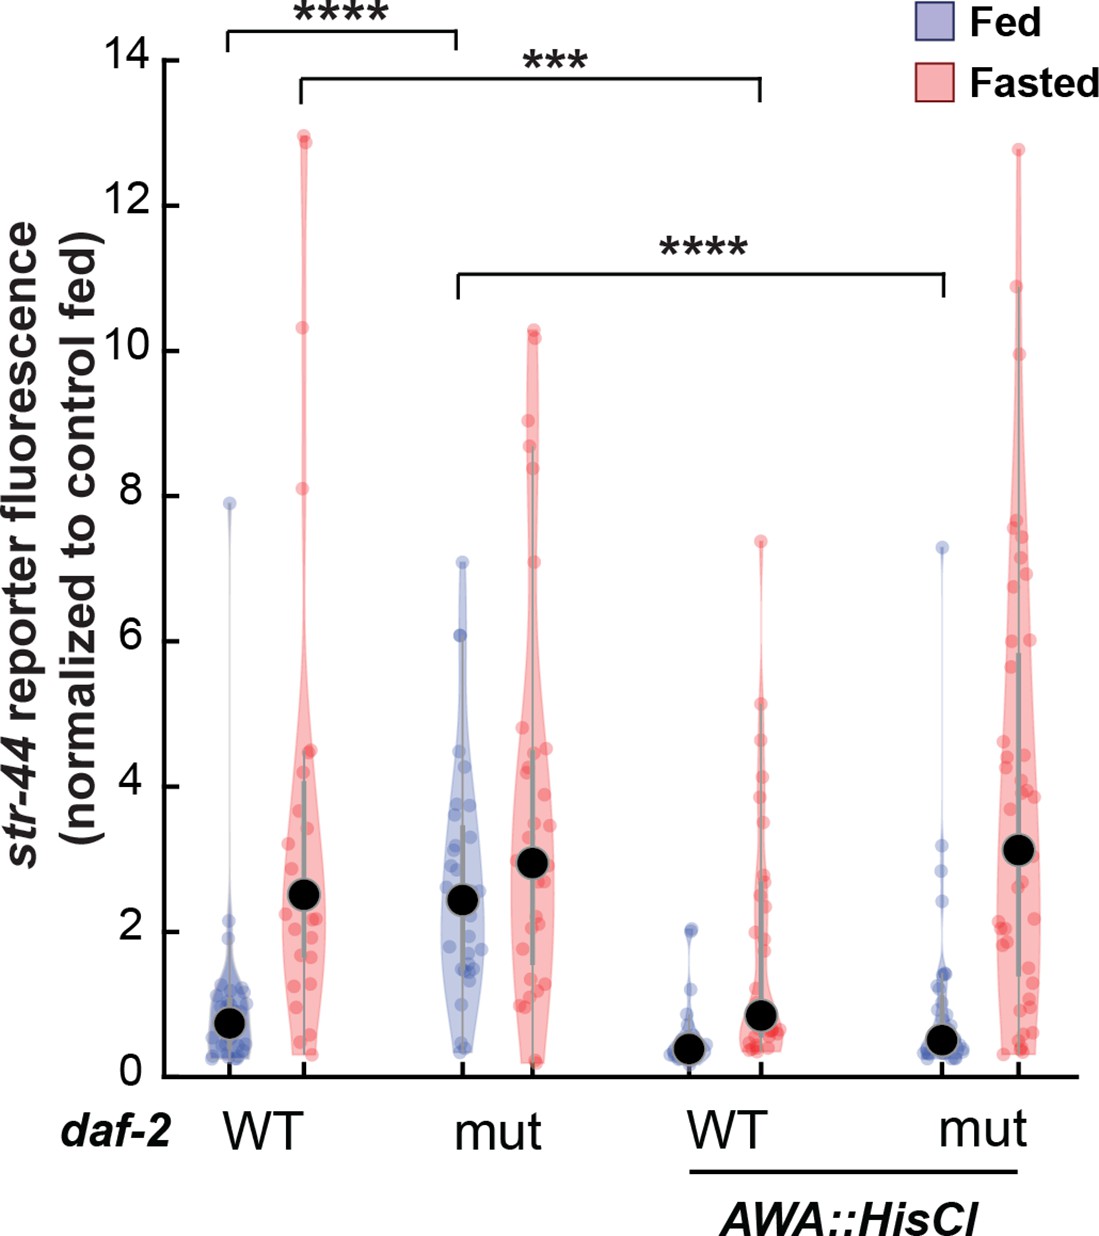
Relative expression of str-44::T2A-mNeonGreen in daf-2, AWA::HisCl, and AWA::HisCl;daf-2 mutants compared to wild-type control.
Note that these animals were all in the presence of histamine. Each condition measured in two independent sessions. ****p<0.0001, ***p<0.001 by two-tailed t-test with Bonferroni correction. Colored dots represent from individual cells, black dots represent median values, and shaded area shows kernel density estimation for the data.
Tables
Key resources table
| Reagent type (species) or resource | Designation | Source or reference | Identifiers | Additional information |
|---|---|---|---|---|
| Strain, strain background (Caenorhabditis elegans) | Wild-type Bristol N2 | N/A | N2 | |
| Genetic reagent (C. elegans) | odr-7(ky4) | Sengupta et al., 1994 | CX4 | |
| Genetic reagent (C. elegans) | odr-7(ky4); tax-4(p678) | This study | SWF482 | Strain available from Flavell Lab (see ‘Data availability’) |
| Genetic reagent (C. elegans) | kyIs665[rimb-1::rpl-22-3xHA,myo-3::mCherry] | This study | CX16283 | Strain available from Flavell Lab (see ‘Data availability’) |
| Genetic reagent (C. elegans) | kyIs587[gpa-6::GCaMP2.2b, unc-122::dsRed] | Larsch et al., 2013 | NZ1101 | |
| Genetic reagent (C. elegans) | srd-28(syb2320) | This study | PHX2320 | Strain available from Flavell Lab (see ‘Data availability’) |
| Genetic reagent (C. elegans) | str-44(syb1869) | This study | PHX1869 | Strain available from Flavell Lab (see ‘Data availability’) |
| Genetic reagent (C. elegans) | odr-10(syb3508) | This study | PHX3508 | Strain available from Flavell Lab (see ‘Data availability’) |
| Genetic reagent (C. elegans) | ser-7(syb1941) | This study | PHX1941 | Strain available from Flavell Lab (see ‘Data availability’) |
| Genetic reagent (C. elegans) | str-44(syb1869); cat-1(e1111) | This study | SWF428 | Strain available from Flavell Lab (see ‘Data availability’) |
| Genetic reagent (C. elegans) | str-44(syb3563)IV; srd-28(syb3336)V | This study | PHX3677 | Strain available from Flavell Lab (see ‘Data availability’) |
| Genetic reagent (C. elegans) | str-44(syb1869);daf-3(e1376) | This study | SWF456 | Strain available from Flavell Lab (see ‘Data availability’) |
| Genetic reagent (C. elegans) | str-44(syb1869);pdfr-1(ok3425) | This study | SWF461 | Strain available from Flavell Lab (see ‘Data availability’) |
| Genetic reagent (C. elegans) | odr-7(ky4); tax-4(p678); flvEx283[sra-6::srd-28 cDNA, myo2::mCherry] | This study | SWF631 | Strain available from Flavell Lab (see ‘Data availability’) |
| Genetic reagent (C. elegans) | odr-7(ky4); tax-4(p678); flvEx181[sra-6::str-44 cDNA, myo-3::mCherry] | This study | SWF478 | Strain available from Flavell Lab (see ‘Data availability’) |
| Genetic reagent (C. elegans) | tax-4(p678); str-44(syb1869) | This study | SWF486 | Strain available from Flavell Lab (see ‘Data availability’) |
| Genetic reagent (C. elegans) | str-44(syb1869); ceh-36(ks86) | This study | SWF514 | Strain available from Flavell Lab (see ‘Data availability’) |
| Genetic reagent (C. elegans) | daf-7(e1372); str-44(syb1869) | This study | SWF522 | Strain available from Flavell Lab (see ‘Data availability’) |
| Genetic reagent (C. elegans) | daf-2(m41); str-44(syb1869) | This study | SWF527 | Strain available from Flavell Lab (see ‘Data availability’) |
| Genetic reagent (C. elegans) | str-44(syb1869); flvEx216[Pgpa-6::HisCl] | This study | SWF528 | Strain available from Flavell Lab (see ‘Data availability’) |
| Genetic reagent (C. elegans) | str-44(syb1869); flvEx239[srh-11::HisCl1-sl2-mCherry(25 ng/μL)] | This study | SWF557 | Strain available from Flavell Lab (see ‘Data availability’) |
| Genetic reagent (C. elegans) | str-44(syb1869); raga-1(ok386) | This study | SWF545 | Strain available from Flavell Lab (see ‘Data availability’) |
| Genetic reagent (C. elegans) | str-44(syb1869); rict-1(ft7) | This study | SWF546 | Strain available from Flavell Lab (see ‘Data availability’) |
| Genetic reagent (C. elegans) | str-44(syb1869); flvEx231[srg-47p::HisCl1-sl2-mCherry+myo-3p::mCherry] | This study | SWF548 | Strain available from Flavell Lab (see ‘Data availability’) |
| Genetic reagent (C. elegans) | str-44(syb1869); flvEx238[tax-4::tax-4 (40 ng/μL)+myo-2::mCherry (1 ng/μL)] | This study | SWF552 | Strain available from Flavell Lab (see ‘Data availability’) |
| Genetic reagent (C. elegans) | str-44(syb1869); flvEx239[srh-11::HisCl1-sl2-mCherry(25 ng/μL)] | This study | SWF557 | Strain available from Flavell Lab (see ‘Data availability’) |
| Genetic reagent (C. elegans) | str-44(syb1869); flvEx235 [gcy-33::HisCl1-sl2-mCherry (7.5 ng/μL)] | This study | SWF556 | Strain available from Flavell Lab (see ‘Data availability’) |
| Genetic reagent (C. elegans) | str-44(syb1869); flvEx245[gcy-36::HiCl-sl2-mCherry (2 ng/μL)] | This study | SWF563 | Strain available from Flavell Lab (see ‘Data availability’) |
| Genetic reagent (C. elegans) | str-44(syb1869); flvEx246[str-1::HiCl-sl2-mCherry (25 ng/μL)] | This study | SWF564 | Strain available from Flavell Lab (see ‘Data availability’) |
| Genetic reagent (C. elegans) | str-44(syb1869); flvEx241[sra-9::HiCl-sl2-mCherry (25 ng/μL)] | This study | SWF559 | Strain available from Flavell Lab (see ‘Data availability’) |
| Genetic reagent (C. elegans) | daf-2(m41); str-44(syb1869); flvEx258[gpa-6::daf-2-sl2-mCherry (25 ng/μL)] | This study | SWF583 | Strain available from Flavell Lab (see ‘Data availability’) |
| Genetic reagent (C. elegans) | daf-2(m41); str-44(syb1869); flvEx263[gpa-6::daf-2-sl2-mCherry (25 ng/μL)] | This study | SWF588 | Strain available from Flavell Lab (see ‘Data availability’) |
| Genetic reagent (C. elegans) | str-44(syb1869); mxl-3(ok1947) | This study | SWF589 | Strain available from Flavell Lab (see ‘Data availability’) |
| Genetic reagent (C. elegans) | str-44(syb1869); flvEx272[gpa-6::acy-1(gf) (25 ng/μL), myo-2::mCherry (1 ng/μL)] | This study | SWF611 | Strain available from Flavell Lab (see ‘Data availability’) |
| Genetic reagent (C. elegans) | str-44(syb1869); flvEx279[25 ng/μL gpa-6::goa-1(GF)-sl2-mCherry] | This study | SWF622 | Strain available from Flavell Lab (see ‘Data availability’) |
| Genetic reagent (C. elegans) | str-44(syb1869); daf-16(mu86); flvEx278[25 ng/μL gpa-6::daf-16a-sl2-mCherry] | This study | SWF621 | Strain available from Flavell Lab (see ‘Data availability’) |
| Genetic reagent (C. elegans) | str-44(syb1869); daf-16(mu86); flvEx278[25 ng/μL dpy-30::daf-16a-sl2-mCherry] | This study | SWF625 | Strain available from Flavell Lab (see ‘Data availability’) |
| Genetic reagent (C. elegans) | str-44(syb1869); daf-16(mu86) | This study | SWF627 | Strain available from Flavell Lab (see ‘Data availability’) |
| Genetic reagent (C. elegans) | flvEx284[ges-1::rict-1+myo-3::mCherry]; str-44(syb1869); rict-1(ft7) | This study | SWF633 | Strain available from Flavell Lab (see ‘Data availability’) |
| Genetic reagent (C. elegans) | daf-16(mu86); tax-4(p678); str-44(syb1869) | This study | SWF638 | Strain available from Flavell Lab (see ‘Data availability’) |
| Genetic reagent (C. elegans) | daf-16(mu86); rict-1(ft7); str-44(syb1869); | This study | SWF642 | Strain available from Flavell Lab (see ‘Data availability’) |
| Genetic reagent (C. elegans) | str-44(syb1869); flvEx292[ceh-36p::TeTx-SL2-mCherry+myo-3p::mCherry] | This study | SWF648 | Strain available from Flavell Lab (see ‘Data availability’) |
| Genetic reagent (C. elegans) | str-44(syb1869); flvEx293[gpa-6p::egl-30(gf)+myo-3p::mCherry] | This study | SWF649 | Strain available from Flavell Lab (see ‘Data availability’) |
| Genetic reagent (C. elegans) | daf-16(mu86); str-44(syb1869); flvEx231[srg-47p::HisCl1-sl2-mCherry+myo-3p::mCherry] | This study | SWF666 | Strain available from Flavell Lab (see ‘Data availability’) |
| Genetic reagent (C. elegans) | str-44(syb1869); daf-2(m41); flvEx216[gpa-6::HisCl1] | This study | SWF668 | Strain available from Flavell Lab (see ‘Data availability’) |
| Genetic reagent (C. elegans) | str-44(syb1869); tax-4(p678); flvEx216[gpa-6::HisCl1] | This study | SWF669 | Strain available from Flavell Lab (see ‘Data availability’) |
| Genetic reagent (C. elegans) | str-44(syb1869); rict-1(ft7); flvEx216[gpa-6::HisCl1] | This study | SWF670 | Strain available from Flavell Lab (see ‘Data availability’) |
| Genetic reagent (C. elegans) | str-44(syb1869); aak-1(tm1944); aak-2(gt33) | This study | SWF671 | Strain available from Flavell Lab (see ‘Data availability’) |
| Genetic reagent (C. elegans) | str-44(syb1869);daf-16(mu86); flvEx297[gpa-6::goa-1(gf)-sl2-mCherry (25 ng/μL)] | This study | SWF672 | Strain available from Flavell Lab (see ‘Data availability’) |
| Genetic reagent (C. elegans) | str-44(syb1869);daf-7(e1372); flvEx297[gpa-6::goa-1(gf)-sl2-mCherry (25 ng/μL)] | This study | SWF678 | Strain available from Flavell Lab (see ‘Data availability’) |
| Genetic reagent (C. elegans) | str-44(syb1869); rict-1(ft7); daf-7(e1372) | This study | SWF679 | Strain available from Flavell Lab (see ‘Data availability’) |
| Genetic reagent (C. elegans) | str44(syb1869); atgl-1(gk176565) | This study | SWF637 | Strain available from Flavell Lab (see ‘Data availability’) |
| Genetic reagent (C. elegans) | str44(syb1869); lim-4(ky403) | This study | SWF687 | Strain available from Flavell Lab (see ‘Data availability’) |
| Genetic reagent (C. elegans) | str-44(syb1869); rict-1(ft7); daf-2 (m41) | This study | SWF699 | Strain available from Flavell Lab (see ‘Data availability’) |
| Genetic reagent (C. elegans) | str-44(syb1869); flvEx350[gpa-6::egl-30(gf) (5 ng/μL), myo-2::mCherry (1 ng/μL)] | This study | SWF750 | Strain available from Flavell Lab (see ‘Data availability’) |
| Genetic reagent (C. elegans) | str-44(syb1869); rict-1(ft7); daf-16(mu86) | This study | SWF642 | Strain available from Flavell Lab (see ‘Data availability’) |
| Genetic reagent (C. elegans) | flvEx390[gpa-6::str-44-sl2-mCherry] | This study | SWF827 | Strain available from Flavell Lab (see ‘Data availability’) |
| Genetic reagent (C. elegans) | flvEx308[ttx-3::TeTx, myo-3::mCherry] | This study | SWF698 | Strain available from Flavell Lab (see ‘Data availability’) |
| Genetic reagent (C. elegans) | flvEx307[gcy-28d::TeTx, myo-3::mCherry] | This study | SWF697 | Strain available from Flavell Lab (see ‘Data availability’) |
| Genetic reagent (C. elegans) | flvEx399[gpa-6::TeTx, myo-3::mCherry] | This study | SWF843 | Strain available from Flavell Lab (see ‘Data availability’) |
| Genetic reagent (C. elegans) | srd-28(syb2320); daf-16(mu86) | This study | SWF844 | Strain available from Flavell Lab (see ‘Data availability’) |
| Genetic reagent (C. elegans) | srd-28(syb2320); daf-2(m41) | This study | SWF845 | Strain available from Flavell Lab (see ‘Data availability’) |
| Genetic reagent (C. elegans) | srd-28(syb2320); tax-4(p678) | This study | SWF846 | Strain available from Flavell Lab (see ‘Data availability’) |
| Chemical compound, drug | Butyl acetate | Sigma-Aldrich | 287725 | |
| Chemical compound, drug | Propyl acetate | Sigma-Aldrich | 537438 | |
| Chemical compound, drug | Aztreonam | Sigma-Aldrich | PZ0038 | |
| Software, algorithm | MATLAB | MathWorks | R2014a, R2021b |
Additional files
-
Supplementary file 1
List of neuronal genes whose expression is altered by fasting.
Table of genes that are upregulated or downregulated in neurons in fasted animals. Transcripts from neuronal ribotagging biological replicates (three per condition, fed versus fasted) were mapped to the C. elegans genome (WBcel235) with kallisto then analyzed for differential expression of annotated genes with sleuth. Sleuth generated a gene-level model fit to ribotagged vs. input and fed vs. fasted conditions. A Wald test was then applied to generate a beta statistic (b), which approximates to the log2 fold-change in expression between the fed and starved conditions. Genes were included if b > 2 (upregulated in fasted, 802 genes) or b < -2 (downregulated in fasted, 647 genes).
- https://cdn.elifesciences.org/articles/79557/elife-79557-supp1-v1.xlsx
-
MDAR checklist
- https://cdn.elifesciences.org/articles/79557/elife-79557-mdarchecklist1-v1.docx
Download links
A two-part list of links to download the article, or parts of the article, in various formats.
Downloads (link to download the article as PDF)
Open citations (links to open the citations from this article in various online reference manager services)
Cite this article (links to download the citations from this article in formats compatible with various reference manager tools)
Diverse states and stimuli tune olfactory receptor expression levels to modulate food-seeking behavior
eLife 11:e79557.
https://doi.org/10.7554/eLife.79557


