Right inferior frontal gyrus damage is associated with impaired initiation of inhibitory control, but not its implementation
- Department of Psychological and Brain Sciences, University of Iowa, United States
- Cognitive Control Collaborative, University of Iowa, United States
- Department of Psychology, University of Amsterdam, Netherlands
- Department of Clinical and Health Psychology, University of Florida, United States
- Department of Neurology, University of Iowa Hospitals and Clinics, United States
Figures
Figure 1
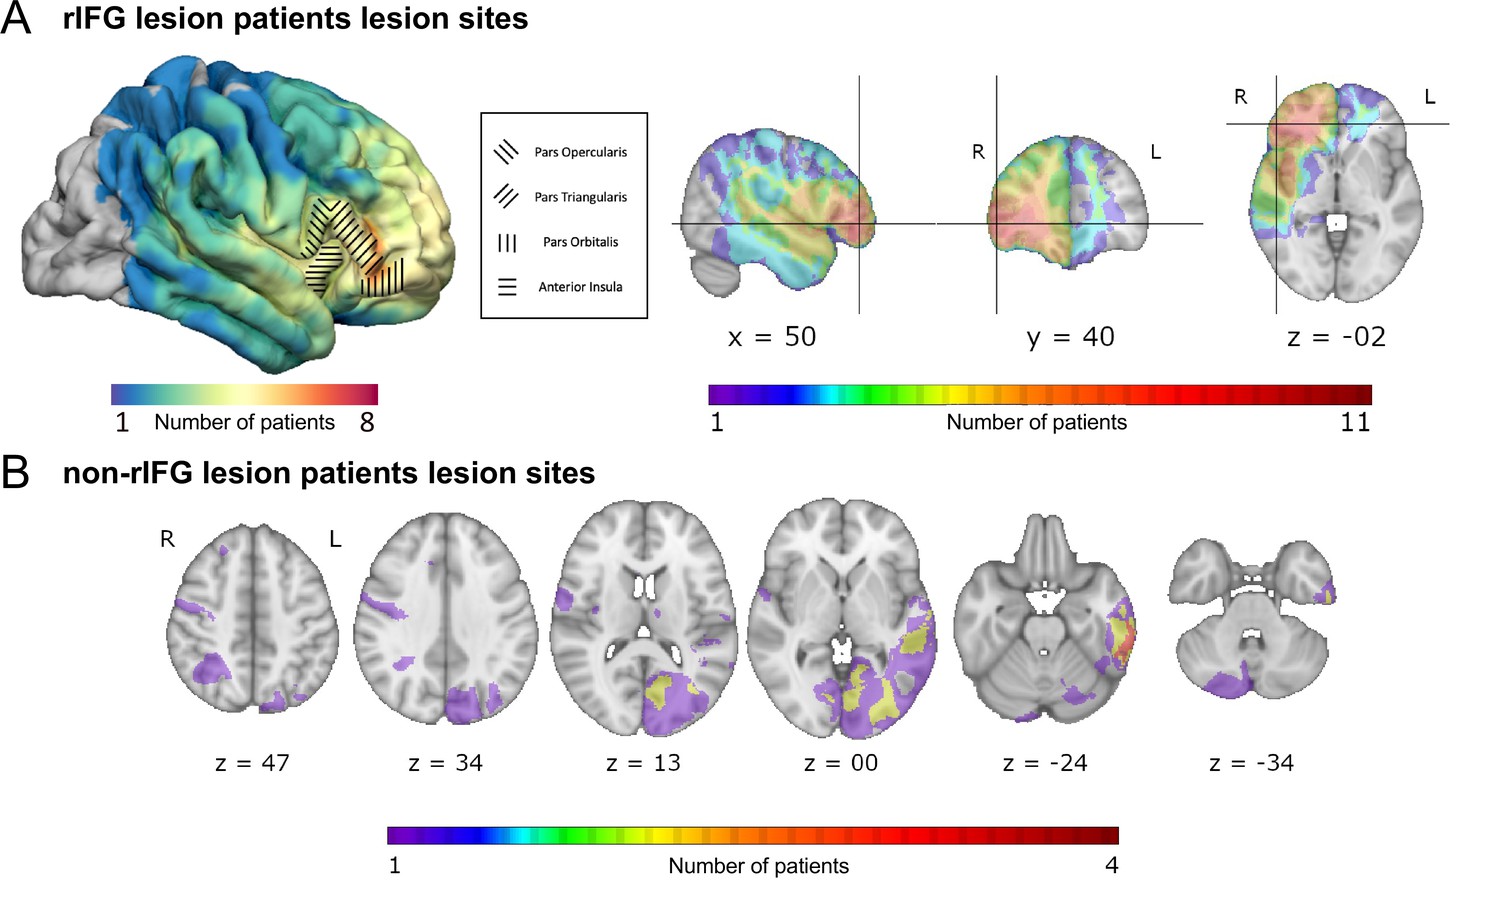
Overlap of lesions in patients with right inferior frontal gyrus (rIFG) lesions (rIFG lesion patients, top, A) and in patients with lesions outside of rIFG (non-rIFG lesion patients, bottom, B).
(A) Top left: a lateral view of the lesion overlaps for rIFG lesion patients at the cortical level. Within the rIFG, three subregions are labeled: pars opercularis, pars triangularis, and pars orbitalis. The anterior insula is also highlighted. Top right (in order): sagittal, coronal, and axial views of the lesion overlap for rIFG lesion patients. The crosshair is centered on the right inferior frontal gyrus (IFG) on the Harvard-Oxford Atlas. All rIFG patients were included (N = 16). (B) Bottom: axial view of the lesion overlap for non-rIFG lesion patients. One lesion mask for a patient was missing and not included (N = 15). The color bar indicates the number of patients overlapped in lesion sites. R: right; L: left.
Figure 2
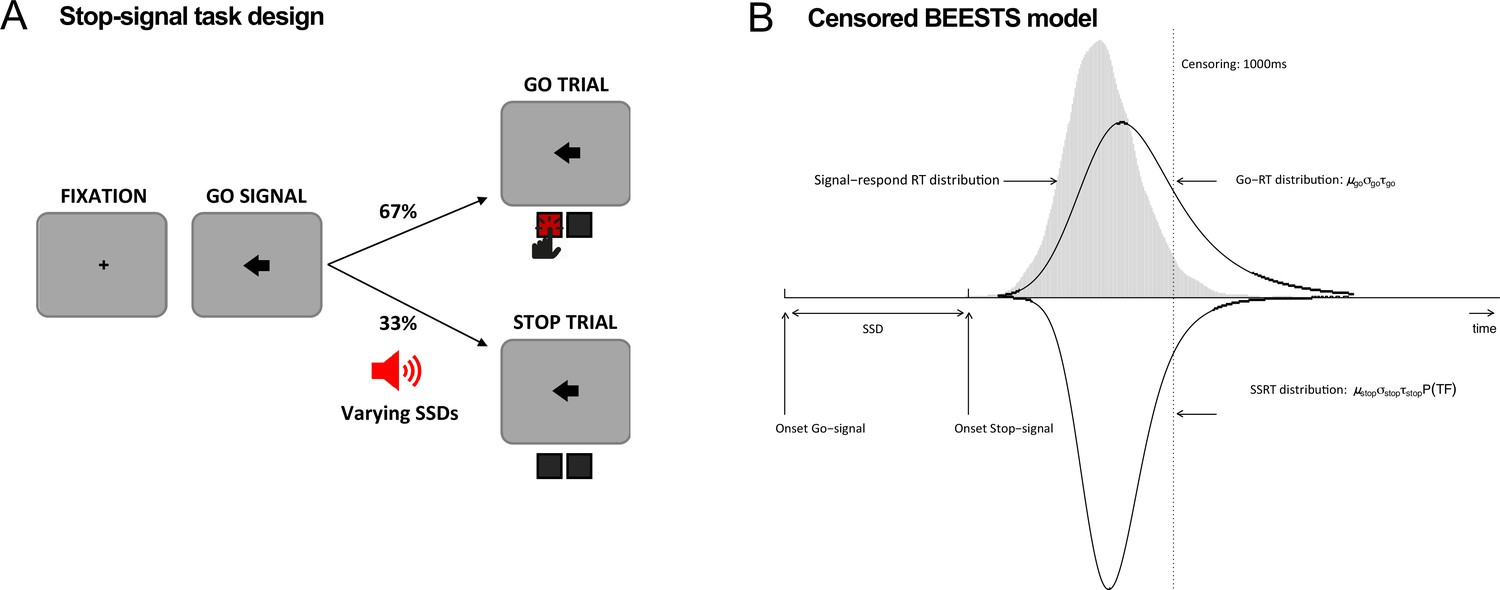
Task diagram and BEESTS model.
(A) Schematic design of the stop-signal task. (B) Graphical representation of the censored BEESTS model. The model assumes that the finishing times of the go (Go-RT distribution) and the stop runner (stop-signal reaction time [SSRT] distribution) follow an ex-Gaussian distribution with parameters µgo, σgo, and τgo, and µstop, σstop, and τstop, respectively. The finishing time distributions, and hence also the observed distribution of signal-respond RTs, are assumed to be censored above at 1000 ms to accommodate trials where the runners did not finish before the response window. The trigger failure parameter, P(TF), quantifies the probability that the stop runner was not initiated.
Figure 3
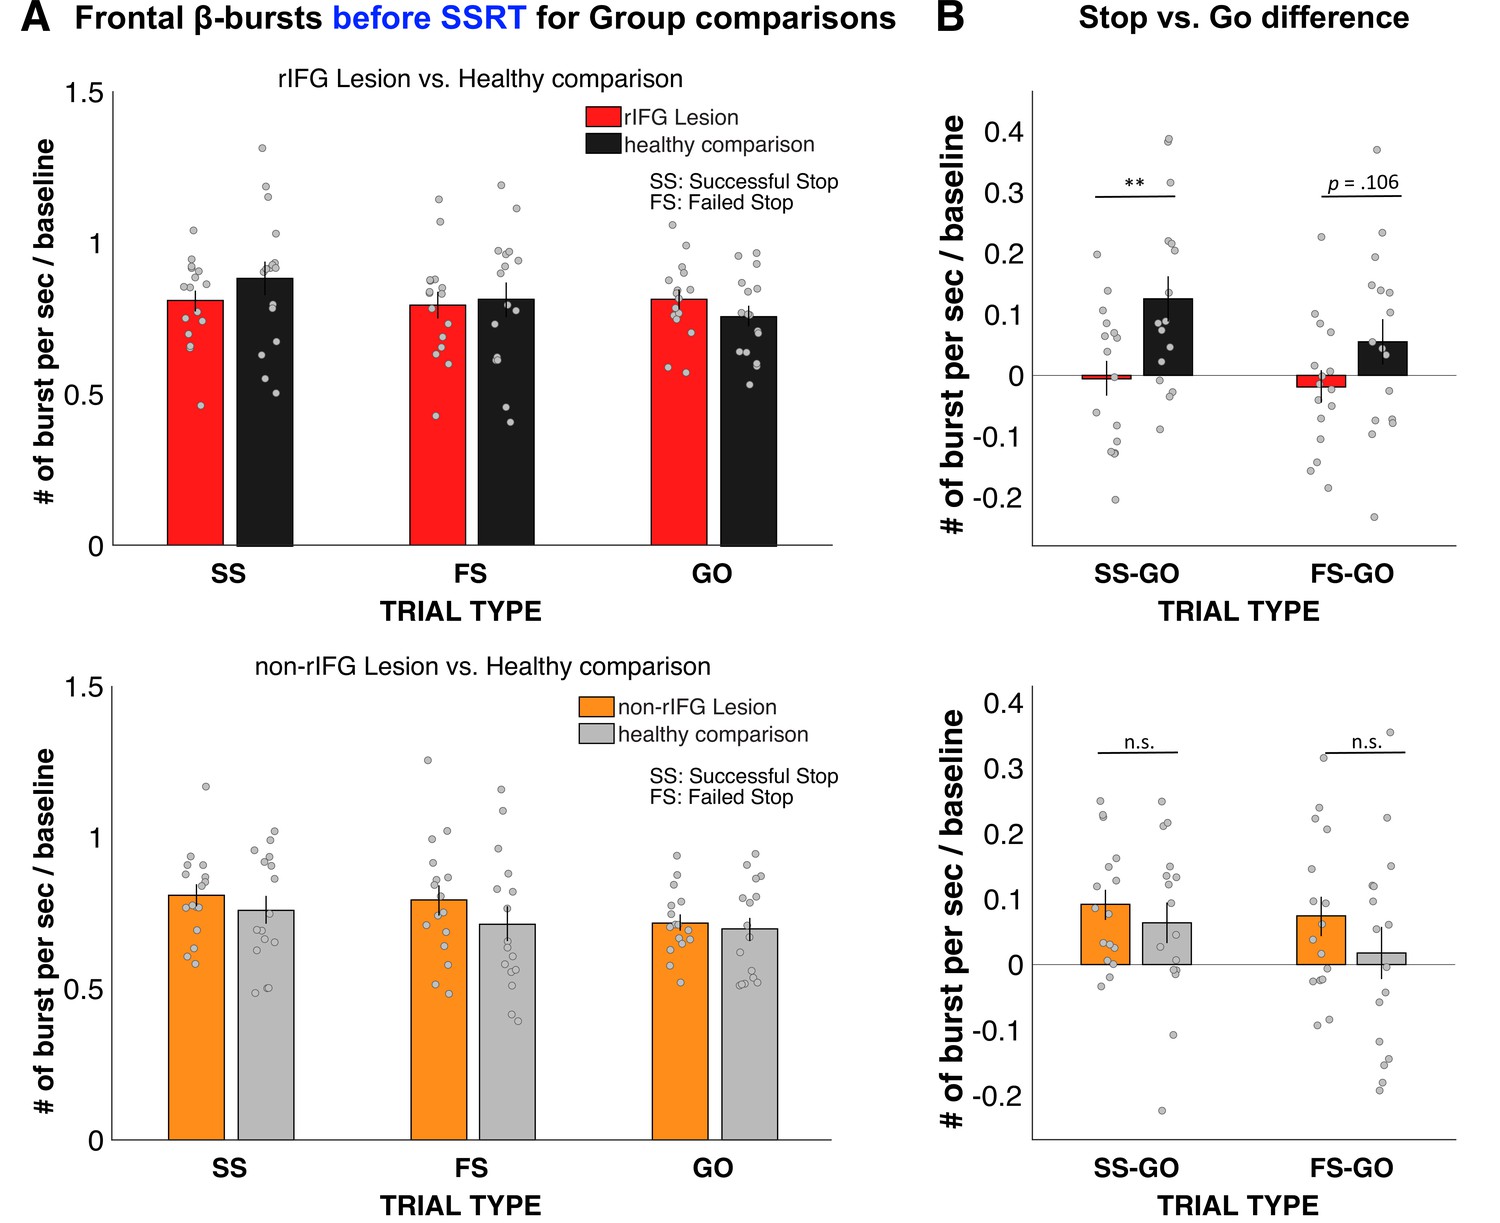
Normalized β-burst rate (per second) for group comparisons.
(A) Frontal β-burst rate before stop-signal reaction time (SSRT) was shown for TRIAL TYPE (Successful-stop, Failed-stop, and Go) for two groups, respectively. Top: right inferior frontal gyrus (rIFG) lesion group vs. matched healthy comparison group. Bottom: non-rIFG lesion group vs. matched healthy comparison group. Dots represent individual participant means. Error bar indicates ± SEM. (B) Stop vs. Go difference (Successful-stop – Go and Failed-stop – Go). Top: rIFG lesion group vs. matched healthy comparison group. Bottom: non-rIFG lesion group vs. matched healthy comparison group. Dots represent individual participant means. Error bar indicates ± SEM.
Figure 4
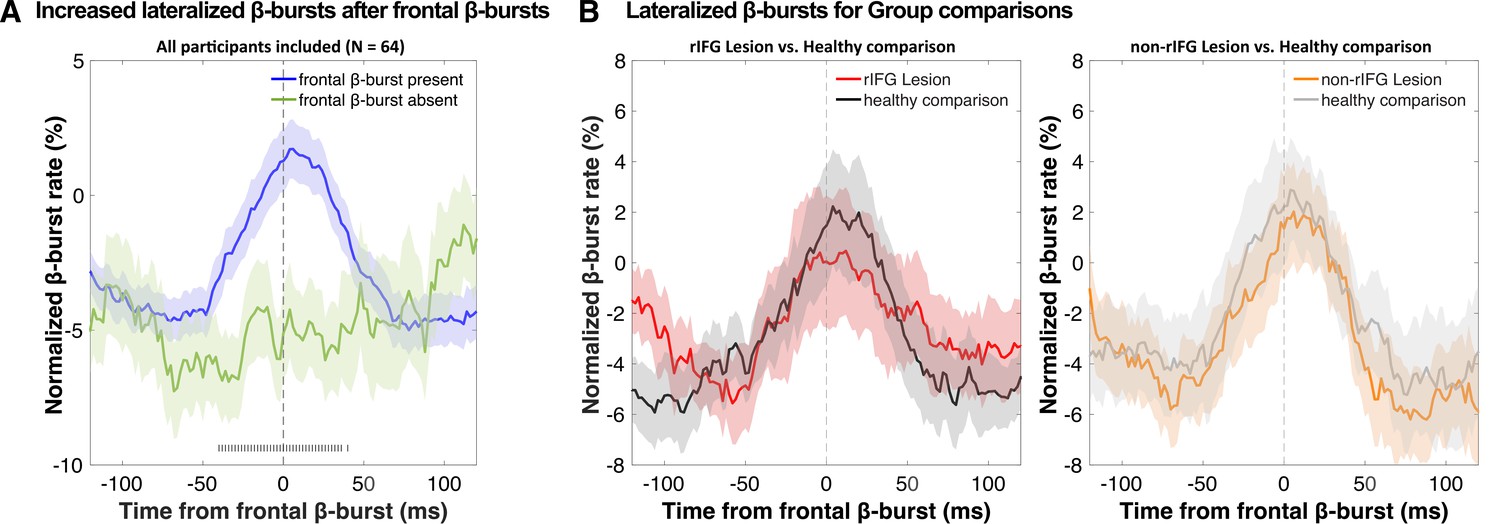
Normalized β-burst rate (%) at bilateral sensorimotor electrodes (C3/C4) following the first frontal β-burst in individual Successful-stop trials during the critical time period (stop-signal to stop-signal reaction time [SSRT]).
(A) A comparison between trials with frontal β-bursts to trials without frontal β-bursts (where the sensorimotor β-bursts were time-locked to a random time point within a critical time period). The sensorimotor burst rates following frontal β-bursts were significantly increased (significance outlined at the bottom of the graph). The colored patch shows the ± SEM at each time point. (B) Group differences (lesion vs. matched healthy comparisons) in sensorimotor β-burst rates. No significant difference was found. The colored patch shows the ± SEM at each time point. Average trial count for these graphs varied between 57.7 and 63.5 and did not differ significantly between groups.
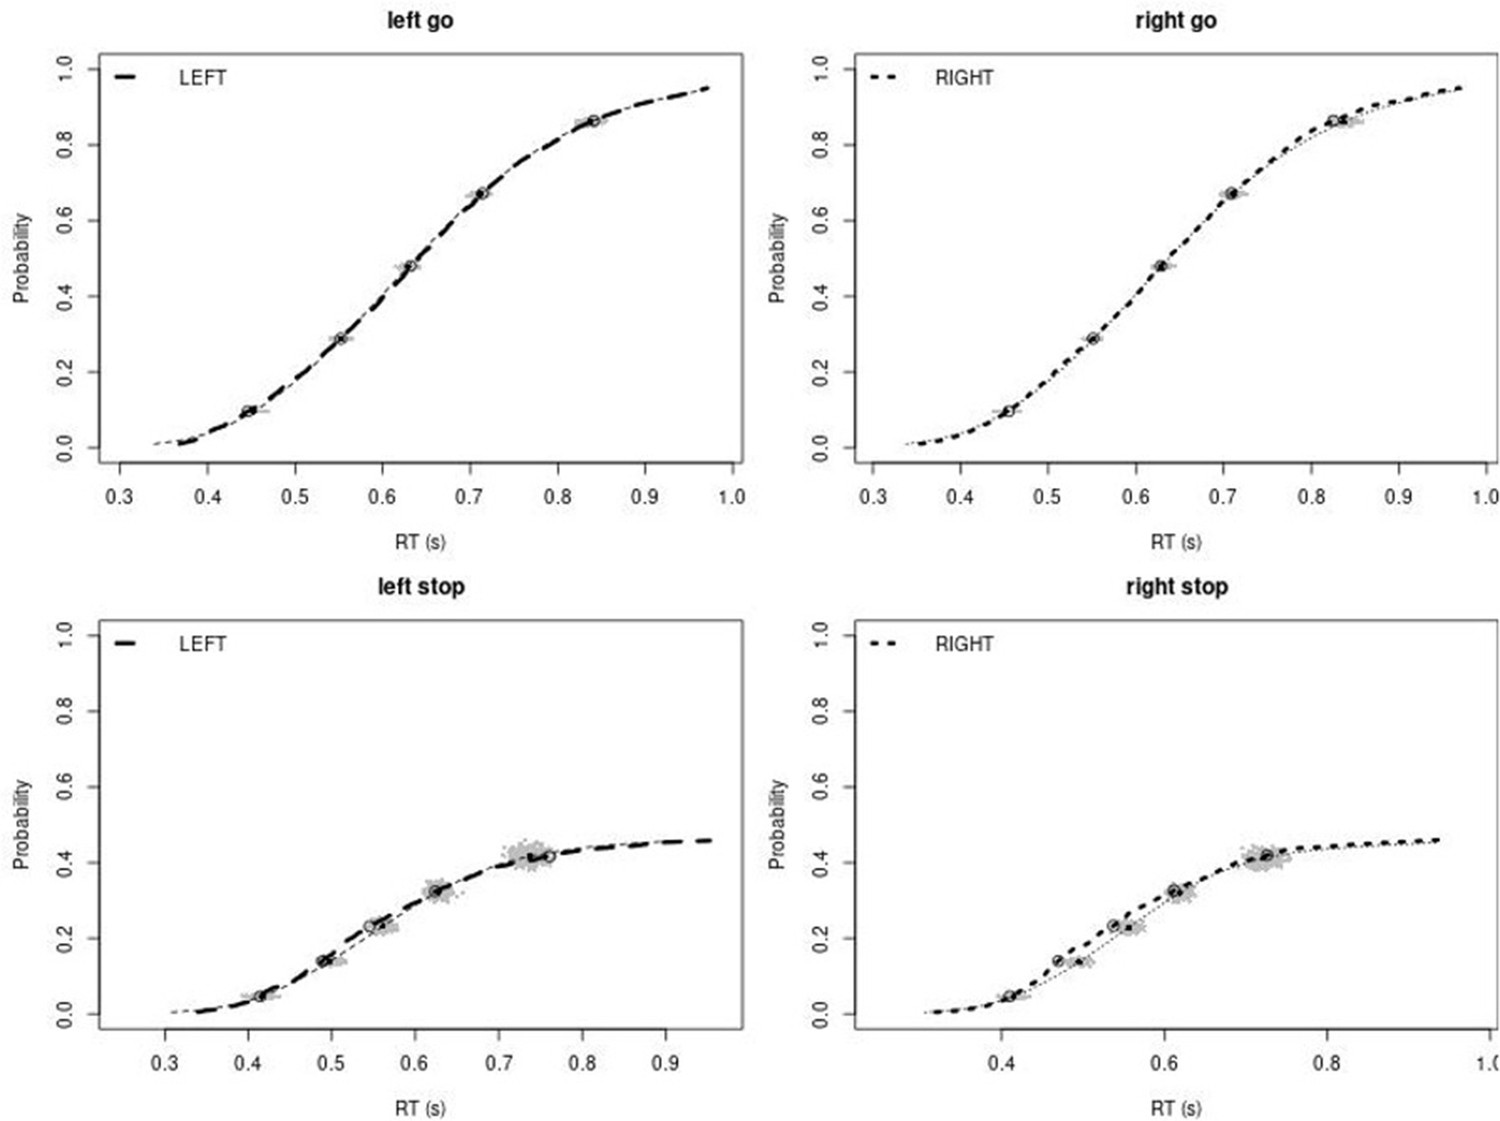
Appendix 1—figure 1
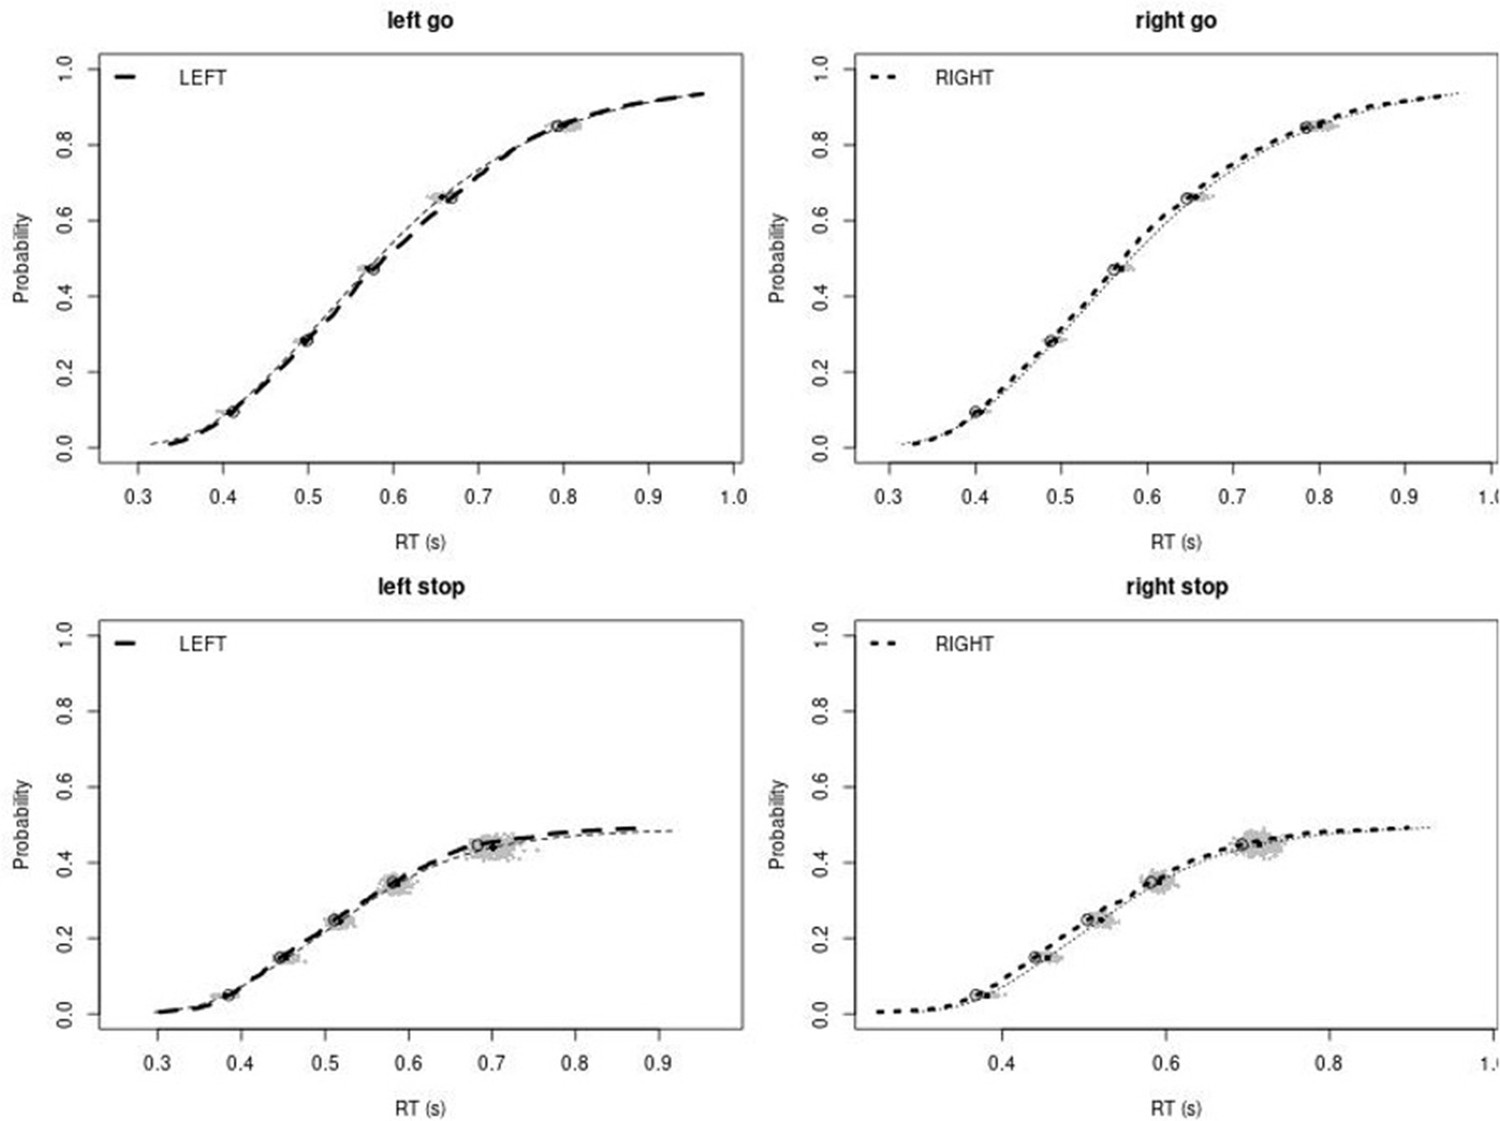
Observed and predicted cumulative distribution function (CDF) of Go-RTs (upper panels) and signal-respond RTs (lower panels), separately for left and right stimuli, for the right inferior frontal gyrus (rIFG) lesion group.
The observed and predicted CDFs were averaged across participants. Signal-respond RTs were collapsed across stop-signal delay (SSD). Thick dashed and dotted lines show the CDF of the observed ‘LEFT’ and ‘RIGHT’ responses, respectively. Circles show the 10th, 30th, 50th, 70th, and 90th percentile of the distributions. Thin dashed and dotted lines show the CDF of the predicted ‘LEFT’ and ‘RIGHT’ responses, respectively, averaged across the 500 predictions. For each percentile, the gray clouds show the 500 predicted percentiles.
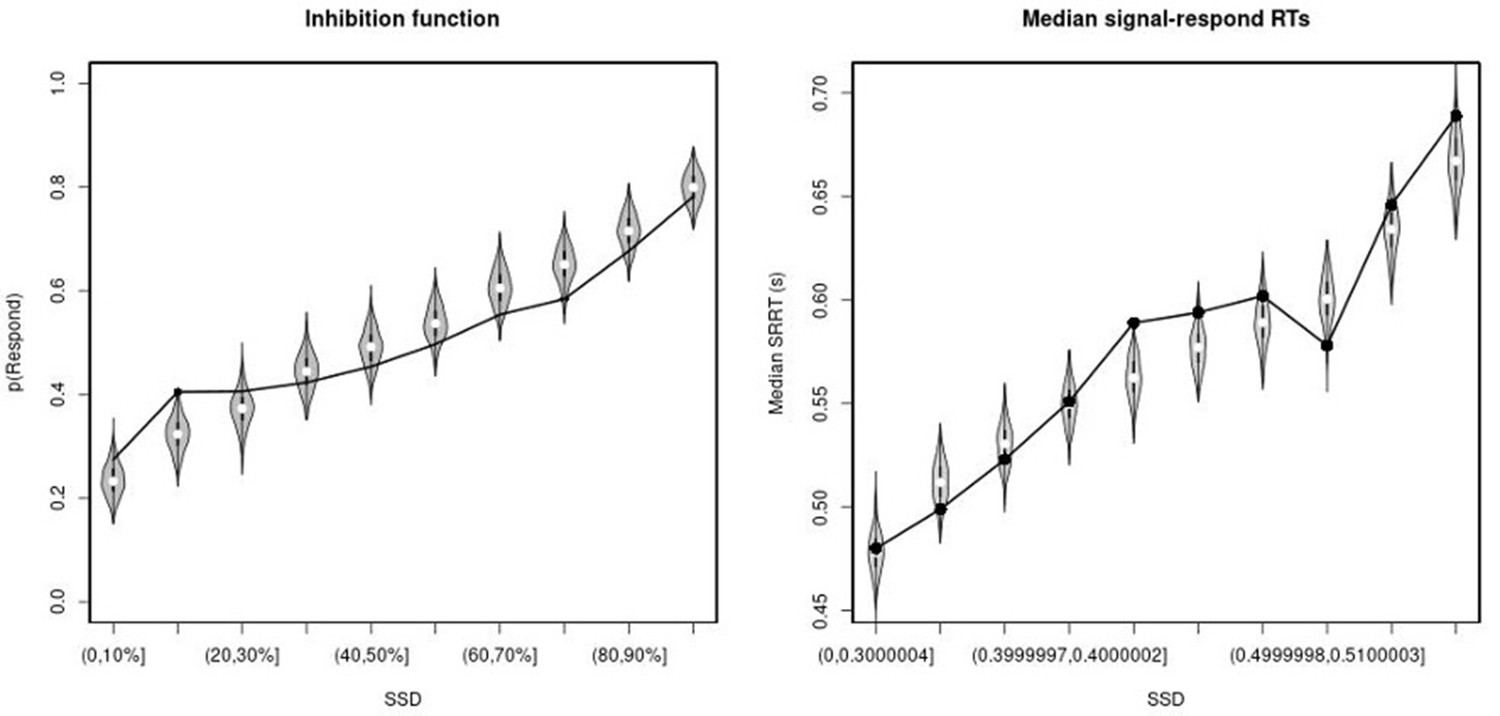
Appendix 1—figure 2
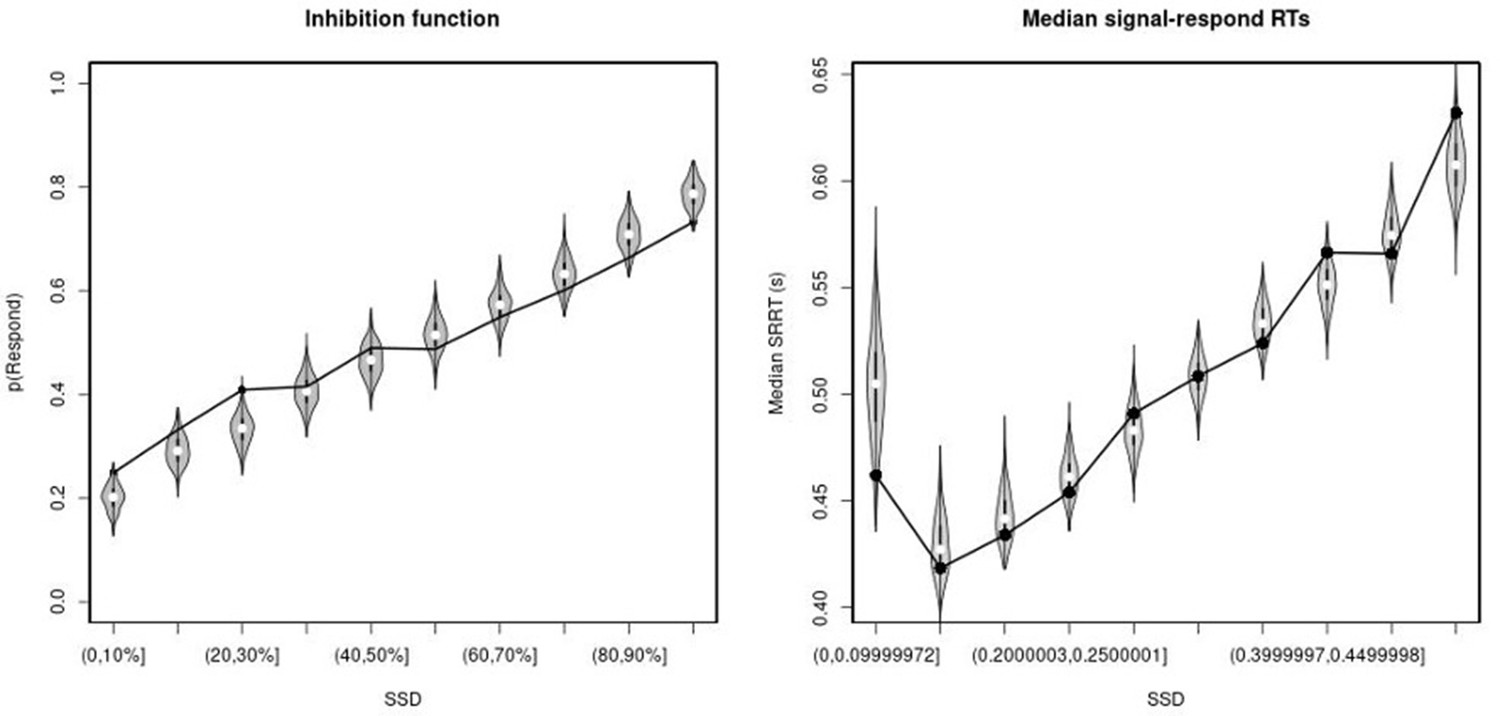
Observed and predicted inhibition function (left panel) and median signal-respond RT as a function of stop-signal delay (SSD; right panel) for the right inferior frontal gyrus (rIFG) lesion group.
In the left panel, black bullets show the observed average response rate on stop-signal trials (P(Respond)) for each SSD category, where the SSD categories were defined in terms of the percentiles of the distribution of SSDs for each participant and then averaged across participants. In the right panel, black bullets show the observed average median signal-respond RT (SRRT) for each SSD category, where SSD categories were defined by pooling SSDs over participants before calculating the percentiles. The gray violin plots show the distribution of the 500 average response rates and SRRTs predicted by the model, with the white circles representing the median of the predictions.
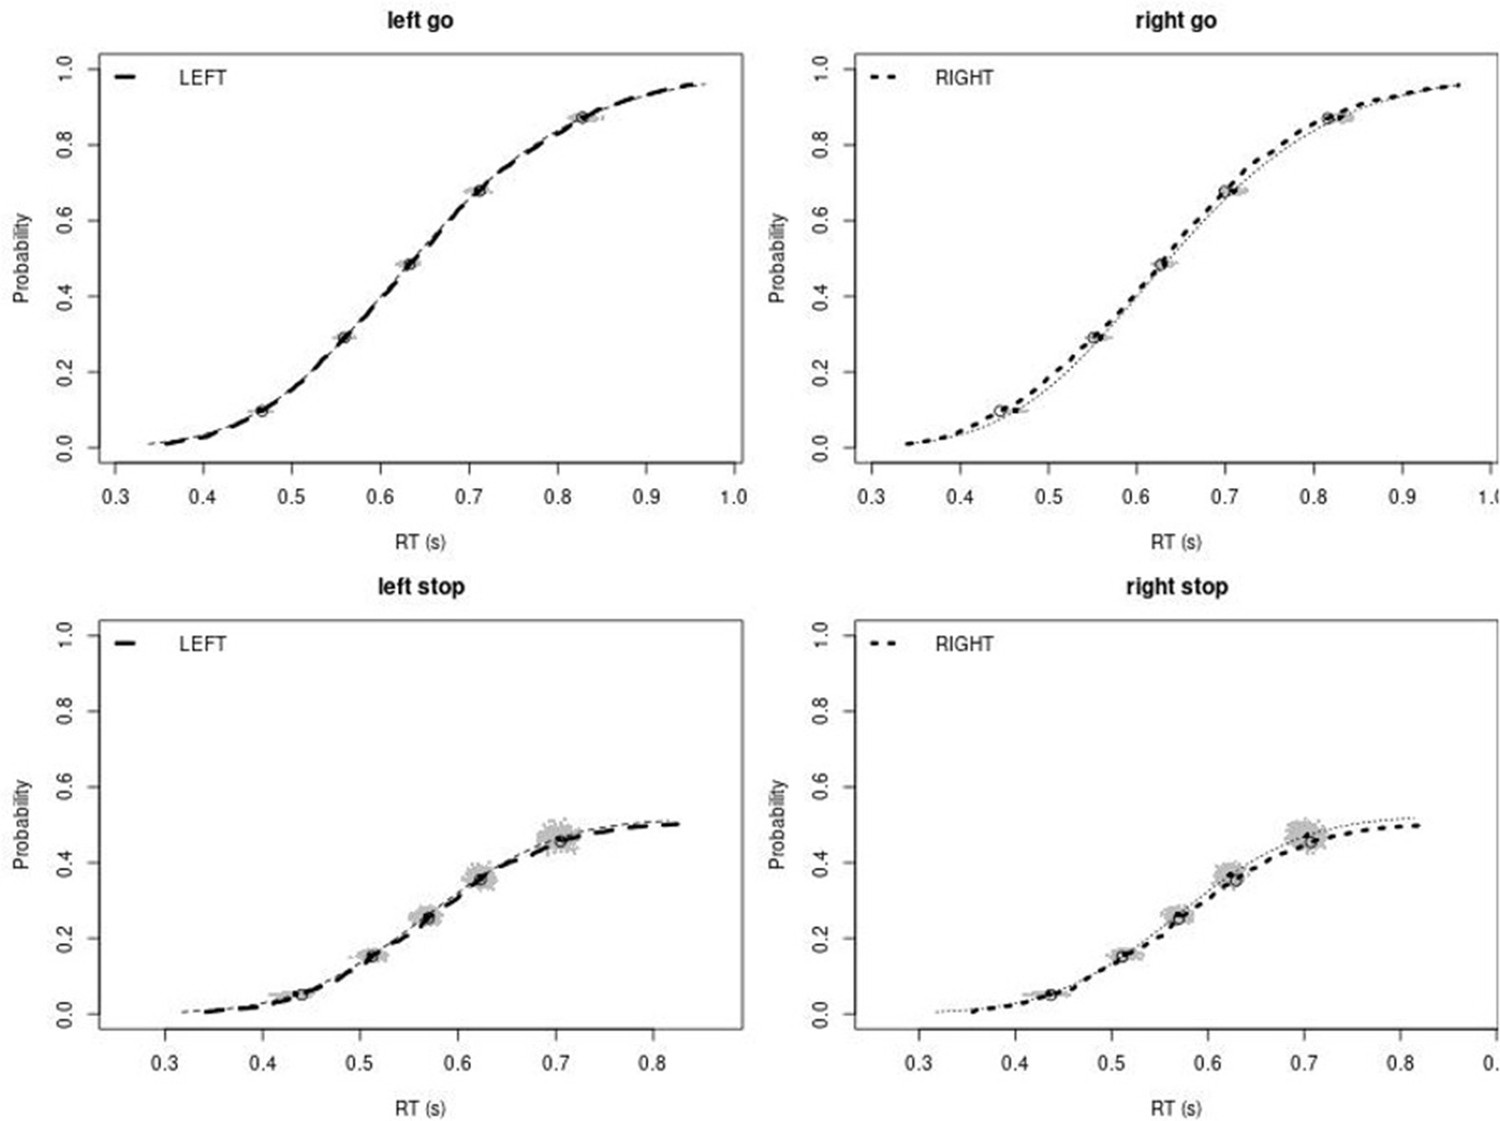
Appendix 1—figure 3

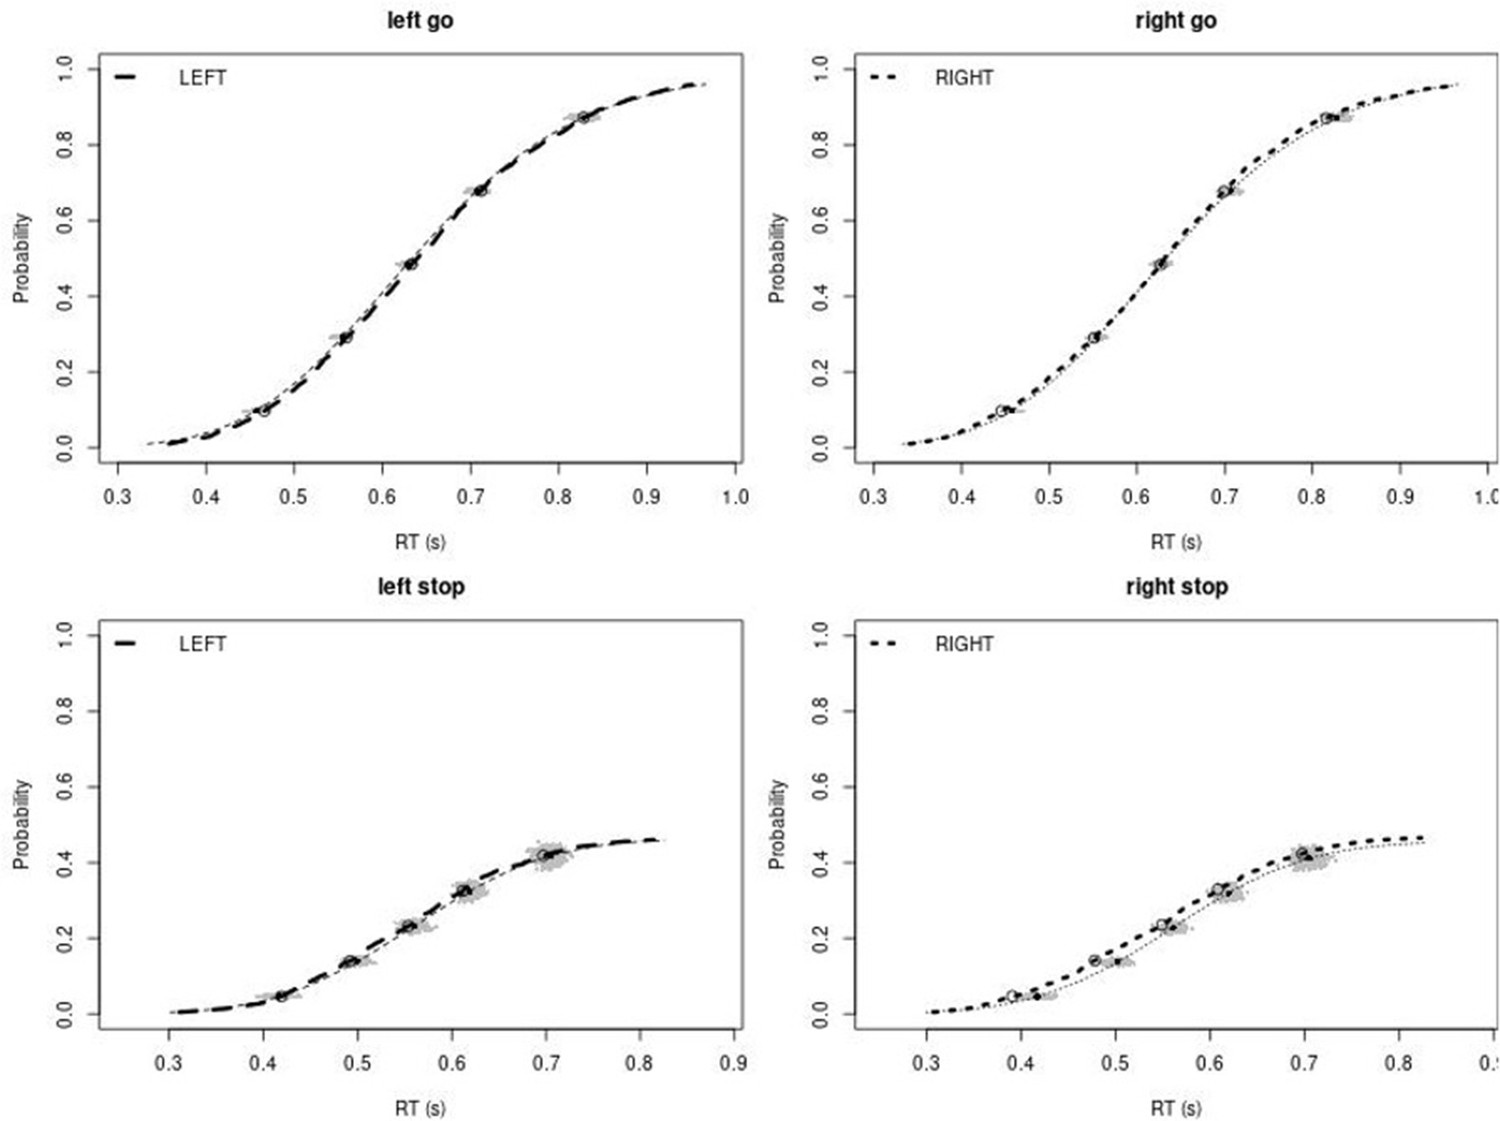
Observed and predicted cumulative distribution function (CDF) of Go-RTs (upper panels) and signal-respond RTs (lower panels), separately for left and right stimuli, for the matched comparison group for the right inferior frontal gyrus (rIFG) lesion patients.
The observed and predicted CDFs were averaged across participants. Signal-respond RTs were collapsed across SSD. Thick dashed and dotted lines show the CDF of the observed ‘LEFT’ and ‘RIGHT’ responses, respectively. Circles show the 10th, 30th, 50th, 70th, and 90th percentile of the distributions. Thin dashed and dotted lines show the CDF of the predicted ‘LEFT’ and ‘RIGHT’ responses, respectively, averaged across the 500 predictions. For each percentile, the gray clouds show the 500 predicted percentiles.
Appendix 1—figure 4

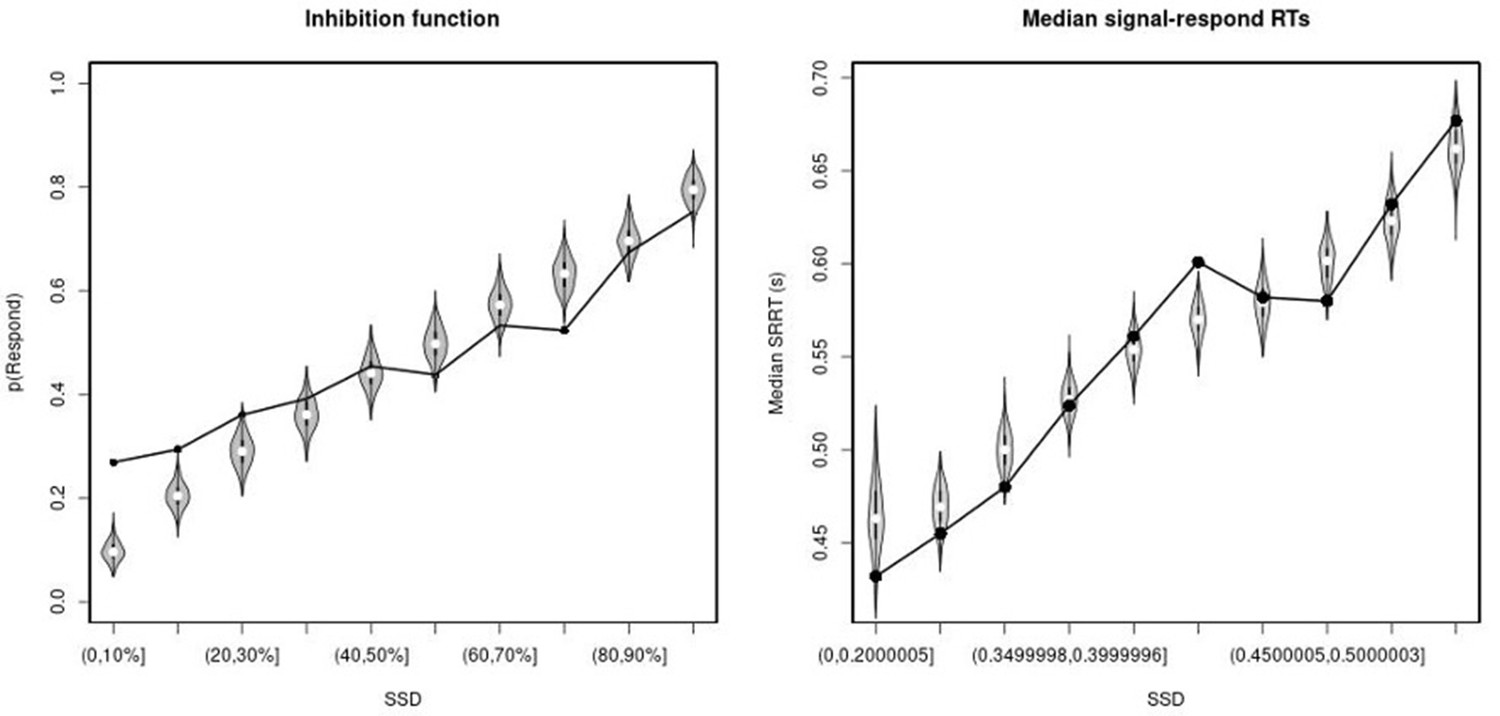
Observed and predicted inhibition function (left panel) and median signal-respond RT as a function of stop-signal delay (SSD; right panel) for the matched comparison group for the right inferior frontal gyrus (rIFG) lesion patients.
In the left panel, black bullets show the observed average response rate on stop-signal trials (P(Respond)) for each SSD category, where the SSD categories were defined in terms of the percentiles of the distribution of SSDs for each participant and then averaged across participants. In the right panel, black bullets show the observed average median signal-respond RT (SRRT) for each SSD category, where SSD categories were defined by pooling SSDs over participants before calculating the percentiles. The gray violin plots show the distribution of the 500 average response rates and SRRTs predicted by the model, with the white circles representing the median of the predictions.
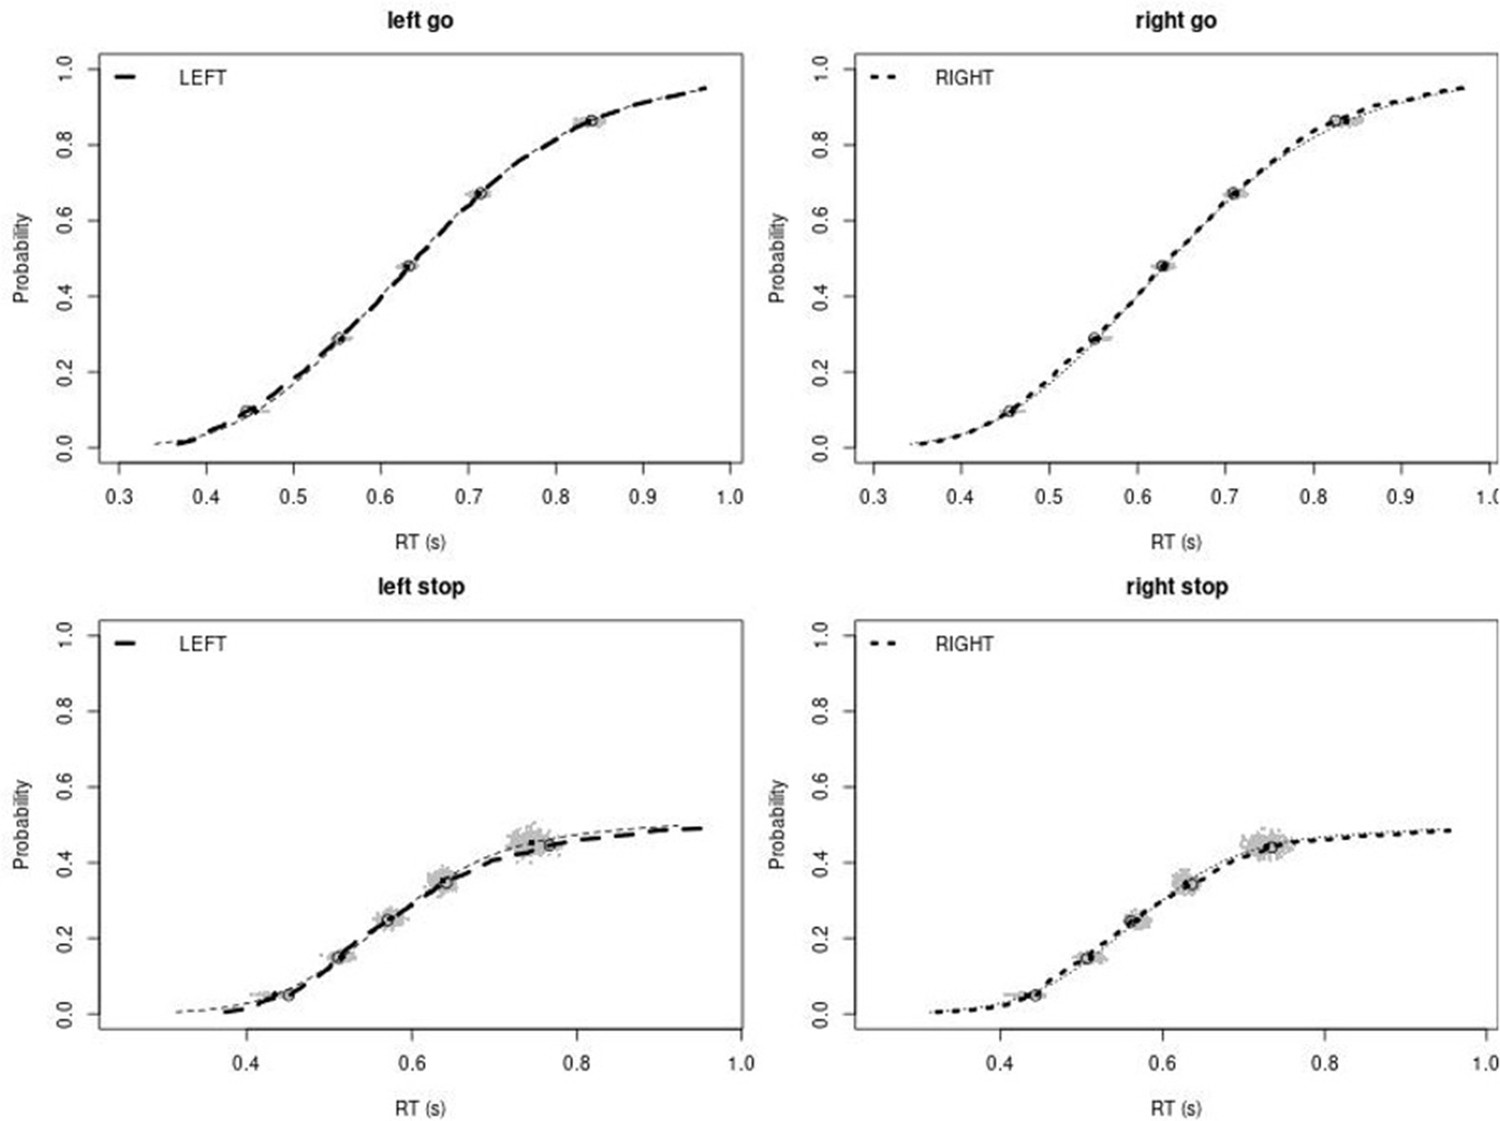
Appendix 1—figure 5
Observed and predicted cumulative distribution function (CDF) of Go-RTs (upper panels) and signal-respond RTs (lower panels), separately for left and right stimuli, for the non-right inferior frontal gyrus (non-rIFG) lesion group.
The observed and predicted CDFs were averaged across participants. Signal-respond RTs were collapsed across SSD. Thick dashed and dotted lines show the CDF of the observed ‘LEFT’ and ‘RIGHT’ responses, respectively. Circles show the 10th, 30th, 50th, 70th, and 90th percentile of the distributions. Thin dashed and dotted lines show the CDF of the predicted ‘LEFT’ and ‘RIGHT’ responses, respectively, averaged across the 500 predictions. For each percentile, the gray clouds show the 500 predicted percentiles.
Appendix 1—figure 6
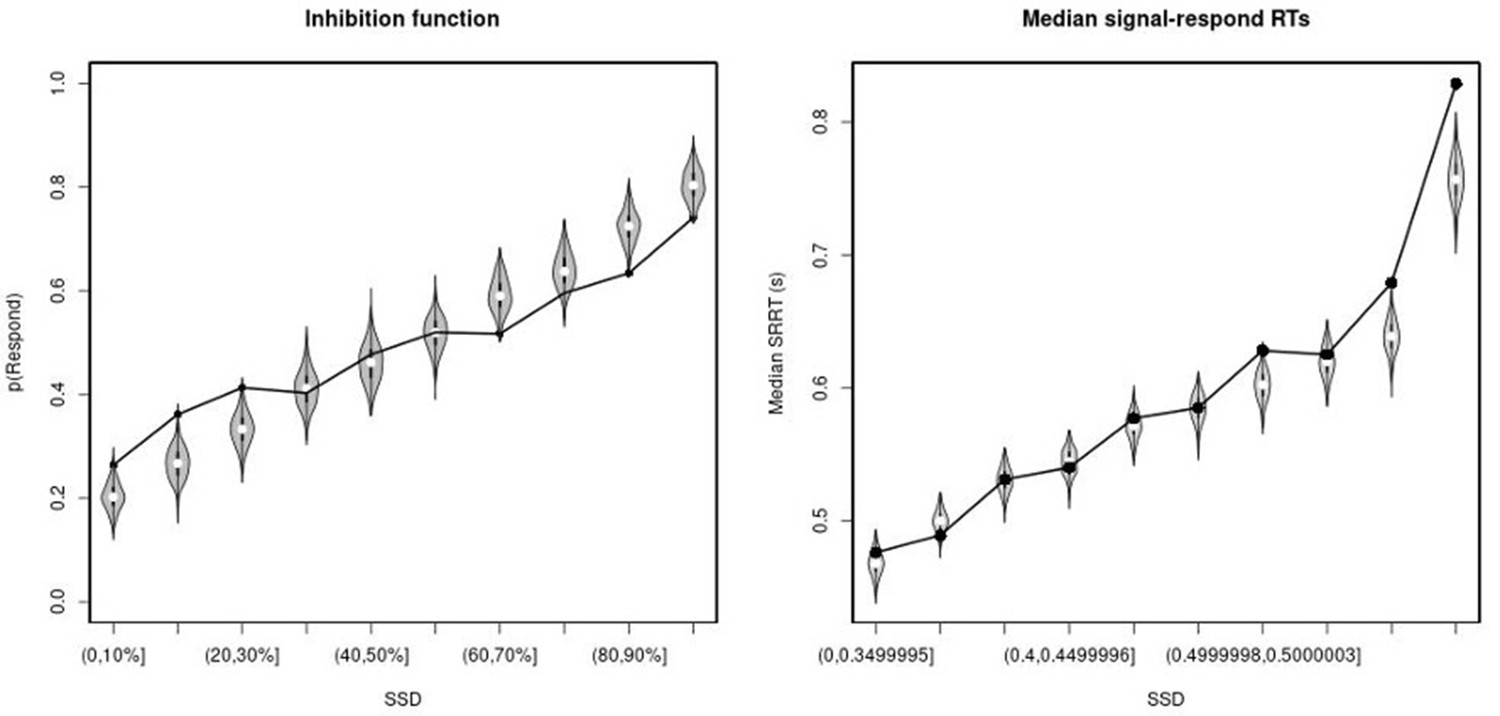
Observed and predicted inhibition function (left panel) and median signal-respond RT as a function of stop-signal delay (SSD; right panel) for the non-right inferior frontal gyrus (non-rIFG) lesion patients.
In the left panel, black bullets show the observed average response rate on stop-signal trials (P(Respond)) for each SSD category, where the SSD categories were defined in terms of the percentiles of the distribution of SSDs for each participant and then averaged across participants. In the right panel, black bullets show the observed average median signal-respond RT (SRRT) for each SSD category, where SSD categories were defined by pooling SSDs over participants before calculating the percentiles. The gray violin plots show the distribution of the 500 average response rates and SRRTs predicted by the model, with the white circles representing the median of the predictions.
Appendix 1—figure 7
Observed and predicted cumulative distribution function (CDF) of Go-RTs (upper panels) and signal-respond RTs (lower panels), separately for left and right stimuli, for the matched comparison group for the non-right inferior frontal gyrus (non-rIFG) lesion patients.
The observed and predicted CDFs were averaged across participants. Signal-respond RTs were collapsed across stop-signal delay (SSD). Thick dashed and dotted lines show the CDF of the observed ‘LEFT’ and ‘RIGHT’ responses, respectively. Circles show the 10th, 30th, 50th, 70th, and 90th percentile of the distributions. Thin dashed and dotted lines show the CDF of the predicted ‘LEFT’ and ‘RIGHT’ responses, respectively, averaged across the 500 predictions. For each percentile, the gray clouds show the 500 predicted percentiles.
Appendix 1—figure 8

Observed and predicted inhibition function (left panel) and median signal-respond RT as a function of stop-signal delay (SSD; right panel) for the matched comparison group for the non-right inferior frontal gyrus (non-rIFG) lesion patients.
In the left panel, black bullets show the observed average response rate on stop-signal trials (P(Respond)) for each SSD category, where the SSD categories were defined in terms of the percentiles of the distribution of SSDs for each participant and then averaged across participants. In the right panel, black bullets show the observed average median signal-respond RT (SRRT) for each SSD category, where SSD categories were defined by pooling SSDs over participants before calculating the percentiles. The gray violin plots show the distribution of the 500 average response rates and SRRTs predicted by the model, with the white circles representing the median of the predictions.
Appendix 1—figure 9
Observed and predicted cumulative distribution function (CDF) of Go-RTs (upper panels) and signal-respond RTs (lower panels), separately for left and right stimuli, for the non-right inferior frontal gyrus (non-rIFG) lesion group after removing stop-signal trials at stop-signal delays (SSDs) of 0, 50, 100, 150, and 250 ms.
The observed and predicted CDFs were averaged across participants. Signal-respond RTs were collapsed across SSD. Thick dashed and dotted lines show the CDF of the observed ‘LEFT’ and ‘RIGHT’ responses, respectively. Circles show the 10th, 30th, 50th, 70th, and 90th percentile of the distributions. Thin dashed and dotted lines show the CDF of the predicted ‘LEFT’ and ‘RIGHT’ responses, respectively, averaged across the 500 predictions. For each percentile, the gray clouds show the 500 predicted percentiles.
Appendix 1—figure 10
Observed and predicted inhibition function (left panel) and median signal-respond RT as a function of stop-signal delay (SSD; right panel) for the non-right inferior frontal gyrus (non-rIFG) lesion patients after removing stop-signal trials at SSDs of 0, 50, 100, 150, and 250 ms.
In the left panel, black bullets show the observed average response rate on stop-signal trials (P(Respond)) for each SSD category, where the SSD categories were defined in terms of the percentiles of the distribution of SSDs for each participant and then averaged across participants. In the right panel, black bullets show the observed average median signal-respond RT (SRRT) for each SSD category, where SSD categories were defined by pooling SSDs over participants before calculating the percentiles. The gray violin plots show the distribution of the 500 average response rates and SRRTs predicted by the model, with the white circles representing the median of the predictions.
Appendix 1—figure 11
Observed and predicted cumulative distribution function (CDF) of Go-RTs (upper panels) and signal-respond RTs (lower panels), separately for left and right stimuli, for the matched comparison group for the non-right inferior frontal gyrus (non-rIFG) lesion patients after removing stop-signal trials at SSDs of 0, 50, 100, 150, and 250 ms.
The observed and predicted CDFs were averaged across participants. Signal-respond RTs were collapsed across SSD. Thick dashed and dotted lines show the CDF of the observed ‘LEFT’ and ‘RIGHT’ responses, respectively. Circles show the 10th, 30th, 50th, 70th, and 90th percentile of the distributions. Thin dashed and dotted lines show the CDF of the predicted ‘LEFT’ and ‘RIGHT’ responses, respectively, averaged across the 500 predictions. For each percentile, the gray clouds show the 500 predicted percentiles.
Appendix 1—figure 12
Observed and predicted inhibition function (left panel) and median signal-respond RT as a function of stop-signal delay (SSD; right panel) for the matched comparison group for the non-right inferior frontal gyrus (non-rIFG) lesion patients after removing stop-signal trials at SSDs of 0, 50, 100, 150, and 250 ms.
In the left panel, black bullets show the observed average response rate on stop-signal trials (P(Respond)) for each SSD category, where the SSD categories were defined in terms of the percentiles of the distribution of SSDs for each participant and then averaged across participants. In the right panel, black bullets show the observed average median signal-respond RT (SRRT) for each SSD category, where SSD categories were defined by pooling SSDs over participants before calculating the percentiles. The gray violin plots show the distribution of the 500 average response rates and SRRTs predicted by the model, with the white circles representing the median of the predictions.
Appendix 1—figure 13
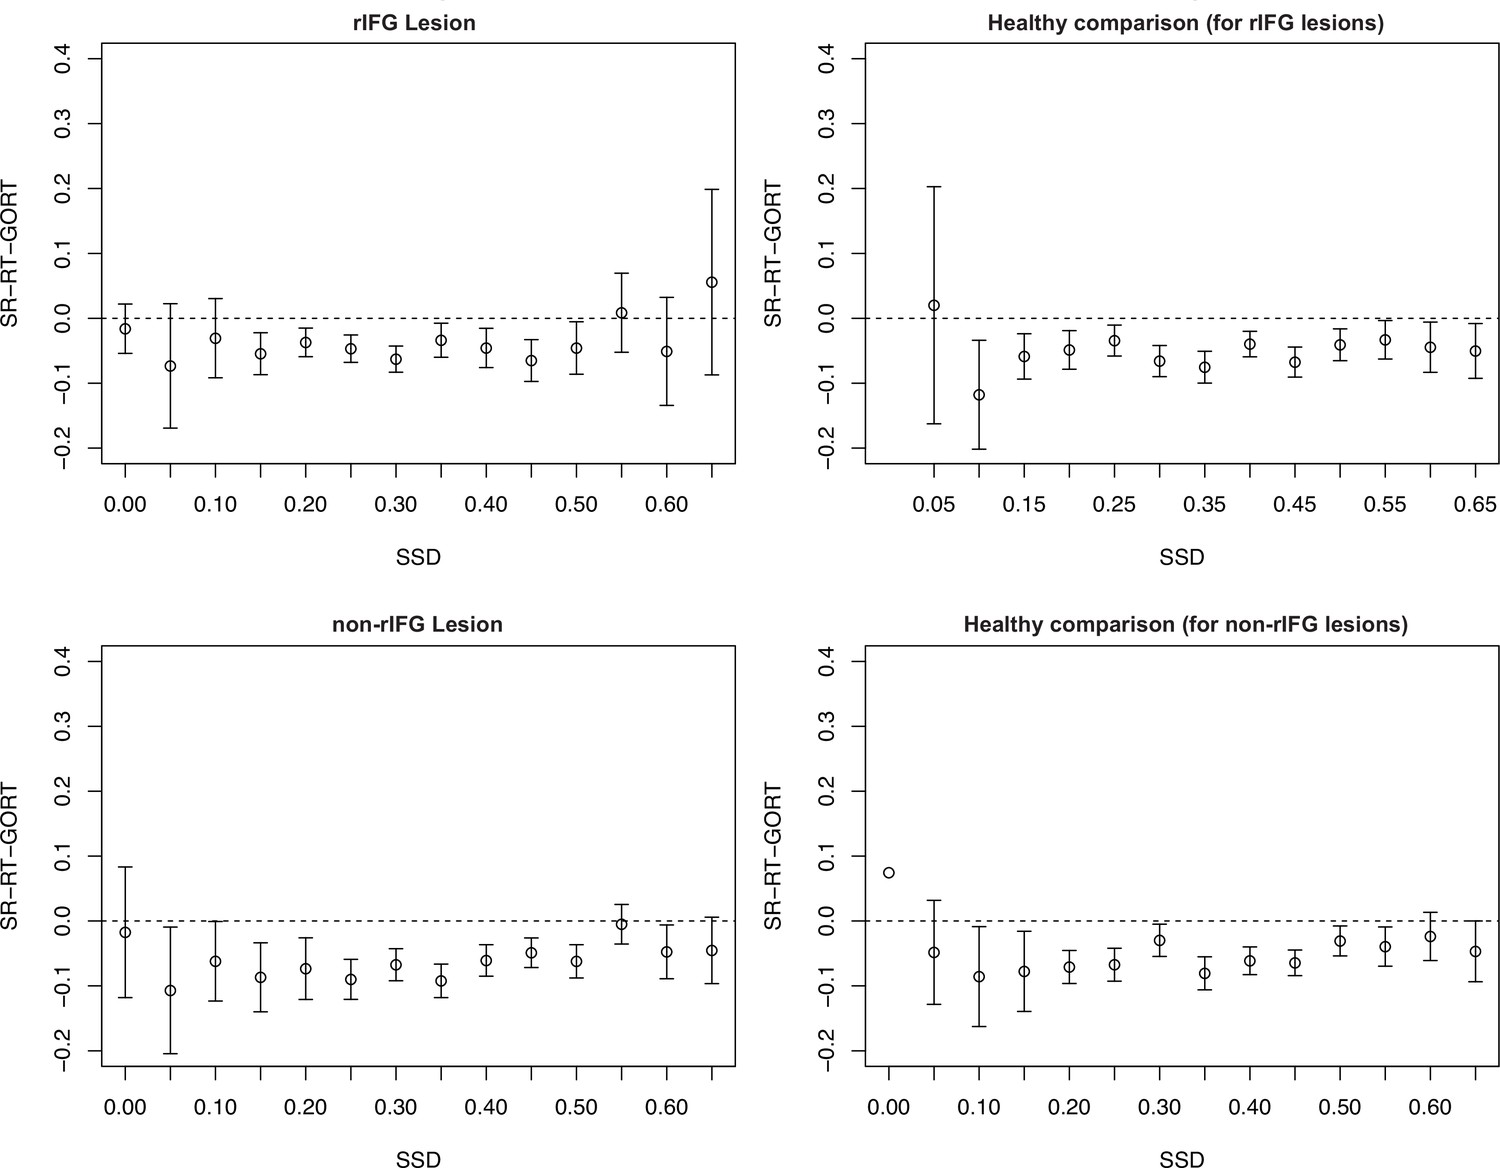
Assessment of context independence according to the procedure outlined in Bissett et al., 2021.
SR-RT, signal-respond RT; SSD, stop-signal delay. None of the groups showed the type of independence violation reported in Bissett et al., 2021.
Appendix 1—figure 14
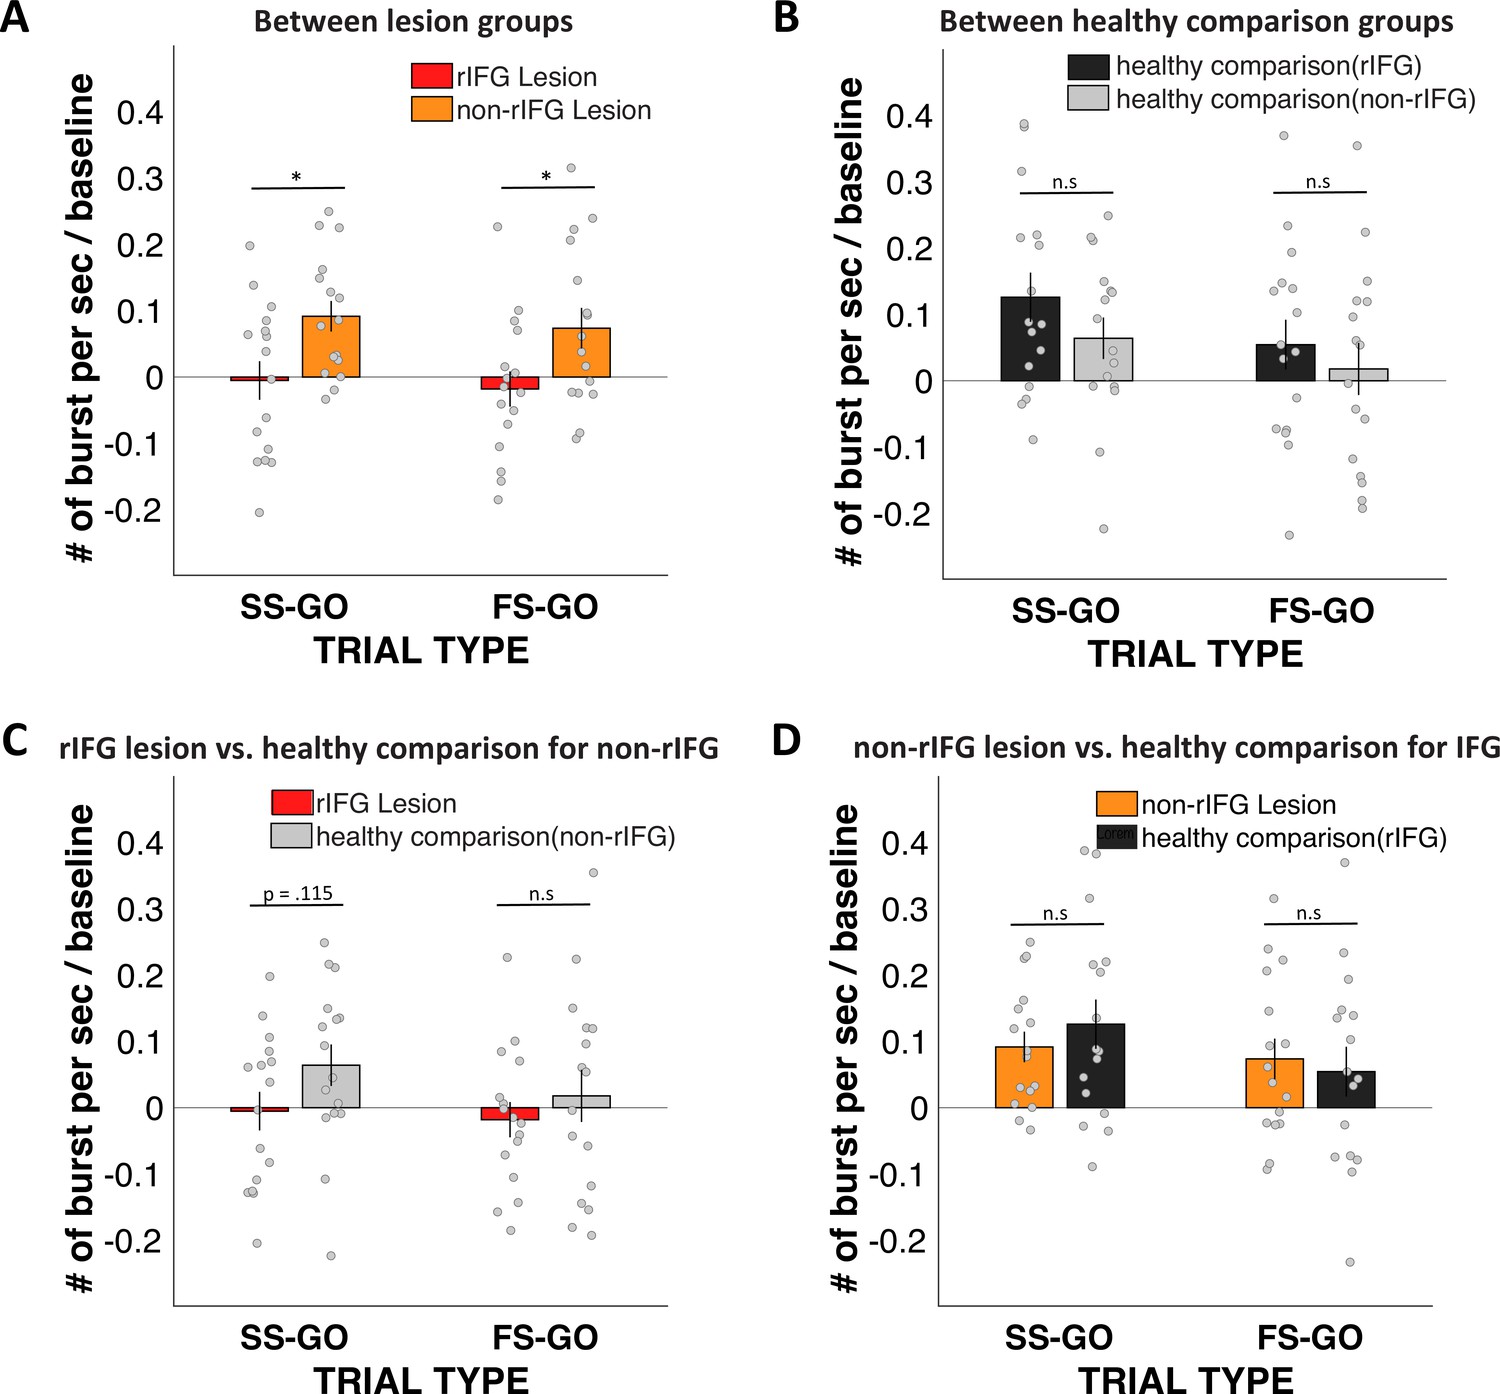
Stop vs. Go difference (Successful-stop – Go and Failed-stop – Go) in frontal β-burst rates between groups.
(A) Between two lesion groups: right inferior frontal gyrus (rIFG) lesion group vs. non-rIFG lesion group. (B) rIFG lesion group vs. healthy comparison for the non-rIFG lesion group. (C) Between two healthy comparison groups: healthy comparison for the rIFG lesion group vs. healthy comparison for the non-rIFG lesion group. (D) Non-rIFG lesion group vs. healthy comparison for the rIFG lesion group.
Appendix 1—figure 15
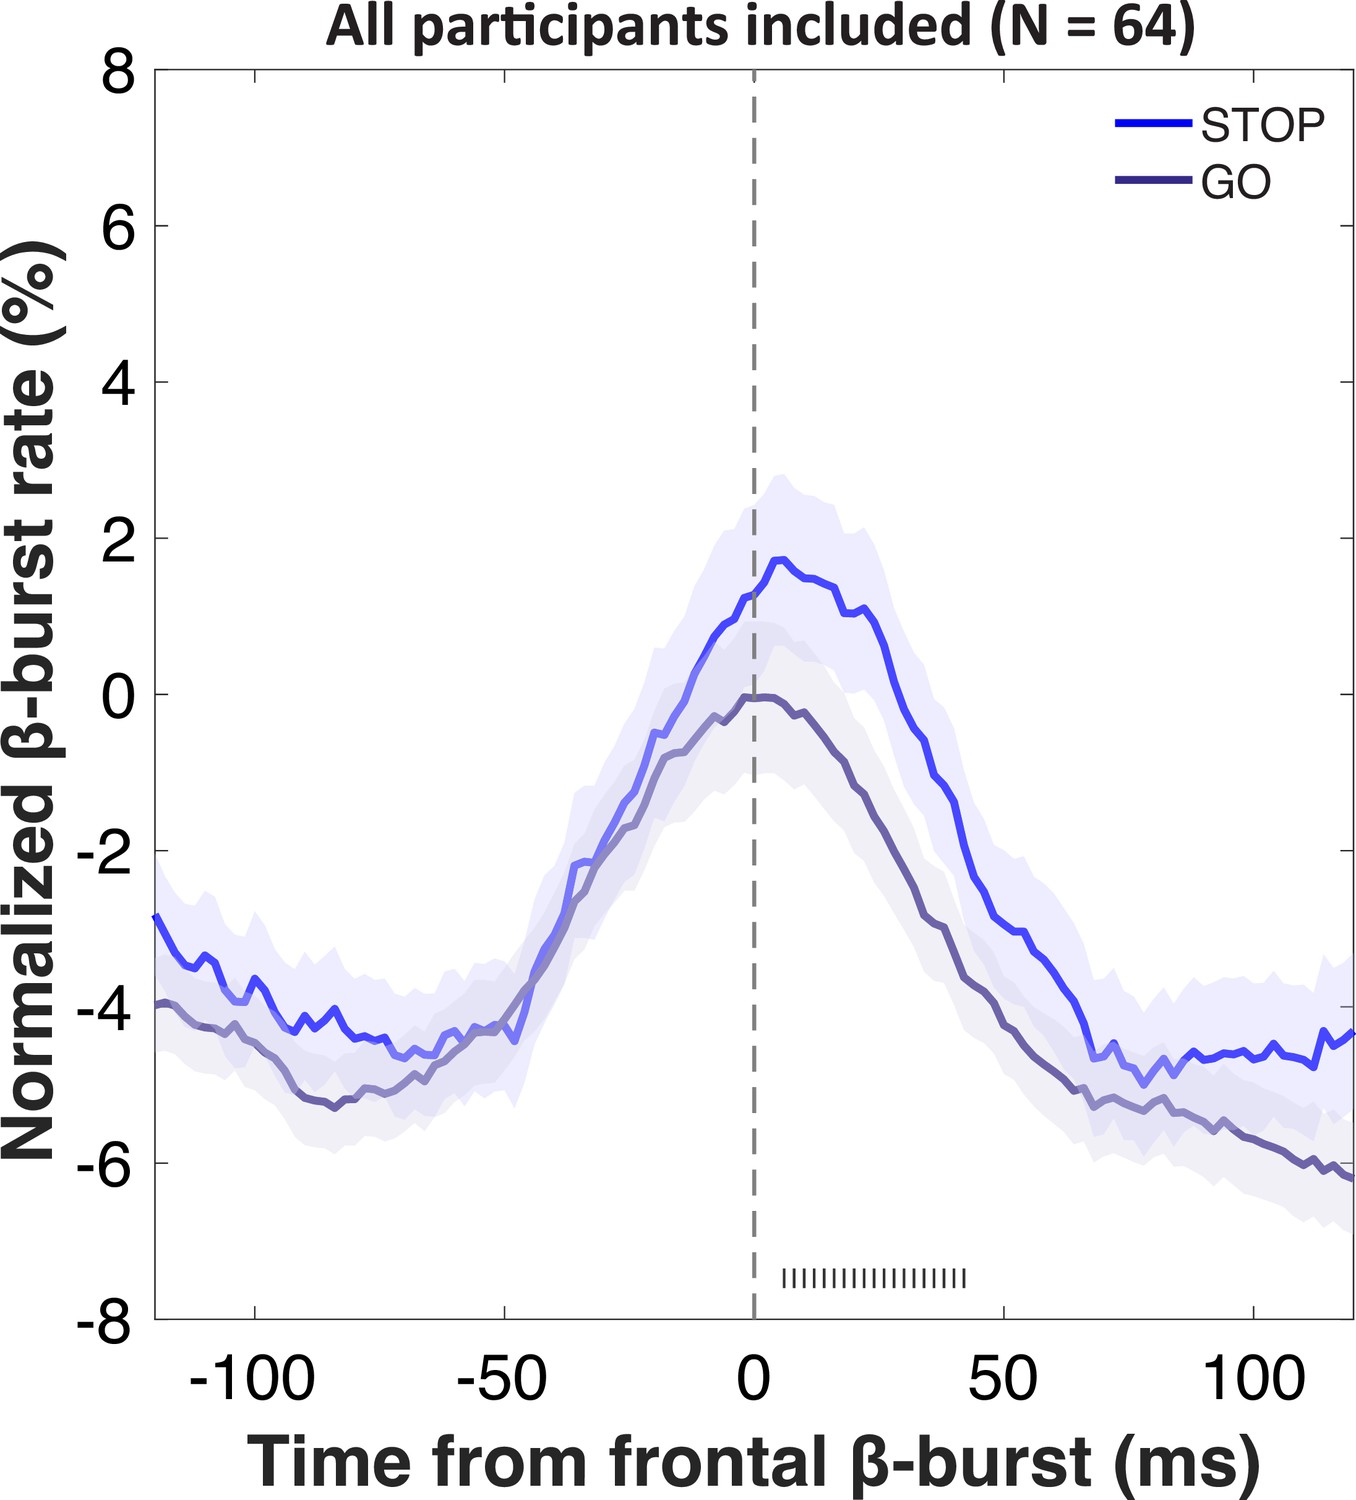
Increases in sensorimotor β-bursts following frontal β-bursts on stop- and go-trials.
Gray hashes on the bottom denote significant differences between STOP and GO trials at p<0.05.
Appendix 1—figure 16
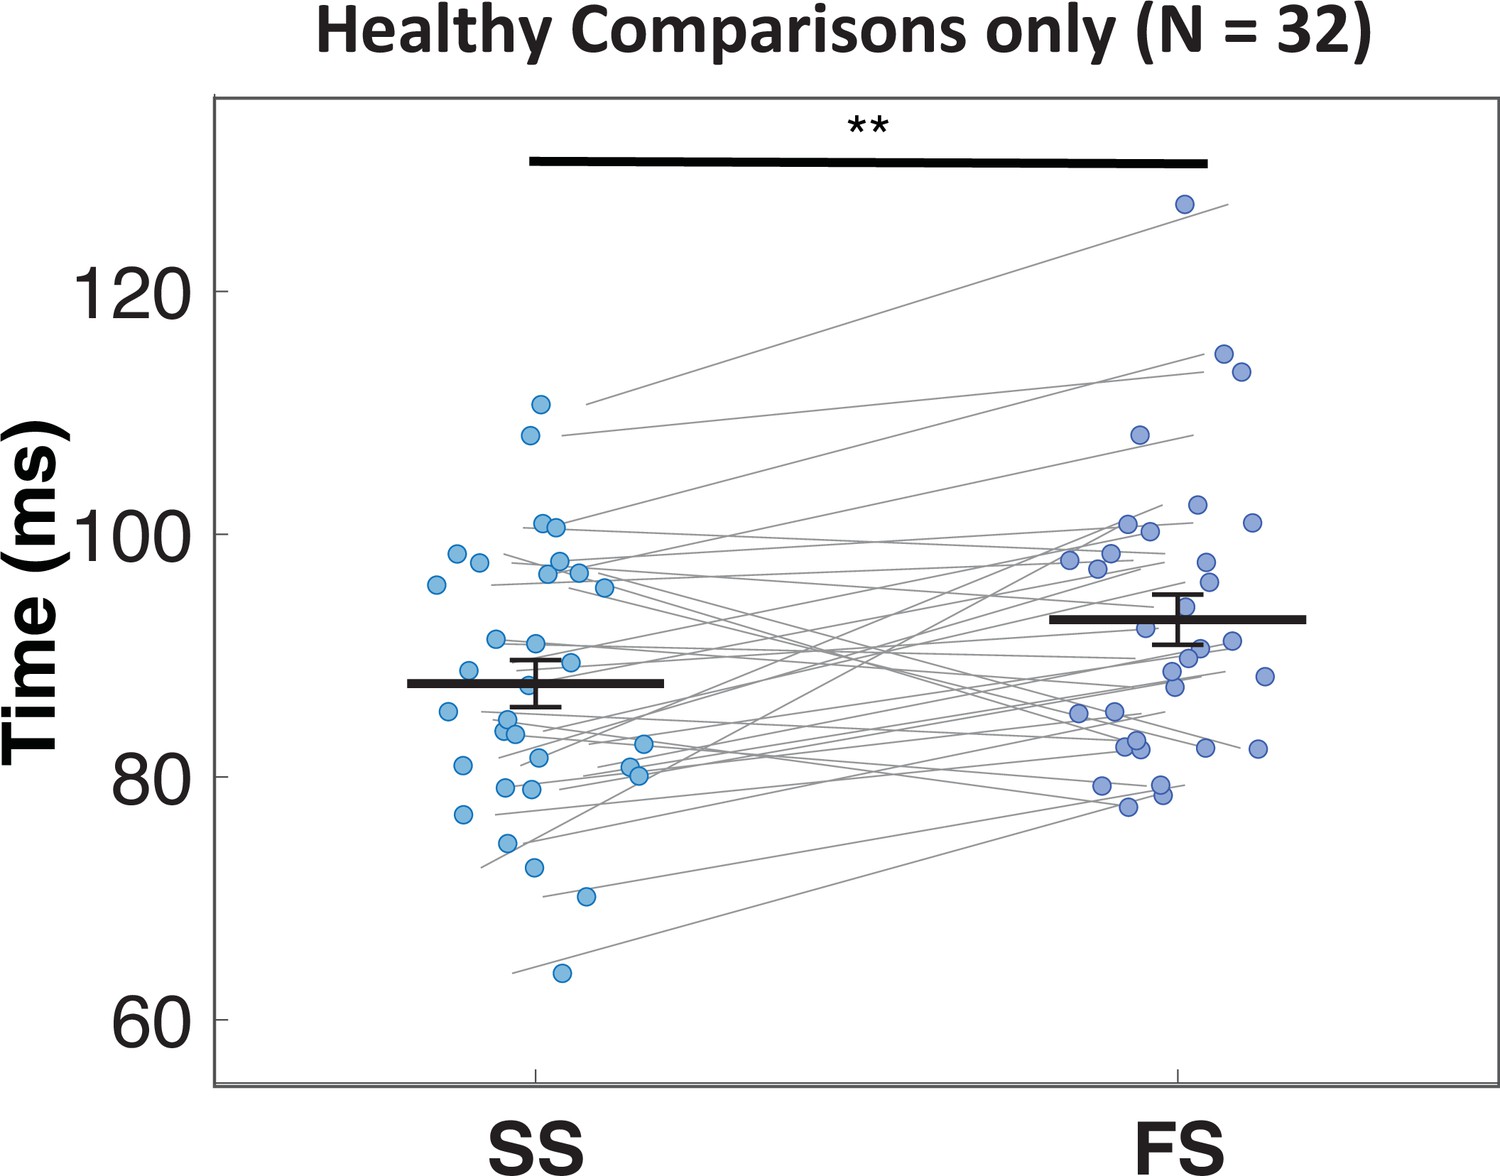
Timing of first beta burst after stop-signal.
Frontal β-bursts in healthy comparisons occur earlier on successful (SS) compared to failed (FS) stop-trials. This difference was significant: t(31) = –2.93, p=0.003, d = –0.518, one-sided.
Tables
Table 1
Demographic information all four groups.
| Group | Sex | Handedness | Age | Chronicity |
|---|---|---|---|---|
| rIFG lesions | 10M/6F | 16R/0L | 54.25 (15.19) | 19.88 (21.54) |
| rIFG comparison | 10M/6F | 15R/1L | 54.63 (15.28) | n/a |
| Non-rIFG lesions | 10M/6F | 13R/3L | 61.50 (14.62) | 10.97 (15.97) |
| Non-rIFG comparison | 10M/6F | 15R/1L | 61.94 (14.40) | n/a |
-
M, male; F, female; R, right-handed; L, left-handed; rIFG = right inferior frontal gyrus; Age: mean age at testing in years (standard deviation); Chronicity: median length of time between lesion onset and current experiment in years (inter-quartile range).
Table 2
Posterior means and 95% credible intervals (CIs) of the population-level mean parameters in the four groups.
| Lesion patients | Matched comparisons | Difference | ||||||
|---|---|---|---|---|---|---|---|---|
| Posterior mean | 95% CI | Posterior mean | 95% CI | Posterior mean | 95% CI | Bayesian p | ||
| rIFG | μgo | 479 | [435,521] | 578 | [505,650] | –99 | [-181,–15] | 0.01 |
| σgo | 75 | [60,94] | 90 | [73,107] | –15 | [–39,10] | 0.12 | |
| τgo | 154 | [111,216] | 76 | [54,109] | 78 | [25,145] | 0 | |
| Mean Go-RT | 633 | [572,708] | 654 | [576,730] | –21 | [–124,80] | 0.34 | |
| μstop | 223 | [197,249] | 198 | [182,215] | 25 | [–6,55] | 0.06 | |
| σstop | 40 | [26,58] | 24 | [16,37] | 16 | [–3,37] | 0.05 | |
| τstop | 45 | [30,65] | 34 | [22,50] | 11 | [–12,35] | 0.17 | |
| Mean SSRT | 268 | [237,298] | 232 | [211,254] | 35 | [–2,73] | 0.03 | |
| P(TF) | 0.16 | [0.08,0.29] | 0.03 | [0,0.12] | 0.13 | [0.01,0.27] | 0.02 | |
| Non-rIFG | μgo | 547 | [504,589] | 575 | [506,646] | –28 | [–109,52] | 0.24 |
| σgo | 98 | [84,111] | 104 | [85,122] | -6 | [–29,17] | 0.30 | |
| τgo | 106 | [79,139] | 85 | [61,116] | 21 | [–19,62] | 0.15 | |
| Mean Go-RT | 653 | [602,706] | 660 | [586,735] | -7 | [–97,83] | 0.43 | |
| μstop | 215 | [191,239] | 199 | [184,215] | 16 | [–11,43] | 0.12 | |
| σstop | 54 | [24,104] | 24 | [14,36] | 31 | [0.11,80] | 0.02 | |
| τstop | 29 | [18,44] | 26 | [13,44] | 3 | [–18,22] | 0.36 | |
| Mean SSRT | 244 | [218,271] | 225 | [204,249] | 19 | [–12,49] | 0.11 | |
| P(TF) | 0.02 | [0,0.05] | 0.04 | [0.02,0.08] | –0.02 | [0.07,0.02] | 0.09 | |
-
The parameters of the Go-RT and SSRT distributions are presented on the ms scale. The P(TF) parameter is presented on the probability scale. The posterior distribution of 'Difference' is computed by subtracting the posterior samples of the matched comparison group from the corresponding samples of the lesion group, i.e., positive values indicate that the parameter is higher in the lesion group than in the matched comparison group. 'Bayesian p' is computed as the proportion of posterior samples in the posterior distribution of the lesion group that is larger than in the matched comparisons group. Bayesian p values are presented as P = min(p, 1p), i.e., as non-directional tests, with results at a two-sided p of 0.05 (i.e., a one-sided critical p of 0.025) highlighted in bold.
-
rIFG = right inferior frontal gyrus; SSRT = stop-signal reaction time.
Table 3
Posterior mean and 95% credible interval (CI) of the population-level mean difference between the two lesion groups (rIFG lesion vs. non-rIFG lesion).
| Posterior mean of difference | 95% CI of difference | Bayesian p | |
|---|---|---|---|
| μgo | –68 | [-126,–10] | 0.02 |
| σgo | –22 | [–44,1] | 0.02 |
| τgo | 49 | [–6,116] | 0.04 |
| Mean Go-RT | –19 | [–103,71] | 0.32 |
| μstop | 8 | [–26,44] | 0.32 |
| σstop | –15 | [–67,24] | 0.33 |
| τstop | 16 | [–5,39] | 0.07 |
| Mean SSRT | 24 | [–18,63] | 0.12 |
| P(TF) | 0.15 | [0.06,0.28] | 0 |
-
The parameters of the Go-RT and SSRT distributions are presented on the ms scale. The P(TF) parameter is presented on the probability scale. The posterior distribution of 'Difference' was computed by subtracting the posterior samples of the non-rIFG group from the corresponding samples of the rIFG lesion group; i.e., positive values indicate that the parameter is higher in the rIFG lesion group than in the non-rIFG lesion group. 'Bayesian p' is computed as the proportion of posterior samples in the posterior distribution of the rIFG lesion group that was larger than in the non-rIFG lesion group. Bayesian p values are presented as P = min(p, 1p), i.e., as non-directional tests, with results at a two-sided p of 0.05 (i.e., a one-sided critical p of 0.025) highlighted in bold.
-
rIFG = right inferior frontal gyrus; SSRT = stop-signal reaction time.
Table 4
Non-parametric integration estimates and behavioral metrics of stop-signal performance in the four groups.
| Lesion patients | Matched comparisons | ||
|---|---|---|---|
| Mean (SD) | Mean (SD) | ||
| rIFG | Mean SSD | 286 (120) | 397 (131) |
| Go RT | 589 (88) | 634 (108) | |
| SSRT | 307 (124) | 231 (43) | |
| SR-RT | 526 (76) | 569 (109) | |
| P(Go miss) | 0.058 (0.083) | 0.029 (0.04) | |
| P(Go error) | 0.016 (0.021) | 0.001 (0.003) | |
| P(Inhibit) | 0.5 (0.078) | 0.533 (0.019) | |
| Non-rIFG | Mean SSD | 371 (81) | 399 (119) |
| Go RT | 634 (61) | 644 (87) | |
| SSRT | 255 (47) | 238 (46) | |
| SR-RT | 552 (66) | 564 (93) | |
| P(Go miss) | 0.031 (0.033) | 0.04 (0.092) | |
| P(Go error) | 0.005 (0.007) | 0.004 (0.007) | |
| P(Inhibit) | 0.532 (0.013) | 0.536 (0.024) | |
-
Mean SSD, Go RT, SSRT, and signal-respond RT (SR-RT) are presented on the ms scale. Go misses, Go errors, and Inhibition are given as probabilities (0 ≤ p ≤ 1). With the exception of P(Go error), all measures are computed after removing incorrect RTs and RTs faster than 200 ms, treating RTs slower than 1000 ms as censored observations.
-
rIFG = inferior frontal gyrus; SSRT = stop-signal reaction time; SSD = stop-signal delay.
Additional files
Download links
A two-part list of links to download the article, or parts of the article, in various formats.
Downloads (link to download the article as PDF)
Open citations (links to open the citations from this article in various online reference manager services)
Cite this article (links to download the citations from this article in formats compatible with various reference manager tools)
Right inferior frontal gyrus damage is associated with impaired initiation of inhibitory control, but not its implementation
eLife 11:e79667.
https://doi.org/10.7554/eLife.79667


