A dynamic rhizosphere interplay between tree roots and soil bacteria under drought stress
- Department of Plant and Environmental Sciences, Weizmann Institute of Science, Israel
Figures
Figure 1 with 2 supplements
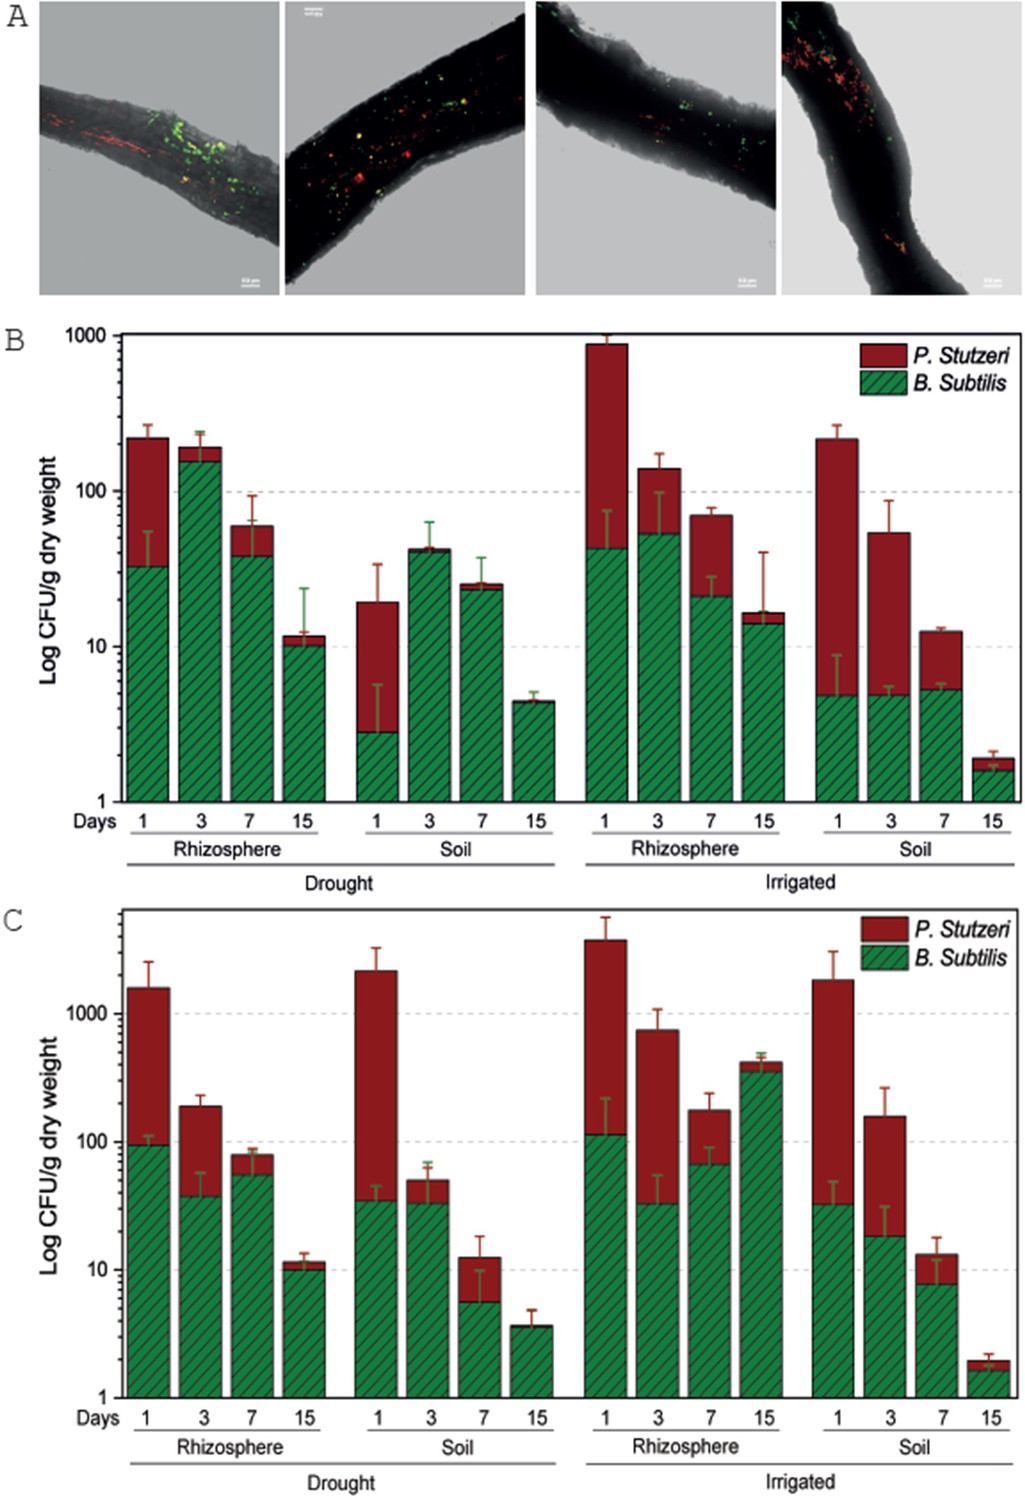
Tree root recruitment of beneficial bacteria during drought and re-irrigation.
Bacterial dynamics in soil and rhizosphere around roots of irrigated and drought-exposed Cupressus sempervirens saplings. Root colonization (A): epifluorescence and bright-field images of drought tree roots densely colonized by Bacillus subtilis-gfp (green) and Pseudomonas stutzeri-mCherry (red). Orthogonal views of a three-dimensional confocal image were created from a z-stack of x/y-scans on drought trees, 1 and 3 days following inoculation. Dynamics of relative abundance of B. subtilis (green) and P. stutzeri (red) in rhizosphere and soil during drought (B) and during re-irrigation (C). Presented are colony forming units of both species (CFU; expressed as log 10 per g root dry weight) (n=6).
-
Figure 1—source data 1
Statistical analysis of bacterial growth.
- https://cdn.elifesciences.org/articles/79679/elife-79679-fig1-data1-v2.xlsx
Figure 1—figure supplement 1
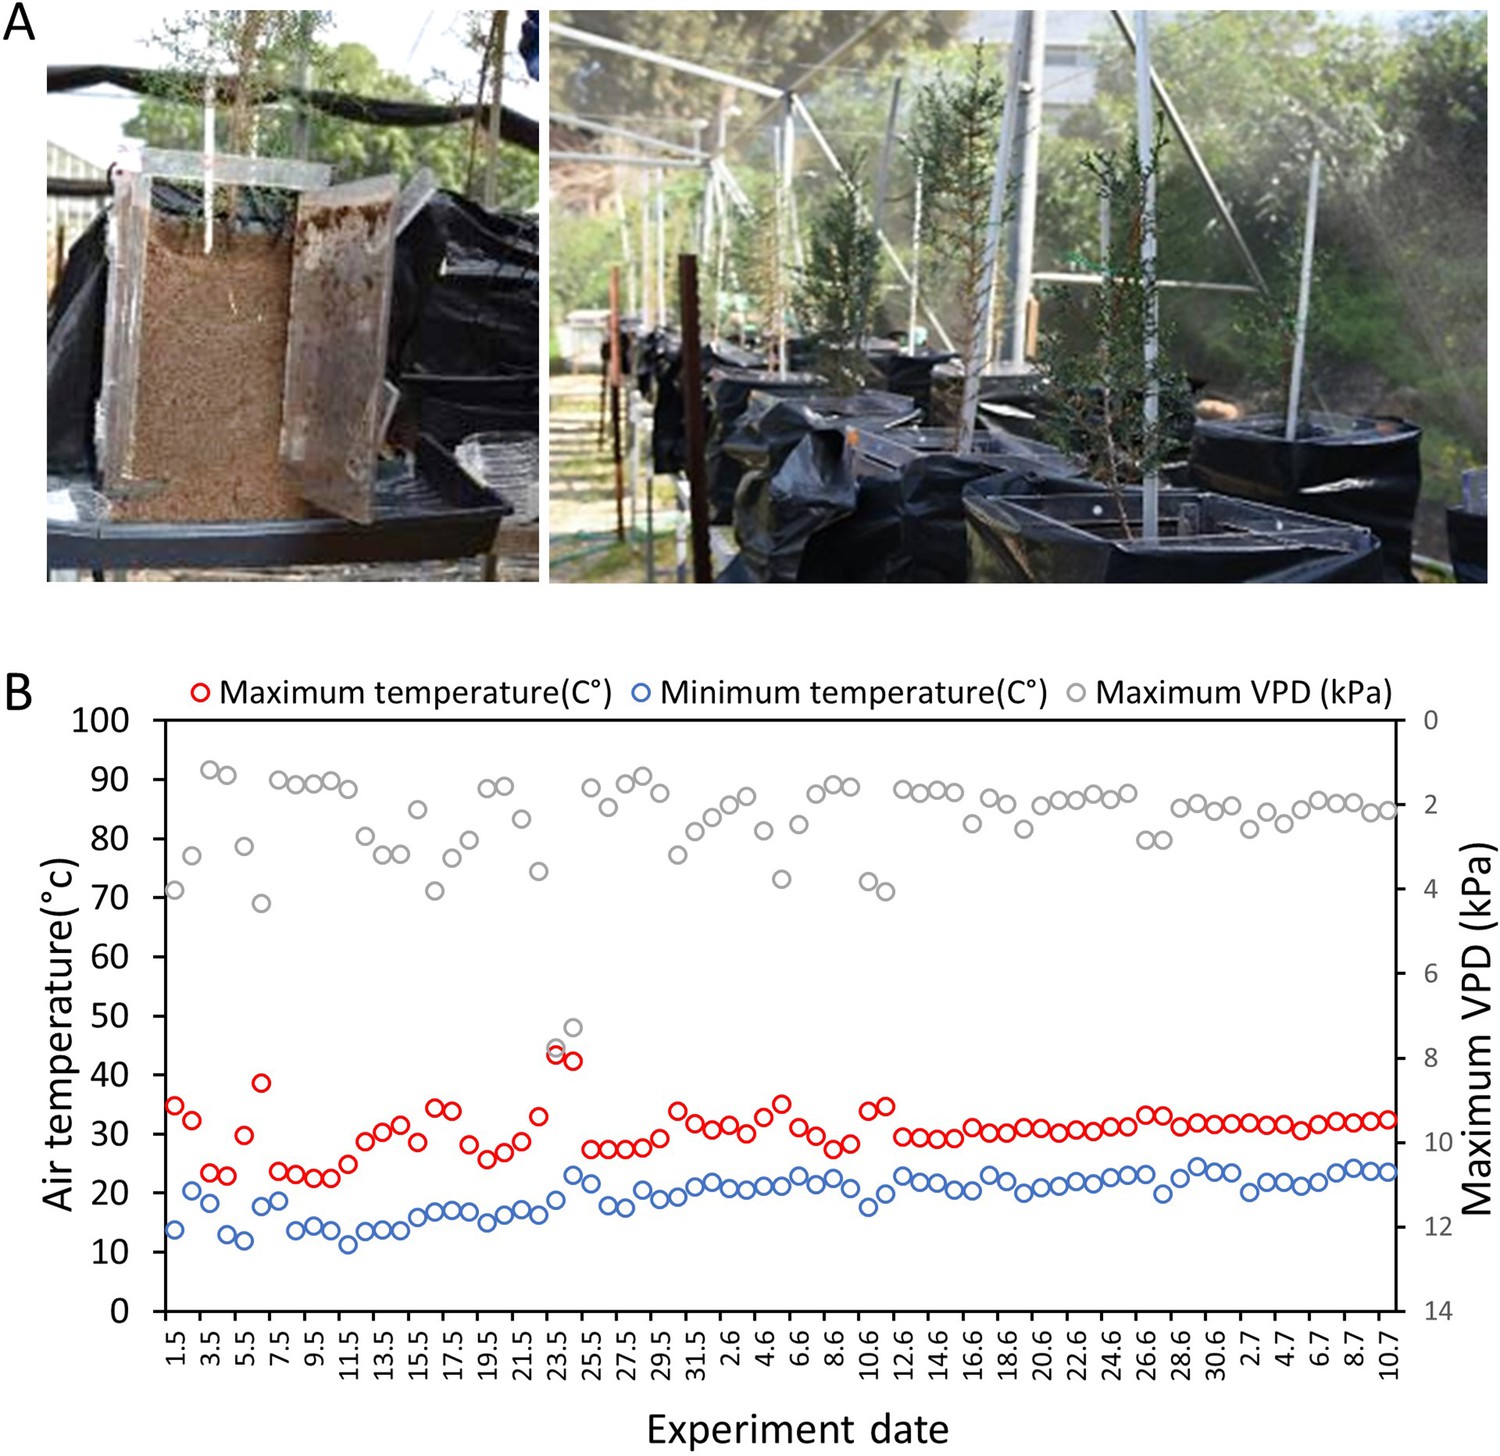
Experimental system and climate.
(A) Each Cupressus sempervirens sapling was grown in a Rhizobox: a covered, transparent, container, allowing access to root sampling and exudates collection. (B) Diurnal changes in maximum (red) and minimum (blue) air temperature and diurnal maximum vapor pressure deficit (VPD; gray) along the course of the experiment, as recorded in a nearby meteorological station (Beit Dagan), 10 km north of the net-house facility.
Figure 1—figure supplement 2
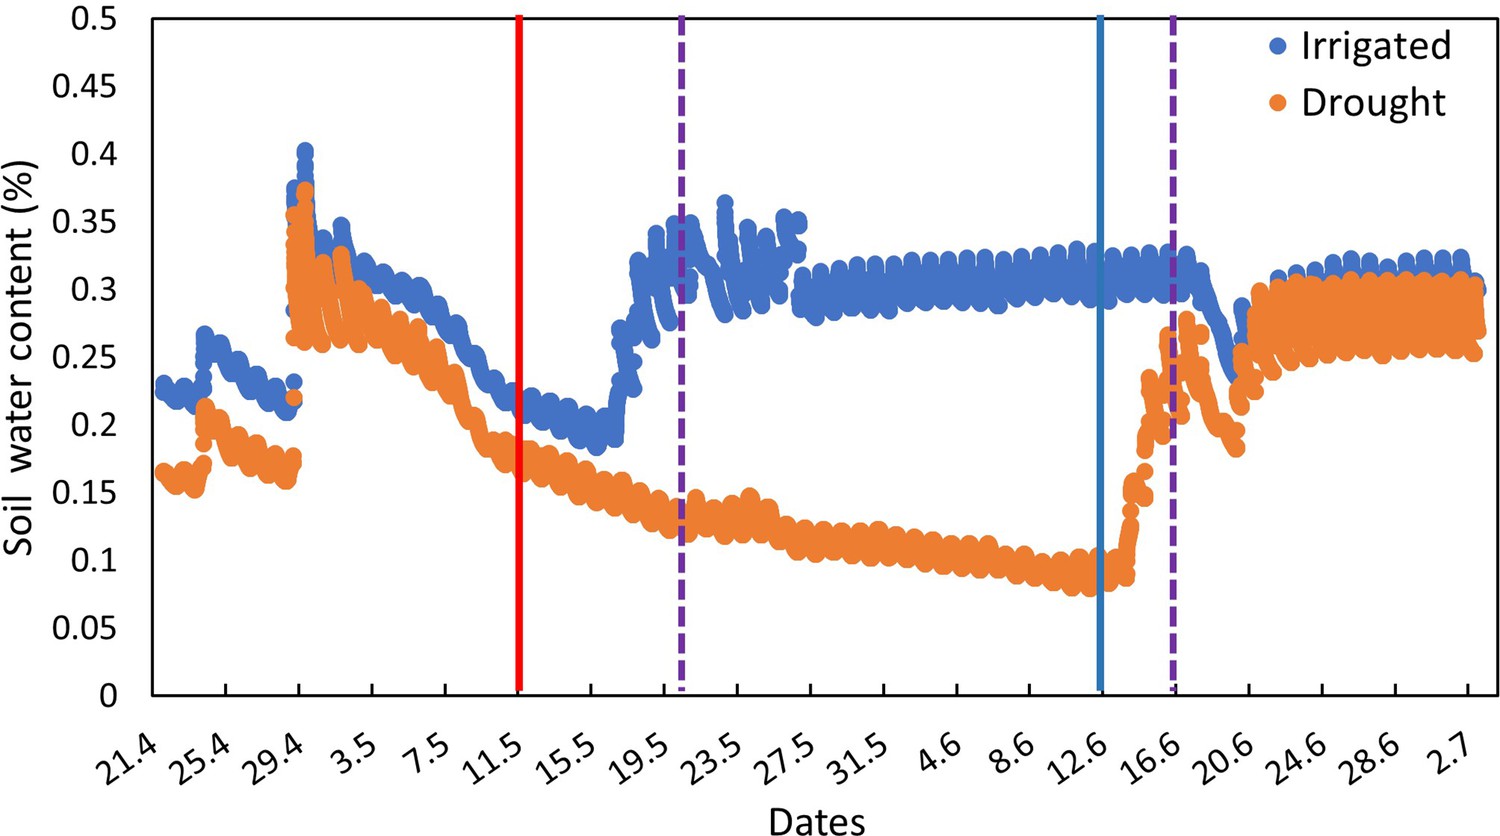
Changes in soil water content (% v/v) in irrigated (blue) and drought-exposed (orange) saplings along the course of the experiment.
Vertical lines indicate the time points of specific interventions. Solid red and blue lines indicate irrigation cessation and re-irrigation, respectively. Dashed violet lines indicate the two bacterial inoculations.
Figure 2 with 1 supplement
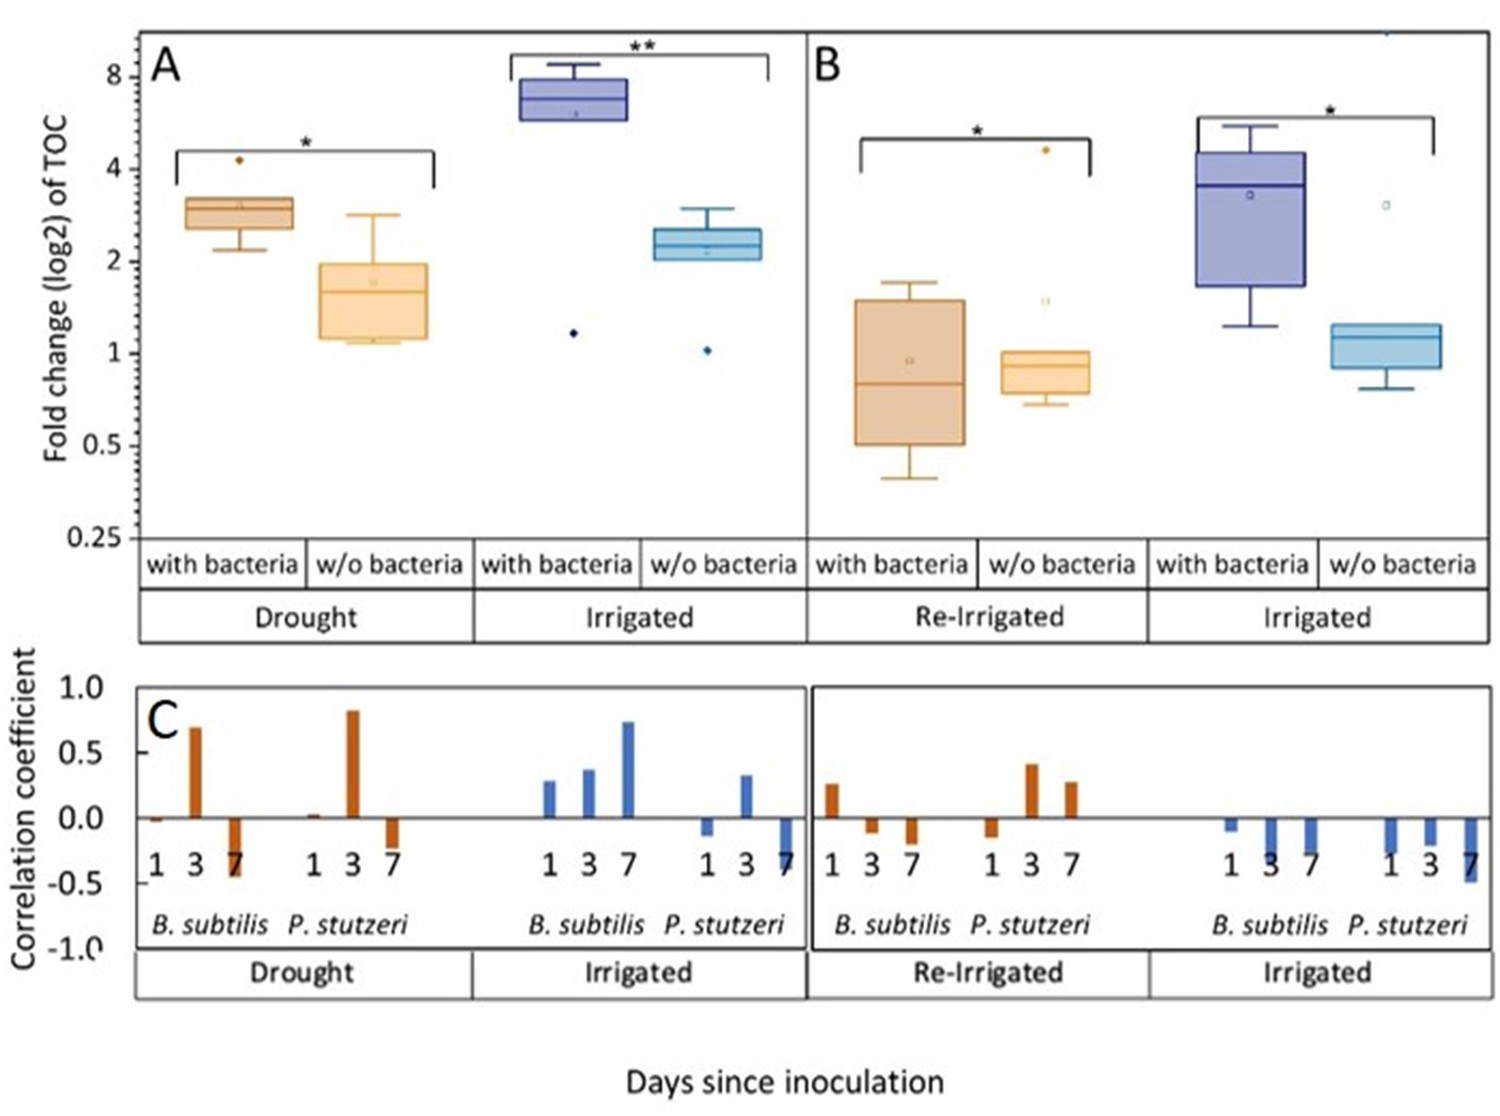
Tree root exudates increase with bacterial inoculation for both the drought and irrigation treatments (A) and decrease with bacterial inoculation after rewetting the droughted trees (B).
Total organic carbon (TOC) in exudate solutions from roots of irrigated and drought-exposed Cupressus sempervirens saplings, with and without bacterial inoculations. Intact roots were incubated for 48 hr to collect exudates during periods of drought (A) and re-irrigation (B). Boxplots show the log 2 of fold change from baseline exudation rate (at the beginning of the experiment) in µg C mg root–1 day–1. Asterisks indicate significant differences based on two-way ANOVA performed with Tukey’s HSD test (n=6, p<0.05) (see Figure 2—source data 2). Coefficients for the correlations between exudate rate (TOC) and rhizosphere abundance of Bacillus subtilis or Pseudomonas stutzeri (as in Figure 1) for the specific tree groups at 1, 3, and 7 days following inoculation (C).
-
Figure 2—source data 1
Statistical analysis of gas exchange parameters and sapling biomass.
- https://cdn.elifesciences.org/articles/79679/elife-79679-fig2-data1-v2.xlsx
-
Figure 2—source data 2
Statistical analysis of root exudates total organic carbon.
- https://cdn.elifesciences.org/articles/79679/elife-79679-fig2-data2-v2.xlsx
Figure 2—figure supplement 1
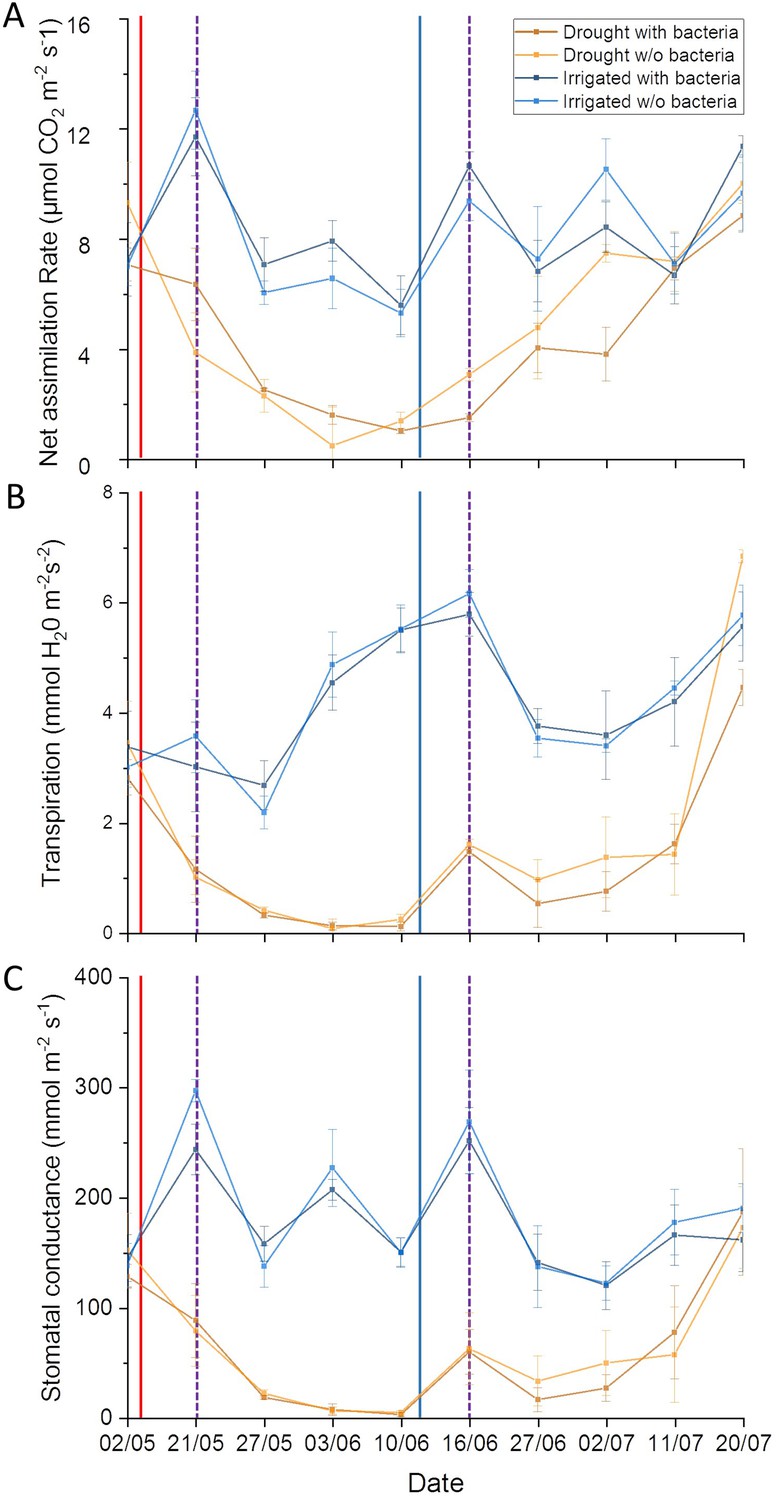
Drought stress effect on tree physiological parameters.
Leaf gas exchange dynamics of irrigated and drought-exposed Cupressus sempervirens saplings, with and without bacterial inoculations. Data points are means ± SE (n = 6) of (A) net assimilation; (B) transpiration; (C) stomatal conductance. Solid red and blue lines indicate irrigation cessation and re-irrigation, respectively. Dashed violet lines indicate the two bacterial inoculations (see Figure 2—source data 1 ).
Figure 3 with 1 supplement
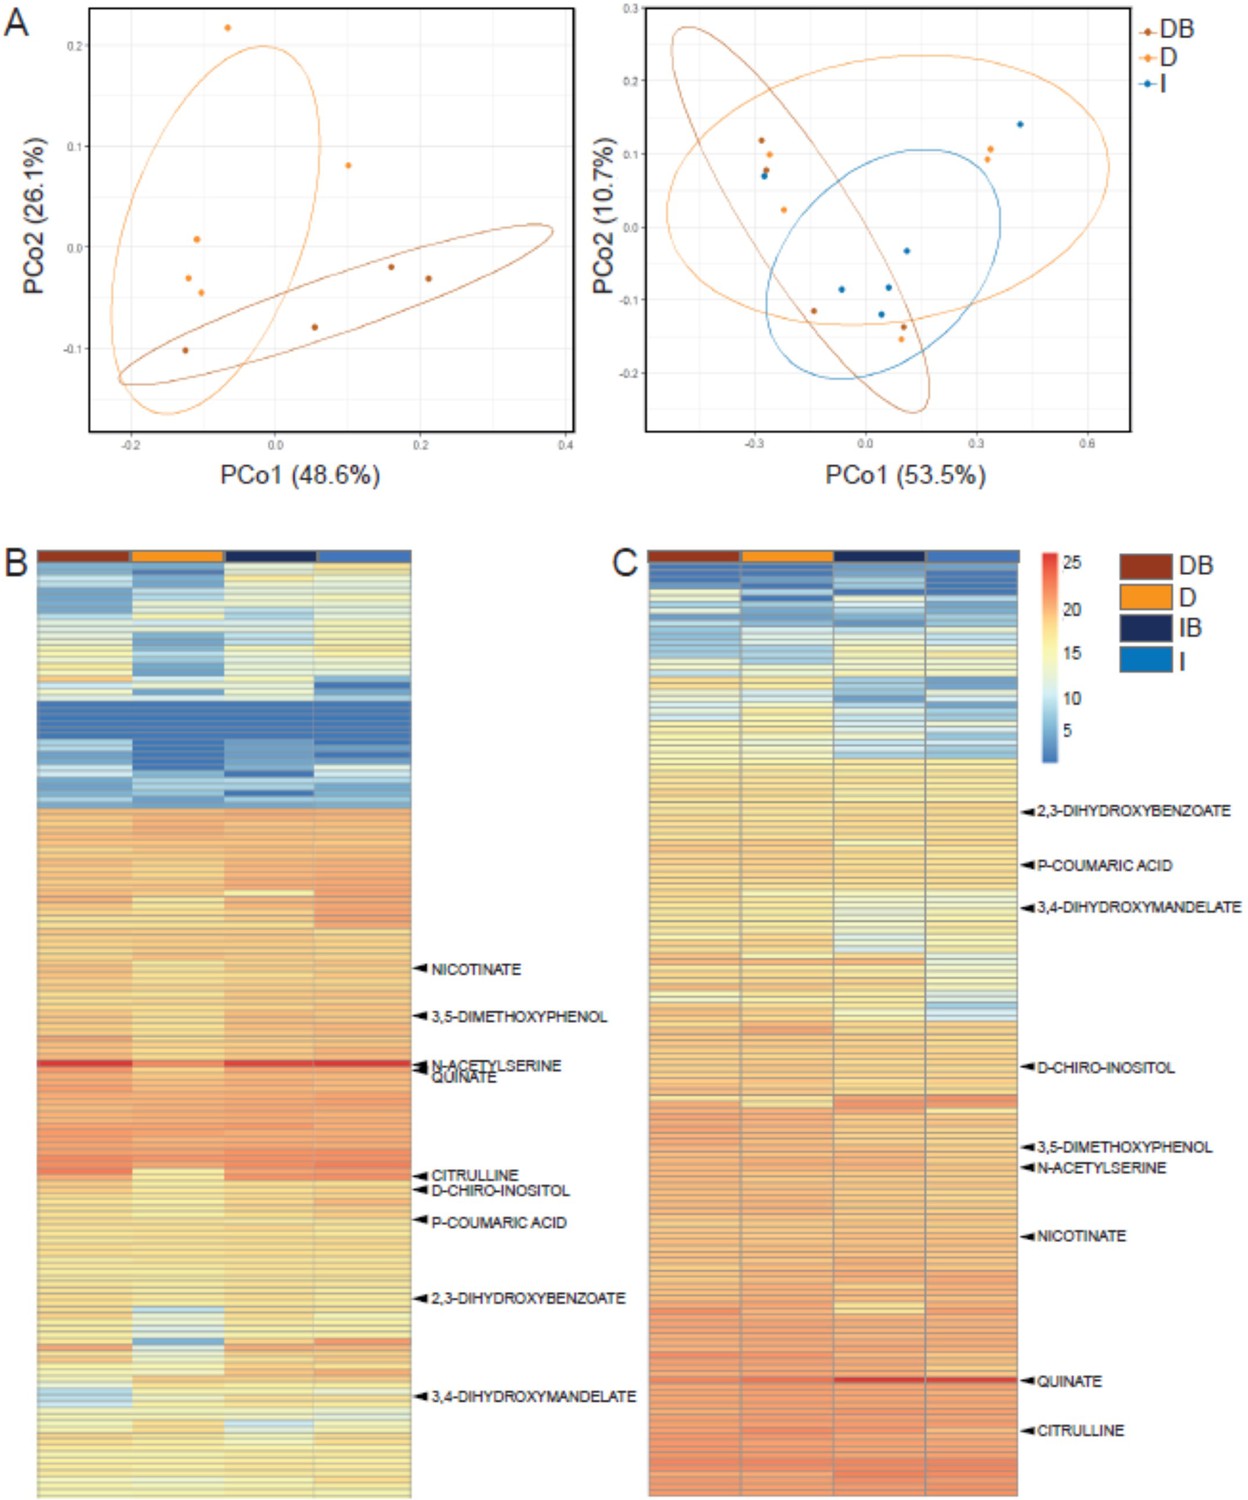
Rhizosphere bacteria and drought induce systemic metabolic changes in root exudates.
Metabolic profiles of root exudate solutions from roots of irrigated and drought-exposed Cupressus sempervirens saplings, with and without bacterial inoculations. Intact roots were incubated for 48 hr to collect exudates, which were analyzed by mass spectrometry. (DB) drought with bacteria, (D) drought w/o bacteria, (IB) irrigated with bacteria, (I) irrigated w/o bacteria. (A) Principal coordinate analysis of the polar metabolite profiles of exudates from drought-exposed saplings with and without bacterial inoculations (DB and D, respectively; left), and in combination with irrigated saplings (I; right; excluding the group of irrigated trees with bacteria for clarity). (B) Heat map analysis of the fold change of each of 149 identified metabolites (rows) relative to control level (at the beginning of the experiment). Columns represent means for each of the four saplings groups (n=4–6). (C) Same as in (B) for the re-irrigation phase. The nine metabolite names indicate metabolites which were tested in vitro for bacterial growth. For the list of metabolites, see Figure 3—source data 1.
-
Figure 3—source data 1
Data and statistical analysis of root exudates polar metabolites.
- https://cdn.elifesciences.org/articles/79679/elife-79679-fig3-data1-v2.xlsx
-
Figure 3—source data 2
Statistical analysis of root exudates semi-polar metabolites.
- https://cdn.elifesciences.org/articles/79679/elife-79679-fig3-data2-v2.xlsx
Figure 3—figure supplement 1

Semi-polar metabolic profiles of root exudate solutions from roots of irrigated and drought-exposed Cupressus sempervirens saplings, with and without bacterial inoculations.
Intact roots were incubated for 48 hr to collect exudates, which were analyzed by mass spectrometry. (A) Principal component analysis of the semi-polar metabolite profiles of exudates from exudates from irrigated saplings (I), and drought-exposed saplings with and without bacterial inoculations (DB and D, respectively). (B) Heat map analysis of the fold change of each of 2285 semi-polar metabolite markers (rows) relative to control level. Columns represent means for each of the four saplings groups (n=4–6). (C) Heat map analysis of the fold change of each of 12 semi-polar identified metabolites. The numbers indicate the number of material in Figure 3—source data 2.
Figure 4 with 1 supplement
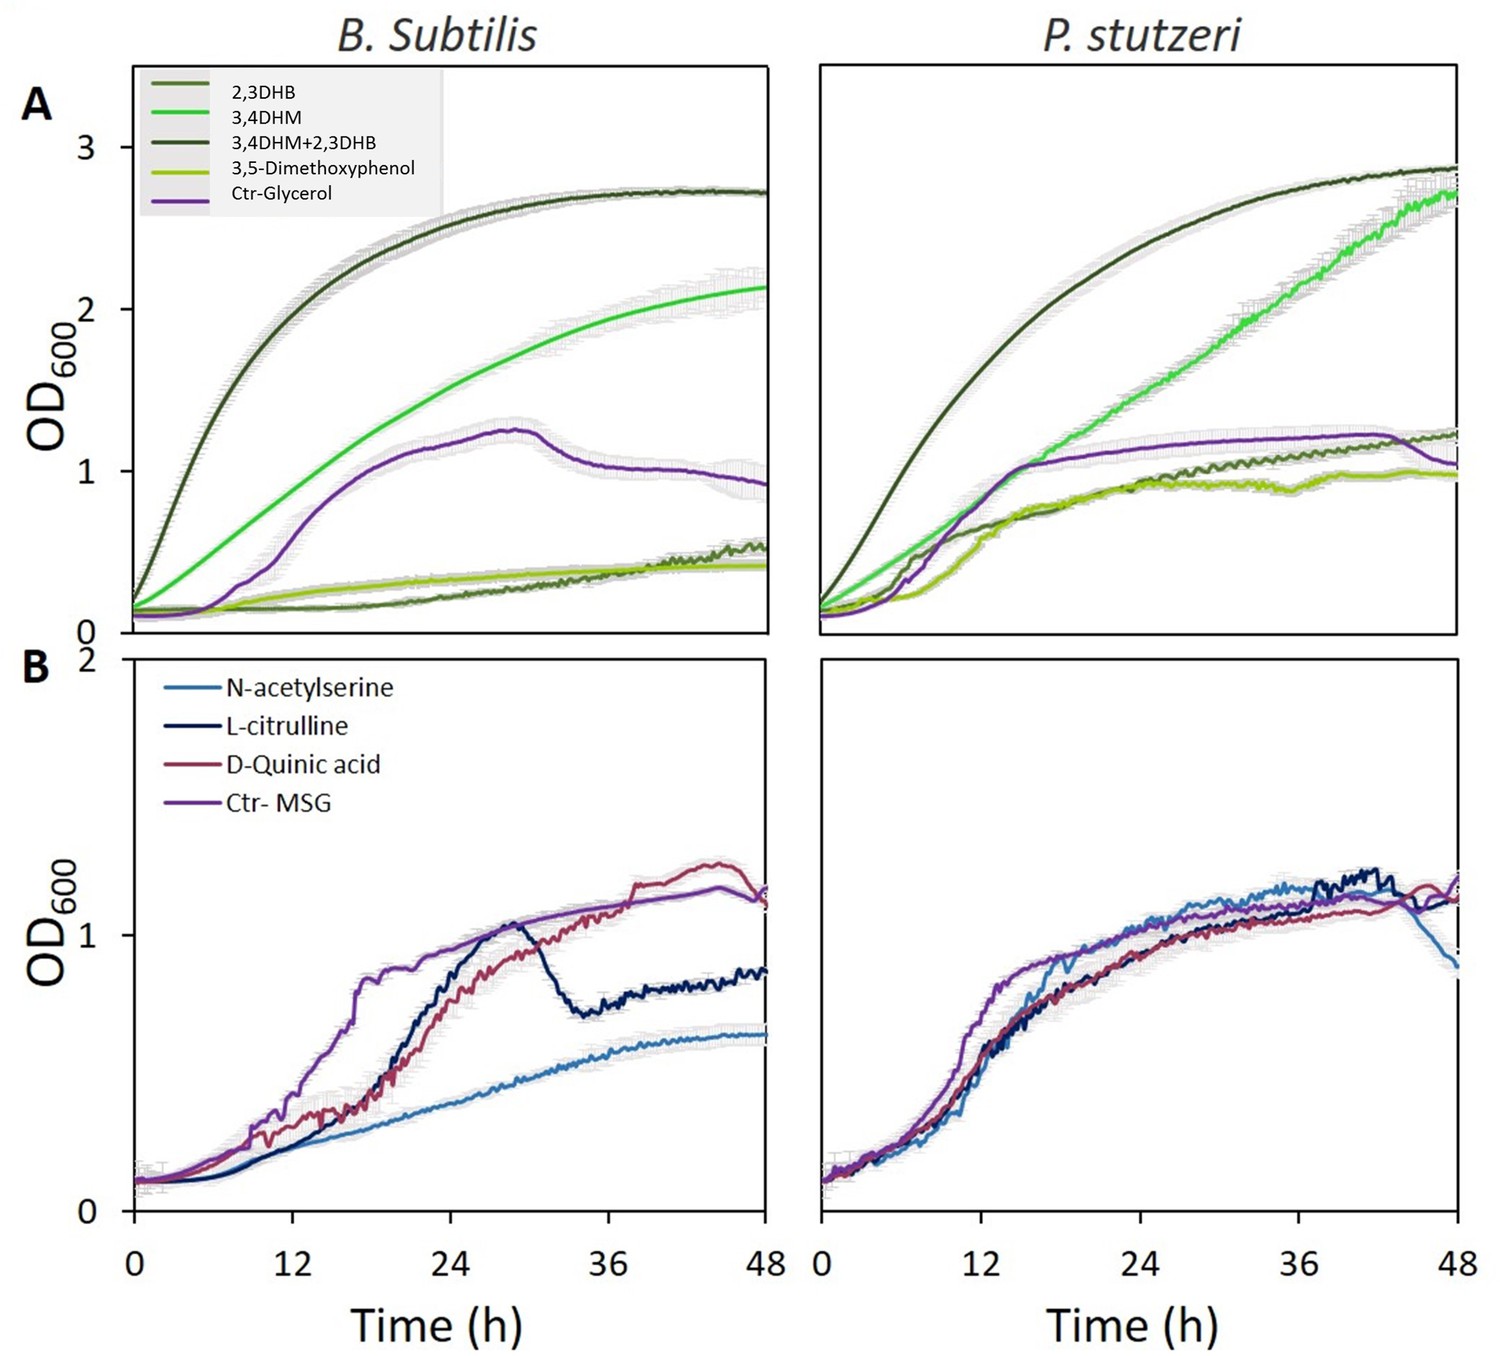
Specific metabolites in tree root exudates enhance bacterial growth.
Growth curves of Bacillus subtilis (left) and Pseudomonas stutzeri (right) in defined media with specific metabolites identified in root exudate blends of drought-exposed Cupressus sempervirens saplings as exclusive carbon (A) or nitrogen (B) source. Glycerol and monosodium glutamate (MSG) were used as controls for carbon and nitrogen sources, respectively. Root-derived metabolites are 2,3-dihydroxybenzoate (2,3 DHB); 3,4 dihydroxymandelate (3,4 DHM); their 1:1 mixture; 3,5-dimethoxyphenol; N-acetylserine; L-citrulline; and D-quinate. Concentrations are 0.4% by weight for all compounds. OD600, optical density at a wavelength of 600 nm (n=4).
Figure 4—figure supplement 1

Growth curves of Bacillus subtilis (left) and Pseudomonas stutzeri (right) in defined media with specific metabolites identified in root exudate blends of drought-exposed Cupressus sempervirens saplings as exclusive carbon (A) or nitrogen (B) source.
Glycerol and monosodium glutamate (MSG) were used as controls for carbon and nitrogen sources, respectively. Root-derived metabolites are nicotinate, p-coumaric acid, and D-chiro-inositol. Concentrations are 0.4% by weight for all compounds. OD600, optical density at a wavelength of 600 nm (n=4).
Figure 5
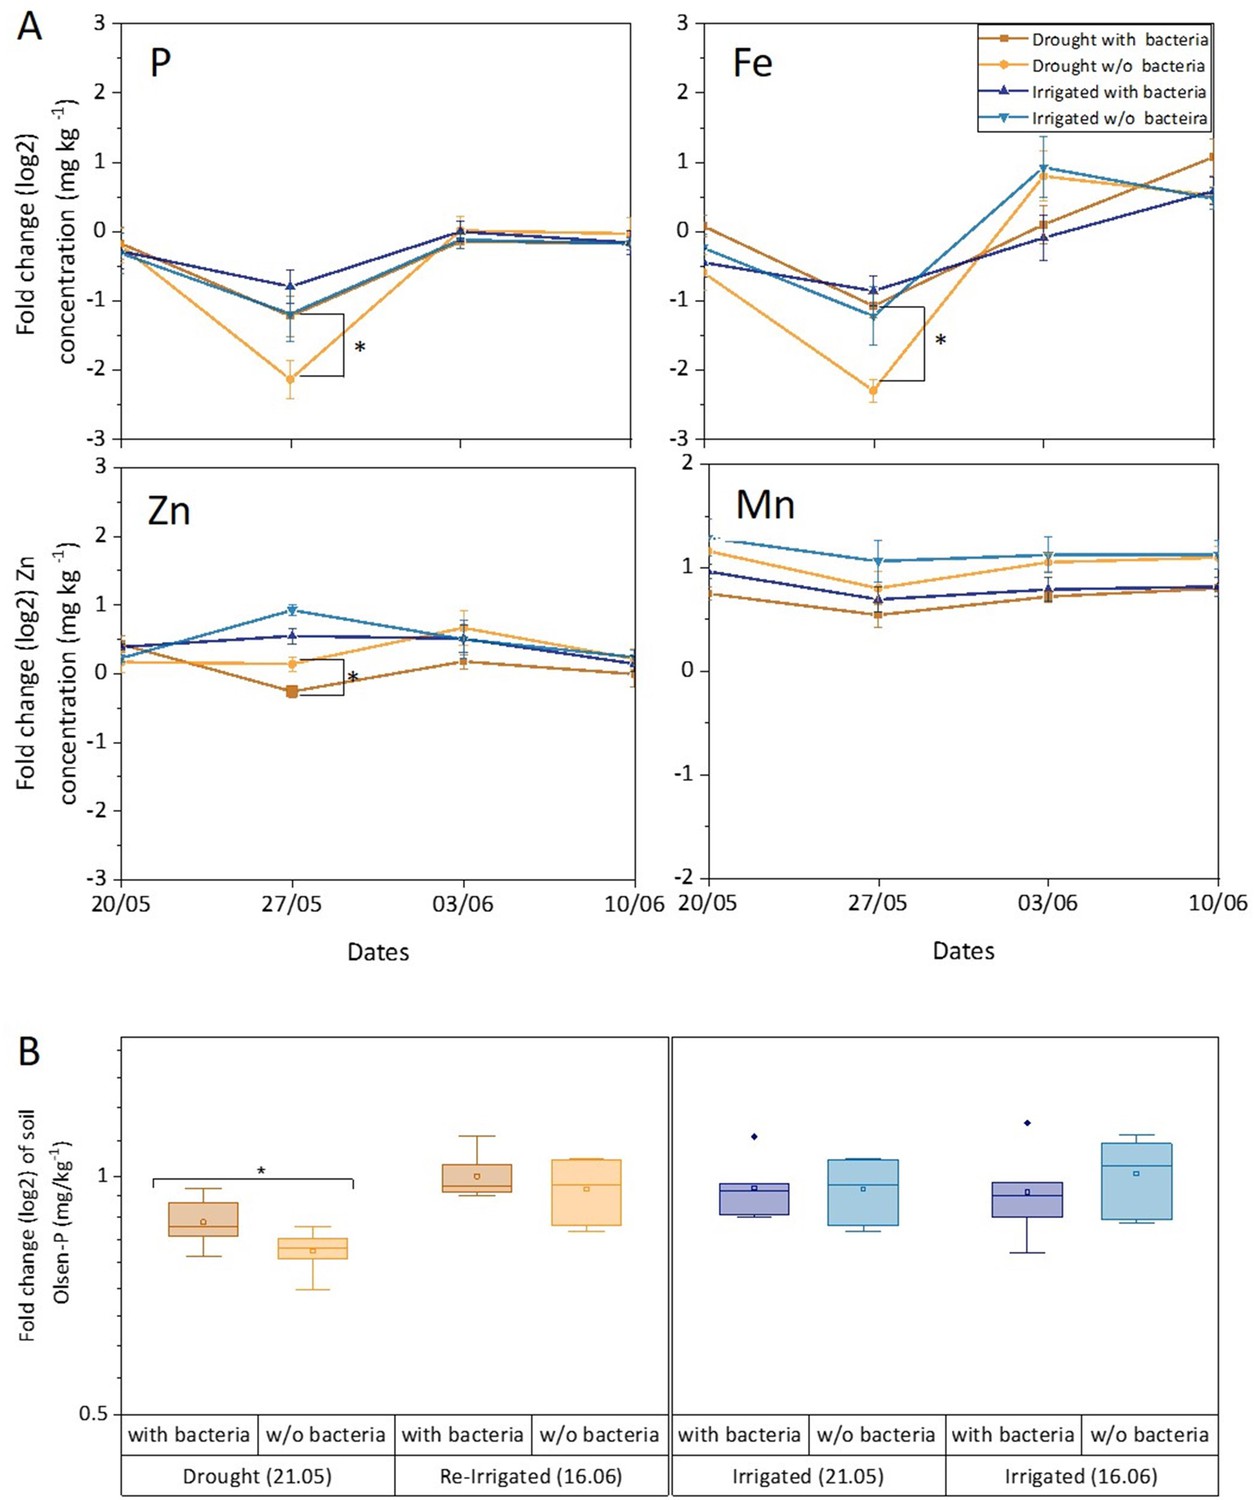
Leaf and soil elements respond to drought and bacterial inoculation.
Leaf elements (A) and soil phosphorous (B) of irrigated (blue shades) and drought-exposed and re-irrigated (brown shades) Cupressus sempervirens saplings, with and without bacterial inoculations. Values are log 2 of fold change from the baseline leaf elements and soil phosphorous (at the beginning of the experiment) in mg kg–1 concentrations. Asterisks indicate significant differences based on by two-way ANOVA performed with Tukey’s HSD test or Bonferroni test (n=6, p<0.05). See also Figure 5—source data 1.
-
Figure 5—source data 1
Statistical analysis of leaf elements.
- https://cdn.elifesciences.org/articles/79679/elife-79679-fig5-data1-v2.xlsx
Figure 6
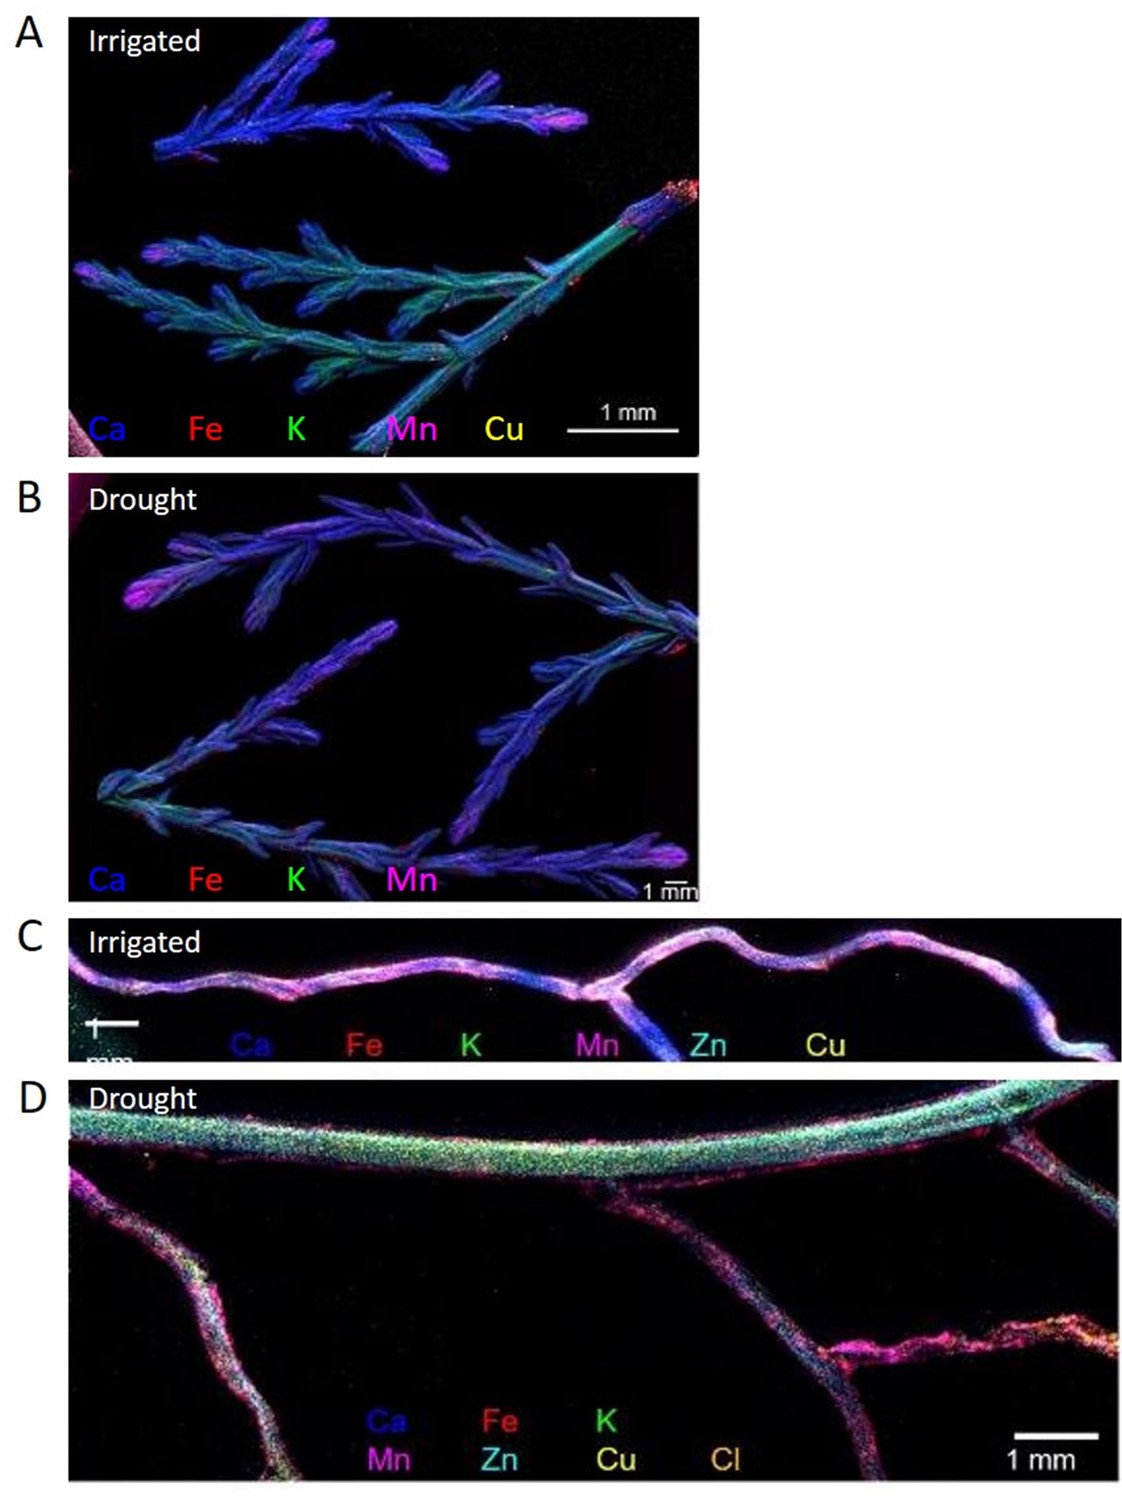
Composite elemental distribution images of irrigated and drought-exposed leaves (A, B) and fine roots (C, D) of Cupressus sempervirens saplings.
Elemental distribution images (heat maps; a single color per element) were created at 20 µm resolution and scan area of 500 µm with a copper target to detect Fe, Mn, Ca, K, and Cl, and molybdenum or gold target to detect Cu and Zn. The mapping was performed using an X-ray fluorescence microscope applying an ultra-high brightness X-ray source with multiple X-ray targets.
Figure 7
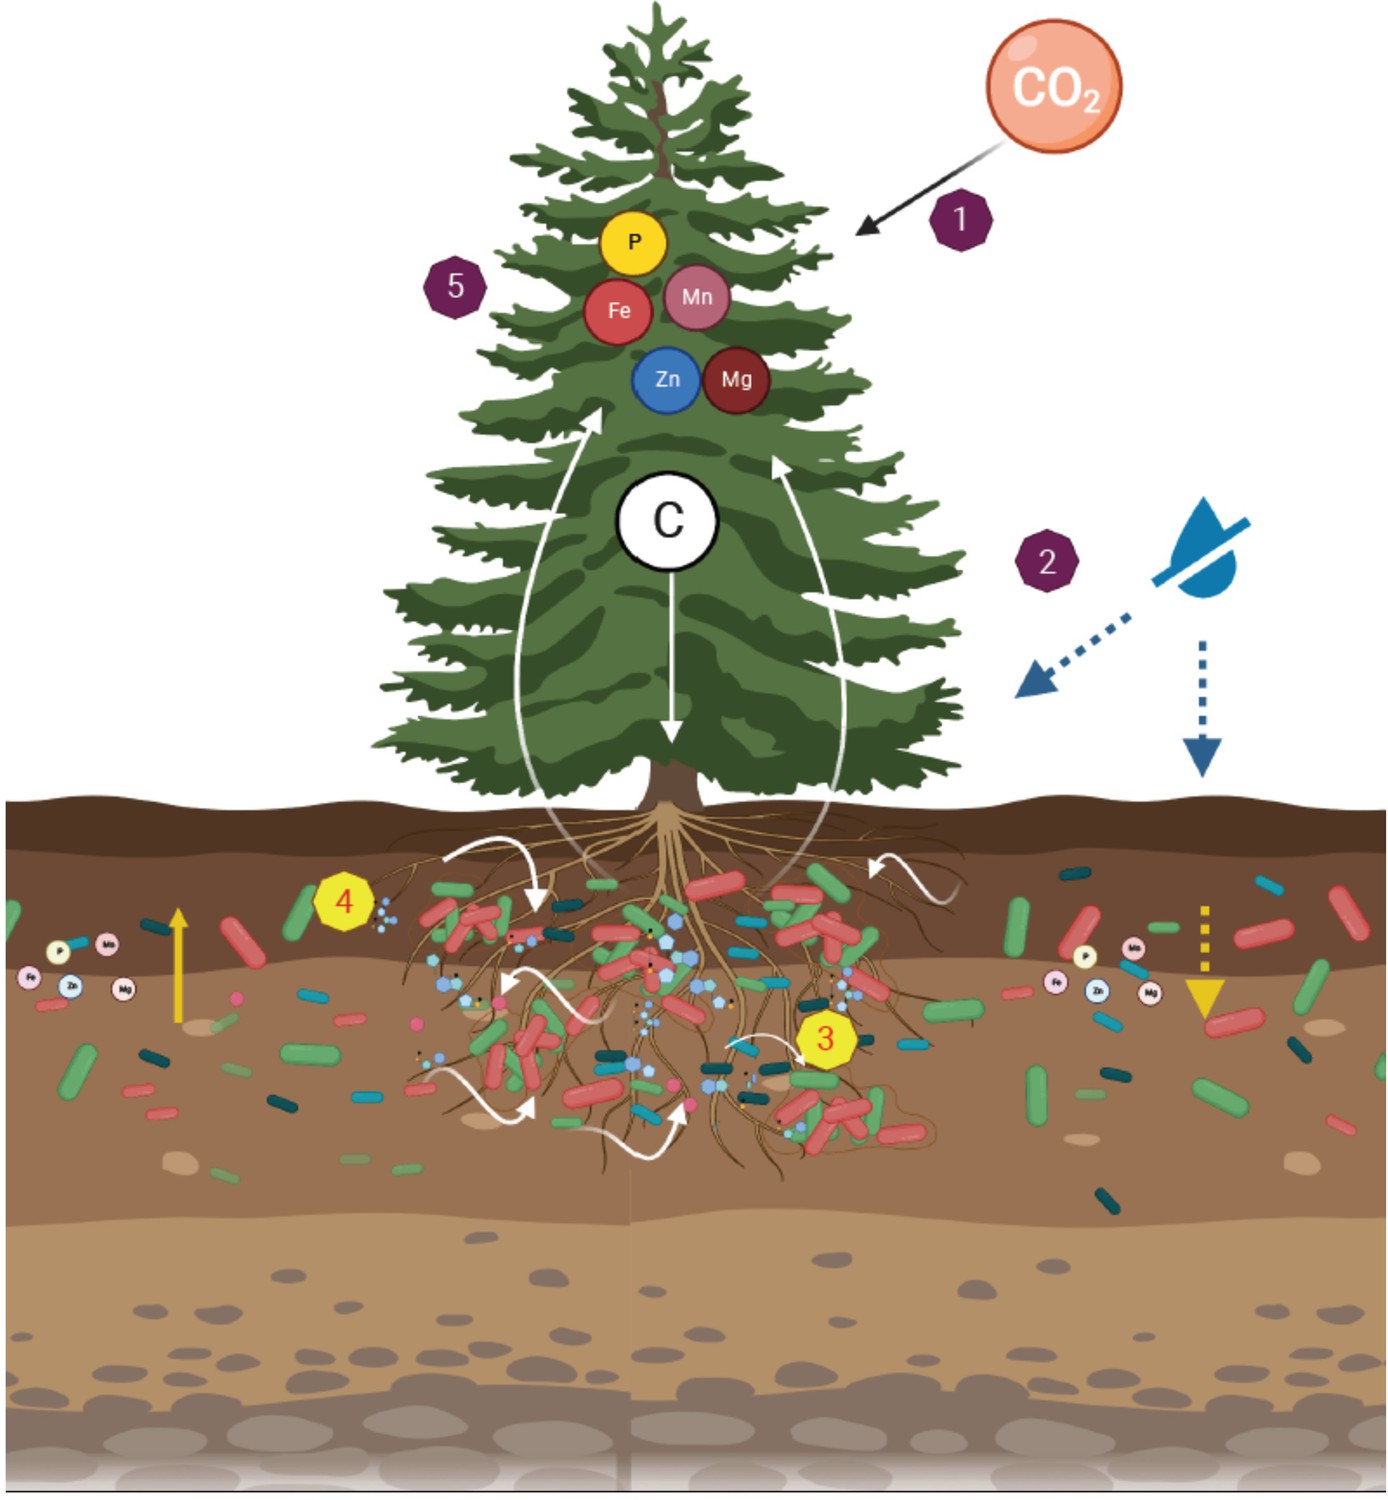
A dynamic rhizosphere interplay between tree roots and soil bacteria under drought stress.
Leaf CO2 assimilation distributed across the tree tissues (1). Under soil drought, leaf gas exchange and tree growth were inhibited (2). Trees recruited root-associated bacteria through changes in exudation rates and composition (3). The metabolites exuded by roots promoted growth of rhizosphere bacteria (4). In turn, the drought-induced reduction in leaf mineral concentrations (e.g. phosphorous and iron) were mitigated by bacteria (5).
-
Figure 7—source data 1
Statistical analysis of leaf assimilation, root exudation, and their relationships.
- https://cdn.elifesciences.org/articles/79679/elife-79679-fig7-data1-v2.pdf
Tables
Table 1
Dynamic changes in selected metabolites across treatments (DB, drought and bacterial inoculation; D, drought; I, irrigation) and along the experiment (drought and recovery following re-irrigation).
t-Test results are for pairwise comparisons between the relative changes of a metabolite between two treatments. Significant values are in boldface. Log 2 fold changes of the metabolites are for pairwise comparisons between two treatments.
| Metabolite | t-Test | Log 2 fold change | ||||
|---|---|---|---|---|---|---|
| Drought DB/D | Drought D/I | Drought DB/D | Drought D/I | Re-irrigation DB/D | Re-irrigation D/I | |
| 2,3-Dihydroxybenzoate | 0.013 | 0.759 | 0.12 | 0.01 | –0.02 | –0.07 |
| 3,4-Dihydroxymandelate | 0.675 | 0.010 | –0.04 | 0.19 | 0.07 | 0.14 |
| 3,5-Dimethoxyphenol | 0.048 | 0.040 | –0.06 | 0.05 | 0.01 | 0.07 |
| Citrulline | 0.065 | 0.005 | 0.33 | –0.44 | –0.10 | 0.19 |
| N-acetylserine | 0.043 | 0.029 | 0.14 | –0.13 | –0.02 | 0.06 |
| D-chiro-inositol | 0.040 | 0.008 | 0.23 | –0.16 | –0.05 | 0.09 |
| Quinate | 0.025 | 0.014 | 0.26 | –0.25 | –0.08 | –0.14 |
| Nicotinate | 0.039 | 0.011 | 0.05 | –0.03 | 0.02 | 0.02 |
| p-Coumaric acid | 0.227 | 0.001 | 0.13 | –0.21 | –0.04 | 0.06 |
Table 2
Soil properties from pots where saplings were grown under treatments of drought or irrigated with or without bacteria.
| (A) Soil chemistry: pH, electrical conductivity (EC), sodium absorption ratio (SAR), and minerals content (Cl, Na, Ca, Mg, N-NH4, N-NO3, K concentrations) | |||||||||||
|---|---|---|---|---|---|---|---|---|---|---|---|
| Soil | Treatment | pH | EC(ds m–1) | Cl(mg kg–1) | Na(g L–1) | Ca(mg kg–1) | Mg (mg kg–1) | SAR(mg kg–1) | N-NH4 (mg kg–1) | N-NO3 (mg kg–1) | K of CaCl2 (mg kg–1) |
| Pre (n=3) | Pre (n=3) | 7.5±0.06 | 1.88±0.07 | 87.7±3.0 | 54.4±3.6 | 750.7±8.8 | 11.8±0.3 | 2.8±0.09 | 18.9±3.0 | 25.63±3.4 | 49.43±3.9 |
| Drought | With bacteria | 7.5 | 2.51 | 170.0 | 179.4 | 1209.9 | 17.2 | 7.2 | 23.8 | 3.7 | 39.6 |
| Drought | W/o bacteria | 7.7 | 2.64 | 188.9 | 80.7 | 1222.4 | 16.9 | 3.2 | 19.1 | 3.5 | 37.3 |
| Irrigated | With bacteria | 7.6 | 6.31 | 513.6 | 54.4 | 3358.5 | 49.2 | 1.3 | 37.2 | 2.5 | 42 |
| Irrigated | W/o bacteria | 7.5 | 6.27 | 544.7 | 191.1 | 2716.3 | 51.1 | 5.1 | 41.9 | 3.6 | 39.6 |
| (B) Physical structure: sand, silt, and clay content, calcite content (CaCO3) and soil porosity (SP). | |||||||||||
| Soil | Treatment | Sand % | Salt % | Clay % | CaCO2 | SP | |||||
| Pre (n=3) | Pre (n=3) | 9±3.46 | 19.67±2.08 | 71.33±5.51 | 3.67±1.15 | 37.33±2.08 | |||||
Additional files
Download links
A two-part list of links to download the article, or parts of the article, in various formats.
Downloads (link to download the article as PDF)
Open citations (links to open the citations from this article in various online reference manager services)
Cite this article (links to download the citations from this article in formats compatible with various reference manager tools)
A dynamic rhizosphere interplay between tree roots and soil bacteria under drought stress
eLife 11:e79679.
https://doi.org/10.7554/eLife.79679


