Genetically predicted high IGF-1 levels showed protective effects on COVID-19 susceptibility and hospitalization: a Mendelian randomisation study with data from 60 studies across 25 countries
- Department of Big Data in Health Science School of Public Health, Center of Clinical Big Data and Analytics of The Second Affiliated Hospital, Zhejiang University School of Medicine, China
- Unit of Cardiovascular and Nutritional Epidemiology, Institute of Environmental Medicine, Karolinska Institutet, Sweden
- The Second School of Clinical Medicine, Southern Medical University, China
- School of Public Health and Women's Hospital, Zhejiang University School of Medicine, China
- Unit of Medical Epidemiology, Department of Surgical Sciences, Uppsala University, Sweden
- Centre for Global Health, Usher Institute, University of Edinburgh, United Kingdom
- Cancer Research UK Edinburgh Centre, Medical Research Council Institute of Genetics and Cancer, University of Edinburgh, United Kingdom
Figures
Figure 1
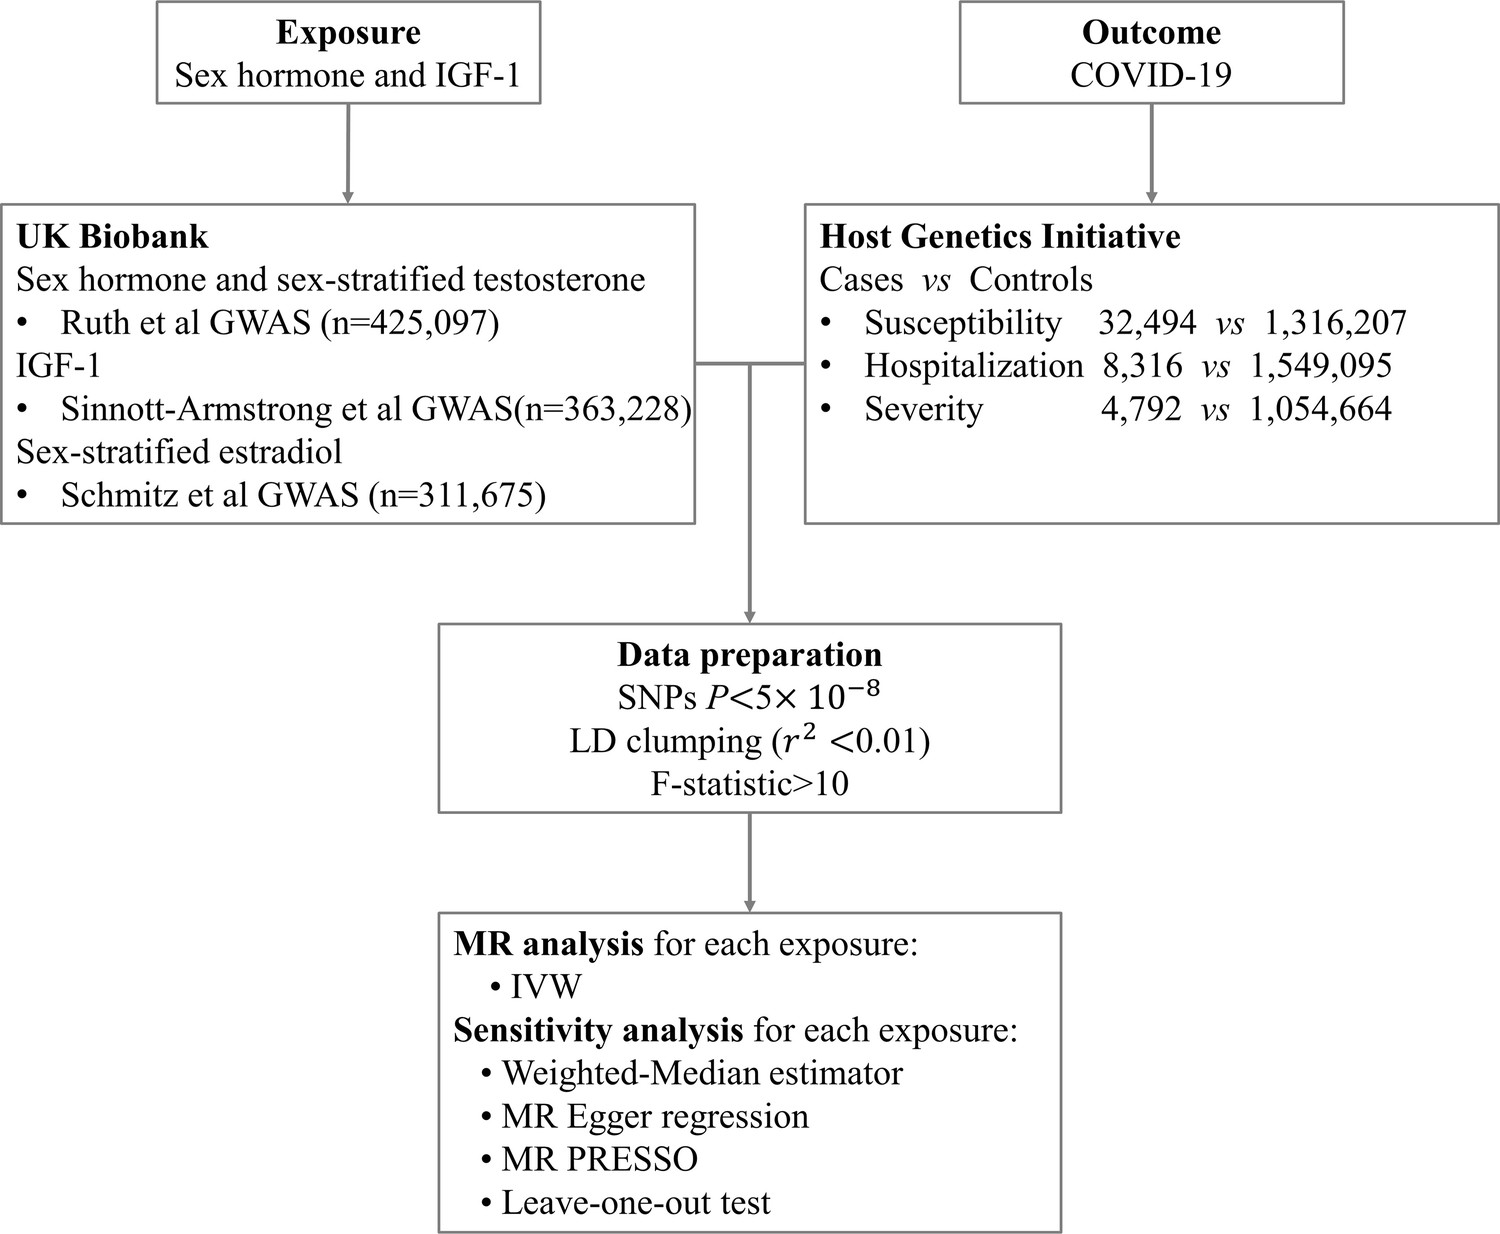
Overall study design.
Abbreviation: IGF-1, insulin-like growth factor-1; GWAS, genome-wide association study; SNP, single-nucleotide polymorphism; LD, linkage disequilibrium; IVW, inverse variance weighting; MR, Mendelian randomization.
Figure 2 with 2 supplements

IGF-1 and COVID-19 outcomes in Mendelian randomization (MR) analyses.
Abbreviation: IGF-1, insulin-like growth factor-1; SNP, single-nucleotide polymorphism; IVW, inverse variance weighting; OR, odds ratio; CI, confidence interval.
Figure 2—figure supplement 1
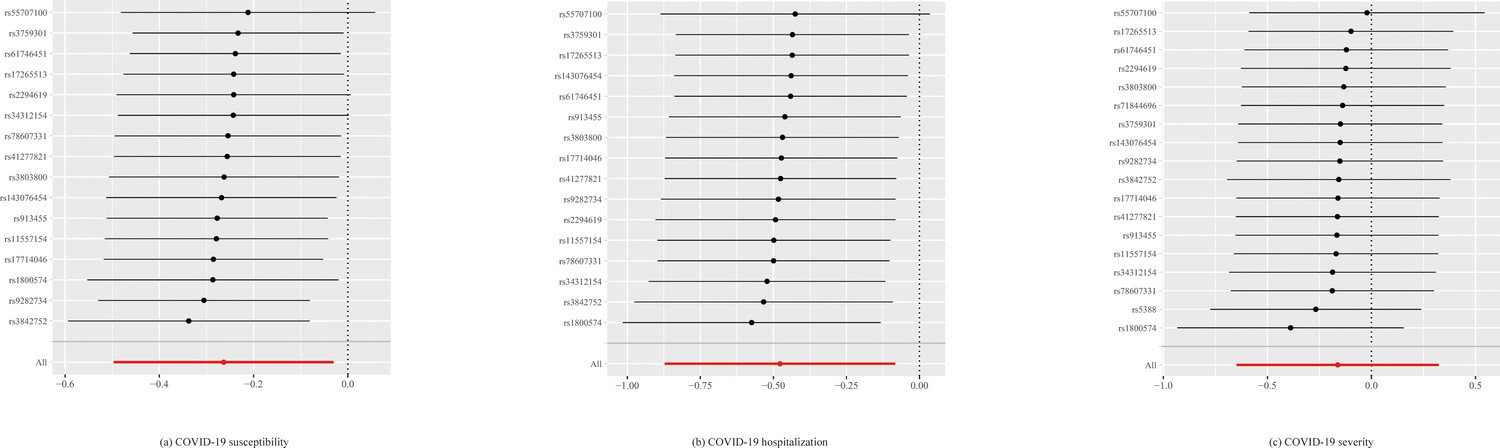
Leave-one-out plot for IGF-1 and COVID-19 susceptibility, hospitalization and severity in Mendelian randomization analysis.
Figure 2—figure supplement 2
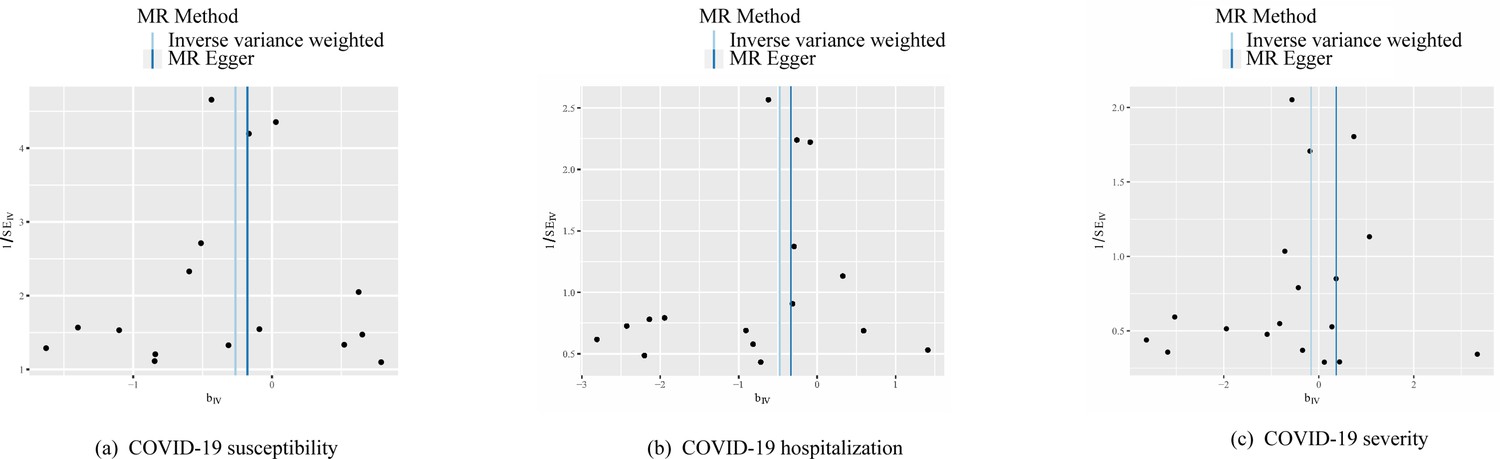
Funnel plot for IGF-1 and COVID-19 susceptibility, hospitalization and severity in Mendelian randomization analysis.
Tables
Table 1
Sources of data for Mendelian randomization analysis in COVID-19 HGI.
| Phenotype | Participants |
|---|---|
| Susceptibility | Meta-analysis of 35 GWAS performed in individuals of European ancestry |
| Cases: 32,494 individuals with COVID-19 by laboratory confirmation, chart review, or self-report | |
| Controls: 1,316,207 individuals without confirmation or history of COVID-19 | |
| Hospitalization | Meta-analysis of 23 GWAS performed in individuals of European ancestry |
| Cases: 8316 hospitalized individuals with COVID-19 | |
| Controls: 1,549,095 individuals without confirmation or history of COVID-19 | |
| Severity | Meta-analysis of 14 GWAS performed in individuals of European ancestry |
| Cases: 4792 SARS-CoV-2 infected hospitalized individuals who died or required respiratory support (intubation, CPAP, BiPAP, continuous external negative pressure, high flow nasal cannula). | |
| Controls:1,054,664 individuals without confirmation or history of COVID-19 |
-
Notes: COVID-19 outcomes are taken from the COVID-19 HGI.
-
HGI, Host Genetics Initiative; GWAS, genome-wide association study; UKB, UK Biobank; CPAP, continuous positive airway pressure ventilation; BiPAP, bilevel positive airway pressure ventilation.
Table 2
Sex hormones, SHBG, IGF-1, and COVID-19 outcomes in Mendelian randomization (MR) analyses.
| Exposure | Method | Susceptibility | Hospitalization | Severity | ||||||||||||
|---|---|---|---|---|---|---|---|---|---|---|---|---|---|---|---|---|
| SNPs | OR (95% CI) | p Effect | p Heterogeneity | p Intercept | SNPs | OR (95% CI) | p Effect | p Heterogeneity | p Intercept | SNPs | OR (95% CI) | p Effect | p Heterogeneity | p Intercept | ||
| Testosterone | IVW | 315 | 0.94 (0.83, 1.06) | 0.309 | 0.006 | – | 303 | 0.82 (0.64, 1.04) | 0.103 | 0.055 | – | 316 | 0.83 (0.60, 1.15) | 0.256 | 0.041 | – |
| MR-Egger | 0.93 (0.76, 1.12) | 0.430 | 0.005 | 0.860 | 0.79 (0.55, 1.15) | 0.217 | 0.051 | 0.819 | 0.78 (0.48, 1.27) | 0.313 | 0.038 | 0.732 | ||||
| Weighted median | 0.89 (0.71, 1.12) | 0.329 | – | – | 0.81 (0.52, 1.28) | 0.370 | – | – | 0.71 (0.40, 1.26) | 0.246 | – | – | ||||
| Simple mode | 1.13 (0.73, 1.77) | 0.584 | – | – | 0.77 (0.27, 2.20) | 0.623 | – | – | 0.44 (0.09, 2.18) | 0.316 | – | – | ||||
| Weighted mode | 0.91 (0.77, 1.08) | 0.300 | – | – | 0.77 (0.52, 1.13) | 0.180 | – | – | 0.65 (0.40, 1.05) | 0.081 | – | – | ||||
| MR-PRESSO | 0.94 (1.06, 0.84) | – | – | – | 0.82 (1.04, 0.65) | – | – | – | 0.83 (1.15, 0.59) | – | – | – | ||||
| SHBG | IVW | 319 | 0.91 (0.80, 1.04) | 0.182 | 0.002 | – | 309 | 0.86 (0.66, 1.11) | 0.255 | 0.087 | – | 320 | 0.92 (0.65, 1.29) | 0.618 | 0.096 | – |
| MR-Egger | 0.96 (0.78, 1.18) | 0.708 | 0.002 | 0.494 | 0.83 (0.57, 1.22) | 0.352 | 0.081 | 0.818 | 0.92 (0.56, 1.51) | 0.730 | 0.090 | 0.994 | ||||
| Weighted median | 0.90 (0.72, 1.13) | 0.360 | – | – | 0.82 (0.52, 1.29) | 0.391 | – | – | 0.72 (0.41, 1.27) | 0.255 | – | – | ||||
| Simple mode | 1.09 (0.66, 1.81) | 0.735 | – | – | 1.18 (0.40, 3.44) | 0.767 | – | – | 1.16 (0.25, 5.41) | 0.850 | – | – | ||||
| Weighted mode | 0.94 (0.78, 1.14) | 0.547 | – | – | 0.81 (0.56, 1.18) | 0.279 | – | – | 0.79 (0.47, 1.33) | 0.376 | – | – | ||||
| MR-PRESSO | 0.91 (1.05, 0.80) | – | – | – | 0.86 (1.11, 0.67) | – | – | – | 0.91 (1.28, 0.65) | – | – | – | ||||
| Estradiol | IVW | 7 | 0.54 (0.15, 1.94) | 0.346 | 0.188 | – | 7 | 0.87 (0.11, 6.70) | 0.895 | 0.769 | – | 7 | 0.50 (0.03, 7.64) | 0.620 | 0.987 | – |
| MR-Egger | 0.73 (0.04, 14.11) | 0.845 | 0.123 | 0.830 | 0.34 (0.00, 29.54) | 0.657 | 0.685 | 0.662 | 0.04 (0.00, 17.04) | 0.345 | 1.000 | 0.401 | ||||
| Weighted median | 0.36 (0.10, 1.35) | 0.130 | – | – | 0.35 (0.03, 4.21) | 0.407 | – | – | 0.30 (0.01, 7.26) | 0.458 | – | – | ||||
| Simple mode | 0.29 (0.03, 2.60) | 0.313 | – | – | 0.71 (0.01, 44.94) | 0.875 | – | – | 0.33 (0.00, 43.56) | 0.673 | - | - | ||||
| Weighted mode | 0.34 (0.07, 1.73) | 0.241 | – | – | 0.38 (0.03, 4.81) | 0.482 | – | – | 0.29 (0.01, 9.43) | 0.511 | - | - | ||||
| MR-PRESSO | 0.54 (1.94, 0.15) | – | – | – | 0.87 (3.93, 0.19) | – | – | – | 0.51 (1.52, 0.17) | - | - | - | ||||
| IGF-1 | IVW | 16 | 0.77 (0.61, 0.97) | 0.027 | 0.175 | – | 16 | 0.62 (0.25, 0.51) | 0.018 | 0.715 | – | 18 | 0.85 (0.52, 1.38) | 0.513 | 0.601 | - |
| MR-Egger | 0.84 (0.56, 1.26) | 0.408 | 0.145 | 0.614 | 0.72 (0.37, 1.38) | 0.336 | 0.668 | 0.595 | 1.45 (0.67, 3.10) | 0.358 | 0.758 | 0.096 | ||||
| Weighted median | 0.76 (0.57, 1.02) | 0.071 | – | – | 0.75 (0.44, 1.28) | 0.294 | – | – | 0.76 (0.38, 1.53) | 0.446 | - | - | ||||
| Simple mode | 0.64 (0.39, 1.05) | 0.097 | – | – | 0.66 (0.30, 1.45) | 0.318 | – | – | 0.82 (0.27, 2.47) | 0.730 | - | - | ||||
| Weighted mode | 0.77 (0.58, 1.02) | 0.084 | – | – | 0.71 (0.44, 1.17) | 0.199 | – | – | 0.70 (0.35, 1.38) | 0.319 | - | - | ||||
| MR-PRESSO | 0.77 (0.98, 0.61) | – | – | – | 0.62 (0.88, 0.43) | – | – | – | 0.85 (1.34, 0.54) | - | - | - | ||||
-
SNP, single-nucleotide polymorphism; OR, odds ratio; CI, confidence interval; IVW, inverse variance weighting; SHBG, sex hormones-binding globulin; IGF-1, insulin-like growth factor-1.
Table 3
Sensitive analysis between serum IGF-1 levels instrumented by 10 SNPs in the IGF-1 gene region and COVID-19 outcomes.
| Method | Susceptibility | Hospitalization | Severity | |||||||||
|---|---|---|---|---|---|---|---|---|---|---|---|---|
| OR (95% CI) | p Effect | p Heterogeneity | p Intercept | OR (95% CI) | p Effect | p Heterogeneity | p Intercept | OR (95% CI) | p Effect | p Heterogeneity | p Intercept | |
| IVW | 0.99 (0.91, 1.07) | 0.777 | 0.596 | – | 0.90 (0.74, 1.10) | 0.645 | 0.104 | – | 1.01 (0.82, 1.24) | 0.415 | 0.437 | – |
| MR-Egger | 0.99 (0.93, 1.05) | 0.732 | 0.541 | 0.527 | 0.97 (0.84, 1.11) | 0.338 | 0.108 | 0.375 | 1.09 (0.92, 1.30) | 0.953 | 0.372 | 0.590 |
| Weighted median | 1.01 (0.96, 1.06) | 0.739 | – | – | 0.97 (0.86, 1.10) | 0.620 | – | – | 1.05 (0.93, 1.20) | 0.310 | – | – |
| Simple mode | 0.98 (0.89, 1.08) | 0.685 | – | – | 1.12 (0.88, 1.43) | 0.395 | – | – | 1.16 (0.88, 1.51) | 0.316 | – | – |
| Weighted mode | 0.98 (0.92, 1.05) | 0.596 | – | – | 0.94 (0.82, 1.09) | 0.439 | – | – | 1.12 (0.92, 1.37) | 0.279 | – | – |
-
IGF-1, insulin-like growth factor-1; SNP, single-nucleotide polymorphism; IVW, inverse variance weighting; OR, odds ratio; CI, confidence interval.
Table 4
Sex-specific associations of genetically testosterone and estradiol levels with COVID-19 risk.
| Exposure | Method | Susceptibility | Hospitalization | Severity | |||||||||
|---|---|---|---|---|---|---|---|---|---|---|---|---|---|
| Male | Female | Male | Female | Male | Female | ||||||||
| OR (95% CI) | p | OR (95% CI) | p | OR (95% CI) | p | OR (95% CI) | p | OR (95% CI) | p | OR (95% CI) | p | ||
| Testosterone | IVW | 0.96 (0.90, 1.05) | 0.463 | 1.06 (0.97, 1.15) | 0.214 | 0.96 (0.83, 1.10) | 0.547 | 1.03 (0.87, 1.22) | 0.731 | 1.07 (0.89, 1.27) | 0.479 | 0.88 (0.69, 1.11) | 0.269 |
| MR-Egger | 0.97 (0.86, 1.09) | 0.644 | 1.04 (0.85, 1.26) | 0.713 | 0.88 (0.71, 1.10) | 0.270 | 1.13 (0.76, 1.69) | 0.549 | 0.81 (0.62, 1.08) | 0.152 | 0.68 (0.39, 1.18) | 0.169 | |
| Weighted median | 0.93 (0.83, 1.04) | 0.184 | 1.06 (0.94, 1.19) | 0.370 | 0.89 (0.72, 1.10) | 0.277 | 1.08 (0.84, 1.39) | 0.523 | 0.89 (0.67, 1.19) | 0.438 | 0.81 (0.57, 1.14) | 0.227 | |
| p for intercept | 1.00 (1.00, 1.00) | 0.998 | 1.00 (0.99, 1.01) | 0.854 | 1.00 (1.00, 1.01) | 0.348 | 1.00 (0.99, 1.01) | 0.615 | 1.01 (1.00, 1.02) | 0.017 | 1.01 (0.99, 1.03) | 0.314 | |
| MR-PRESSO | 0.97 (0.90, 1.05) | 0.464 | 1.06 (0.97, 1.15) | 0.216 | 0.96 (0.83, 1.10) | 0.549 | 1.03 (0.87, 1.22) | 0.732 | 1.07 (0.89, 1.27) | 0.478 | 0.88 (0.69, 1.11) | 0.270 | |
| Estradiol | IVW | 0.99 (0.89, 1.11) | 0.923 | 0.95 (0.71, 1.26) | 0.724 | 0.98 (0.81, 1.18) | 0.826 | 1.04 (0.63, 1.73) | 0.873 | 0.90 (0.71, 1.15) | 0.403 | 1.39 (0.74, 7.15) | 0.310 |
| MR-Egger | 1.00 (0.73, 1.36) | 0.993 | 0.89 (0.59, 1.34) | 0.598 | 0.93 (0.52, 1.67) | 0.812 | 1.15 (0.56, 2.34) | 0.719 | 0.61 (0.29, 6.15) | 0.233 | 1.76 (0.74, 3.15) | 0.234 | |
| Weighted median | 1.05 (0.92, 1.20) | 0.432 | 0.95 (0.68, 1.32) | 0.745 | 0.93 (0.74, 1.16) | 0.508 | 1.32 (0.67, 2.57) | 0.422 | 0.88 (0.65, 1.15) | 0.411 | 1.96 (0.81, 5.15) | 0.135 | |
| p for intercept | 1.00 (0.96, 1.04) | 0.980 | 1.00 (0.99, 1.02) | 0.669 | 1.01 (0.94, 1.08) | 0.856 | 0.99 (0.96, 1.02) | 0.707 | 1.05 (0.96, 0.15) | 0.312 | 0.99 (0.95, 0.15) | 0.441 | |
| MR-PRESSO | 0.99 (0.89, 1.11) | 0.925 | 0.95 (0.71, 1.26) | 0.732 | 0.98 (0.81, 1.18) | 0.831 | 1.04 (0.63, 1.73) | 0.877 | 0.90 (0.71, 1.15) | 0.425 | 1.39 (0.74, 2.63) | 0.335 | |
-
OR, odds ratio; CI, confidence interval; IVW, inverse variance weighting.
Table 5
Associations of serum E2 levels instrumented by rs7173595 in the CYP19A1 gene region with COVID-19 outcomes.
| Sex | Phenotype | beta | SE | OR (95% CI) | p Effect |
|---|---|---|---|---|---|
| Female | Susceptibility | –1.14 | 0.88 | 0.32 (0.06, 1.80) | 0.195 |
| Hospitalization | –1.27 | 1.60 | 0.28 (0.01, 6.46) | 0.426 | |
| Severity | –1.49 | 2.06 | 0.22 (0.00, 12.73) | 0.469 | |
| Male | Susceptibility | –1.00 | 0.77 | 0.37 (0.08, 1.67) | 0.195 |
| Hospitalization | –1.11 | 1.40 | 0.33 (0.02, 5.11) | 0.426 | |
| Severity | –1.31 | 1.80 | 0.27 (0.01, 9.26) | 0.469 |
-
E2, estradiol; OR, odds ratio; CI, confidence interval.
Table 6
Testosterone, SHBG, IGF-1, and COVID-19 outcomes in Mendelian randomization (MR) analyses adjusting BMI.
| Exposure | Method | Susceptibility | Hospitalization | Severity | ||||||||||||
|---|---|---|---|---|---|---|---|---|---|---|---|---|---|---|---|---|
| SNPs | OR (95% CI) | p Effect | p Heterogeneity | p Intercept | SNPs | OR (95% CI) | p Effect | p Heterogeneity | p Intercept | SNPs | OR (95% CI) | p Effect | p Heterogeneity | p Intercept | ||
| Testosterone | IVW | 306 | 0.95 (0.83,1.07) | 0.386 | 0.006 | – | 294 | 0.83 (0.64,1.06) | 0.134 | 0.041 | – | 307 | 0.84 (0.60,1.17) | 0.304 | 0.030 | – |
| MR-Egger | 0.93 (0.77,1.13) | 0.484 | 0.006 | 0.855 | 0.83 (0.56,1.21) | 0.324 | 0.038 | 0.991 | 0.83 (0.50,1.37) | 0.466 | 0.027 | 0.949 | ||||
| Weighted median | 0.90 (0.72,1.12) | 0.331 | – | – | 0.82 (0.52,1.28) | 0.375 | – | – | 0.71 (0.42,1.21) | 0.214 | – | – | ||||
| Simple mode | 1.13 (0.70,1.82) | 0.610 | – | – | 0.68 (0.24,1.91) | 0.465 | – | – | 0.37 (0.07,1.88) | 0.229 | – | – | ||||
| Weighted mode | 0.95 (0.79,1.13) | 0.540 | – | – | 0.81 (0.56,1.17) | 0.273 | – | – | 0.65 (0.40,1.06) | 0.085 | – | – | ||||
| MR-PRESSO | 0.94 (0.83,1.07) | – | – | – | 0.83 (0.64,1.06) | – | – | – | 0.83 (0.64,1.06) | – | – | – | ||||
| SHBG | IVW | 308 | 0.90 (0.79,1.04) | 0.160 | 0.002 | – | 198 | 0.84 (0.64,1.10) | 0.209 | 0.047 | – | 309 | 0.89 (0.62,1.26) | 0.511 | 0.058 | – |
| MR-Egger | 0.94 (0.76,1.15) | 0.538 | 0.001 | 0.663 | 0.81 (0.54,1.21) | 0.299 | 0.043 | 0.794 | 0.89 (0.53,1.49) | 0.666 | 0.054 | 0.978 | ||||
| Weighted median | 0.90 (0.71,1.13) | 0.356 | – | – | 0.81 (0.52,1.28) | 0.377 | – | – | 0.72 (0.42,1.23) | 0.230 | – | – | ||||
| Simple mode | 1.05 (0.60,1.84) | 0.860 | – | – | 1.25 (0.42,3.78) | 0.689 | – | – | 0.97 (0.22,4.22) | 0.967 | – | – | ||||
| Weighted mode | 0.94 (0.77,1.15) | 0.570 | – | – | 0.81 (0.55,1.20) | 0.295 | – | – | 0.72 (0.43,1.22) | 0.224 | – | – | ||||
| MR-PRESSO | 0.90 (0.79,1.04) | – | – | – | 0.84 (0.64,1.10) | – | – | – | 0.89 (0.62,1.26) | – | – | – | ||||
| IGF-1 | IVW | 15 | 0.76 (0.60,0.96) | 0.021 | 0.172 | – | 15 | 0.61 (0.41,0.90) | 0.014 | 0.688 | – | 17 | 0.84 (0.52,1.38) | 0.497 | 0.534 | – |
| MR- Egger | 0.88 (0.58,1.33) | 0.554 | 0.168 | 0.390 | 0.77 (0.39,1.50) | 0.458 | 0.676 | 0.403 | 1.55 (0.71,3.39) | 0.284 | 0.757 | |||||
| Weighted median | 0.75 (0.57,0.99) | 0.046 | – | – | 0.75 (0.45,1.24) | 0.260 | – | – | 0.75 (0.38,1.48) | 0.410 | – | – | ||||
| Simple mode | 0.65 (0.38,1.11) | 0.135 | – | – | 0.64 (0.30,1.37) | 0.265 | – | – | 0.75 (0.25,2.31) | 0.629 | – | – | ||||
| Weighted mode | 0.76 (0.56,1.03) | 0.096 | – | – | 0.71 (0.44,1.15) | 0.185 | – | – | 0.72 (0.36,1.47) | 0.383 | – | – | ||||
| MR-PRESSO | 0.76 (0.60,0.96) | – | – | – | 0.61 (0.43,0.86) | – | – | – | 0.84 (0.53,1.35) | – | – | – | ||||
-
SNP, single-nucleotide polymorphism; OR, odds ratio; CI, confidence interval; IVW, inverse variance weighting; SHBG, sex hormones-binding globulin; IGF-1, insulin-like growth factor-1.
Additional files
-
MDAR checklist
- https://cdn.elifesciences.org/articles/79720/elife-79720-mdarchecklist1-v2.docx
-
Supplementary file 1
Genetic instruments for testosterone, estrogen, SHBG, and IGF-1.
- https://cdn.elifesciences.org/articles/79720/elife-79720-supp1-v2.docx
-
Reporting standard 1
Reporting checklist for case-control study.
- https://cdn.elifesciences.org/articles/79720/elife-79720-repstand1-v2.docx
Download links
A two-part list of links to download the article, or parts of the article, in various formats.
Downloads (link to download the article as PDF)
Open citations (links to open the citations from this article in various online reference manager services)
Cite this article (links to download the citations from this article in formats compatible with various reference manager tools)
Genetically predicted high IGF-1 levels showed protective effects on COVID-19 susceptibility and hospitalization: a Mendelian randomisation study with data from 60 studies across 25 countries
eLife 11:e79720.
https://doi.org/10.7554/eLife.79720


