Associations of genetic and infectious risk factors with coronary heart disease
- Global Health Institute, School of Life Sciences, École Polytechnique Fédérale de Lausanne, Switzerland
- Swiss Institute of Bioinformatics, Switzerland
- Precision Medicine Unit, Lausanne University Hospital and University of Lausanne, Switzerland
- Department of Medicine, Internal medicine, Lausanne University Hospital and University of Lausanne, Switzerland
- Division of Infections and Cancer Epidemiology, German Cancer Research Center, Germany
Figures
Figure 1
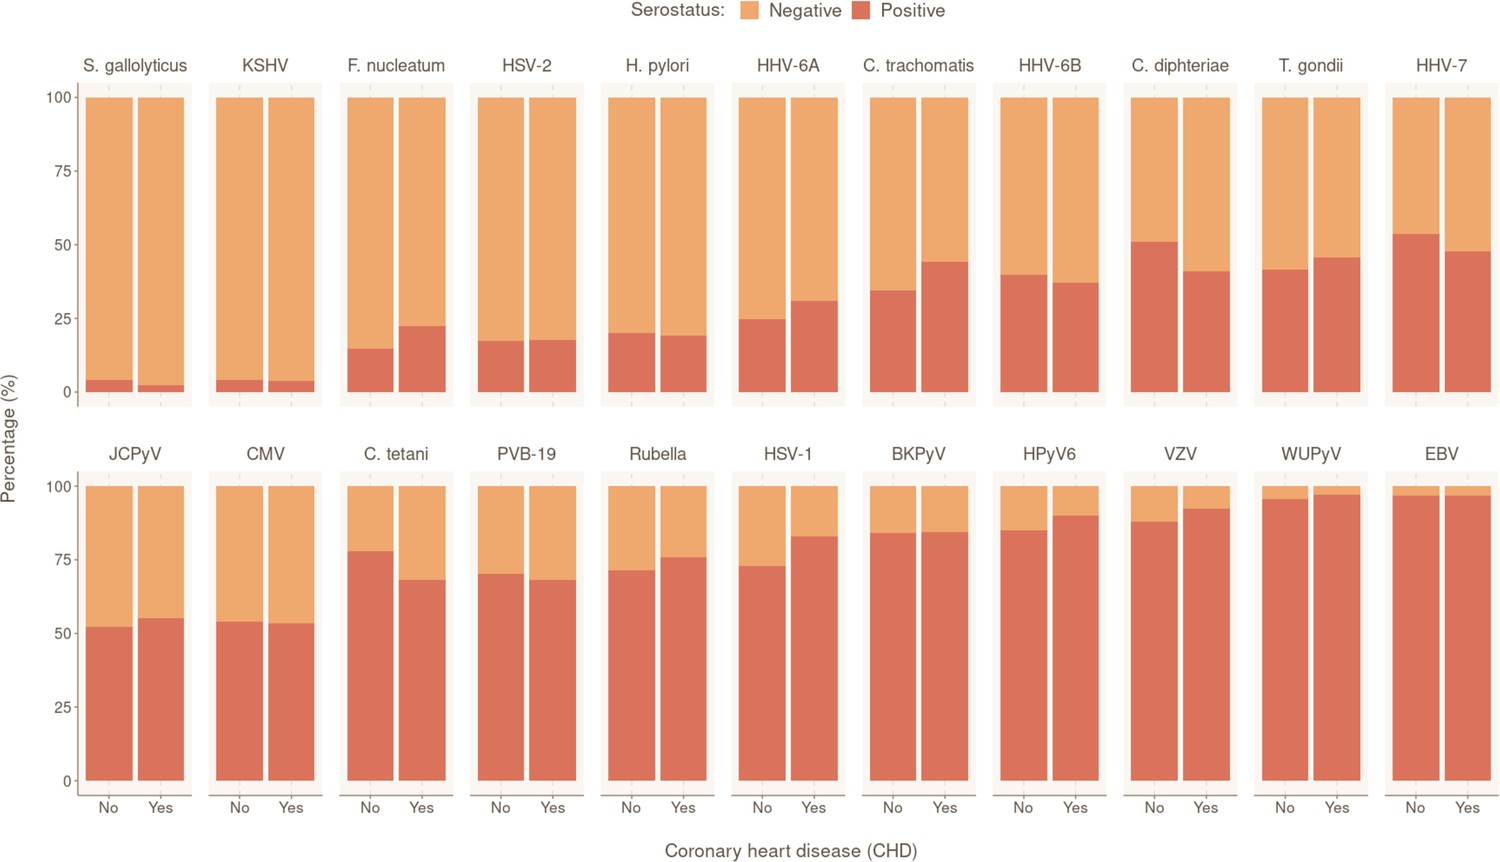
Prevalence of tested pathogens in CoLaus|PsyCoLaus study in participants with and without coronary heart disease (CHD).
Overall serostatus for the 22 pathogens are shown in the CHD-positive group (individuals with at least one CHD event during follow-up) or CHD-negative group. The y-axis indicates the relative percentage within each group. Pathogens are ranked in ascending order of overall seropositivity (all individuals combined).
-
Figure 1—source data 1
Data underlying Figure 1.
- https://cdn.elifesciences.org/articles/79742/elife-79742-fig1-data1-v1.xlsx
Figure 2
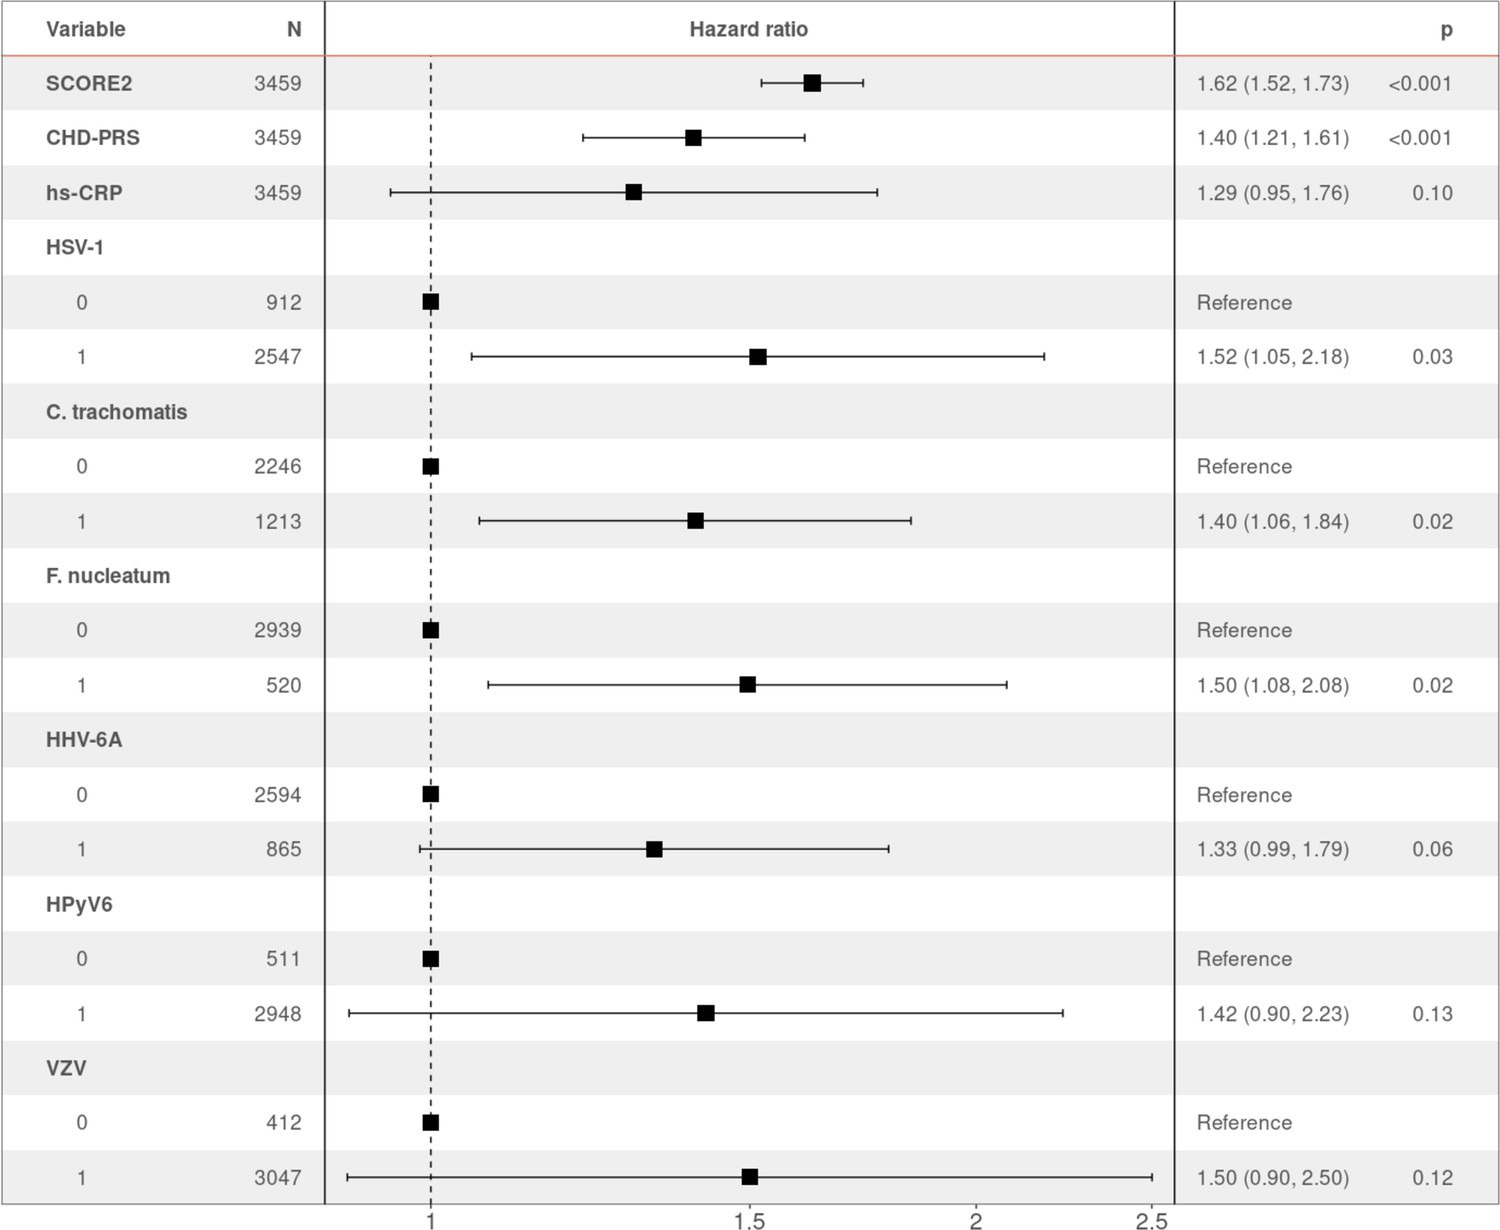
Hazard ratio (HR) and 95% confidence intervals of coronary heart disease (CHD) occurrence according to associated factors.
HR > 1 indicates an increased risk of CHD, whereas HR < 1 indicates a protective effect. p-Values (p) for each factor based on the multivariable Cox regression are shown.
-
Figure 2—source data 1
Data underlying Figure 2.
- https://cdn.elifesciences.org/articles/79742/elife-79742-fig2-data1-v1.xlsx
Appendix 2—figure 1

Pairwise correlations between quantitative characteristics significantly associated with coronary heart disease (CHD) risk in the univariable Cox proportional hazard models.
Pearson’s correlation values are displayed, along with linear fits between variables.
Appendix 2—figure 2
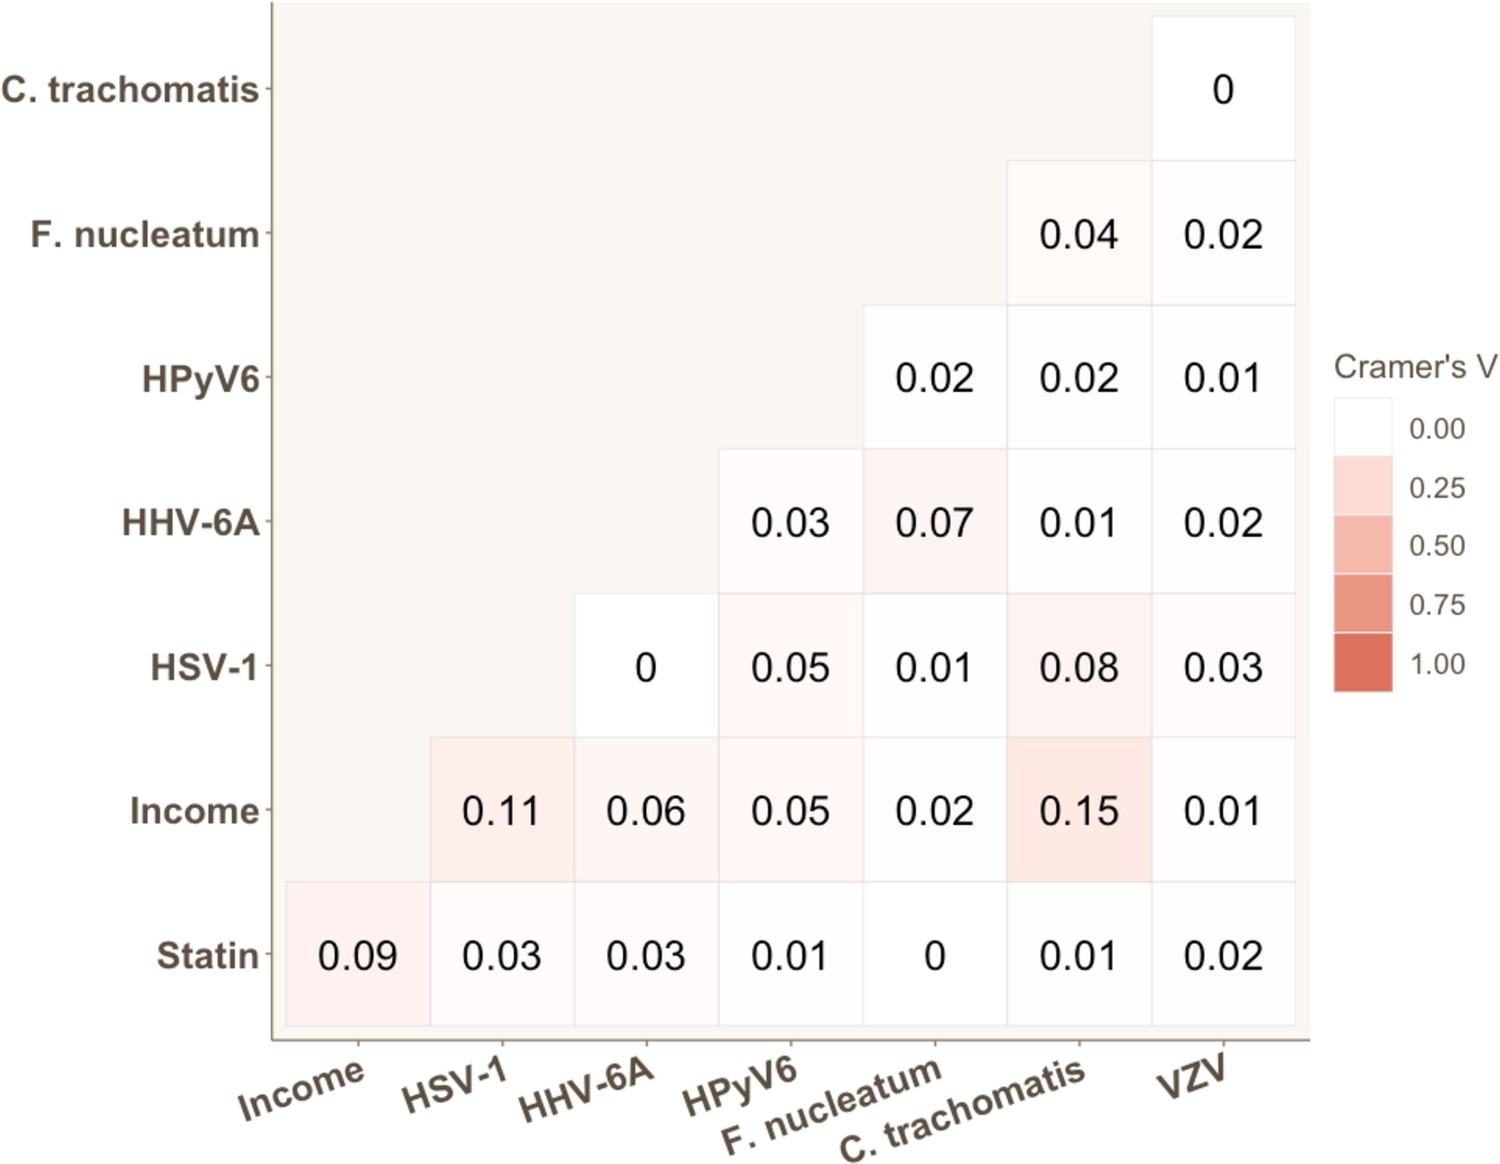
Strength of association for each pair of categorical variables significantly associated with coronary heart disease (CHD) risk in univariable Cox proportional hazard models.
Cramer’s V values are displayed.
Appendix 2—figure 3

Graphical test of proportional hazards assumption (Schoenfeld test).
The graphs show the scaled Schoenfeld residuals over time. The p-values (p) of the variables and the model as a whole were shown in the plot. A significant p-value (< 0.05) indicates that the variable violates the proportional hazard assumption. The solid line represents the smoothing fitted spline, and the dashed lines the confidence bands at two standard errors. Global Schoenfeld test p=0.58.
Appendix 2—figure 4
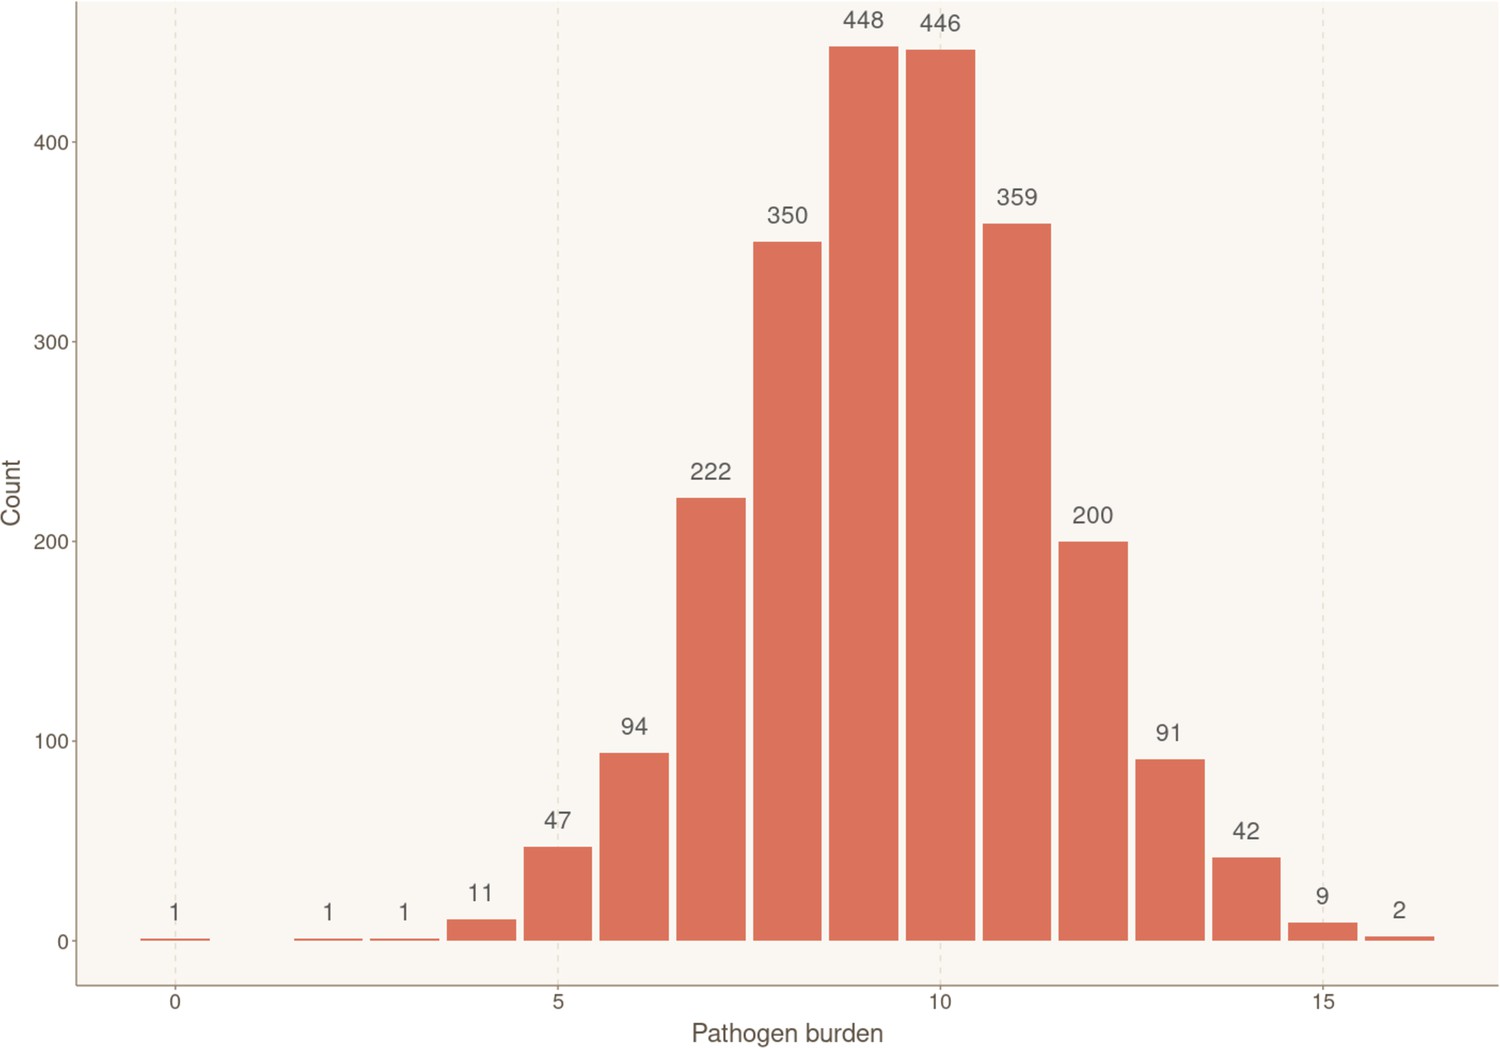
Distribution of individuals according to their exposure to infectious agents (pathogen burden).
Bar plot showing the number of participants for each cumulative number of positive serological results, reflecting simultaneous ongoing chronic/latent infections. Sample sizes for each group are shown above the box.
Tables
Table 1
Baseline characteristics of 3459 CoLaus|PsyCoLaus participants by coronary heart disease (CHD) cases and controls.
p-Values are based on the t-test for continuous variables and Fisher’s exact test for categorical variables comparing the CHD cases and controls group.
| OverallN = 3249 (100%) | ControlsN = 3249 (93.93%) | CHD casesN = 210 (6.07%) | p | |
|---|---|---|---|---|
| Baseline characteristics | ||||
| Age (mean [SD]) | 52.83 [10.48] | 52.34 [10.36] | 60.34 [9.53] | <0.001 |
| BMI (mean [SD]) | 25.51 [4.31] | 25.41 [4.27] | 27.11 [4.62] | <0.001 |
| Systolic blood pressure (mean [SD]) | 129.04 [18.40] | 128.32 [18.01] | 140.18 [20.60] | <0.001 |
| HDL cholesterol (mean [SD]) | 1.66 [0.43] | 1.67 [0.43] | 1.49 [0.41] | <0.001 |
| LDL cholesterol (mean [SD]) | 3.34 [0.92] | 3.33 [0.92] | 3.48 [0.91] | 0.018 |
| Total cholesterol (mean [SD]) | 5.60 [1.03] | 5.59 [1.02] | 5.73 [1.04] | 0.051 |
| Sex = male (%) | 1592 (46.0) | 1448 (44.6) | 144 (68.6) | <0.001 |
| Statin = yes (%) | 296 (8.6) | 242 (7.4) | 54 (25.7) | <0.001 |
| Average gross monthly income (in CHF): | 0.029 | |||
| <2999 (%) | 178 (5.1) | 161 (5.0) | 17 (8.1) | |
| 3000–4999 (%) | 452 (13.1) | 425 (13.1) | 27 (12.9) | |
| 5000–6999 (%) | 552 (16.0) | 517 (15.9) | 35 (16.7) | |
| 7000–9499 (%) | 504 (14.6) | 468 (14.4) | 36 (17.1) | |
| 9500–13,000 (%) | 338 (9.8) | 323 (9.9) | 15 (7.1) | |
| >13,000 (%) | 344 (9.9) | 335 (10.3) | 9 (4.3) | |
| Refused or missing (%) | 1091 (31.5) | 1020 (31.4) | 71 (33.8) | |
| Smoking = yes (%) | 883 (25.5) | 820 (25.2) | 63 (30.0) | 0.146 |
| Genetics | ||||
| CHD-PRS (mean [SD]) | 0.00 [1.00] | −0.02 [0.99] | 0.26 [1.01] | <0.001 |
| Biomarkers of inflammation | ||||
| hs-CRP (mean [SD]) | 0.09 [0.46] | 0.08 [0.46] | 0.22 [0.44] | <0.001 |
| TNF-α (mean [SD]) – 63 NAs | 0.46 [0.38] | 0.46 [0.38] | 0.53 [0.35] | 0.013 |
| IL-1β (mean [SD]) – 1’319 NAs | 0.17 [0.64] | 0.17 [0.64] | 0.14 [0.67] | 0.637 |
| IL-6 (mean [SD]) – 294 NAs | 0.24 [0.58] | 0.24 [0.58] | 0.28 [0.55] | 0.398 |
| Persistent pathogens | ||||
| Human polyomaviruses: | ||||
| BKPyV = seropositive (%) | 2912 (84.2) | 2735 (84.2) | 177 (84.3) | 1.000 |
| JCPyV = seropositive (%) | 1812 (52.4) | 1696 (52.2) | 116 (55.2) | 0.434 |
| HPyV6 = seropositive (%) | 2948 (85.2) | 2759 (84.9) | 189 (90.0) | 0.056 |
| WUPyV = seropositive (%) | 3309 (95.7) | 3105 (95.6) | 204 (97.1) | 0.362 |
| Human herpes viruses: | ||||
| HSV-1 = seropositive (%) | 2547 (73.6) | 2373 (73.0) | 174 (82.9) | 0.002 |
| HSV-2 = seropositive (%) | 601 (17.4) | 564 (17.4) | 37 (17.6) | 0.998 |
| CMV = seropositive (%) | 1868 (54.0) | 1756 (54.0) | 112 (53.3) | 0.897 |
| EBV = seropositive (%) | 3350 (96.8) | 3147 (96.9) | 203 (96.7) | 1.000 |
| HHV-6A = seropositive (%) | 865 (25.0) | 800 (24.6) | 65 (31.0) | 0.049 |
| HHV-6B = seropositive (%) | 1373 (39.7) | 1295 (39.9) | 78 (37.1) | 0.480 |
| HHV-7 = seropositive (%) | 1846 (53.4) | 1746 (53.7) | 100 (47.6) | 0.099 |
| KSHV = seropositive (%) | 141 (4.1) | 133 (4.1) | 8 (3.8) | 0.983 |
| VZV = seropositive (%) | 3047 (88.1) | 2853 (87.8) | 194 (92.4) | 0.061 |
| Parvovirus: | ||||
| PVB-19 = seropositive (%) | 2420 (70.0) | 2277 (70.1) | 143 (68.1) | 0.595 |
| Bacteria: | ||||
| C. trachomatis = seropositive (%) | 1213 (35.1) | 1120 (34.5) | 93 (44.3) | 0.005 |
| F. nucleatum = seropositive (%) | 520 (15.0) | 473 (14.6) | 47 (22.4) | 0.003 |
| H. pylori = seropositive (%) | 685 (19.8) | 645 (19.9) | 40 (19.0) | 0.846 |
| S. gallolyticus = seropositive (%) | 135 (3.9) | 130 (4.0) | 5 (2.4) | 0.322 |
| Parasite: | ||||
| T. gondii = seropositive (%) | 1445 (41.8) | 1349 (41.5) | 96 (45.7) | 0.262 |
Appendix 1—table 1
Characteristics of infectious agent-specific antigens used on the Multiplex Serology platform in CoLaus|PsyCoLaus.
| Family | Pathogen | Antigen | (Predicted) function | Def. of seropositivity is based on | Reference |
|---|---|---|---|---|---|
| Human polyomaviruses | BKV | VP1 | Major capsid protein | NA | Kjaerheim et al., 2007; Gossai et al., 2016; Robles et al., 2015 |
| JCV | VP1 | Major capsid protein | NA | Kjaerheim et al., 2007; Gossai et al., 2016; Robles et al., 2015 | |
| HPyV6 | VP1 | Major capsid protein | NA | Kjaerheim et al., 2007; Gossai et al., 2016; Robles et al., 2015 | |
| WUPyV | VP1 | Major capsid protein | NA | Kjaerheim et al., 2007; Gossai et al., 2016; Robles et al., 2015 | |
| Human herpes viruses | CMV | pp150 | Tegument protein | At least two positive | Brenner et al., 2018 |
| pp52 | DNA binding protein | ||||
| pp28 | Capsid protein | ||||
| EBV | ZEBRA | Replication activator | At least two positive | Brenner et al., 2018 | |
| EA-D | Replication (polymerase accessory subunit) | ||||
| VCA p18 | Capsid protein | ||||
| EBNA1 | Replication, latent viral infection | ||||
| HHV-6 | IE1B | Potential transactivator | Any HHV-6=at least one positive HHV-6A=IE1A and/or p100HHV-6B=IE1B and/or p101K | Bassig et al., 2018; Engdahl et al., 2019; Freuer et al., 2020 | |
| IE1A | Potential transactivator | ||||
| p101K | Potential tegument protein | ||||
| p100 | Potential tegument protein | ||||
| HHV-7 | U14 | Potential tegument protein | NA | Validation ongoing | |
| HSV-1 | gG | Membrane glycoprotein | NA | Brenner et al., 2019a | |
| HSV-2 | mgG | Membrane glycoprotein | NA | Brenner et al., 2019a | |
| KSHV | LANA3 | Replication and long-term persistence | At least one positive | Validation ongoing | |
| K8.1 | Structural glycoprotein | ||||
| VZV | gE/gI | Envelope glycoprotein | NA | Brenner et al., 2019a | |
| Parvovirus | B19 | VP1unique | Minor capsid protein | NA | Brenner et al., 2019b |
| Rubella virus* | RV | E1 | Class II viral fusion protein | NA | Brenner et al., 2019b |
| C. trachomatis | Ct | pGP3 | Virulence factor | NA | Trabert et al., 2019 |
| C. tetani* | Ct | TetX | Toxoid (heavy chain) | NA | Brenner et al., 2019b |
| Corynebacterium diphtheriae* | Cd | DTA | Toxoid (intracellular) | NA | Brenner et al., 2019b |
| F. nucleatum | Fn | Fn0264 | Adhesin (FadA) | At least one positive (experimental) | Butt et al., 2019 |
| Fn1449 | Type Va secretion system (Fap2) | ||||
| Fn1859 | Porin (FomA) | ||||
| H. pylori | Hp | HP 10 GroEL | Chaperonin | At least three positive | Michel et al., 2009 |
| HP 73 UreaseA | Urease alpha subunit | ||||
| HP 547 CagA | Pathogenesis | ||||
| HP 875 Catalase | Detoxification | ||||
| HP 887 VacA | Pathogenesis | ||||
| HP 1564 OMP | Cell envelope | ||||
| S. gallolyticus | Sg | Gallo2178 | Pil1 pilus subunit (major pilin) | NA | Butt et al., 2016; Butt et al., 2017 |
| T. gondii | Tg | p22 | Surface protein | At least one positive | Brenner et al., 2019a |
| sag-1 | Surface protein |
-
*
Pathogens not taken forward due to lack of vaccination history in CoLaus|PsyCoLaus and/or the difficulty in identifying target antigens to ensure specificity of the test.
Appendix 1—table 2
Association of risk factors with coronary heart disease (CHD) based on the univariable Cox proportional hazard analyses.
| Variable | HR* (95% CI)* | p |
|---|---|---|
| Baseline characteristics | ||
| SCORE2 | 1.72 (1.61–1.85) | 2.87×10-61 |
| Statin | 3.82 (2.80–5.22) | 3.13×10⁻¹⁷ |
| Average gross monthly income | 0.85 (0.76–0.96) | 7.27×10⁻³ |
| Genetics | ||
| CHD-PRS | 1.32 (1.16–1.51) | 4.29×10⁻⁵ |
| PC1 | 74-28 (0.03–195096) | 0.28 |
| PC2 | 0.12 (00.0–728) | 0.64 |
| PC3 | 0.33 (0.00–1131) | 0.79 |
| Biomarkers of inflammation | ||
| hs-CRP† | 1.91 (1.42–2.55) | 1.51×10⁻⁵ |
| TNF-α† | 1.43 (1.05–1.96) | 2.46×10⁻² |
| IL-1β† | 0.93 (0.70–1.25) | 0.64 |
| IL-6† | 1.10 (0.88–1.37) | 0.42 |
| Human polyomaviruses | ||
| BKPyV | 1.05 (0.72–1.52) | 0.80 |
| JCPyV | 1.14 (0.87–1.50) | 0.35 |
| HPyV6 | 1.66 (1.06–2.61) | 2.74×10⁻² |
| WUPyV | 1.45 (0.65–3.27) | 0.37 |
| Human herpes viruses | ||
| HSV-1 | 1.88 (1.30–2.68) | 6.52×10⁻⁴ |
| HSV-2 | 1.05 (0.74–1.50) | 0.78 |
| CMV | 1.00 (0.76–1.31) | 0.99 |
| EBV | 0.97 (0.46–2.06) | 0.94 |
| HHV-6A | 1.39 (1.03–1.86) | 2.89×10⁻² |
| HHV-6B | 0.93 (0.70–1.23) | 0.59 |
| HHV-7 | 0.79 (0.60–1.03) | 8.33×10⁻² |
| KSHV | 0.89 (0.44–1.80) | 0.74 |
| VZV | 1.70 (1.02–2.82) | 4.25×10⁻² |
| Parvovirus | ||
| PVB-19 | 0.90 (0.68–1.21) | 0.49 |
| Bacteria | . | |
| C. trachomatis | 1.45 (1.11–1.91) | 7.22×10⁻³ |
| F. nucleatum | 1.66 (1.20–2.29) | 2.32×10⁻³ |
| H. pylori | 0.95 (0.67–1.34) | 0.78 |
| S. gallolyticus | 0.62 (0.26–1.51) | 0.29 |
| Parasite | ||
| T. gondii | 1.17 (0.90–1.54) | 0.25 |
| Pathogen burden | 1.11 (1.03–1.18) | 3.25×10⁻³ |
-
*
HR = hazard ratio, CI = confidence interval.
-
†
log10-transformed.
Additional files
Download links
A two-part list of links to download the article, or parts of the article, in various formats.
Downloads (link to download the article as PDF)
Open citations (links to open the citations from this article in various online reference manager services)
Cite this article (links to download the citations from this article in formats compatible with various reference manager tools)
Associations of genetic and infectious risk factors with coronary heart disease
eLife 12:e79742.
https://doi.org/10.7554/eLife.79742


