miRNA-27a is essential for bone remodeling by modulating p62-mediated osteoclast signaling
- University of Rochester Medical Center, United States
- The Forsyth Institute, United States
- Case Western Reserve University, United States
- Faculty of Medicine, Harvard University, United States
- Harvard School of Dental Medicine, United States
- Harvard Stem Cell Institute, United States
Figures
Figure 1 with 3 supplements
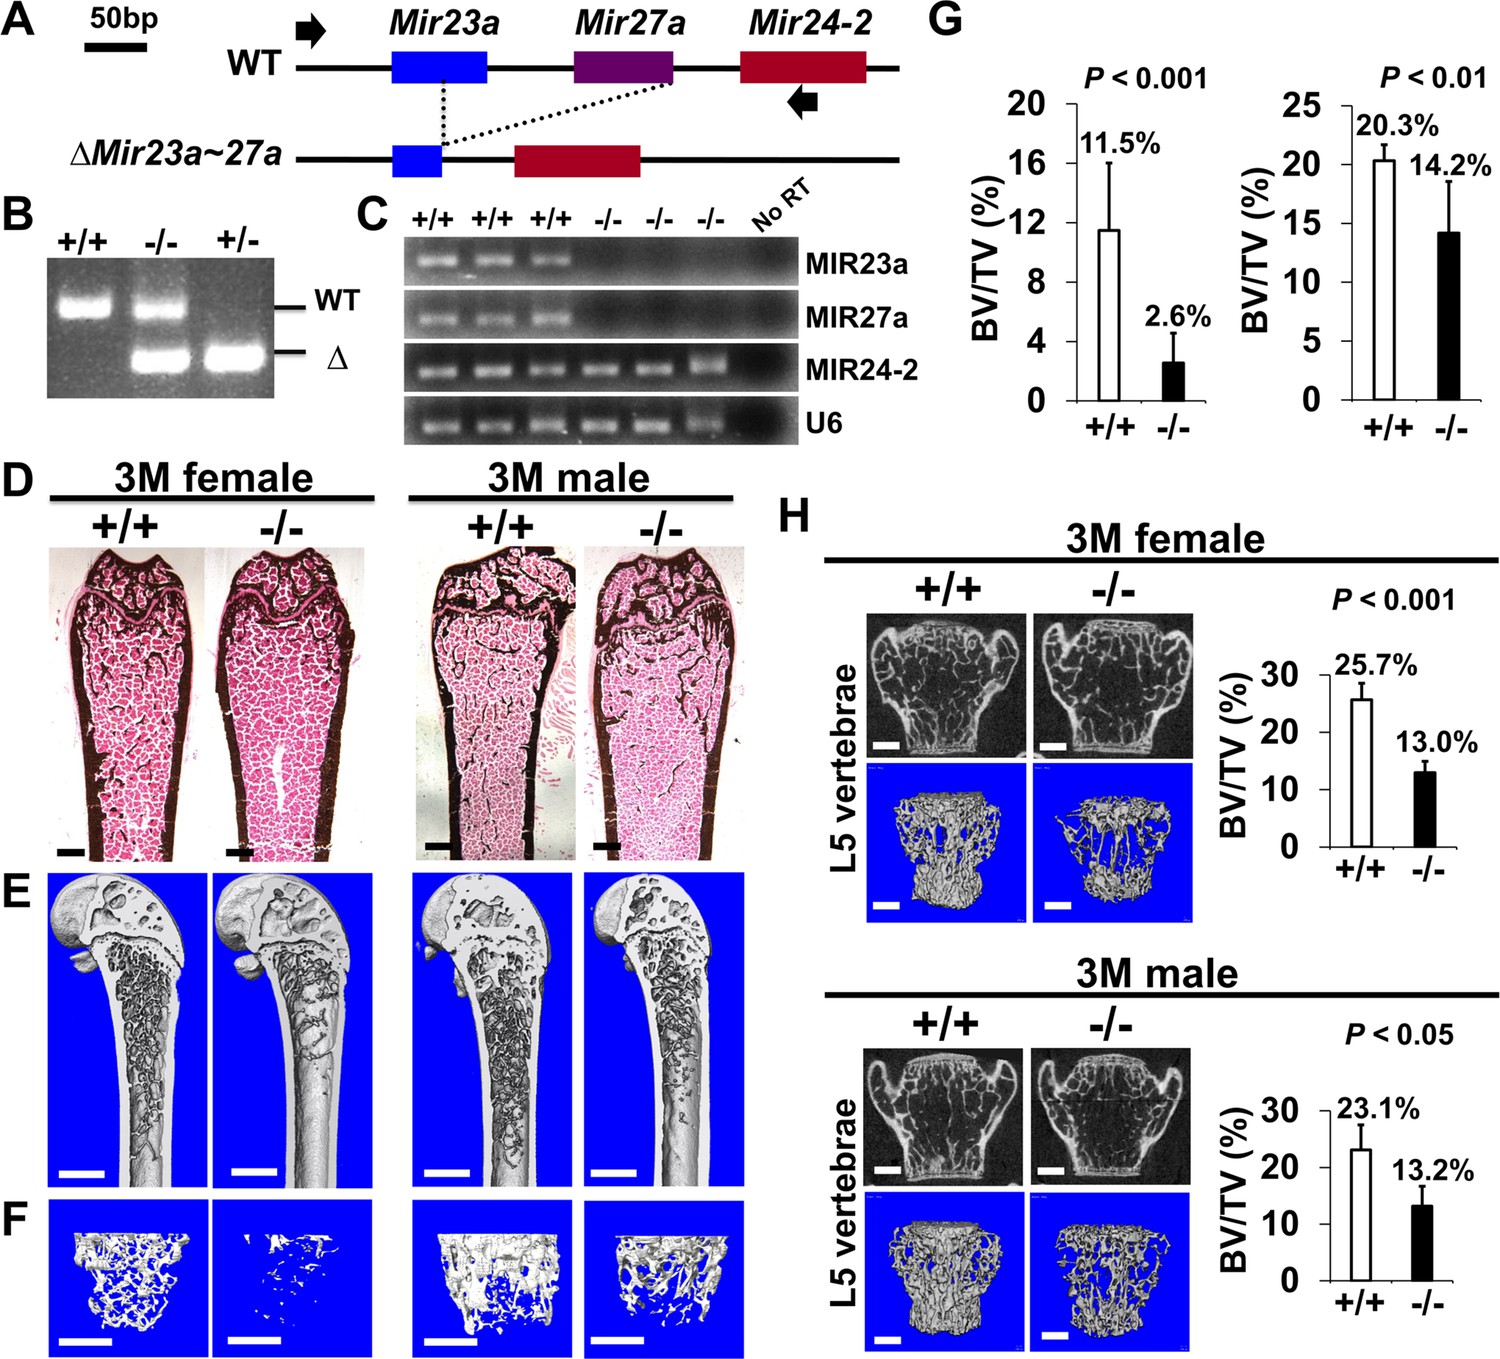
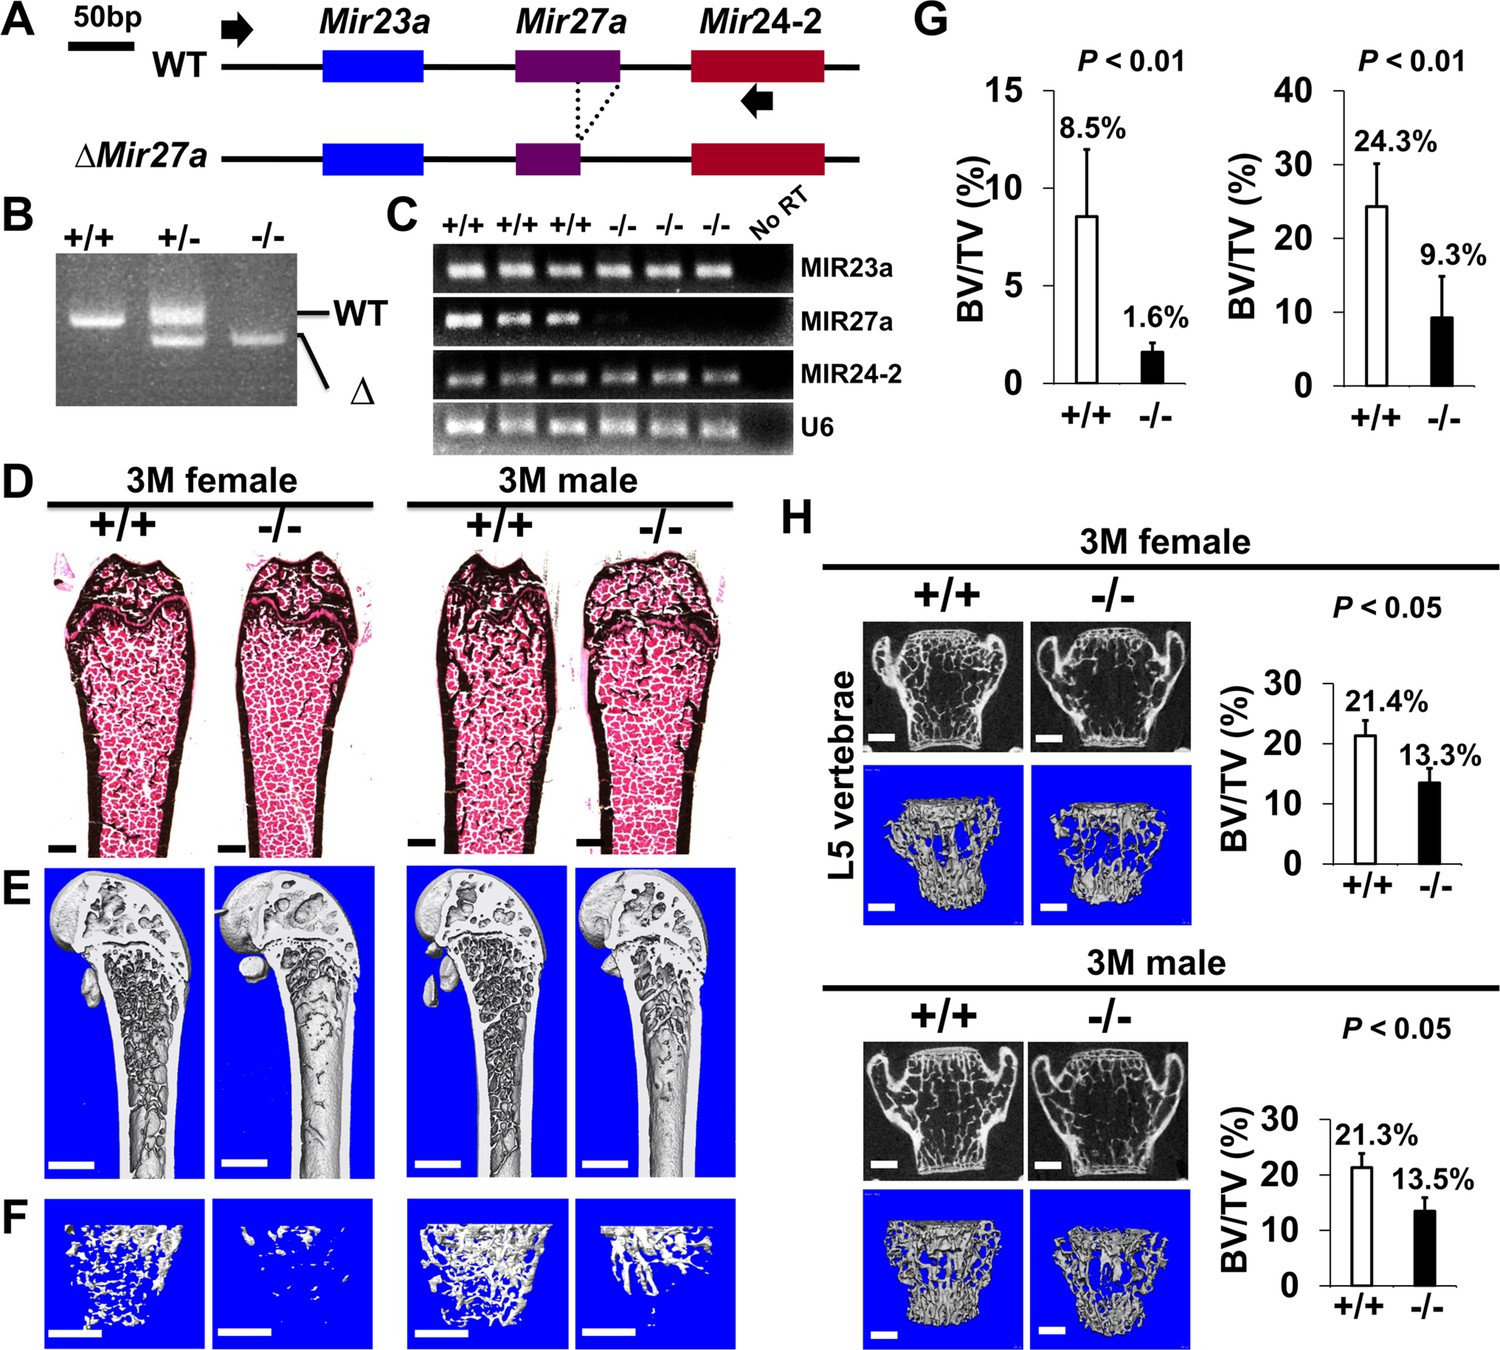
Low bone mass phenotypes in mice deficient for Mir23a~27a.
(A) Diagrams illustrate the Mir23a cluster, consisting of Mir23a, Mir27a, and Mir24-2 (WT), and the creation of mouse strains deficient for Mir23a~27a (∆Mir23a~27a) by CRISPR/Cas9 genome editing. Broken lines and arrows indicate the deleted genomic regions and primers used for PCR genotyping analysis, respectively. (B) PCR analysis examines the Mir23a cluster for genotyping the wild-type (+/+), heterozygous (+/−), and homozygous (−/−) for miR-23a~27 a mice. The mutant (∆) alleles with deletion of Mir23a~27a result in the generation of shorter PCR products. (C) RT-PCR analysis of the MIR23a, MIR27a, and MIR24-2 RNAs reveals the disruption of specific miRNA(s) in the mutants. The analysis of small non-coding RNA U6 is used as an internal control. Femurs of the 3-month-old (3 M) wild-type (+/+) and mutant (−/−) males and females were analyzed by μCT scanning (E–F), followed by sectioning and von Kossa staining (D). Reconstructed μCT images of the distal femur (E) and femoral metaphysis (F) were subject to quantitative analysis for trabecular bone volume (G). (H) Spines of the 3-month-old (3 M) ∆Mir23a~27a males and females were analyzed by μCT scanning. Images show the μCT scanned wild-type (+/+) and mutant (−/−) L5 vertebrae (top) and three dimensional (3D)-rendered trabecular bone (bottom). Quantitative analyses of trabecular bone volume per total volume in the femurs (BV/TV(bone volume to total volume fraction), n=7, mean ± SD; student t-test) and vertebrates (BV/TV, n=4 for female and n=3 for male, mean ± SD; student t-test) are shown in graphs. Images (D–F and H) are representatives of three independent experiments. Scale bars, 500 µm (D–F and H).
-
Figure 1—source data 1
Statistical data for Figure 1G–H.
- https://cdn.elifesciences.org/articles/79768/elife-79768-fig1-data1-v2.xlsx
-
Figure 1—source data 2
Raw gel image of Figure 1B.
- https://cdn.elifesciences.org/articles/79768/elife-79768-fig1-data2-v2.zip
-
Figure 1—source data 3
Uncropped gel image of Figure 1B with labels.
- https://cdn.elifesciences.org/articles/79768/elife-79768-fig1-data3-v2.zip
-
Figure 1—source data 4
Raw gel image of Figure 1C -1.
- https://cdn.elifesciences.org/articles/79768/elife-79768-fig1-data4-v2.zip
-
Figure 1—source data 5
Raw gel image of Figure 1C -2.
- https://cdn.elifesciences.org/articles/79768/elife-79768-fig1-data5-v2.zip
-
Figure 1—source data 6
Uncropped gel image of Figure 1C with labels-1.
- https://cdn.elifesciences.org/articles/79768/elife-79768-fig1-data6-v2.zip
-
Figure 1—source data 7
Uncropped gel image of Figure 1C with labels-2.
- https://cdn.elifesciences.org/articles/79768/elife-79768-fig1-data7-v2.zip
-
Figure 1—source data 8
Uncropped gel image of Figure 1C with labels-3.
- https://cdn.elifesciences.org/articles/79768/elife-79768-fig1-data8-v2.zip
-
Figure 1—source data 9
Uncropped gel image of Figure 1C with labels-4.
- https://cdn.elifesciences.org/articles/79768/elife-79768-fig1-data9-v2.zip
Figure 1—figure supplement 1
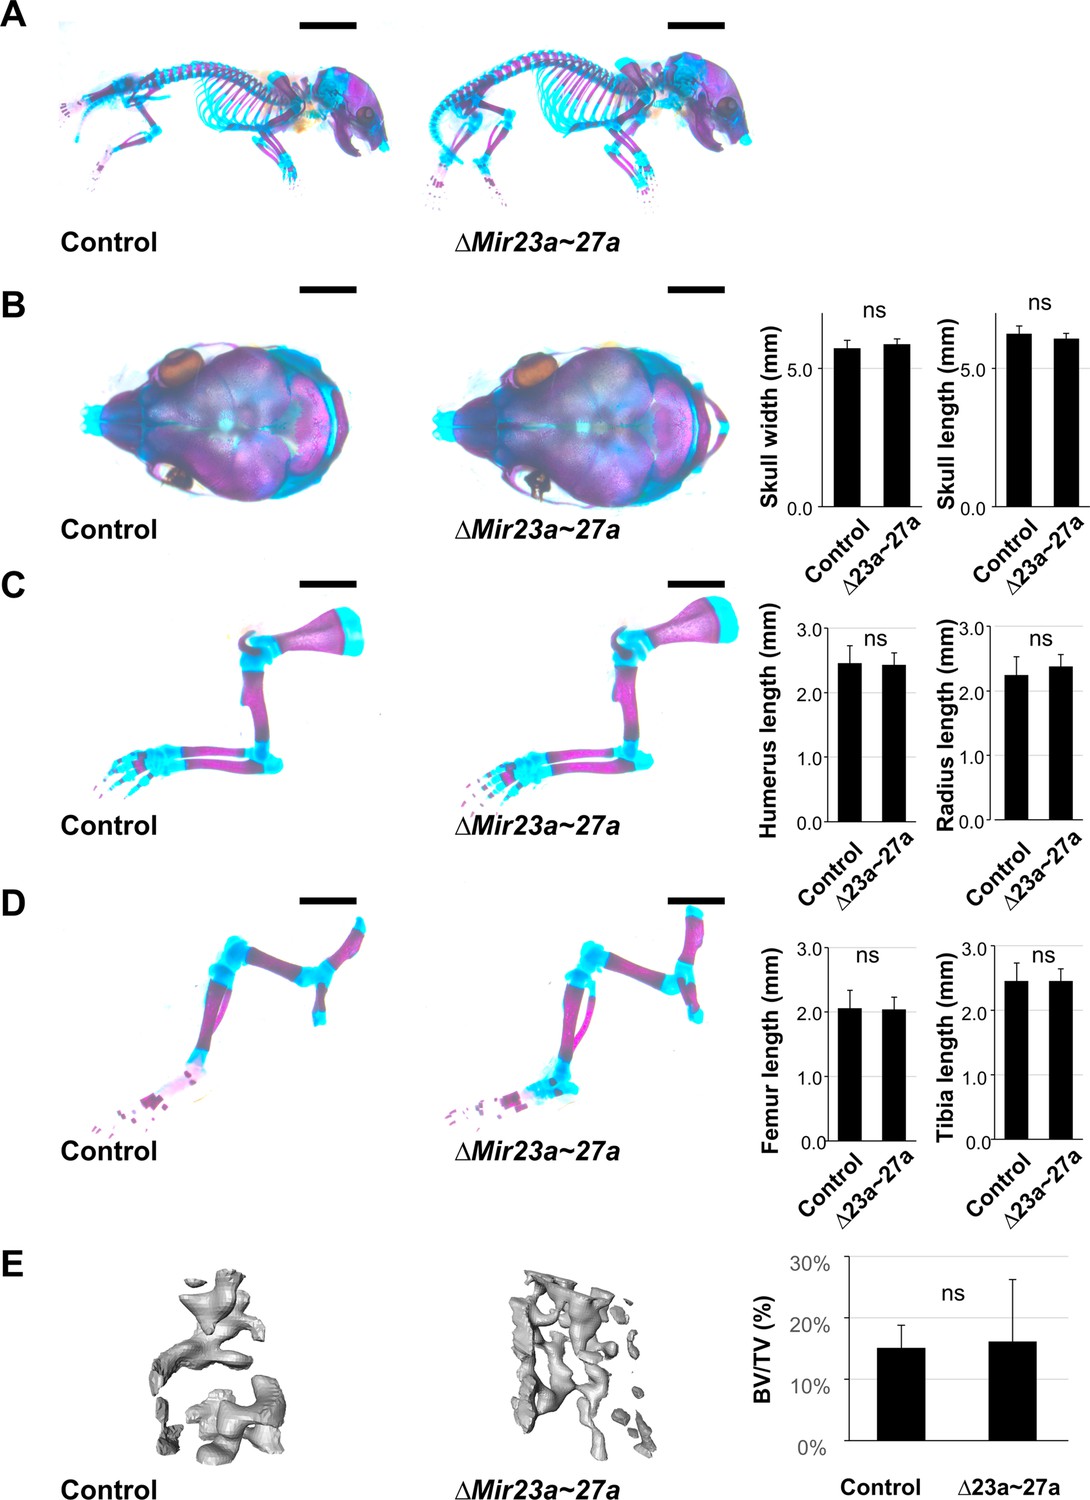
MIR23a and MIR27a are dispensable during skeletal development.
(A–D) Skeletal staining of control (n=9) and ∆Mir23a~27a (n=8) mice reveals no skeletal deformities in the skull (A and B), forelimb (A and C), and hindlimb (A and D) at postnatal day 0 (P0). The statistical evaluation shows no significant difference between the control and mutant in the skull width (B; n=8, mean ± SD mm, p-value>0.24, two-sided student t-test) and length (B; n=8, mean ± SD mm, p>0.16), in the humerus (C; n=8, mean ± SD mm, p-value>0.77) and radius (C; n=8, mean ± SD mm, p-value>0.28), in the femur (D; n=8, mean ± SD mm, p-value>0.76) and tibia (D; n=8, mean ± SD mm, p-value>0.99). (E) µCT analysis of femur trabecular bone volume shows no significant changes in ∆Mir23a~27a mice compared to the control (n=8, mean ± SD %, p-value>0.77, two-sided student t-test). Scale bars, 5 mm (A); 2 mm (B–D).
-
Figure 1—figure supplement 1—source data 1
Statistical data for Figure 1—figure supplement 1.
- https://cdn.elifesciences.org/articles/79768/elife-79768-fig1-figsupp1-data1-v2.xlsx
Figure 1—figure supplement 2
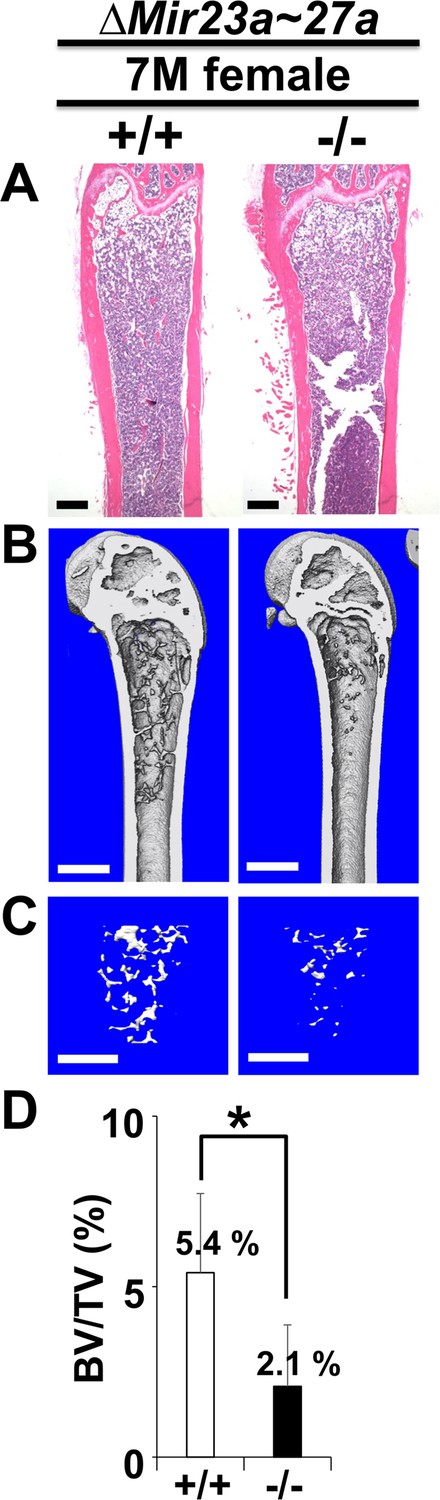
The loss of MIR23a~27a causes an osteopenic phenotype in mice.
Femurs of the 7-month-old (7 M) wild-type (+/+) and mutant (−/−) females were analyzed by μCT scanning, followed by hematoxylin and eosin (H&E) staining (A). The three dimensional (3D) rendering μCT images of the distal femur (B) and femoral metaphysis (C) were subject to quantitative analysis (D) for BV/TV (trabecular bone volume per tissue volume, n=3, *, p-value<0.05, mean ± SD; student t-test). Scale bars, 500 µm (A–C).
-
Figure 1—figure supplement 2—source data 1
Statistical data for Figure 1—figure supplement 2D.
- https://cdn.elifesciences.org/articles/79768/elife-79768-fig1-figsupp2-data1-v2.xlsx
Figure 1—figure supplement 3
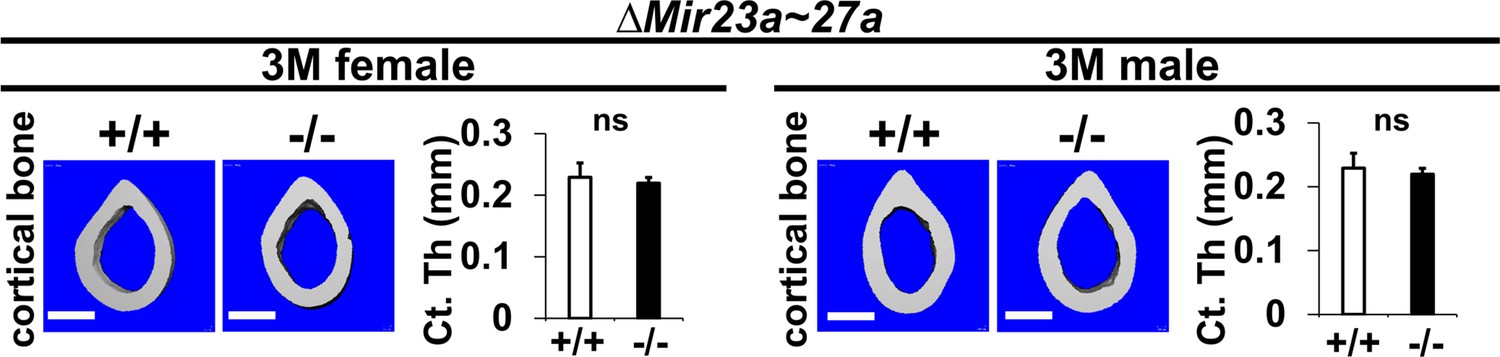
The loss of MIR23a~27a does not affect cortical bone thickness.
Femurs of the 3-month-old (3 M) ∆Mir23a~27a males and females were analyzed by μCT scanning. Images show the reconstructed cortical bone of wild-type (+/+) and mutant (−/−). Quantitative analyses of cortical (Ct.) thickness (Th) are shown in graphs (n=5, mean + SD; student t-test, ns, non-significant). Images are representatives of five independent experiments. Scale bars, 500 µm.
-
Figure 1—figure supplement 3—source data 1
Statistical data for Figure 1—figure supplement 3.
- https://cdn.elifesciences.org/articles/79768/elife-79768-fig1-figsupp3-data1-v2.xlsx
Figure 2 with 1 supplement
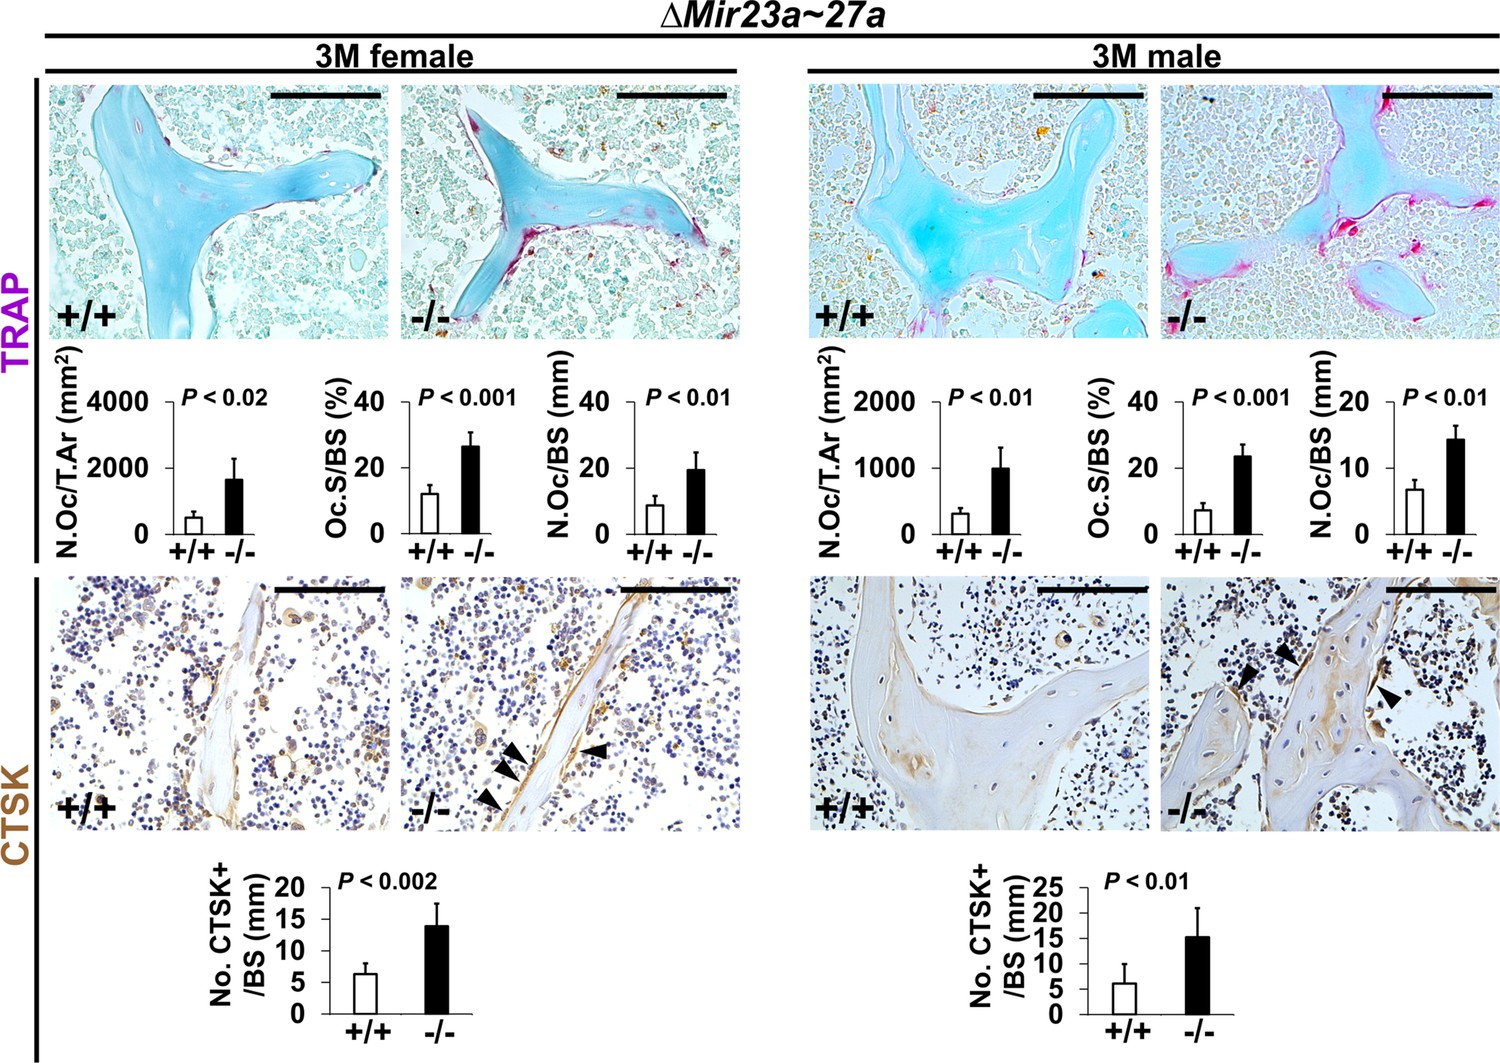
Increased number of osteoclast cells in the ∆Mir23a~27a mice.
Sections of the 3-month-old (3 M) ∆Mir23a~27a males and females were analyzed by tartrate-resistant acid phosphatase (TRAP) staining and immunostaining of Cathepsin K (CTSK). Graphs show quantitative analyses of positively stained cells in the wild-type (+/+) and mutant (−/−) distal femurs (No. of cell+/BS, n=5, mean ± SD; student t-test). Histomorphometric parameters of bone resorption are evaluated by the number of osteoclast/bone area (N.OC/T.Ar), osteoclast surface/bone surface (OC.S/BS), and osteoclast number/bone surface (N.OC/BS, n=5, mean ± SD; student t-test). Images are representatives of five independent experiments. Scale bars, 100 µm.
-
Figure 2—source data 1
Statistical data for Figure 2.
- https://cdn.elifesciences.org/articles/79768/elife-79768-fig2-data1-v2.xlsx
Figure 2—figure supplement 1

Bone formation and osteoblastogenesis are not affected by the ∆Mir23a~27a deletion.
Sections of the 3-month-old (3 M) ∆Mir23a~27a males and females were analyzed by (A) double labeling of alizarin red and calcein, and (B) immunostaining of type 1 collagen (Col1) and Osteopontin (OPN). Quantitative analyses of (A) bone formation rate per bone surface (BFR/BS, n=3, mean + SD; student t-test) and (B) number of positively stained cells over the bone surface (No. +/BS, n=5, mean + SD; student t-test, ns, non-significant) in the wild-type (+/+) and mutant (−/−) distal femurs are shown in graphs. Eb, endosteal; Tb, trabecular. Images are representatives of three independent experiments. Scale bar, 100 µm.
-
Figure 2—figure supplement 1—source data 1
Statistical data for Figure 2—figure supplement 1.
- https://cdn.elifesciences.org/articles/79768/elife-79768-fig2-figsupp1-data1-v2.xlsx
Figure 3
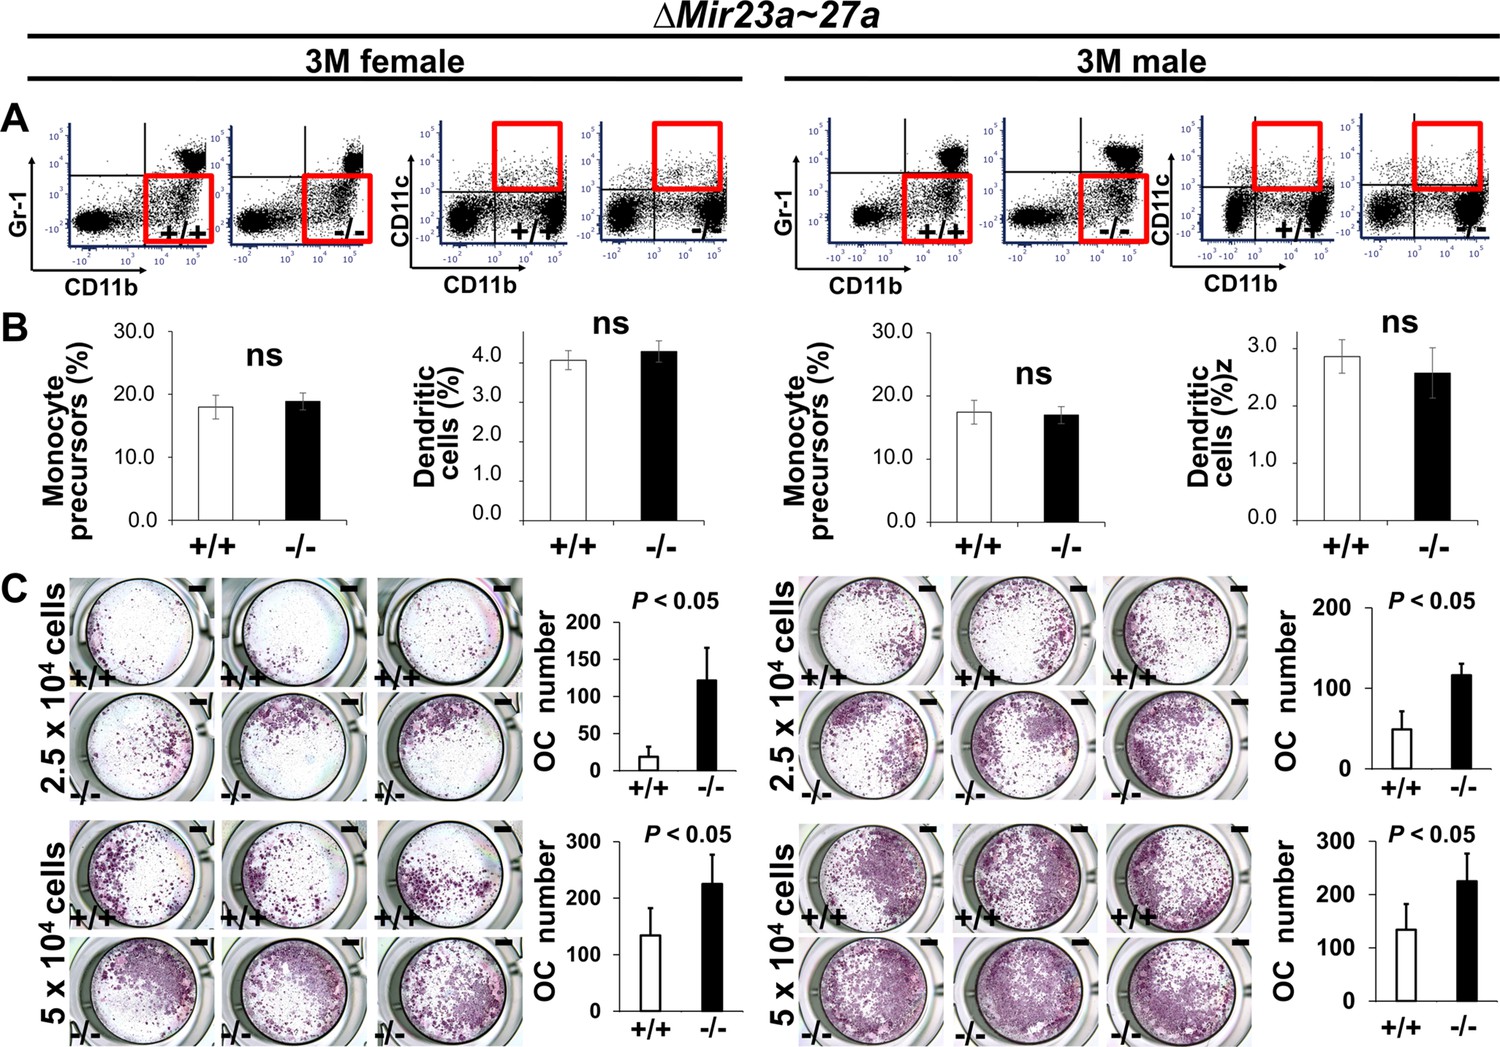
MIR23a~27a regulates osteoclast (OC) differentiation.
(A) FACS analysis examines the CD11b+/Gr-1− and CD11b+/CD11c+ populations for monocyte precursors and dendritic cells, respectively. Images are representatives of three independent experiments. (B) The bone marrow of 3-month-old (3 M) wild-type (+/+) and ∆Mir23a~27a (−/−) males and females show no significant difference (ns; n=3, mean ± SD; student t-test). (C) Cells isolated from the bone marrow were induced for OC differentiation with Receptor activator of nuclear factor kappa-Β ligand(RANLK) and macrophage colony-stimulating factor(MCSF) for 5 days (top, 2.5×10⁴ cells/well and bottom, 5×10⁴ cells/well). The number of OC cells positive for tartrate-resistant acid phosphatase (TRAP) staining is significantly enhanced in the mutant cultures (n=3, mean ± SD; student t-test). Scale bars, 1 mm (C).
-
Figure 3—source data 1
Statistical data for Figure 3.
- https://cdn.elifesciences.org/articles/79768/elife-79768-fig3-data1-v2.xlsx
Figure 4 with 2 supplements
The loss of MIR27a alone causes osteoporotic defects.
(A) Diagrams illustrate the Mir23a cluster (WT), and the creation of mouse strains deficient for Mir27a (∆Mir27a) by CRISPR/Cas9 genome editing. Broken lines and arrows indicate the deleted genomic regions and primers used for PCR genotyping analysis, respectively. (B) PCR-based genotyping identifies the wild-type (+/+), heterozygous (+/–), and homozygous (–/–) for miR-27a mice showing the mutant (∆) alleles with deletion of Mir27a result in the generation of shorter PCR products. (C) RT-PCR analysis reveals the disruption of MIR27a but not MIR23a and MIR24-2 RNAs in ∆Mir27a mutants. The analysis of small non-coding RNA U6 is used as an internal control. Femurs of the 3-month-old (3 M) wild-type (+/+) and mutant (–/–) males and females were analyzed by μCT scanning (E–F), followed by sectioning and von Kossa staining (D). The three dimensional (3D) rendered μCT images of the distal femur (E) and femoral metaphysis (F) were subject to quantitative analysis for trabecular bone volume (G). (H) Spines of the 3-month-old (3 M) ∆Mir27a males and females were analyzed by μCT scanning. Images show the μCT scanned wild-type (+/+) and mutant (–/–) L5 vertebrae (top) and 3D-rendered trabecular bone (bottom). Quantitative analyses of trabecular bone volume per total volume in the femurs (BV/TV, n=5 for female and n=4 for male, mean ± SD; student t-test) and vertebrates (BV/TV, n=3, mean ± SD; student t-test) are shown in graphs. Images (D–F and H) are representatives of three independent experiments. Scale bars, 500 µm (D–F and H).
-
Figure 4—source data 1
Statistical data for Figure 4G–H.
- https://cdn.elifesciences.org/articles/79768/elife-79768-fig4-data1-v2.xlsx
-
Figure 4—source data 2
Raw gel image of Figure 4B.
- https://cdn.elifesciences.org/articles/79768/elife-79768-fig4-data2-v2.zip
-
Figure 4—source data 3
Uncropped gel image of Figure 4B with labels.
- https://cdn.elifesciences.org/articles/79768/elife-79768-fig4-data3-v2.zip
-
Figure 4—source data 4
Raw gel image of Figure 4C.
- https://cdn.elifesciences.org/articles/79768/elife-79768-fig4-data4-v2.zip
-
Figure 4—source data 5
Uncropped gel image of Figure 4C with labels-1.
- https://cdn.elifesciences.org/articles/79768/elife-79768-fig4-data5-v2.zip
-
Figure 4—source data 6
Uncropped gel image of Figure 4C with labels-2.
- https://cdn.elifesciences.org/articles/79768/elife-79768-fig4-data6-v2.zip
-
Figure 4—source data 7
Uncropped gel image of Figure 4C with labels-3.
- https://cdn.elifesciences.org/articles/79768/elife-79768-fig4-data7-v2.zip
-
Figure 4—source data 8
Uncropped gel image of Figure 4C with labels-4.
- https://cdn.elifesciences.org/articles/79768/elife-79768-fig4-data8-v2.zip
Figure 4—figure supplement 1
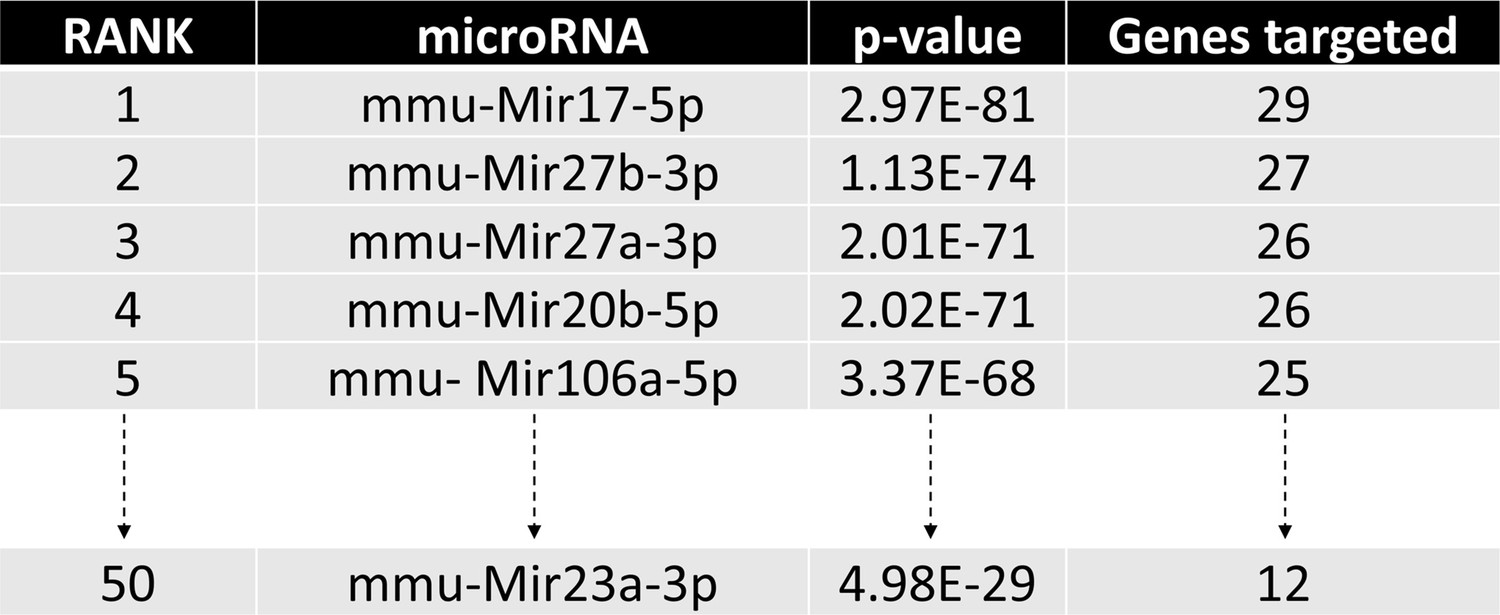
Identification of miRNA candidates in osteoclast differentiation pathway.
The diagram illustrates the top candidates identified by the miRPath Reverse-Search module based on the target accumulation in osteoclast differentiation-related genes in the Kyoto Encyclopedia of Genes ad Genomics (KEGG: mmu04380).
Figure 4—figure supplement 2
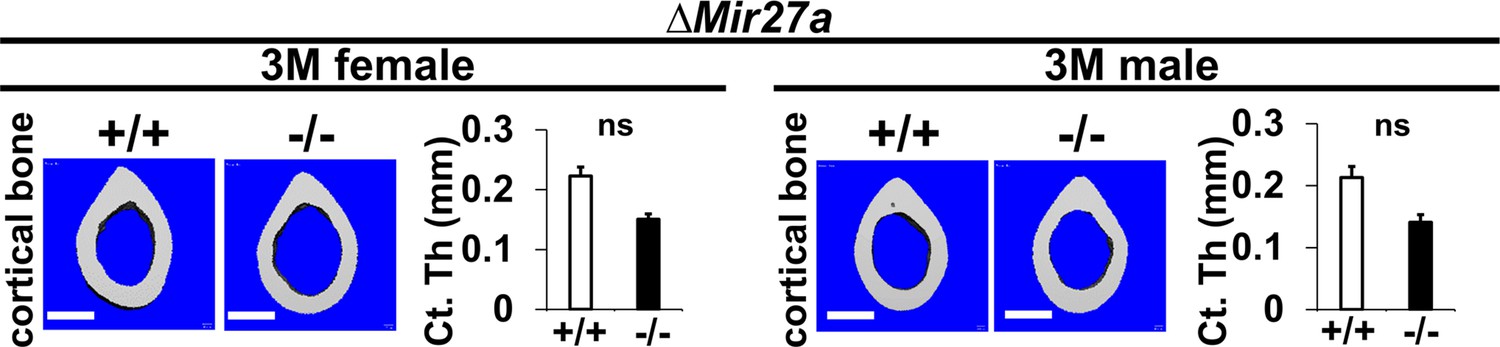
The loss of MIR27a does not affect cortical bone thickness.
Femurs of the 3-month-old (3 M) and ∆Mir27a males and females were analyzed by μCT scanning. Images show the reconstructed cortical bone of wild-type (+/+) and mutant (–/–). Quantitative analyses of cortical (Ct.) thickness (Th) are shown in graphs (n=5 for females and n=4 for males, mean + SD; student t-test, ns, non-significant). Images are representatives of five independent experiments. Scale bars, 500 µm.
-
Figure 4—figure supplement 2—source data 1
Statistical data for Figure 4—figure supplement 1.
- https://cdn.elifesciences.org/articles/79768/elife-79768-fig4-figsupp2-data1-v2.xlsx
Figure 5 with 3 supplements
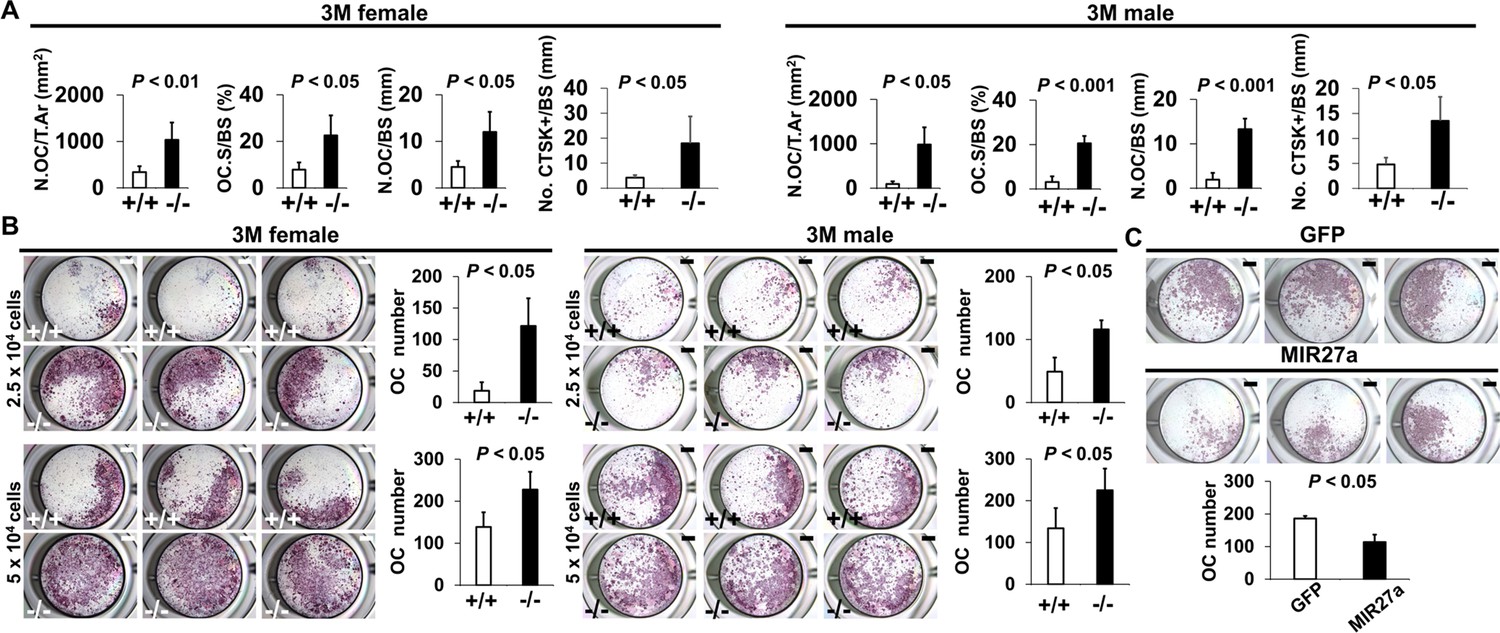
MIR27a is necessary and sufficient to repress osteoclast (OC) differentiation.
(A) Graphs show quantitative analyses of tartrate-resistant acid phosphatase (TRAP)+ and CTST + cells in the wild-type (+/+) and mutant (−/−) distal femurs detected in the stained section of the 3-month-old (3 M) ∆Mir27a males and females (n=5 for female and n=4 for male, mean ± SD; student t-test). Histomorphometric parameters of bone resorption are evaluated by the number of OC/bone area (N.OC/T.Ar), OC surface/bone surface (OC.S/BS), OC number/bone surface (N.OC/BS), and CTSK + cells/bone surface (No. CTSK+/BS). (B) Cells isolated from the wild-type (+/+) and mutant (−/−) bone marrows were induced for OC differentiation with RANLK and MCSF for 5 days (top, 2.5×10⁴ cells/well and bottom, 5×10⁴ cells/well). Graphs indicate the number of TRAP+ OC cells (n=3, mean ± SD; student t-test). (C) Cells isolated from the bone marrow were seeded (5×10⁴ cells/well) and induced for OC differentiation using RANLK and MCSF for 5 days with the lentivirus-mediated expression of green fluorescent protein(GFP) (control) or MIR27a. The TRAP+ OC cell number is significantly decreased in the MIR27 overexpression cultures (n=3, p<0.05, mean ± SD; student t-test). Scale bars, 1 mm (B and C).
-
Figure 5—source data 1
Statistical data for Figure 5.
- https://cdn.elifesciences.org/articles/79768/elife-79768-fig5-data1-v2.xlsx
Figure 5—figure supplement 1
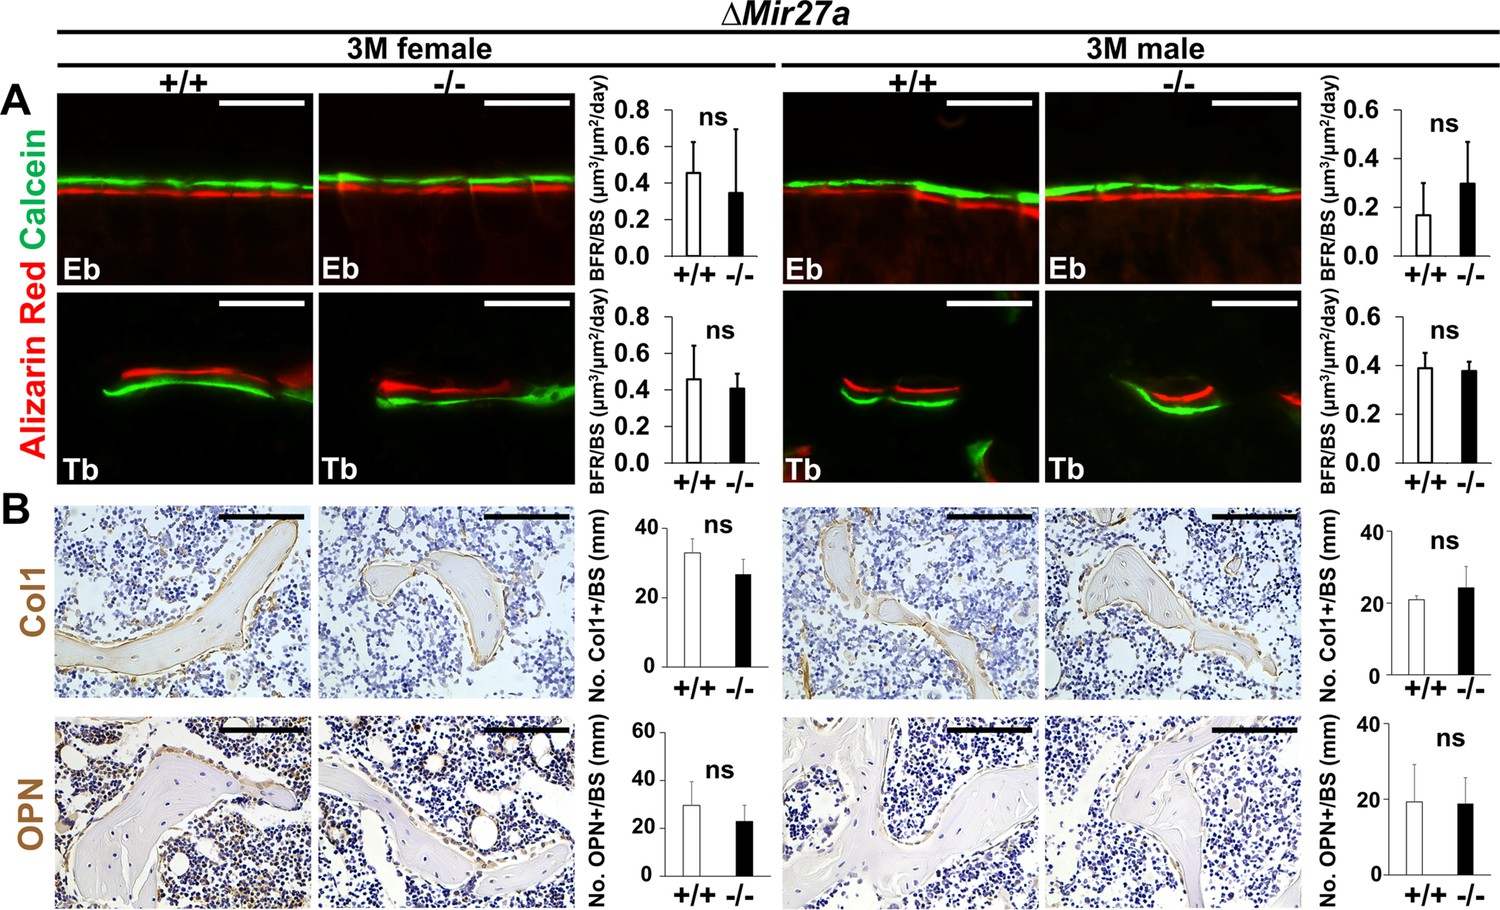
Bone formation and osteoblastogenesis are not affected by the ∆Mir27a deletion.
Sections of the 3-month-old (3 M) ∆Mir27a males and females were analyzed by (A) double labeling of alizarin red and calcein, and (B) immunostaining of type 1 collagen (Col1) and Osteopontin (OPN). Quantitative analyses of (A) bone formation rate per bone surface (BFR/BS, n=3, mean + SD; student t-test) and (B) number of positively stained cells over the bone surface (No. +/BS, n=5 for female and n=4 for male, mean + SD; student t-test, ns, non-significant) in the wild-type (+/+) and mutant (–/–) distal femurs are shown in graphs. Eb, endosteal; Tb, trabecular. Images are representatives of three independent experiments. Scale bar, 100 µm.
-
Figure 5—figure supplement 1—source data 1
Statistical data for Figure 5—figure supplement 1.
- https://cdn.elifesciences.org/articles/79768/elife-79768-fig5-figsupp1-data1-v2.xlsx
Figure 5—figure supplement 2
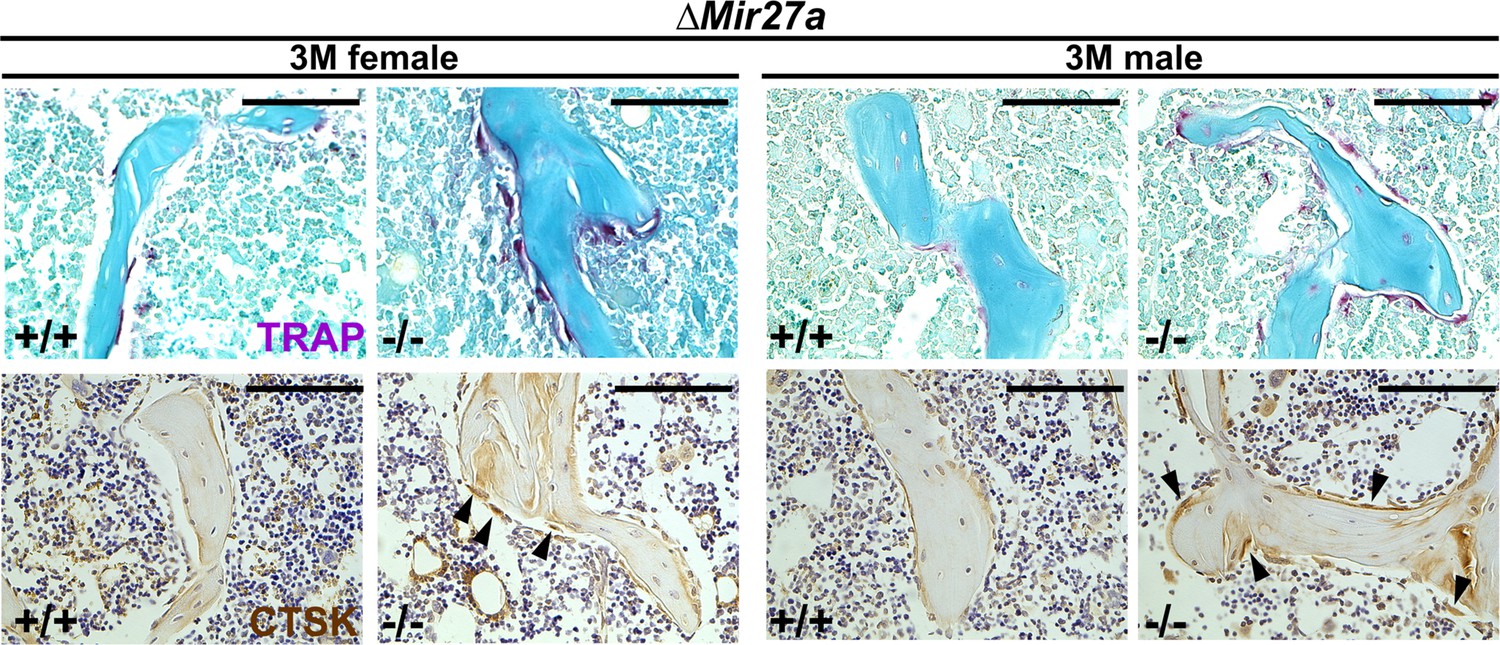
Enhanced osteoclastogenesis in the ∆Mir27a mice.
Sections of the 3-month-old (3 M) ∆Mir27a males and females were analyzed by tartrate-resistant acid phosphatase (TRAP) staining and immunostaining of Cathepsin K (CTSK). Arrowheads indicate differentiated osteoclast cells positive for TRAP and CTSK. Images are representatives of five independent experiments. Scale bars, 100 µm.
Figure 5—figure supplement 3
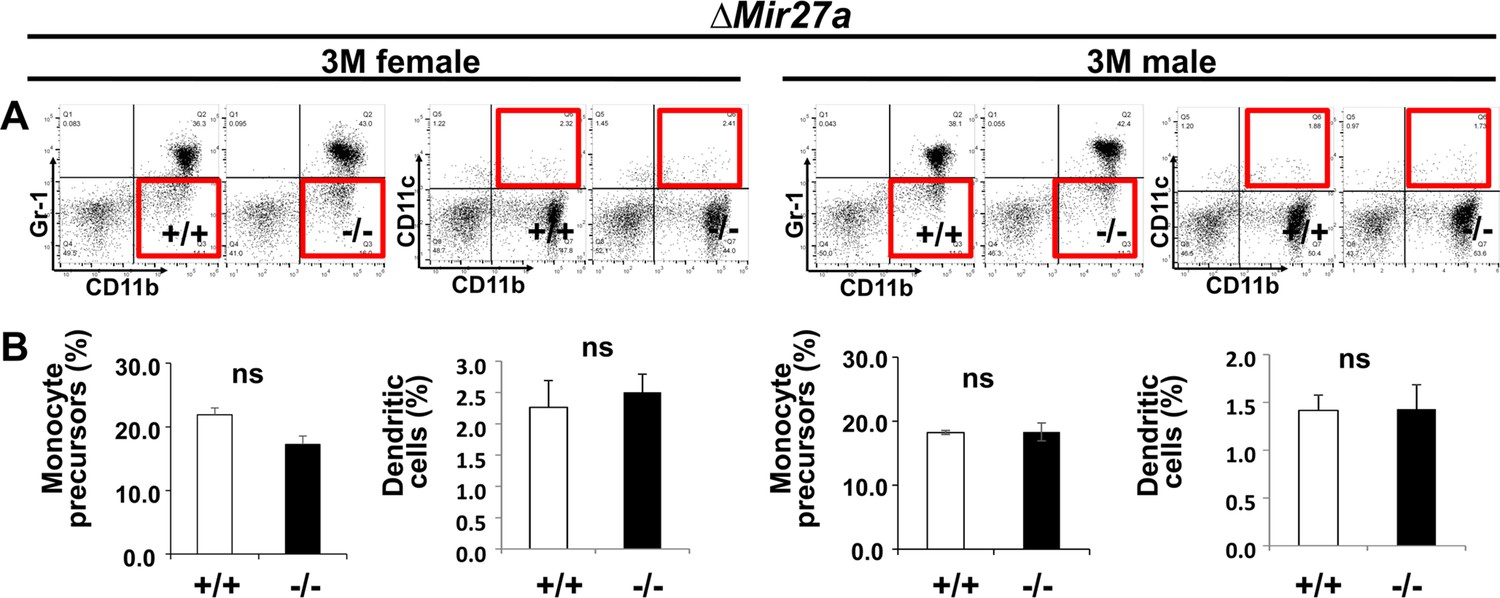
Osteoclast precursor populations are not affected by the loss of MIR27a.
(A) FACS analysis examines the CD11b+/Gr-1– and CD11b+/CD11c+ populations for monocyte precursors and dendritic cells, respectively. Images are representatives of three independent experiments. (B) No significant difference in the bone marrow of 3-month-old (3 M) wild-type (+/+) and ∆Mir23a~27 a (–/–) mice (n=3, mean + SD; student t-test).
-
Figure 5—figure supplement 3—source data 1
Statistical data for Figure 5—figure supplement 3.
- https://cdn.elifesciences.org/articles/79768/elife-79768-fig5-figsupp3-data1-v2.xlsx
Figure 6 with 1 supplement
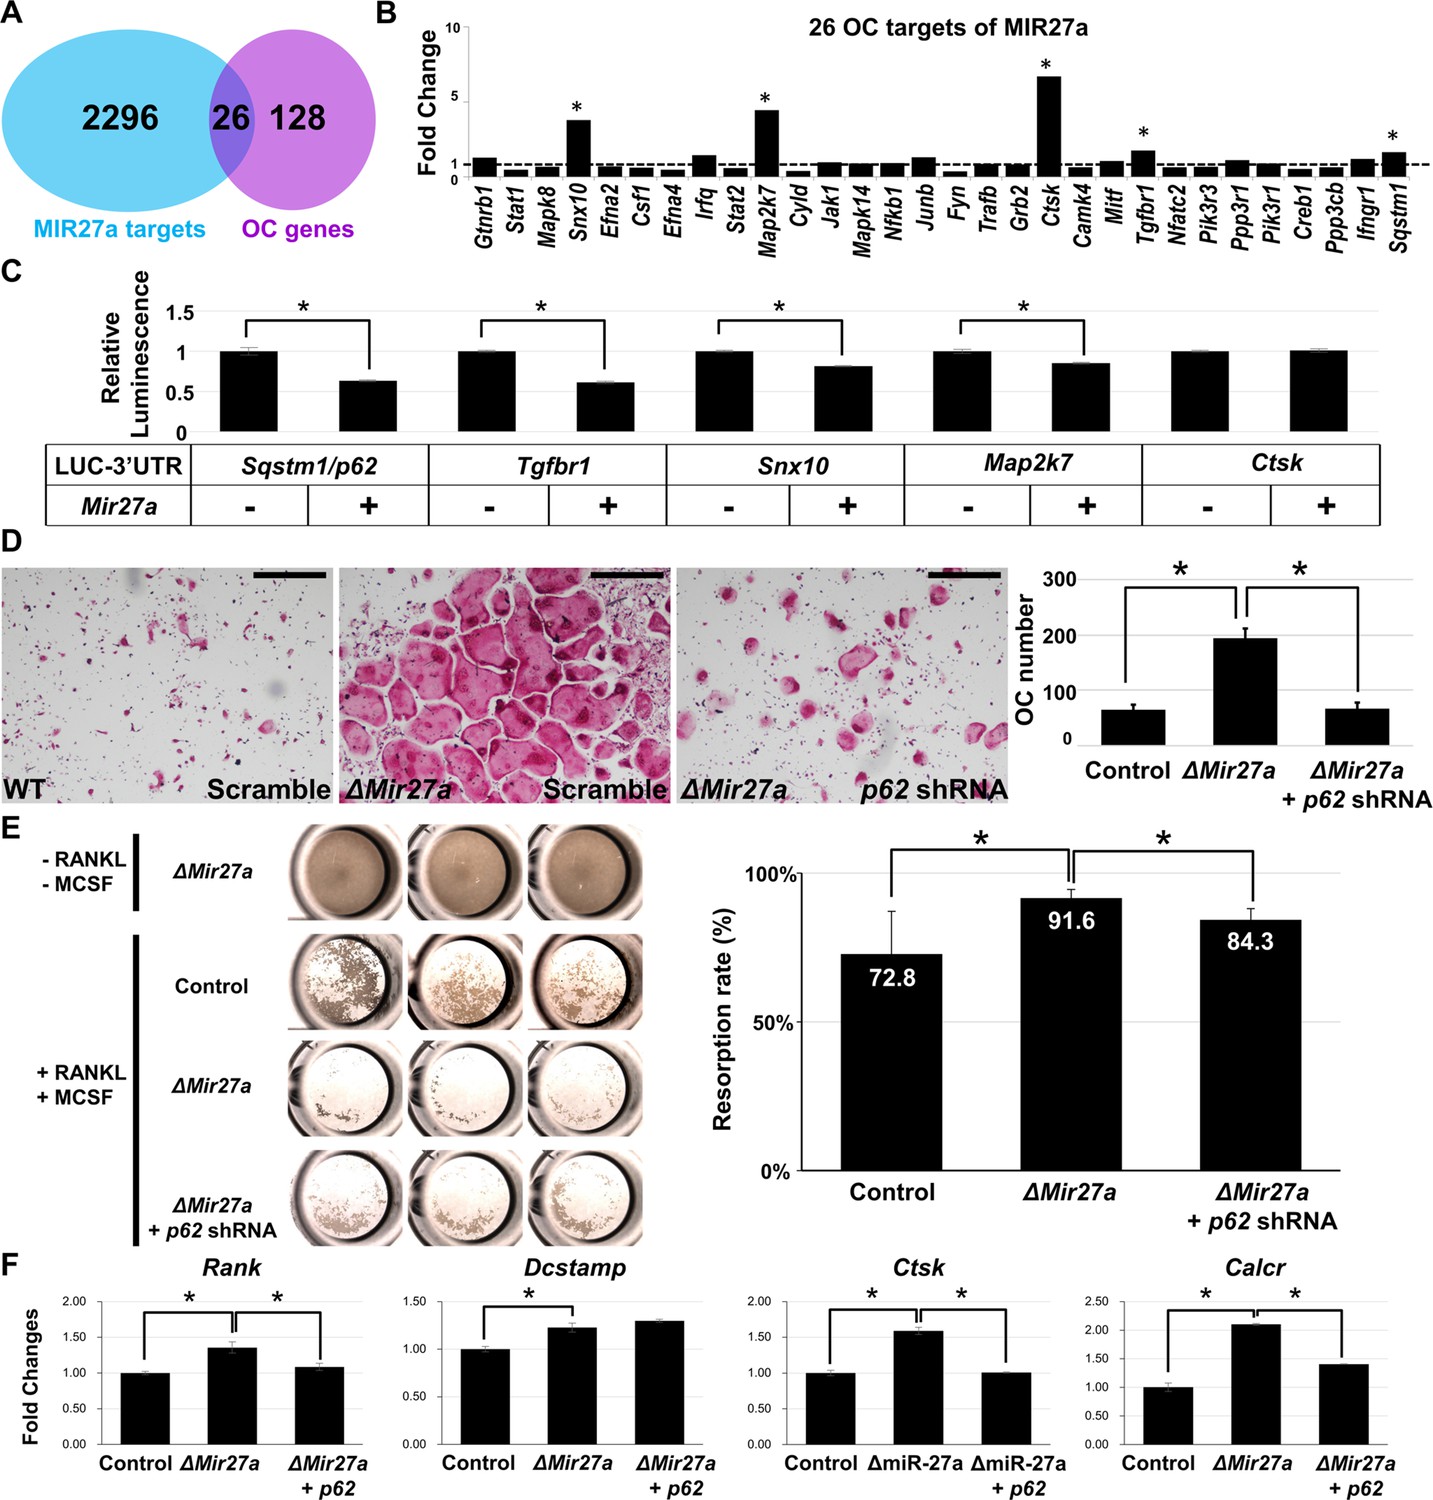
MIR27a-dependent regulation of osteoclast (OC) differentiation is mediated through p62 modulation.
(A) Venn diagrams illustrate our strategy to identify the OC differentiation-associated genes (KEGG: mmu04380) that are directly regulated by MIR27a. (B) The 26 potential targets are examined by quantitative RT-PCR (qRT-PCR) analysis to detect the change of transcript levels in wild-type and ∆Mir27a OC cells (n=3; *, p-value<0.05, two-sided student’s t-test). (C) The 3’UTR-reporter assay examines five potential genes that are direct targets of MIR27a (n=3; *, p-value <0.01, means ± SD, two-sided student’s t-test). (D) A functional study of Sqstm1 also known as p62 reveals the enhancement of OC differentiation caused by the loss of miR-27a is alleviated by lentiviral-shRNA-mediated knockdown. Tartrate-resistant acid phosphatase (TRAP) staining examines the number of mature OC cells in the control, ∆Mir27a, and ∆Mir27a plus shRNA-mediated knockdown of p62 (∆Mir27a+p62 shRNA) cultures (n=3; *, p-value<0.05, means ± SD, two-sided student’s t-test). (E) Pit assay examined OC cells-mediated bone resorption rate of control, ∆Mir27a, ∆Mir27a plus shRNA-mediated p62 knockdown 5 days after differentiation (n=3; *, p-value<0.05, mean ± SD, two-sided student t-test). OC progenitors isolated from ∆Mir27a mice were cultured without RANKL and MCSF as negative control (Top raw). (F) qRT-PCR examined the expression of OC markers after 3 days (Rank and Dcstamp) or 7 days (Ctsk and Calcr) culture of the control, ∆Mir27a, and ∆Mir27a plus shRNA-mediated knockdown of p62 OC cells (n=3; *, p-value<0.05, mean ± SD, student t-test). Scale bars, 500 µm.
-
Figure 6—source data 1
Statistical data for Figure 6.
- https://cdn.elifesciences.org/articles/79768/elife-79768-fig6-data1-v2.xlsx
-
Figure 6—source data 2
MIR27a targets.
- https://cdn.elifesciences.org/articles/79768/elife-79768-fig6-data2-v2.pdf
Figure 6—figure supplement 1
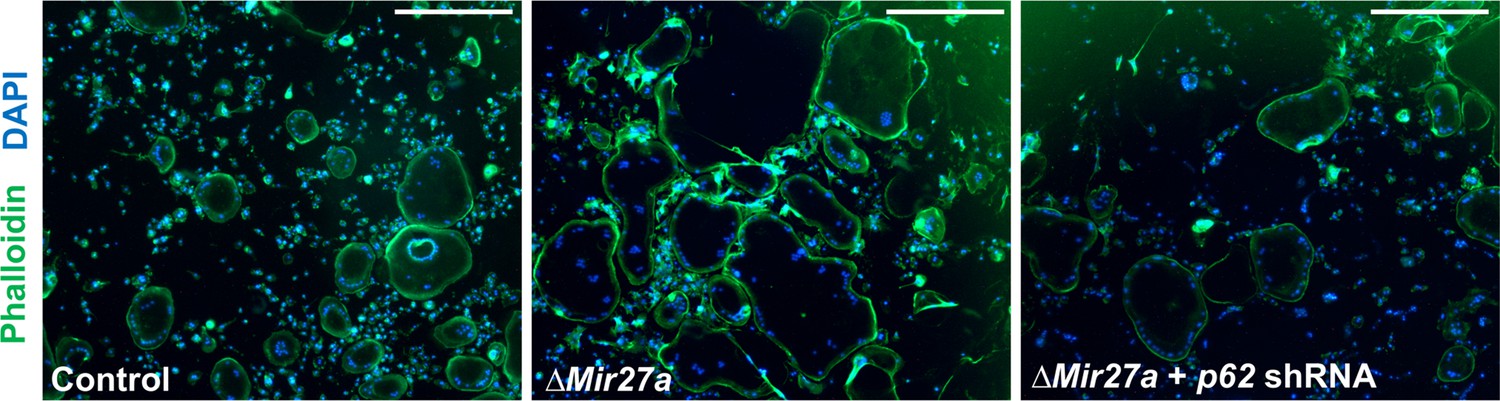
No effect of actin ring formation by the loss of MIR27a in osteoclast (OC) cells.
The actin ring formation in the OC cells of control, ΔMir27a, and ΔMir27a plus shRNA-mediated p62 knockdown is examined by phalloidin staining after 5 days of differentiation with RANKL and MCSF. Scale bars, 500 µm.
Additional files
-
Supplementary file 1
Primers for RT-PCR analysis of MIR23a~27a ~24–2.
- https://cdn.elifesciences.org/articles/79768/elife-79768-supp1-v2.docx
-
MDAR checklist
- https://cdn.elifesciences.org/articles/79768/elife-79768-mdarchecklist1-v2.docx
Download links
A two-part list of links to download the article, or parts of the article, in various formats.
Downloads (link to download the article as PDF)
Open citations (links to open the citations from this article in various online reference manager services)
Cite this article (links to download the citations from this article in formats compatible with various reference manager tools)
miRNA-27a is essential for bone remodeling by modulating p62-mediated osteoclast signaling
eLife 12:e79768.
https://doi.org/10.7554/eLife.79768


