Adiposity may confound the association between vitamin D and disease risk – a lifecourse Mendelian randomization study
- MRC Integrative Epidemiology Unit (IEU), Population Health Sciences, Bristol Medical School, University of Bristol, United Kingdom
Figures
Figure 1
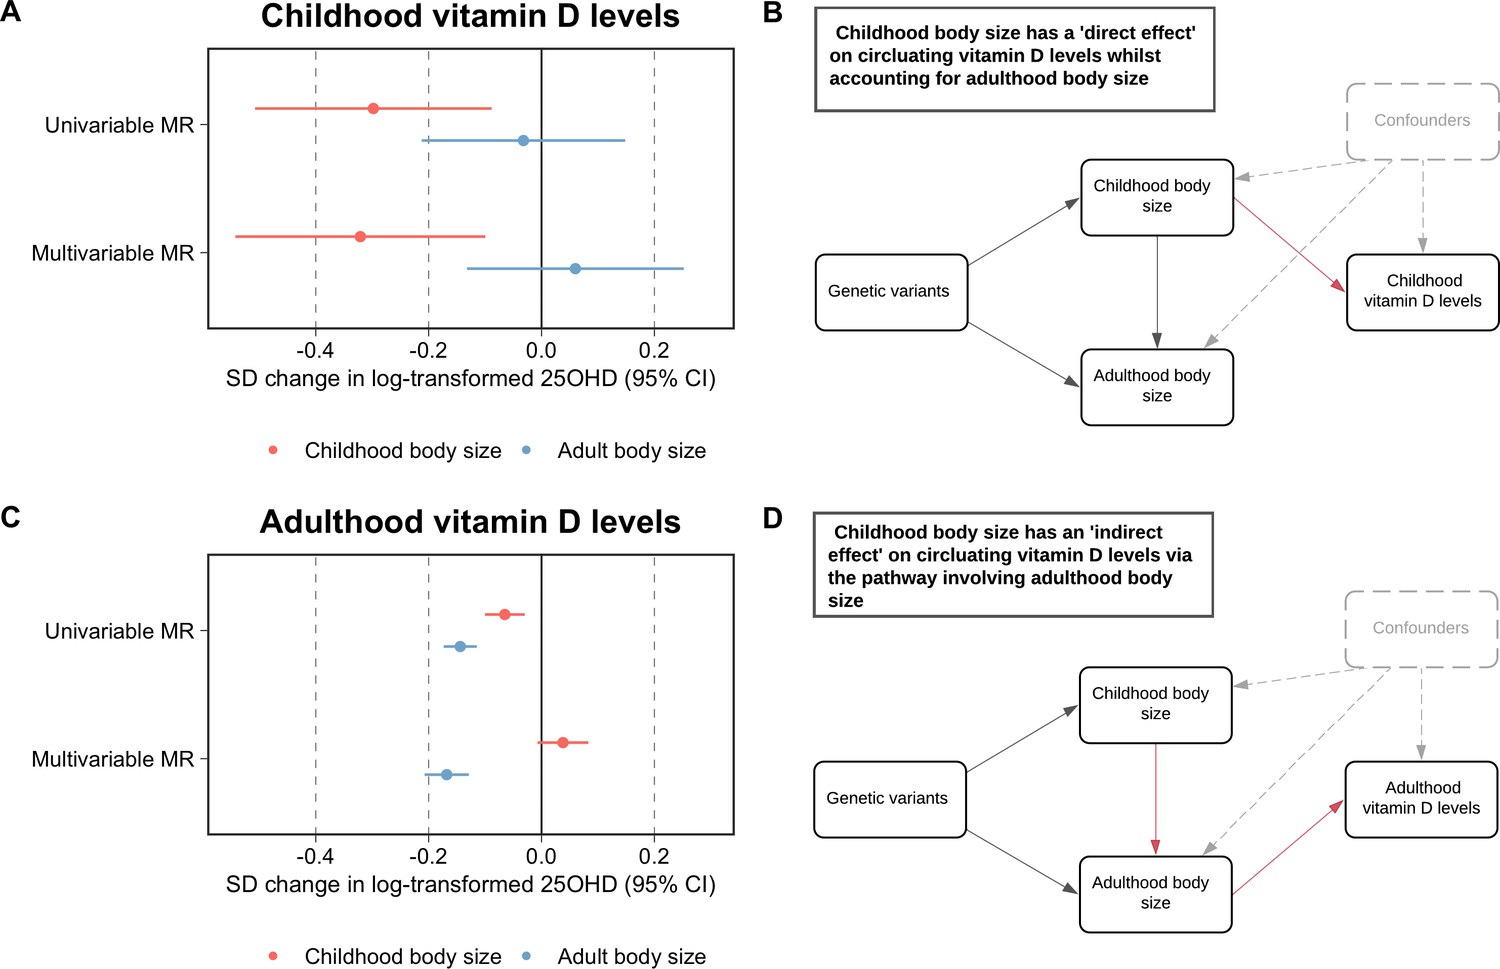
Forest plots and schematic diagrams depicting the findings from this study.
(A) A forest plot illustrating the direct effect of childhood body size on circulating vitamin D levels measured during childhood (mean age: 9.9 years, n=3,800 participants) using data from the Avon Longitudinal Study of Parents and Children (ALSPAC) with the corresponding schematic diagram for this finding being located in panel (B). (C) A forest plot depicting the indirect effect of childhood body size on adulthood measured vitamin D levels using data from the UK Biobank study (mean age: 56.5 years, n=401,460 participants) as described in the schematic diagram presented in panel (D). MR – Mendelian randomization. All estimates underlying the forest plots can be found in Supplementary file 1.
Additional files
-
Supplementary file 1
Tables with Mendelian randomization estimates supporting the conclusions of this study.
Table 1 includes univariable Mendelian randomization estimates between lifecourse adiposity and vitamin D levels, Table 2 includes multivariable Mendelian randomization estimates between lifecourse adiposity and vitamin D levels, and Table 3 includes repeated analyses using vitamin D estimates from the study by Revez et al.
- https://cdn.elifesciences.org/articles/79798/elife-79798-supp1-v1.xlsx
-
MDAR checklist
- https://cdn.elifesciences.org/articles/79798/elife-79798-mdarchecklist1-v1.docx
Download links
A two-part list of links to download the article, or parts of the article, in various formats.
Downloads (link to download the article as PDF)
Open citations (links to open the citations from this article in various online reference manager services)
Cite this article (links to download the citations from this article in formats compatible with various reference manager tools)
Adiposity may confound the association between vitamin D and disease risk – a lifecourse Mendelian randomization study
eLife 11:e79798.
https://doi.org/10.7554/eLife.79798


