Neuroinflammation in neuronopathic Gaucher disease: Role of microglia and NK cells, biomarkers, and response to substrate reduction therapy
- Department of Internal Medicine, Yale School of Medicine, United States
- Translational Sciences, Sanofi, United States
- Yale Center for Genome Analysis, Yale School of Medicine, United States
- Department of Neuroscience, Yale School of Medicine, United States
- Department of Molecular & Cellular Physiology, Yale School of Medicine, United States
Figures
Figure 1 with 2 supplements
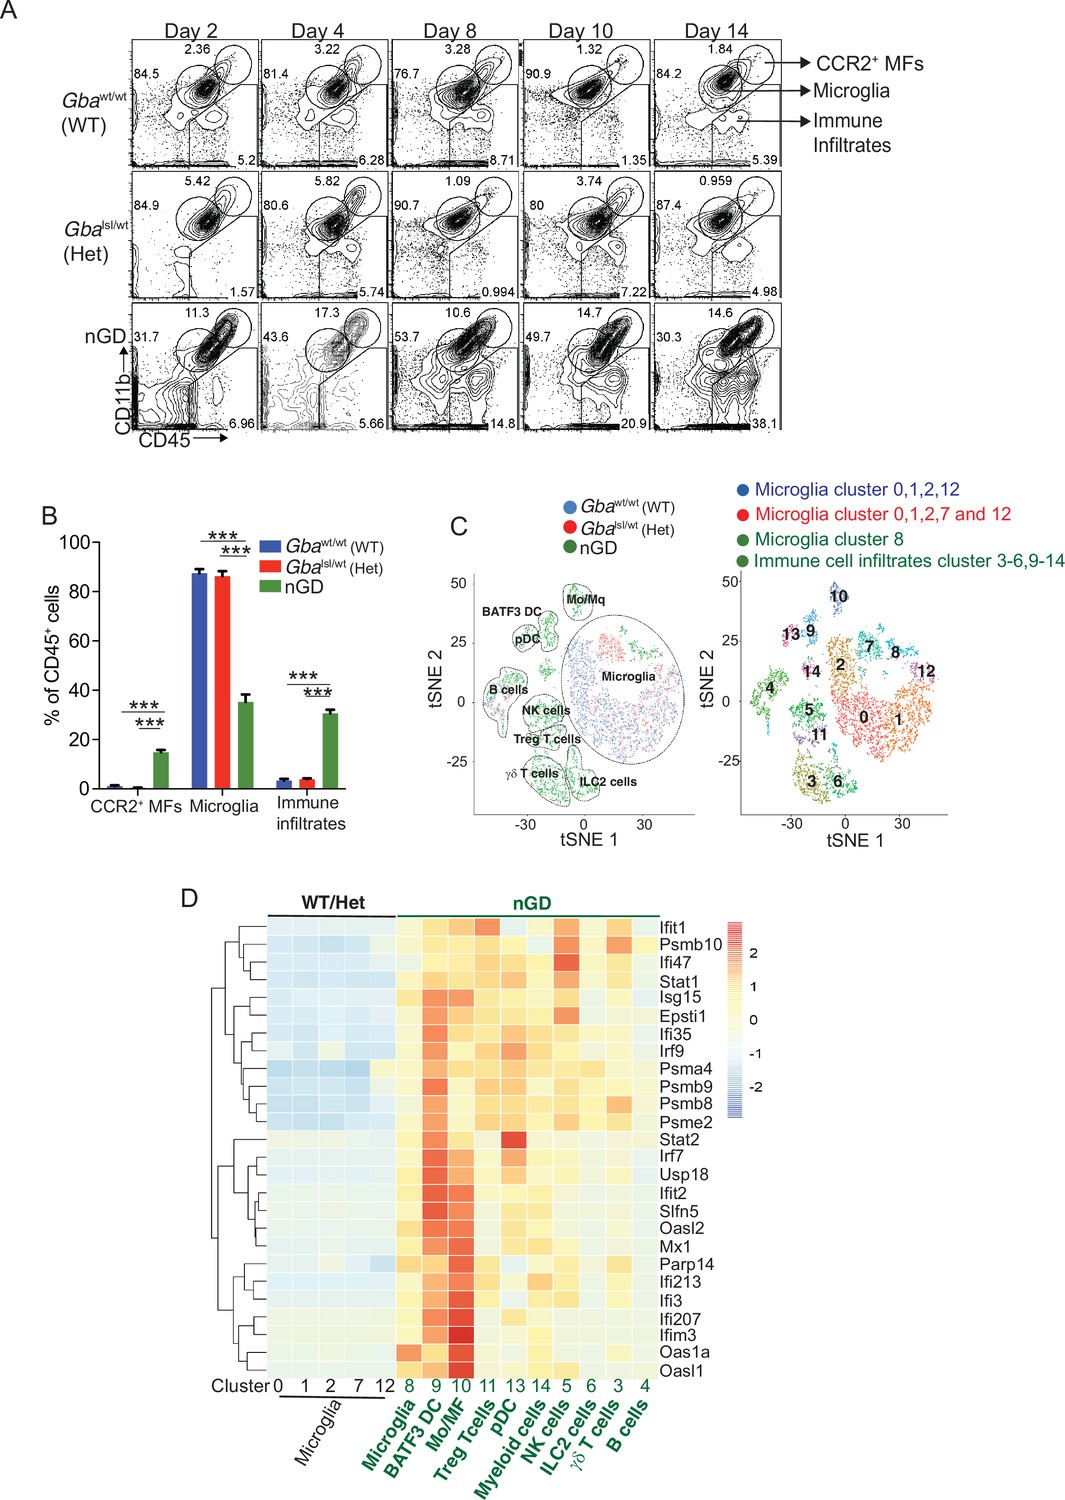
Loss of Gba induces microglial activation and immune cell infiltration in neuronopathic Gaucher disease (nGD) brain.
(A) Fluorescence-activated cell sorting (FACS) analysis of the whole brain of Gbawt/wt, Gbalsl/wt, and nGD (Gbalsl/lsl) mice performed at indicated days. The gates indicate cell populations revealed by CD11b and CD45 expression: CCR2+ MFs (CD11bhiCD45+), microglia (CD11bloCD45+), and immune infiltrates (CD11bloCD45hi). The data is representative of three independent experiments. (B) Bar graph compares percentage of CCR2+ MFS, microglia, and immune infiltrates between Gbawt/wt, Gbalnl/wt, and nGD mice brain (n = 6–8 mice/group); statistical significance was determined using t-test with using Bonferroni–Dunn correction for multiple comparisons (***p<0.0001). (C) t-distributed stochastic neighbor embedding (t-SNE) plot depicting different microglial and non-microglial cell subsets. The clusters are coded based on their mice affiliation (on left). In total, 14 clusters containing 6 microglia clusters and 9 clusters of immune cells (on right). (D) Hierarchical clustering of differentially expressed genes associated with type 1 IFN genes from nGD mice vs. the control mice. p<0.05 was considered significant (two-sided t-tests). All individual type 1 IFN genes with significant differential expression are listed on right. Error bars represent means ± SEM; p-values were calculated with Welch’s test (**p<0.001 and ***p<0.0001).
Figure 1—figure supplement 1
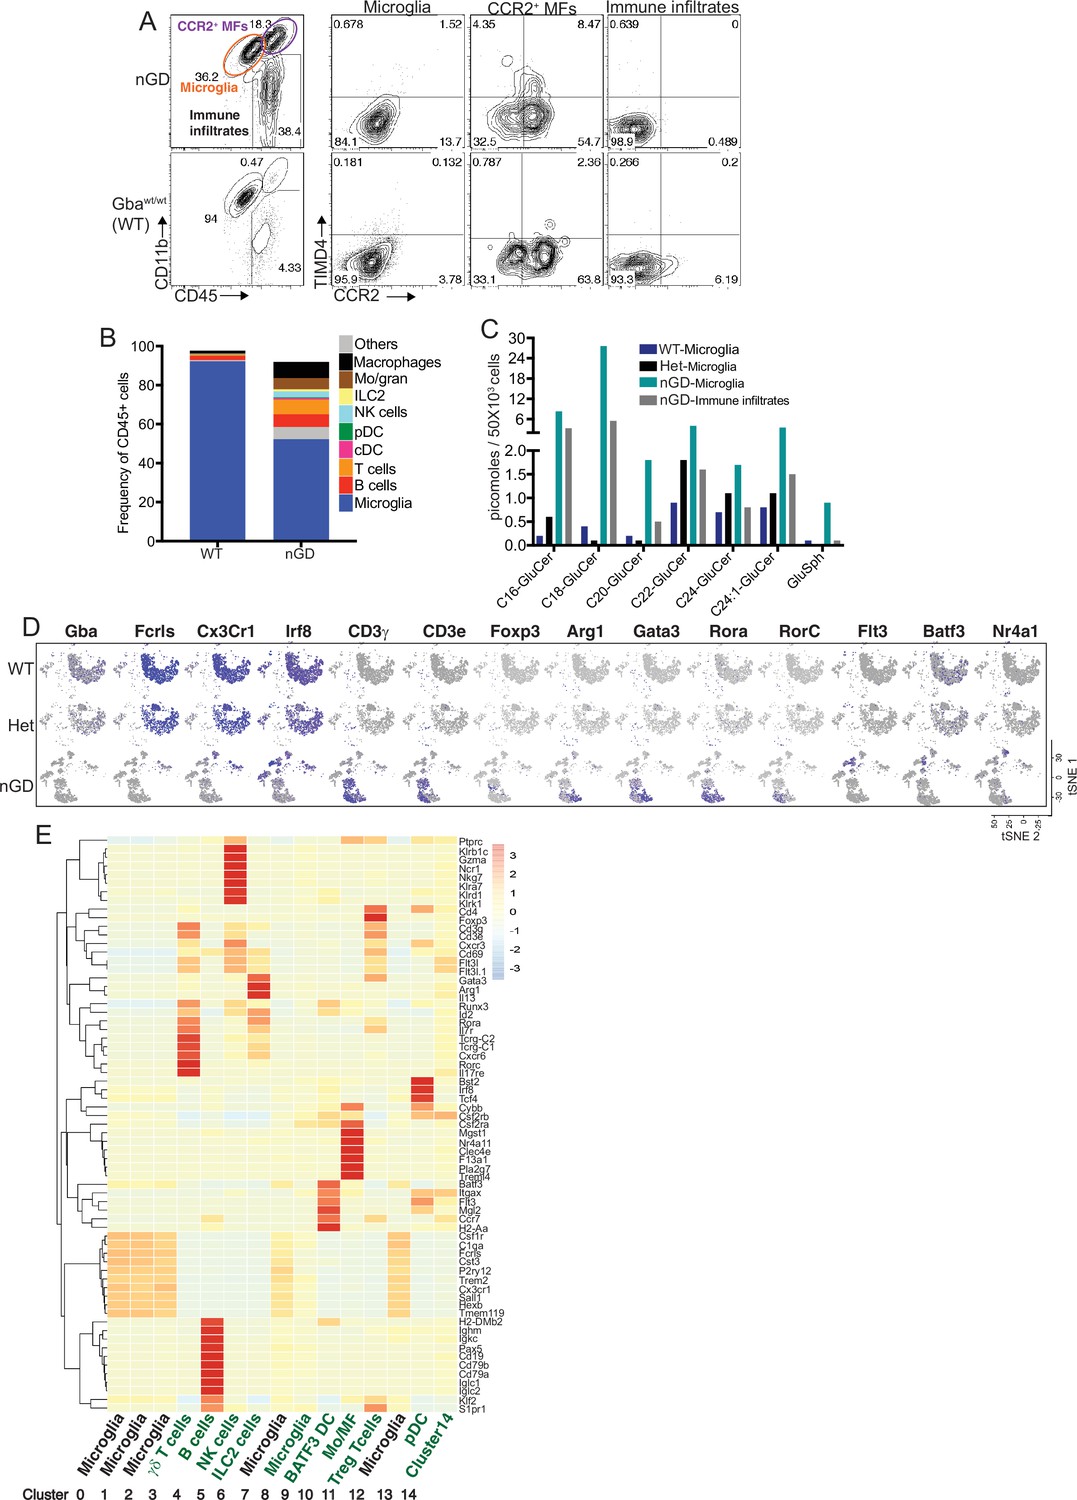
Loss of Gba disrupts microglial homeostasis and induces damage-associated microglia (DAM) phenotype and immune cell infiltration in neuronopathic Gaucher disease (nGD) (Gbalsl/lsl) brain.
(A) Representative fluorescence-activated cell sorting (FACS) plot showing CCR2+ MFs, microglia, and immune infiltrates in the whole brain of nGD vs. control mice brain. (B) Bar graph shows the frequency of different immune cells (denoted on right) in the immune infiltrates obtained from neuronopathic GD (nGD; Gbalsl/lsl) and control mice brain, respectively. (C) Bar graph shows quantitative analysis of total glucosylceramide (GluCer) species and glucosylsphingosine (GlcSph) levels by LC-ESI-MS/MS in flow-sorted microglia cells obtained from Gbawt/wt, Gbalsl/wt, and nGD brains and on immune infiltrates isolated from nGD brain. (D) t-distributed stochastic neighbor embedding (t-SNE) plot demonstrating annotations of different clusters identified using expression of signature genes. (E) Hierarchical heat map representing the differentially expressed genes in each identified cluster.
Figure 1—figure supplement 2
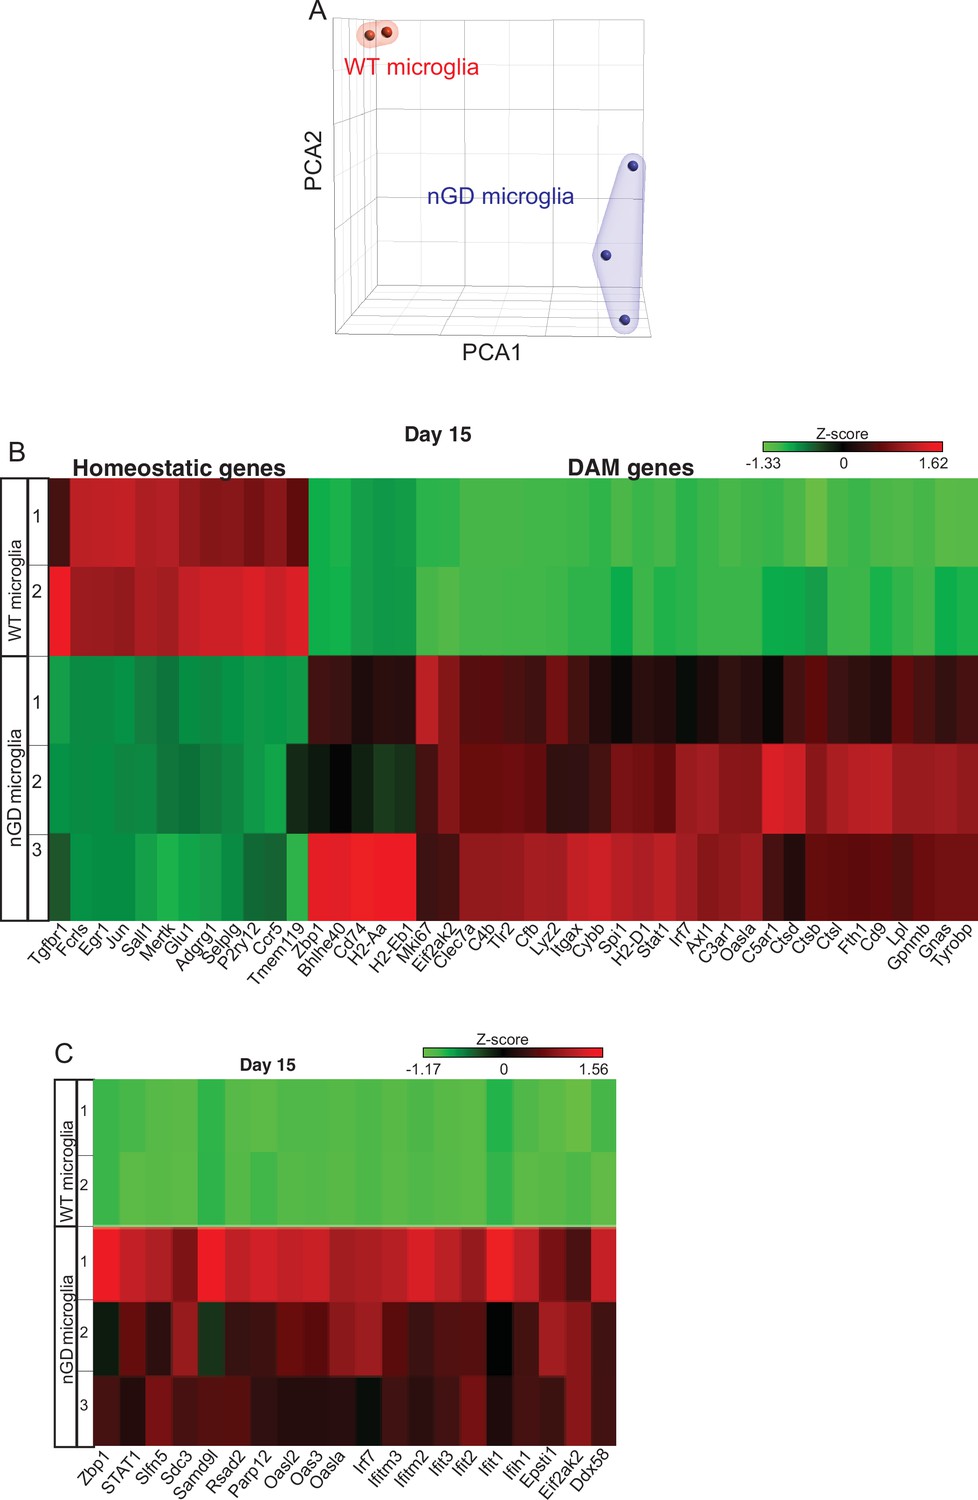
Total RNA-seq analysis performed on flow-sorted microglia in neuronopathic Gaucher disease (nGD) (Gbalsl/lsl) and wild-type mice.
(A) Principal component analysis of gene expression profiles of microglia isolated from nGD brain and their controls. Each point represents a single mouse. (B) A heat map showing the differential expression of homeostatic and disease-associated microglial (DAM) genes in isolated microglia from nGD and control mice brain, respectively. (C) A heat map of interferon signature genes (ISG) genes in isolated microglia from nGD and control mice brain, respectively. Colors indicate upregulated (red) and downregulated genes (green).
Figure 2 with 2 supplements
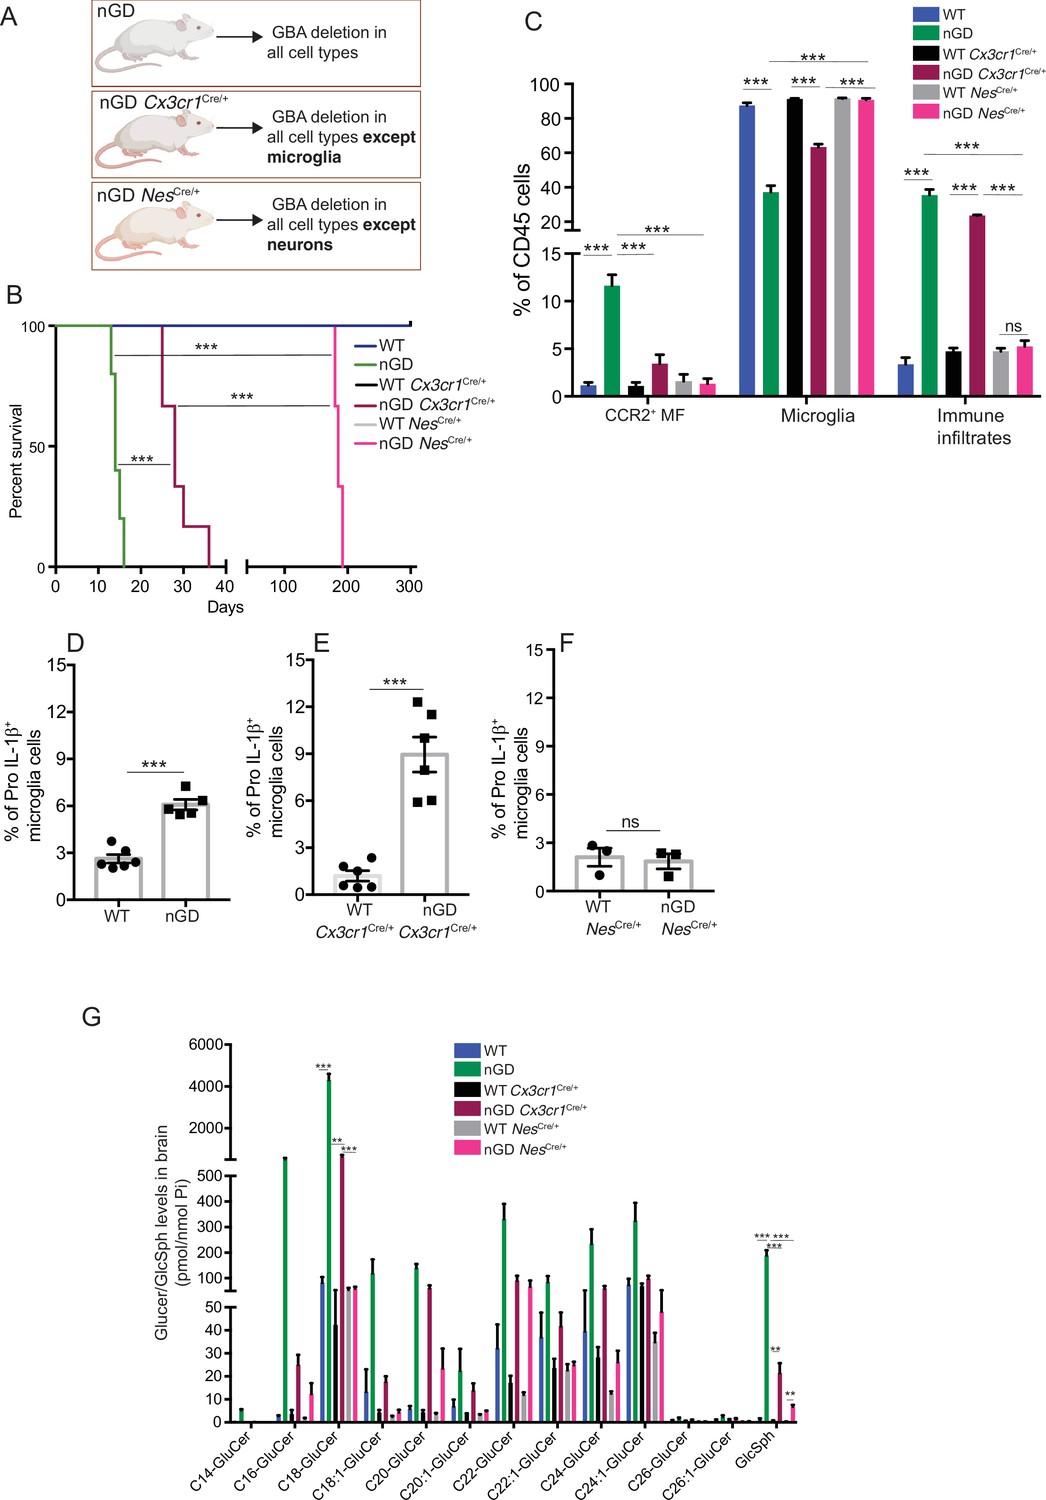
Gba deficiency in neurons aid in microglial activation and immune cell infiltration.
(A) Schematic showing overview of the mouse models and methods used in the study. (B) Kaplan–Meier survival analysis of neuronopathic Gaucher disease (nGD), nGD Cx3cr1Cre/+, and nGD NesCre/+ mice cohorts with their respective littermate controls (n = 5–6 mice/group) using log-rank (Mantel–Cox) test (***p<0.0001). (C) Bar graph shows comparison of percentage of CCR2+ MFs, microglia and immune infiltrates between nGD, nGD Cx3cr1Cre/+, and nGD NesCre/+ mice with littermate controls (n = 3–6 mice/group). Bar graph showing percentage of Pro-IL-1ß+ microglia cells in (D) nGD vs. control mice (n = 5–6/group), (E) nGD Cx3cr1Cre/+ vs. control mice (n = 5–6/group), and (F) nGD NesCre/+ vs. the control mice (n = 3 mice/group). (G) Quantitative analysis of total glucosylceramide (GluCer) species and glucosylsphingosine (GlcSph) levels by LC-ESI-MS/MS in nGD, nGD Cx3cr1Cre/+ mice, and nGD NesCre/+ mice brain compared with the control mice (n = 4–8 mice/group). (C–G) show representative data from two independent experiments using controls. Means ± SEM are shown. Unpaired t-test, two-tailed was used to test significance. *p<0.05, **p<0.001, and ***p<0.0001.
Figure 2—figure supplement 1
Restoring Gba function in microglia and neurons enhances neuronopathic Gaucher disease (nGD) mice survival.
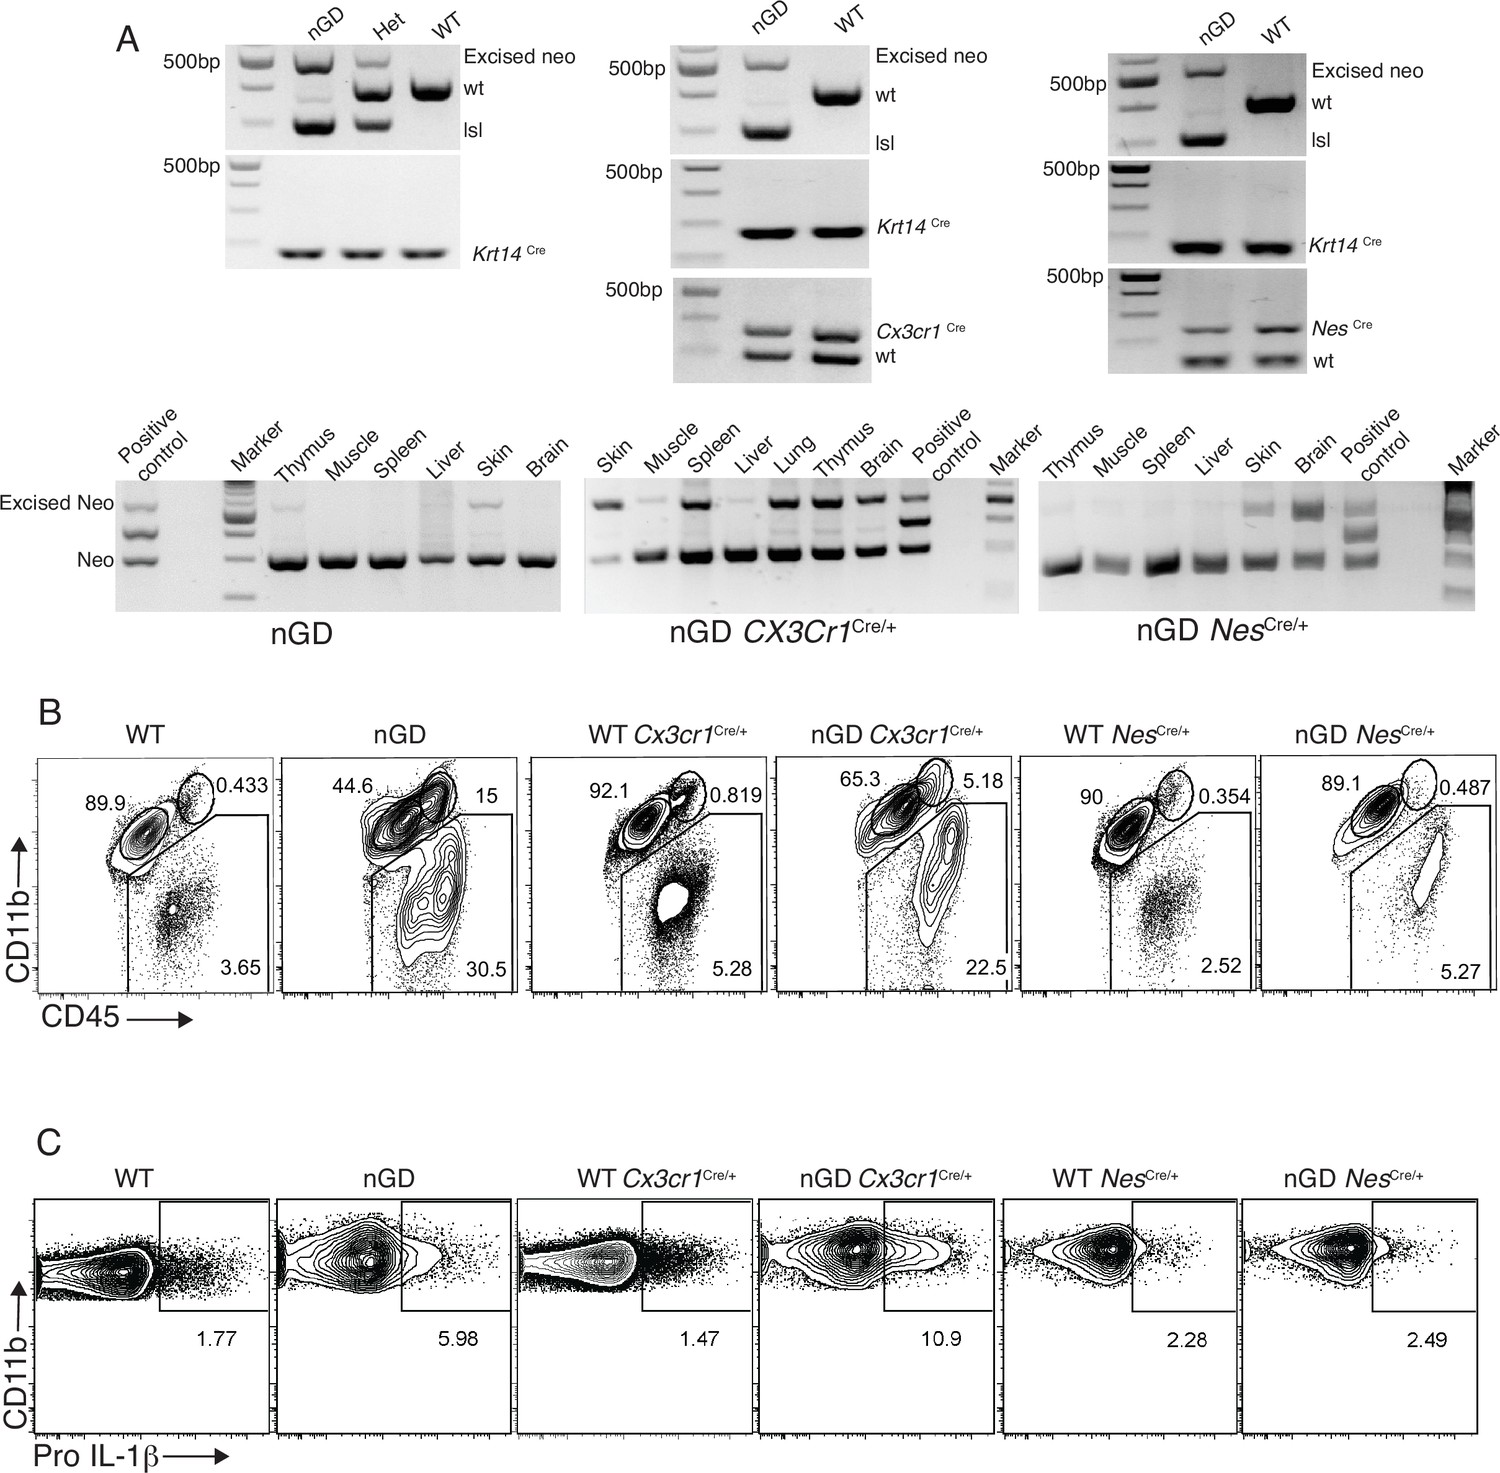
(A) Splicing of mRNA causes GBA1 deficiency in nGD mice. K14-mediated expression of Cre enabled removal of the lsl (lox-stop-lox) cassette in the skin tissue of the nGD mice (left and bottom panels), Cx3cr1Cre enabled removal of the lsl cassette in different tissues (middle and bottom panels), and Nestin Cre enabled removal of the lsl cassette in brain (right and bottom panels). (B) Representative fluorescence-activated cell sorting (FACS) plot showing CCR2+ MFs, microglia, and immune infiltrates in the whole brain of nGD, nGD Cx3cr1Cre/+, and nGD NesCre/+ mice vs. control mice brain. (C) Representative intracellular staining for Pro-IL-1ß expression in microglia isolated from nGD, nGD Cx3cr1Cre/+, and nGD NesCre/+ and control mice analyzed by FACS.
-
Figure 2—figure supplement 1—source data 1
Gel image showing genotype of neuronopathic Gaucher disease (nGD), Het, and wild-type (wt).
The lsl (lox-stop-lox) cassette in nGD mice (left panel) was removed through to Krt14cre expression (right panel).
- https://cdn.elifesciences.org/articles/79830/elife-79830-fig2-figsupp1-data1-v3.pdf
-
Figure 2—figure supplement 1—source data 2
Gel image showing genotype of neuronopathic Gaucher disease (nGD) Cx3cr1Cre/+ and wild-type (wt) mice.
- https://cdn.elifesciences.org/articles/79830/elife-79830-fig2-figsupp1-data2-v3.pdf
-
Figure 2—figure supplement 1—source data 3
Gel image showing genotype of nGD NesCre/+ mice and wild-type (wt) mice.
- https://cdn.elifesciences.org/articles/79830/elife-79830-fig2-figsupp1-data3-v3.pdf
-
Figure 2—figure supplement 1—source data 4
Gel image showing removal of lsl (lox-stop-lox) cassette in neuronopathic Gaucher disease (nGD) mice in various tissues due to Krt14cre expression.
- https://cdn.elifesciences.org/articles/79830/elife-79830-fig2-figsupp1-data4-v3.pdf
-
Figure 2—figure supplement 1—source data 5
Gel image showing Cx3cr1Cre enabled removal of the lsl (lox-stop-lox) cassette in different tissues of neuronopathic Gaucher disease (nGD) Cx3cr1Cre/+ mice.
- https://cdn.elifesciences.org/articles/79830/elife-79830-fig2-figsupp1-data5-v3.pdf
-
Figure 2—figure supplement 1—source data 6
Gel image showing NesCre enabled removal of the lsl (lox-stop-lox) cassette in brain of neuronopathic Gaucher disease (nGD) NesCre/+ mice.
- https://cdn.elifesciences.org/articles/79830/elife-79830-fig2-figsupp1-data6-v3.pdf
Figure 2—figure supplement 2
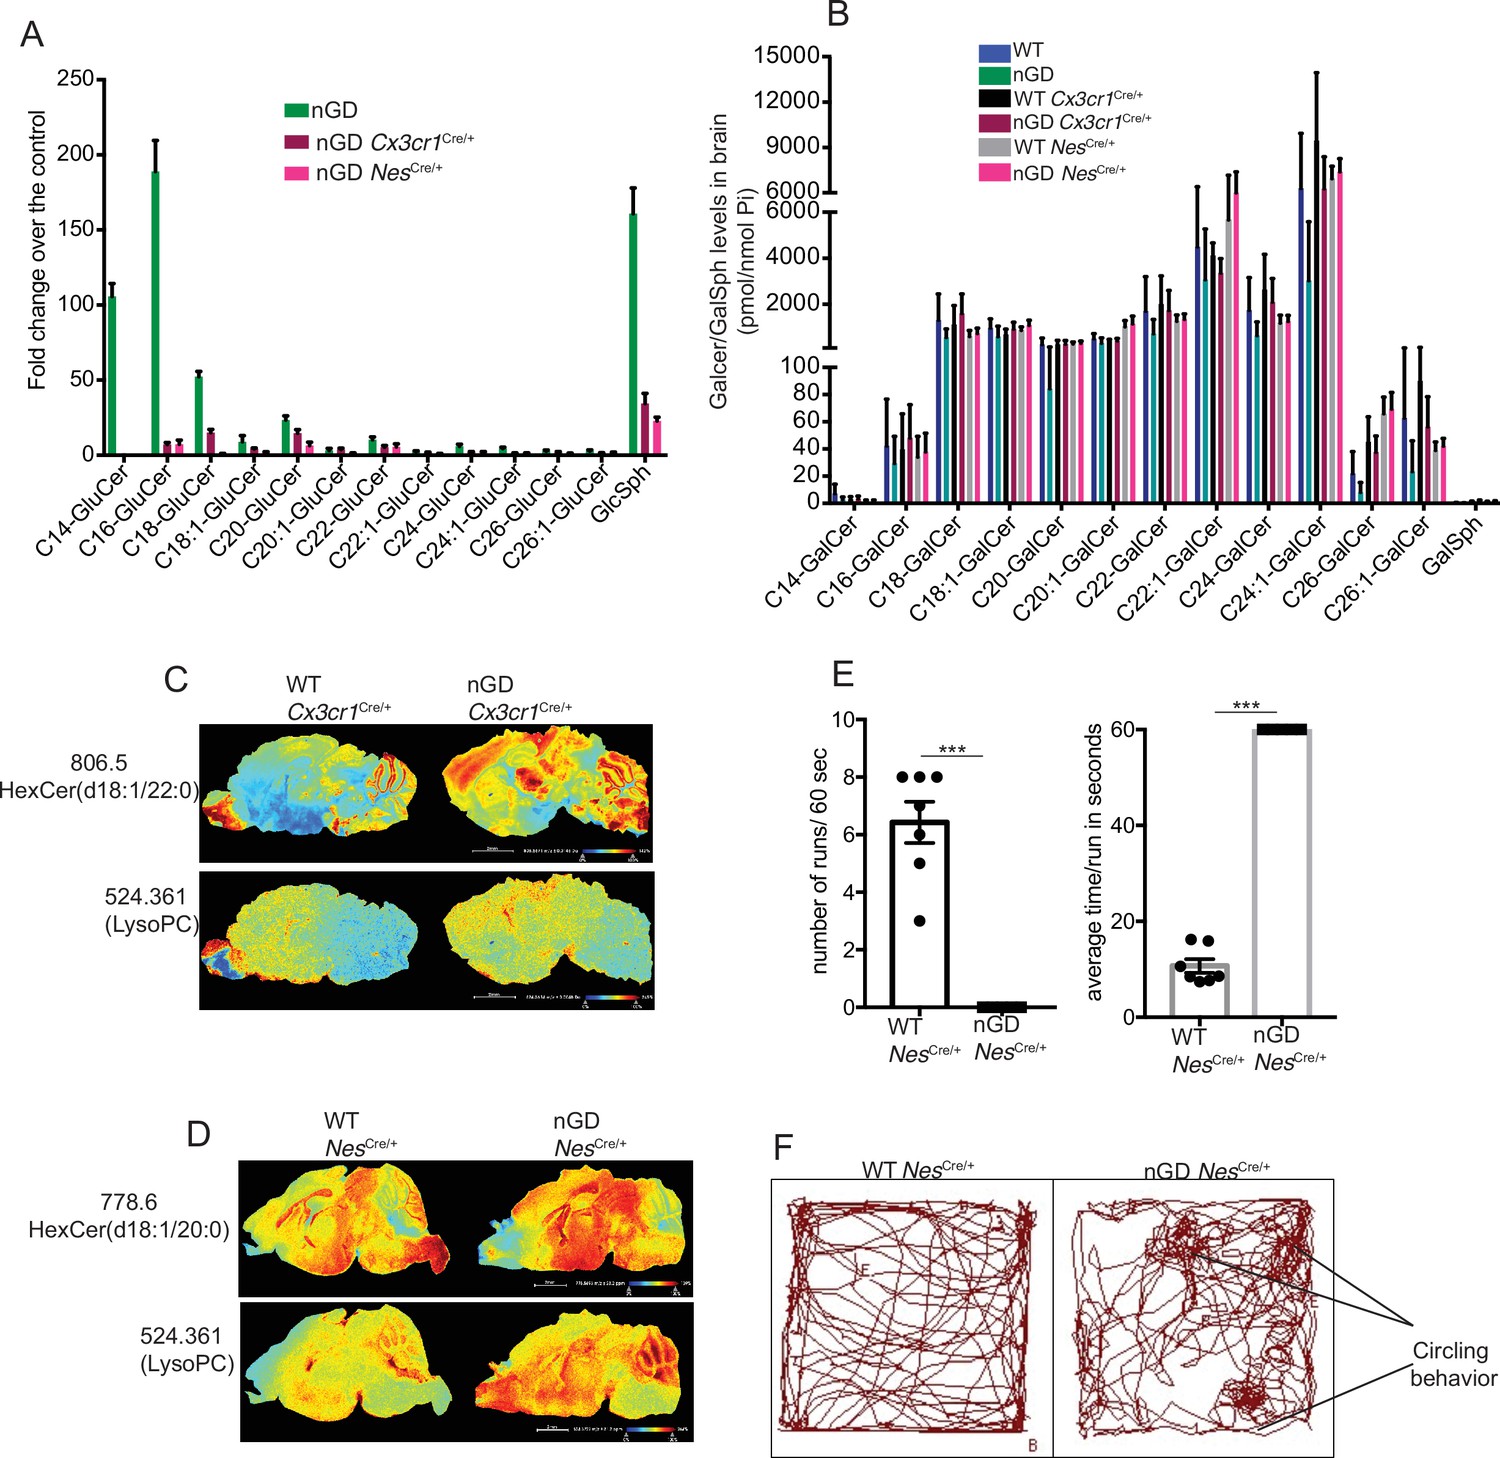
Analysis of lipids in neuronopathic Gaucher disease (nGD), nGD Cx3cr1Cre/+, and nGD NesCre/+ mice brain and behavioral studies.
(A) Fold change increase in different glucosylceramide (GluCer) and glucosylsphingosine (GlcSph) species in nGD, nGD Cx3cr1Cre/+, and nGD NesCre/+ mice over respective control mice brain. (B) Quantitative analysis of total galactosylceramide (GalCer) species and galactosylsphingosine (GalSph) levels by LC-ESI-MS/MS in nGD, nGD Cx3cr1Cre/+ mice, and nGD NesCre/+ mice brain compared with the control mice (n = 4–8 mice/group). (C) Signal intensities of HexCer species (d18:1/20:0) and LysoPC identified by MALDI across nGD Cx3cr1Cre/+ and control littermates (D) and nGD NesCre/+ mice and control mice. The color bars in MALDi images show signal intensity: blue to red indicates low to high levels. The data is representative of three independent experiments. (E) nGD NesCre/+ mice showed motor deficits in the balance beam test compared to control mice. (F) Representative track plots obtained from open-field studies show circling behavior in nGD NesCre/+ mice.
Figure 3 with 1 supplement
Aged Gbafl/flCx3cr1Cre/+ mice brain show alteration of microglia subsets and neurodegeneration.
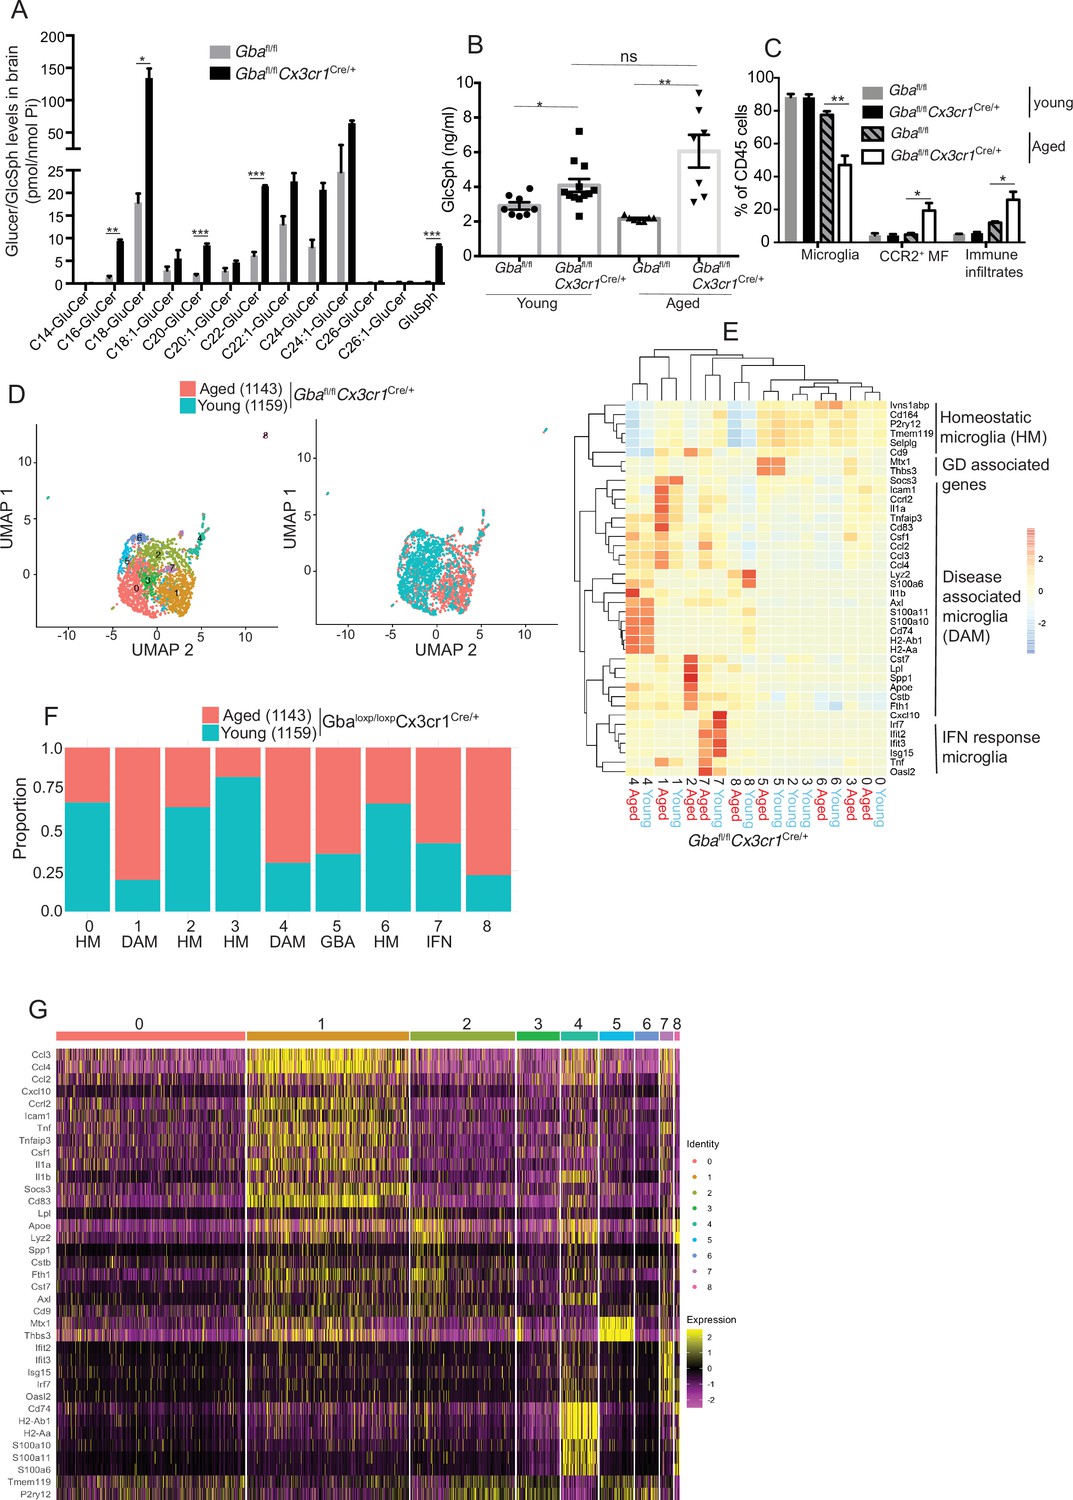
(A) Quantitative analysis of total glucosylceramide/glucosylsphingosine (GluCer/GlcSph) levels in Gbafl/flCx3cr1Cre/wt mice and control mice (n = 3 mice/group). Statistical significance was determined using t-test using Bonferroni–Dunn correction for multiple comparisons (*p<0.05, **p<0.001, and ***p<0.0001). (B) Quantitative analysis of serum GlcSph levels in young and aged Gbafl/flCx3cr1Cre/wt mice and control mice (n = 8–11 mice/group; repeated at least three times). (C) Bar graph shows comparison of percentage of CCR2+ MFs, microglia, and immune infiltrates between young and aged Gbafl/flCx3cr1Cre/wt mice and control mice (n = 3 mice/group; repeated at least three times). (D) UMAP plots show clustering of microglia from young and aged Gbafl/flCx3cr1Cre/wt mice. Cells are colored by cluster (left) and age (right). (E) Hierarchical heat map depicting differential expression of genes taken from Wang et al. and compared between microglia cluster from young and aged Gbafl/flCx3cr1Cre/wt mice. (F) Fraction of cells for each cluster present in young and aged Gbafl/flCx3cr1Cre/wt mice, respectively. (G) Gene expression heat map for clusters defined as microglia. (A, B) Data represents three biological replicates. Means ± SEM are shown. Unpaired t-test, two-tailed was used to test significance *p<0.05, **p<0.001, and ***p<0.0001.
Figure 3—figure supplement 1
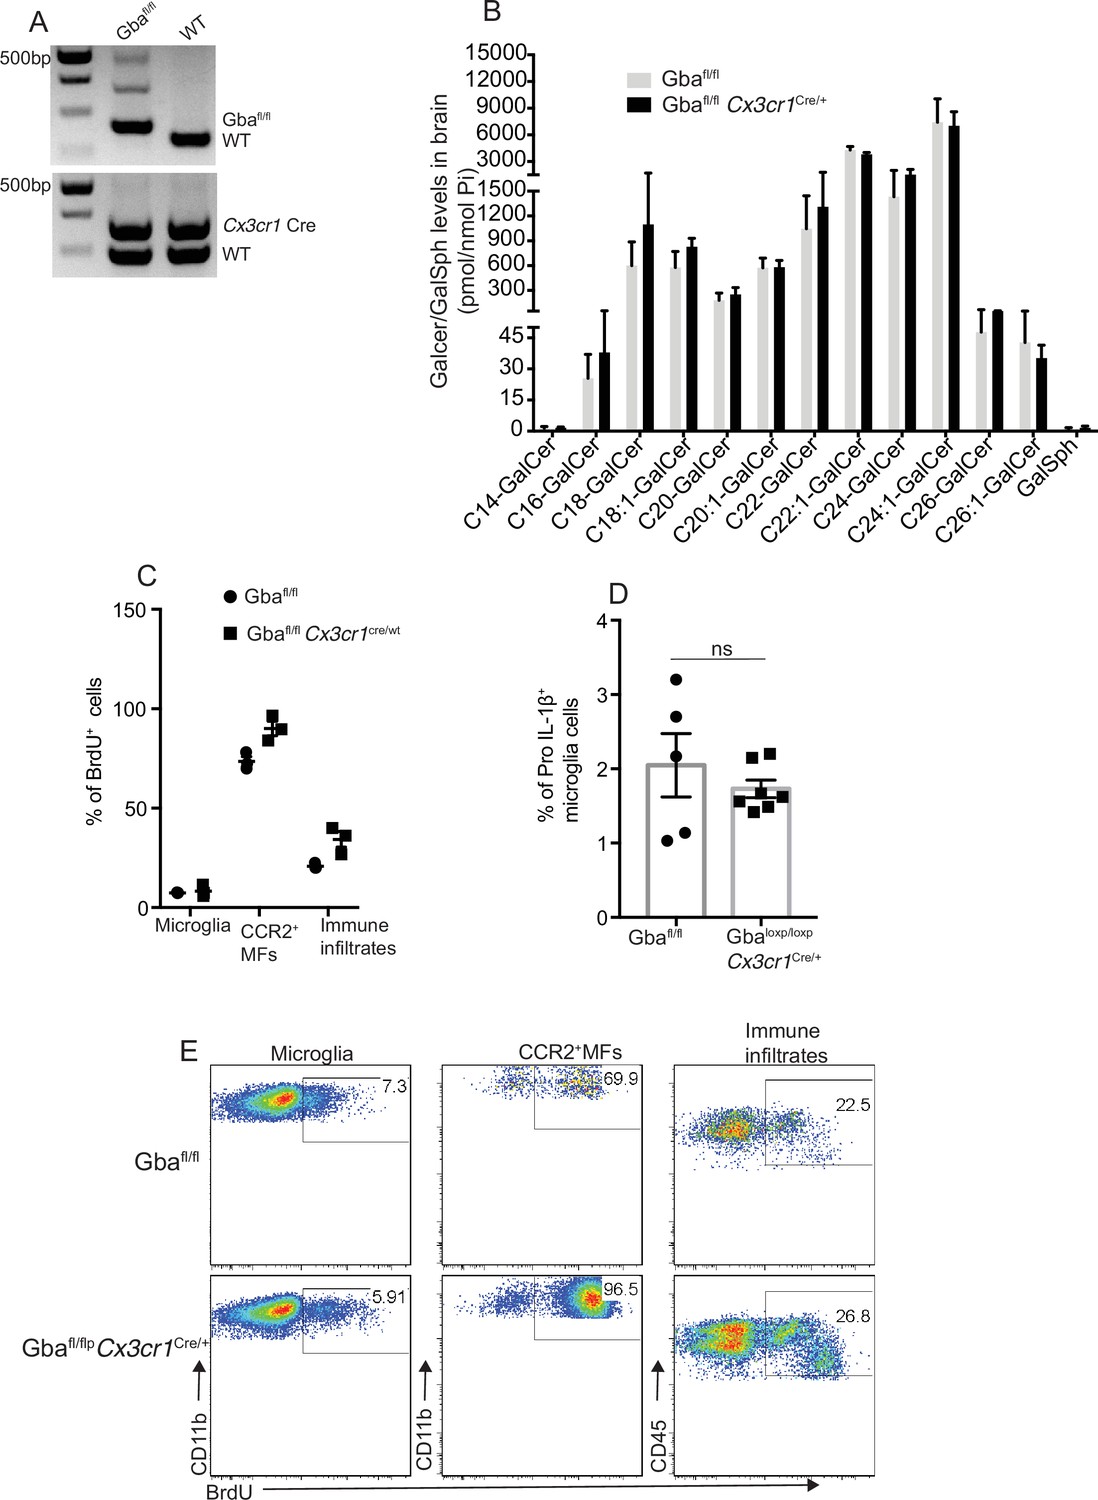
Changes in microglia subsets coupled with neurodegeneration are seen in aged Gbafl/fl Cx3cr1Cre/+ mice brain.
(A) Genotyping for Cx3cr1 cre and loxp alleles. (B) Quantitative analysis of total galactosylceramide (GalCer) species and galactosylsphingosine (GalSph) levels by LC-ESI-MS/MS in Gbafl/fl Cx3cr1Cre/+ mice brain compared with the control mice (n = 4–8 mice/group). (C) Representative plots depicting BrdU incorporation in the microglia, CCR2+ MFs and immune infiltrates isolated from Gbafl/fl Cx3cr1Cre/+ and control mice brain. (D) Comparison of percentage of BrdU + microglia, CCR2+ MFs, and immune infiltrates between Gbafl/fl Cx3cr1Cre/wt and control mice brain (n = 3 mice/group). (E) Percentage of Pro-IL-1ß+ microglia cells in control and Gbafl/fl Cx3cr1Cre/+ mice (n = 5–6 mice/group). Data represents three biological replicates. Means ± SEM are shown. Unpaired t-test, two-tailed was used to test significance *p<0.05, **p<0.001, and ***p<0.0001.
-
Figure 3—figure supplement 1—source data 1
Gel image showing genotype of Gbafl/fl Cx3cr1Cre/+ mice having conditional deletion of the Gba gene through Cx3cr1Cre expression.
- https://cdn.elifesciences.org/articles/79830/elife-79830-fig3-figsupp1-data1-v3.pdf
Figure 4 with 1 supplement
NK cell infiltration into the brain of neuronopathic Gaucher disease (nGD), nGD Cx3cr1Cre/+ mice.
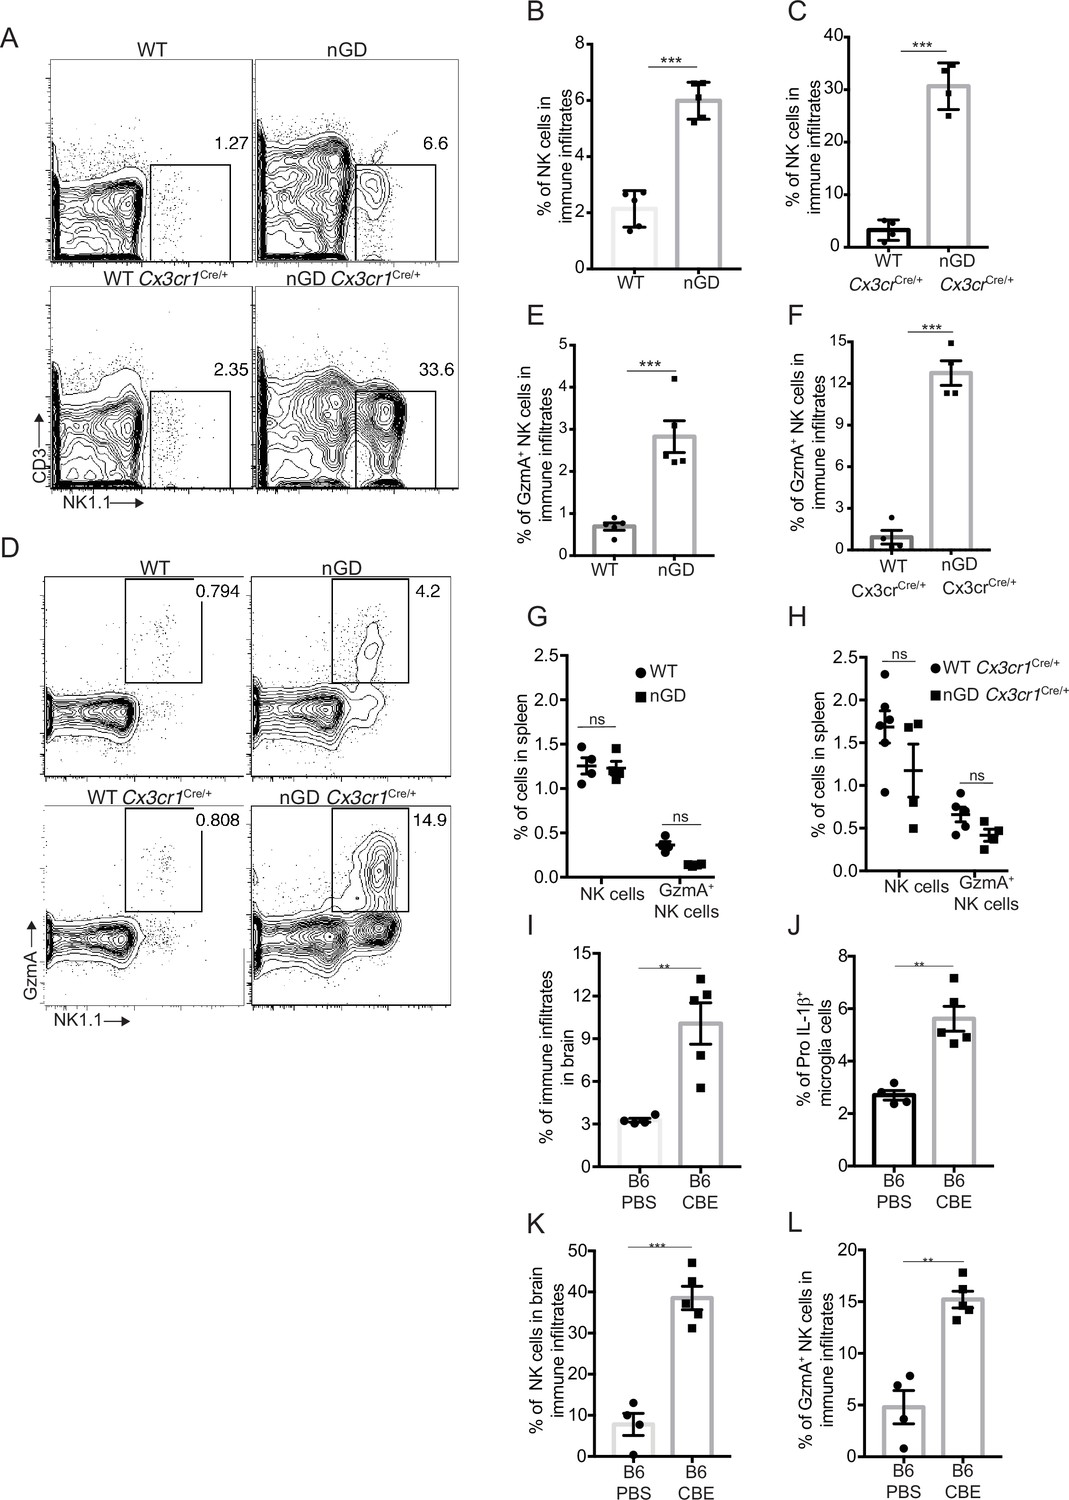
(A) CD45+ cells form the whole brain of nGD, nGD Cx3cr1Cre/+, and control mice were gated to analyze CD3-NK1.1+ NK cells. Bar graphs represent the percentage of NK cells in the immune infiltrates of (B) nGD mice brain (n = 5mice/group) and (C) nGD Cx3cr1Cre/+ mice brain, respectively (n = 4 mice/group). (D) Expression of granzyme A (GzmA) in the brain infiltrating NK cells of nGD and nGD Cx3cr1Cre/+ mice. Bar graphs compare the percentage of GzmA+ NK cells in in the immune infiltrates of (E) nGD vs. control mice brain (n = 5 mice/group) and (F) nGD Cx3cr1Cre/+ vs. control mice brain, respectively (n = 4 mice/group). Percentage of NK1.1+ NK cells and GzmA+ NK cells in the spleen of (G) nGD mice and (H) nGD Cx3cr1Cre/+ mice (n = 4–5 mice/group). Bar graph showing percentage of (I) immune infiltrates (J) Pro-IL-1ß+ microglia cells (K) percentage of NK cells and (L) GzmA+ NK cells in the whole brain of Gbawt/wt treated with vehicle or conduritol β-epoxide (CBE). Experiments were repeated thrice. (A) and (D) were representative from one of the experiments, (B), (C), (E–L) Data are combined from two such experiments. Data are shown as means ± SEM. Unpaired t-test, two-tailed was used to test significance. *p<0.05, **p<0.001, and ***p<0.0001.
Figure 4—figure supplement 1
NK cell infiltration into the brain of neuronopathic Gaucher disease (nGD), nGD Cx3cr1Cre/+ mice.
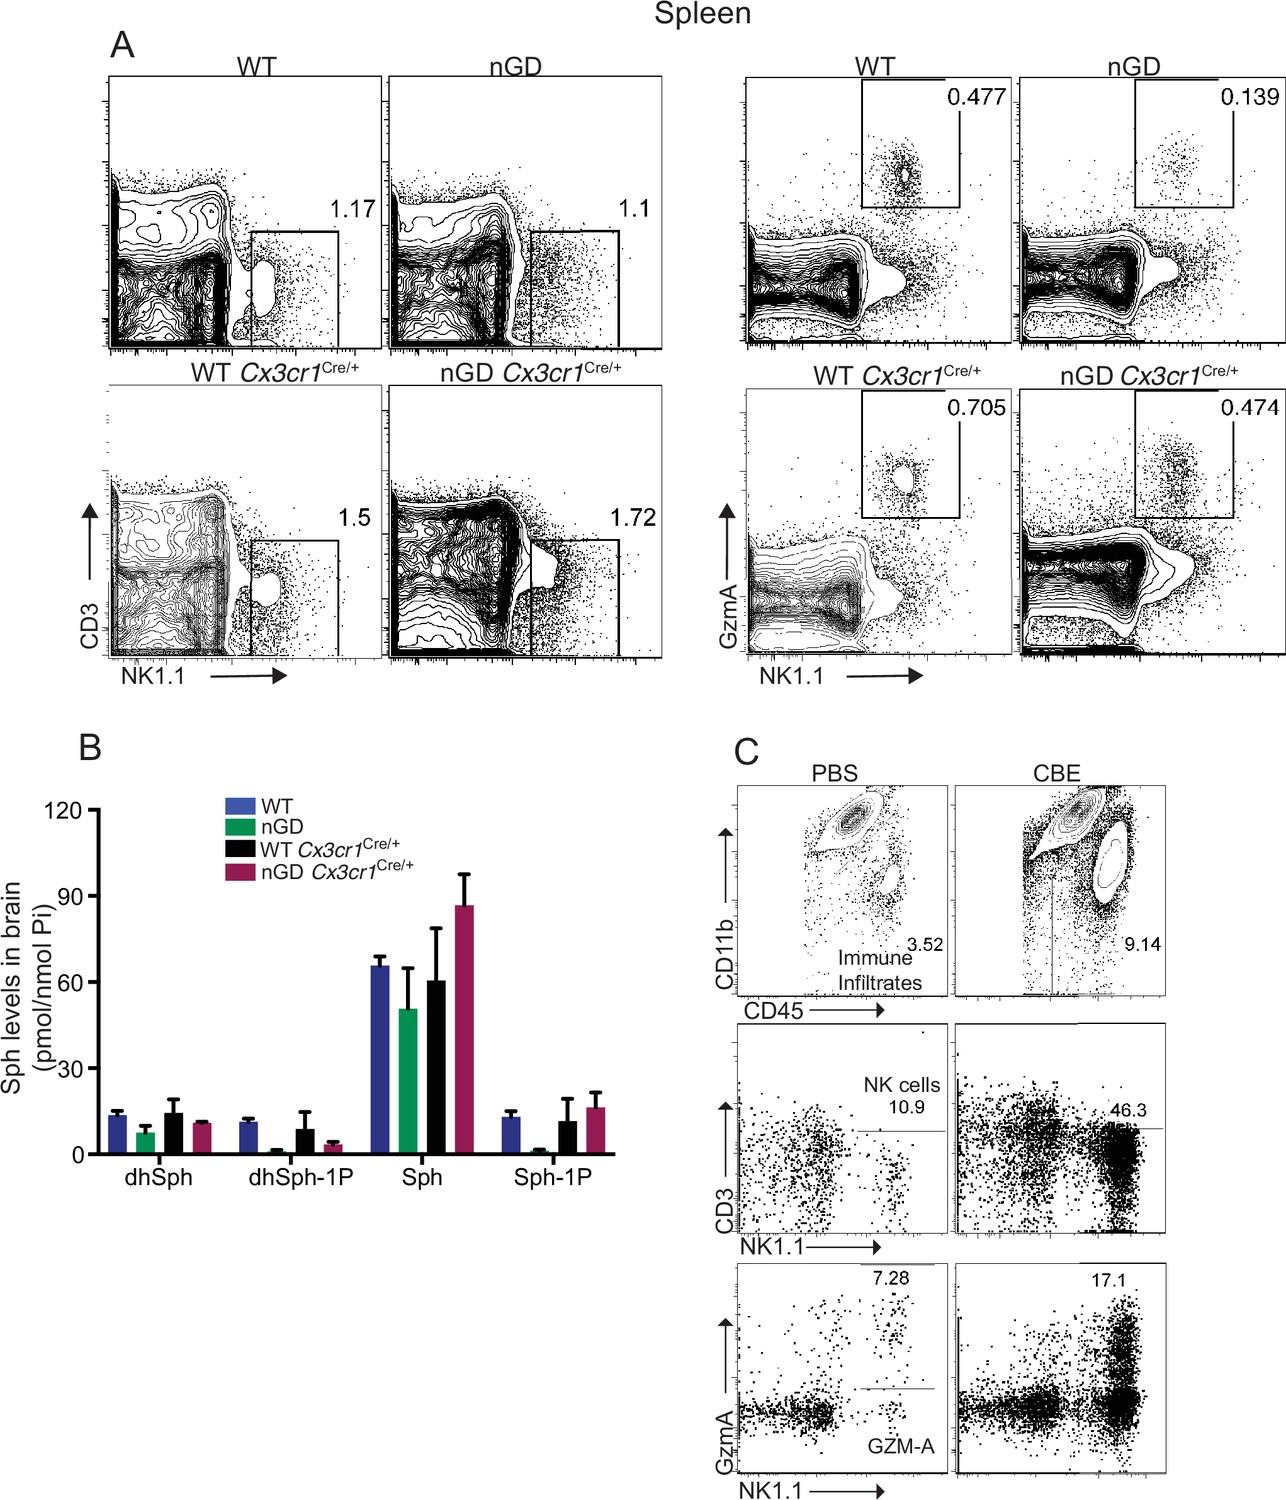
(A) Representative fluorescence-activated cell sorting (FACS) plot showing NK1.1+ NK cells and Gzm-A+ NK cells in the spleen of nGD, nGD Cx3cr1Cre/+, and control littermates. (B) Lipidomic analysis by LC-MS/MS of sphingosine-1-phosphate (S1P) and sphingosine (Sph) content in brains from nGD, nGD Cx3cr1Cre/+ mice, and control littermates (n = 3mice/group). (C) Representative FACS plot showing percentage of immune infiltrates (top panel), NK1.1+ NK cells (middle panel), and GzmA+ NK cells (bottom panel) in B6 treated with vehicle or conduritol β-epoxide (CBE).
Figure 5 with 1 supplement
snRNA-seq reveals key role of microglia astrocytes and neurons in Gaucher disease (GD)-associated neuroinflammation.
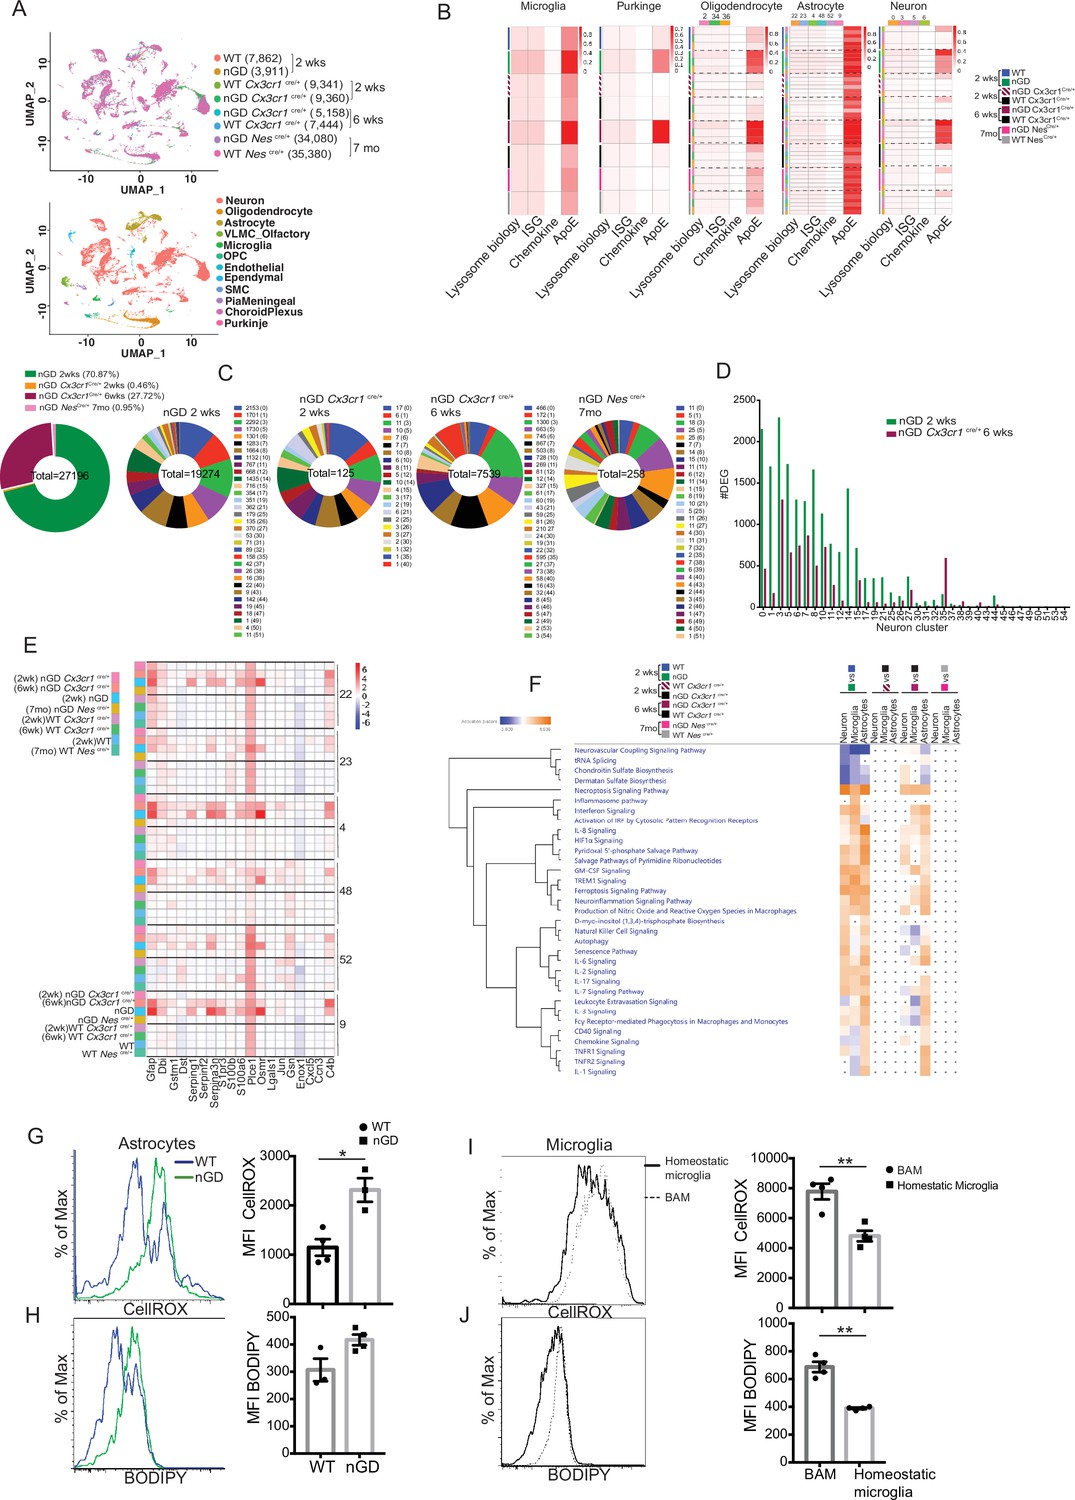
(A) UMAP data from neuronopathic Gaucher disease (nGD) (2 weeks old), nGD Cx3cr1Cre/+ (2 and 6 weeks old, respectively), nGD NesCre/+ mice (n = 3), and corresponding control mice, colored by genotype (top) and cell clusters (bottom). (B) AUC analysis for select lysosome, Interferon signature genes (ISG), chemokine, and Apoe gene sets significantly enriched (false discovery rate [FDR] < 0.05) in microglia, Purkinje, oligodendrocyte, astrocyte, and neuro clusters of nGD (2 weeks) vs. control mice; nGD Cx3cr1Cre/+ (2 and 6 weeks, respectively) vs. control mice; nGD NesCre/+ mice vs. control mice. Row side bar colors indicate mice genotype, age and cell clusters. (C) Pie chart displays the number of differentially expressed genes (DEGs) in neuronal clusters of nGD (2 weeks) vs. control mice (green); nGD Cx3cr1Cre/+ (2 weeks [orange] and 6 weeks [maroon], respectively); nGD NesCre/+ mice (pink) vs. control mice with log2(fold change) and adjusted p-value < 0.05. Total DEGs from each set of mice are stated in the middle of pie chart with number of DEGs and the neuronal cluster in brackets shown to the right of each pie chart. (D) Bar graph represents the number of DEGs in neuronal clusters of nGD 2 weeks (green) vs. nGD Cx3cr1Cre/+ 6 weeks (maroon) with log2(fold change) and adjusted p-value < 0.05. (E) Heat map of DEGs associated with disease-associated astrocytes (DAA) from nGD; nGD Cx3cr1Cre/+ (2 weeks and 6 weeks, respectively); nGD NesCre/+ mice vs. control mice. p<0.05 was considered significant (two-sided t-tests). All individual DAA genes with significant differential expression are listed on bottom and the astrocyte clusters are shown in right. Red, positive z-score; white, zero z-score; blue, negative z-score. (F) Ingenuity pathway analysis (IPA) from nGD vs. WT, nGD Cx3cr1Cre/+ vs. WT Cx3cr1Cre/+ at 2- and 6-week-old mice; nGD NesCre/+ mice vs. WT NesCre/+ in neuron cluster, microglia, and astrocytes. Orange, positive z-score; white, zero z-score; blue, negative z-score; gray dots are statistically insignificant. (G) Representative flow cytometry histogram (left) and quantification of CellROX fluorescence in astrocytes. (H) Histogram (left) and quantification (right) of BODIPY fluorescence in astrocytes of nGD mice. (I) Flow cytometry histogram (left) and quantification (right) of CellROX fluorescence in activated and homeostatic microglia from nGD mice. (J) Histogram (left) and quantification (right) of BODIPY fluorescence in activated and homeostatic microglia from nGD mice n = 3–4 mice per group. Data were replicated in at least two independent experiments. Unpaired t-test, two-tailed was used to test significance. *p<0.05, **p<0.001, and ***p<0.0001.
Figure 5—figure supplement 1
snRNA-seq analysis of the brain of neuronopathic Gaucher disease (nGD), nGD Cx3cr1Cre/+ mice.
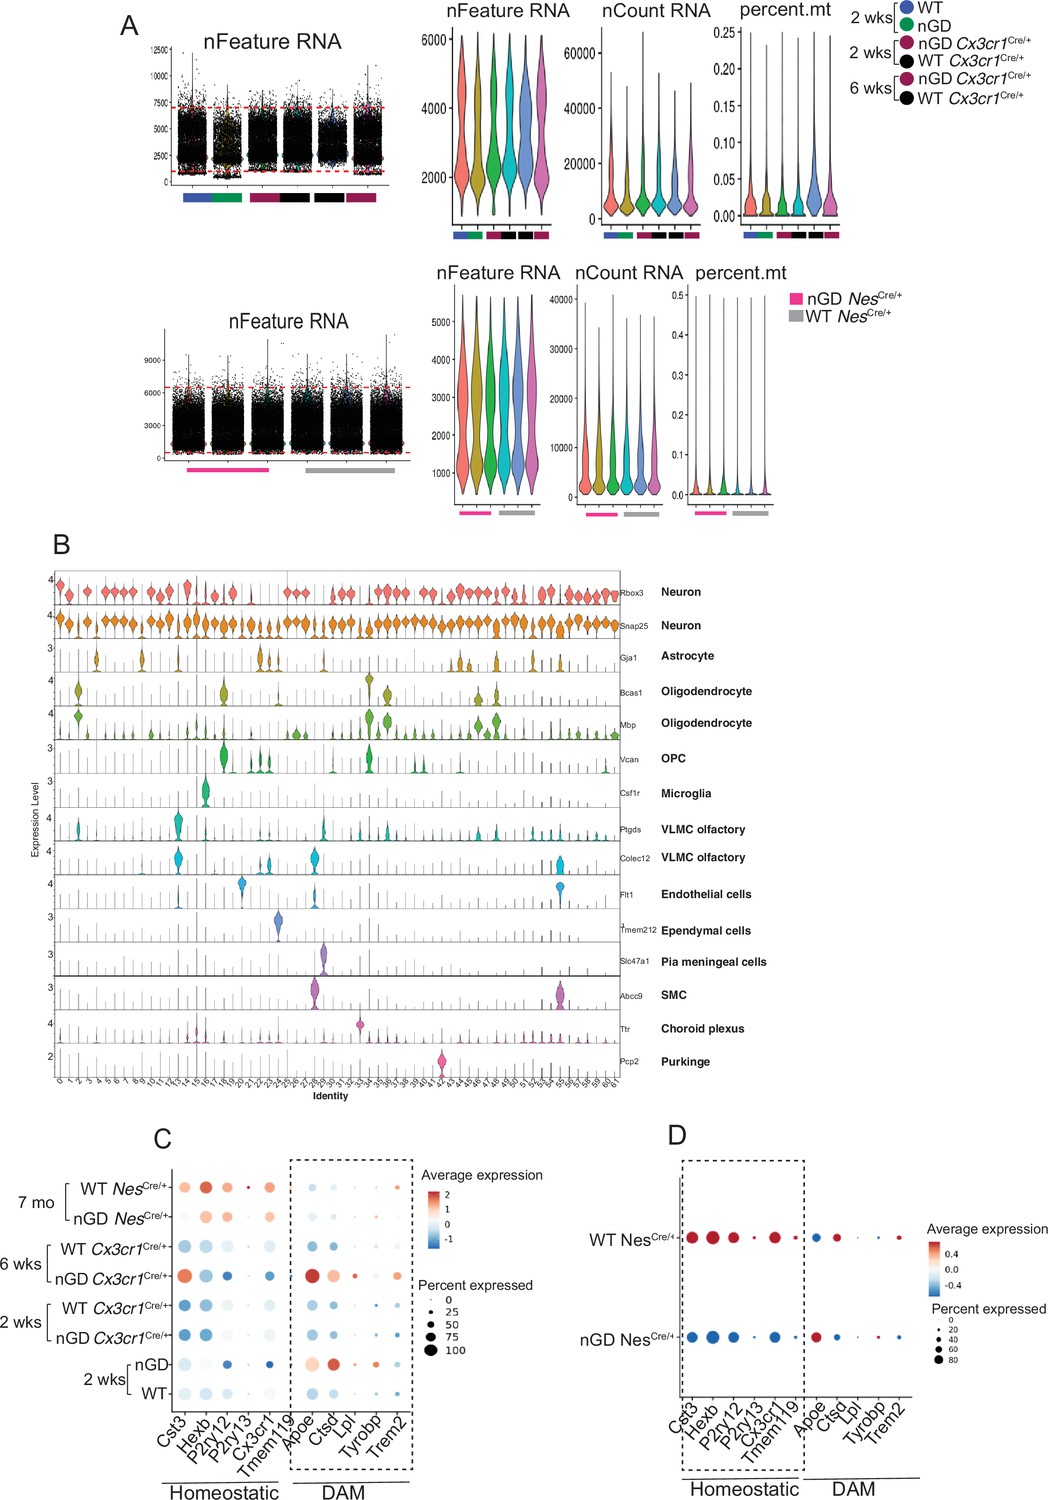
(A) Analysis of snRNA-seq data of nGD (green), Gbawt/lwt (blue), nGD Cx3cr1Cre/+ 2 and 6 weeks old (maroon), Gbawt/wtCx3cr1Cre/+ 2 and 6 weeks old (black), nGD NesCre/+ mice (pink) (n = 3), and Gbawt/wt NesCre/+ (gray) (n = 3). Violin plots showing the total number of detected genes (nFeature), reads counts (nCount), proportion of mitochondria (percent.mt) contamination per nucleus for each sample. (B) Violin plots showing the cluster-specific expression of the canonical marker genes across all clusters. (C) Dot plot showing the differential expression of homeostatic and disease-associated microglial (DAM) genes (dotted box) in microglia from nGD, Gbawt/lwt, nGD Cx3cr1Cre/+ 2 and 6 weeks old, Gbawt/wtCx3cr1Cre/+ 2 and 6 weeks old, nGD NesCre/+ mice (n = 3), and Gbawt/wt NesCre/+ (n = 3), respectively. (D) Dot plot showing the differential expression of homeostatic (dotted box) and DAM genes in microglia from nGD NesCre/+ mice (n = 3) and Gbawt/wt NesCre/+ (n = 3), respectively.
Figure 6 with 1 supplement
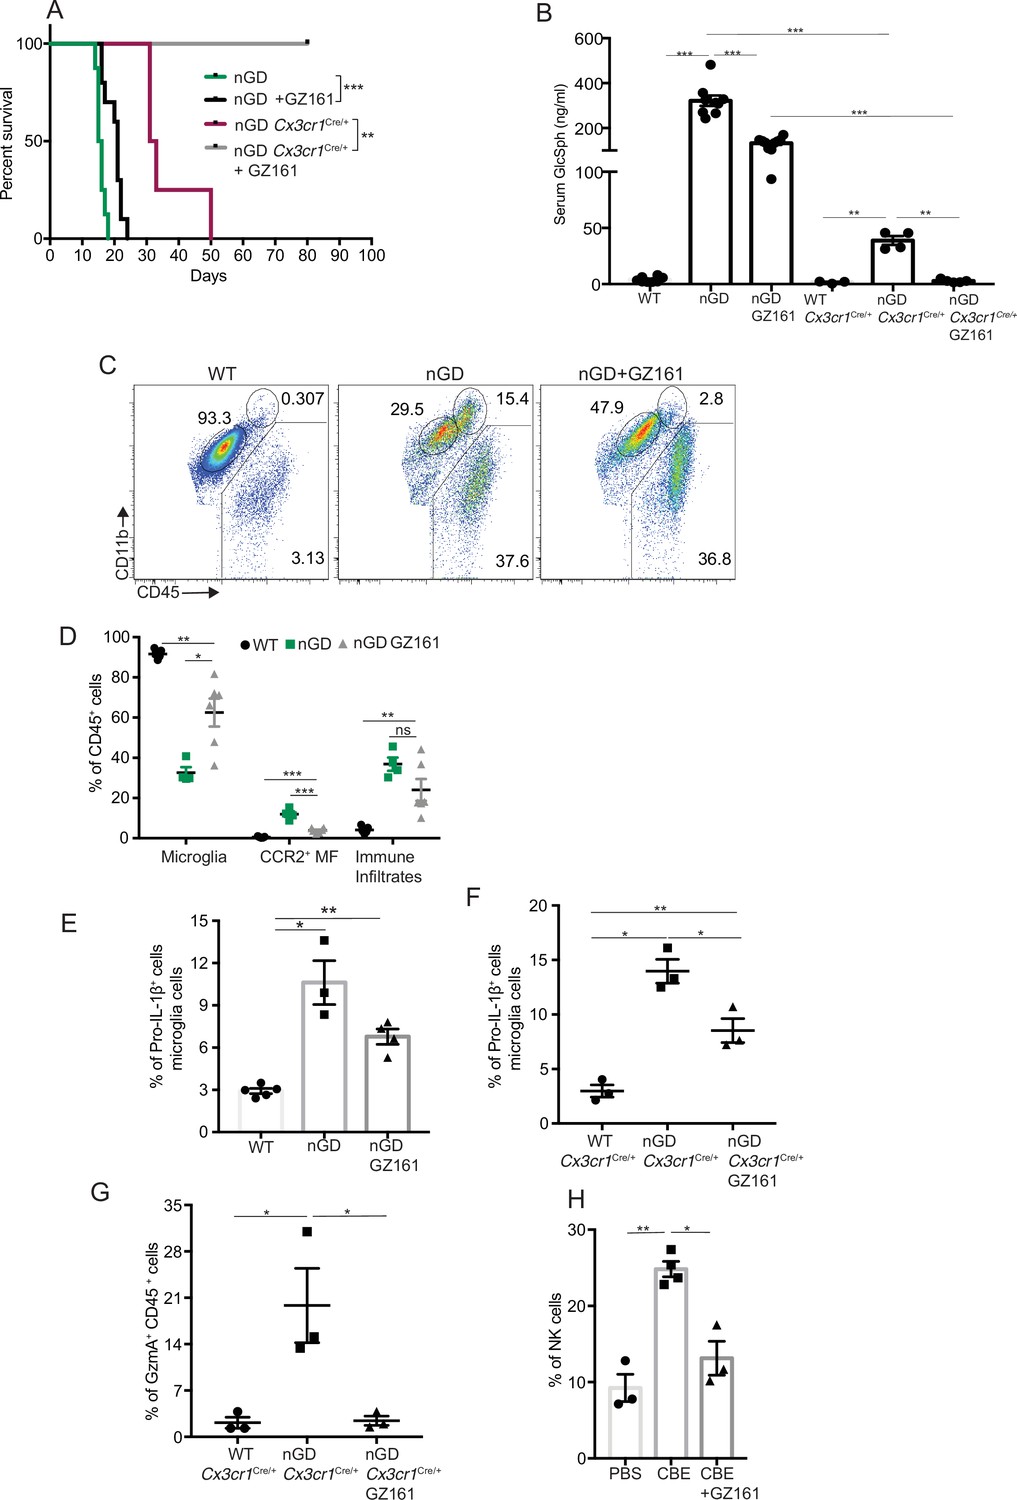
Effects of glucosylceramide synthase (GCS) inhibitor (GZ-161) on microglia and GzmA+ cells.
(A) Kaplan–Meier survival analysis of neuronopathic Gaucher disease (nGD) and nGD Cx3cr1Cre/+ mice after GZ-161 treatment compared to vehicle-treated controls (n = 4–10 mice/group). (B) Quantitative analysis of serum glucosylsphingosine (GlcSph) levels by LC-ESI-MS/MS in nGD, nGD Cx3cr1Cre/+ mice with and without GZ-161 treatment compared with the vehicle-treated controls (n = 4–10 mice/group). (C) Representative fluorescence-activated cell sorting (FACS) staining of microglia, activated microglia, and immune infiltrates in wild-type and nGD mice with and without treatment with GZ-161. (D) Graph represents percentages of microglia, CCR2+ MFs and immune infiltrates in wild-type and nGD mice with and without treatment with GZ-161 (n = 4–6 mice/group). (E) Bar graph showing percentage of Pro-IL-1ß+ microglia cells in wild-type and nGD mice with and without treatment with GZ-161 (n = 3–5 mice/group; repeated at least three times). (F) Bar graph showing percentage of Pro-IL-1ß+ microglia cells in wild-type and nGD Cx3cr1Cre/+ mice with and without treatment with GZ-161 (n = 3–5 mice/group). (G) Percentage of GzmA+ CD45+ cells in wild-type and nGD Cx3cr1Cre/+ mice with and without treatment with GZ-161 (n = 3–5 mice/group). (H) Bar graphs compare the percentage of NK cells in Gbawt/wt and mice treated with conduritol β-epoxide (CBE) and CBE + GZ-161, respectively (n = 3–5 mice/group; repeated at least three times). Data represents three biological replicates. Means ± SEM are shown. Unpaired t-test, two-tailed was used to test significance. *p<0.05, **p<0.001, and ***p<0.0001.
Figure 6—figure supplement 1
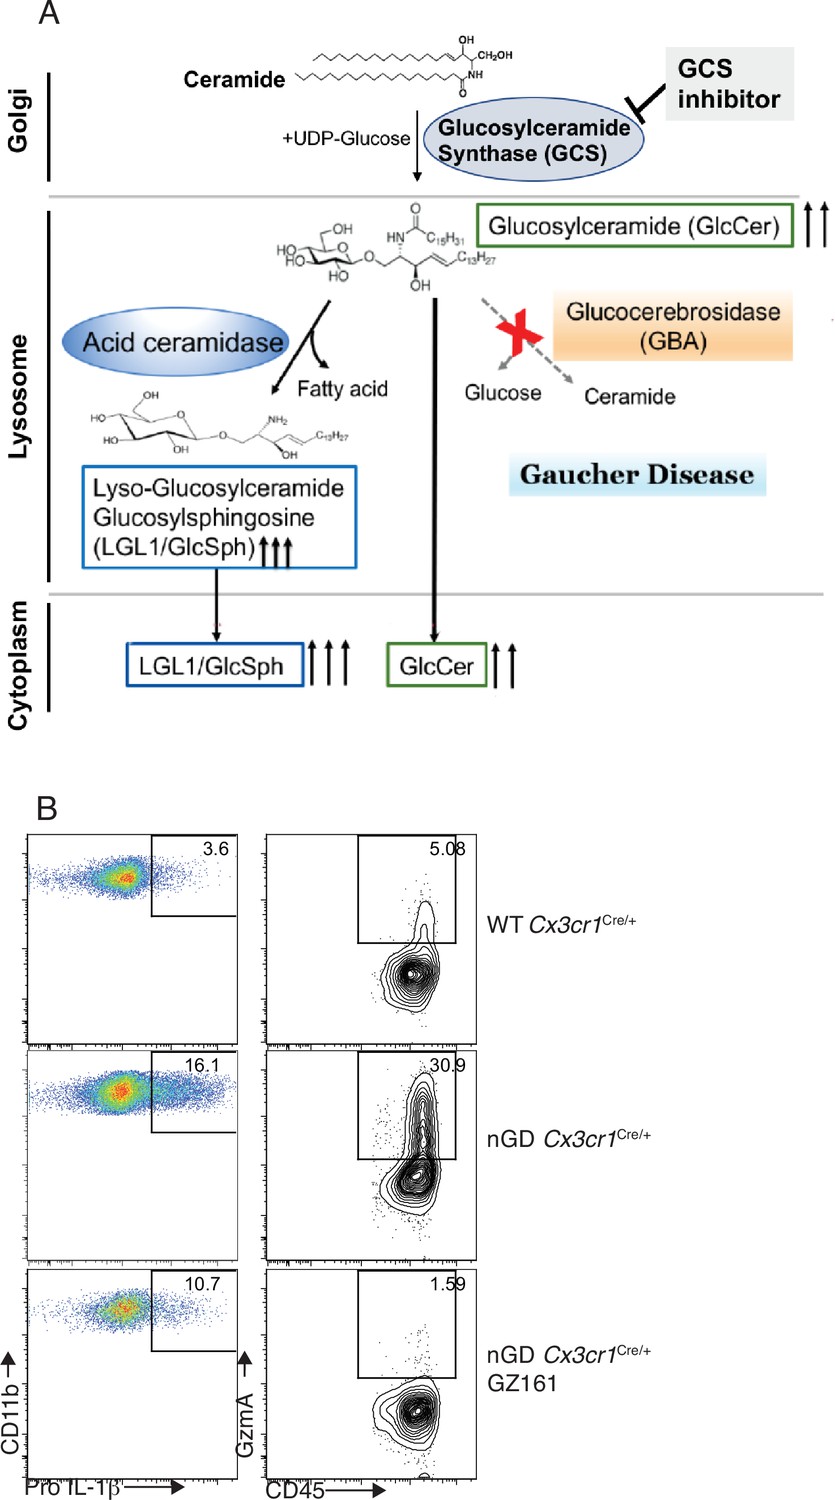
Immune regulatory effects of glucosyl ceramide synthetase (GCS) inhibitor GZ-161 on microglia and GzmA+ cells.
(A) Schematic illustration of mode of action of GCS inhibitor. (B) Representative fluorescence-activated cell sorting (FACS) plot showing percentage of Pro-IL-1ß+ microglia cells (left) and GzmA+ CD45+ (right) in wild-type and neuronopathic Gaucher disease (nGD) Cx3cr1Cre/+mice with and without treatment with GZ-161.
Figure 7 with 1 supplement
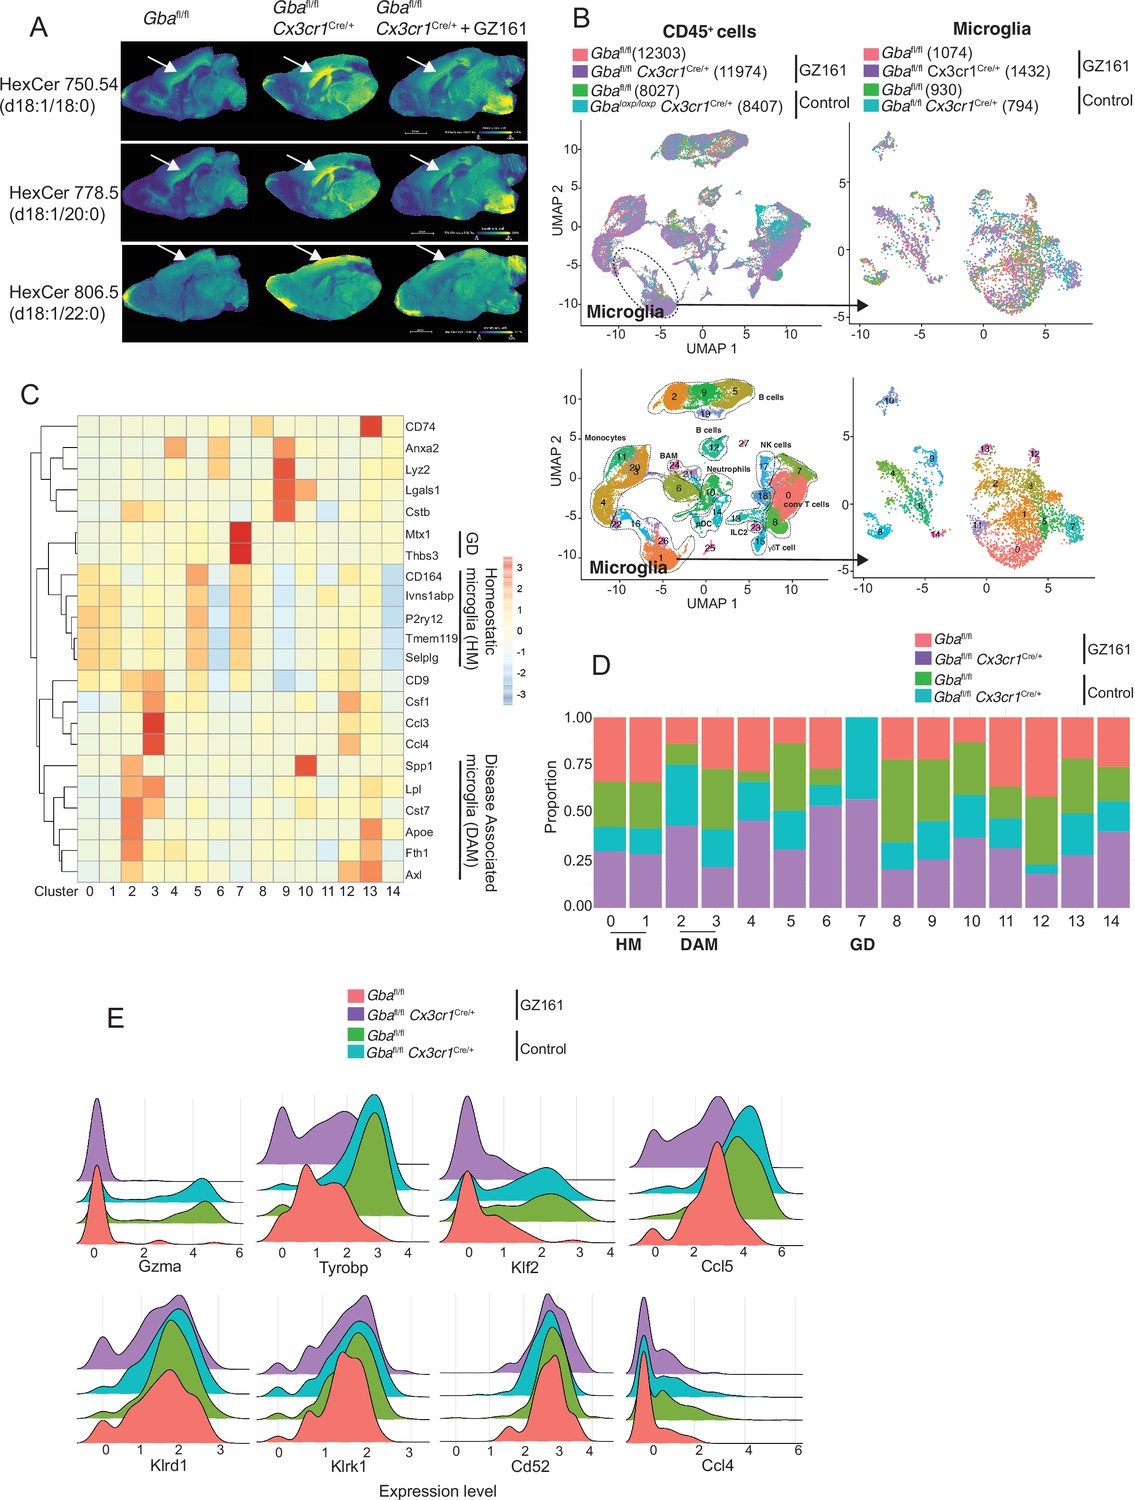
Long-term treatment with glucosylceramide synthase (GCS) inhibitor, GZ-161, counteracts age-related microglial dysfunction and NK cell activation.
(A) Signal intensities of hexosylceramides (HexCer) species and lysophosphatidylcholine (LysoPC) identified by MALDI across Gbafl/flCx3cr1Cre/wt mice treated with either vehicle or GZ161 and control mice brain. The color bars in MALDI images show signal intensity: blue to yellow indicates low to high levels. (B) UMAP plots show clusters of CD45+ cells from brain of control and Gbafl/flCx3cr1Cre/wt mice treated with either GZ161 or vehicle. Cells are colored by mice genotype (left top) and cluster (left bottom). Microglia subcluster of CD45+ cells, colored by mice (right top) and clusters (right bottom). (D) Hierarchical heat map depicting differential expression of genes associated with homeostatic and disease-associated microglia in the different microglia clusters. (D) Fraction of cells present in each microglial cluster from control and Gbafl/flCx3cr1Cre/wt mice treated with either GZ161 or vehicle. (E) Histogram showing differential expression of selected genes in cluster 17 from control and Gbafl/flCx3cr1Cre/wt mice treated with either GZ161 or vehicle.
Figure 7—figure supplement 1
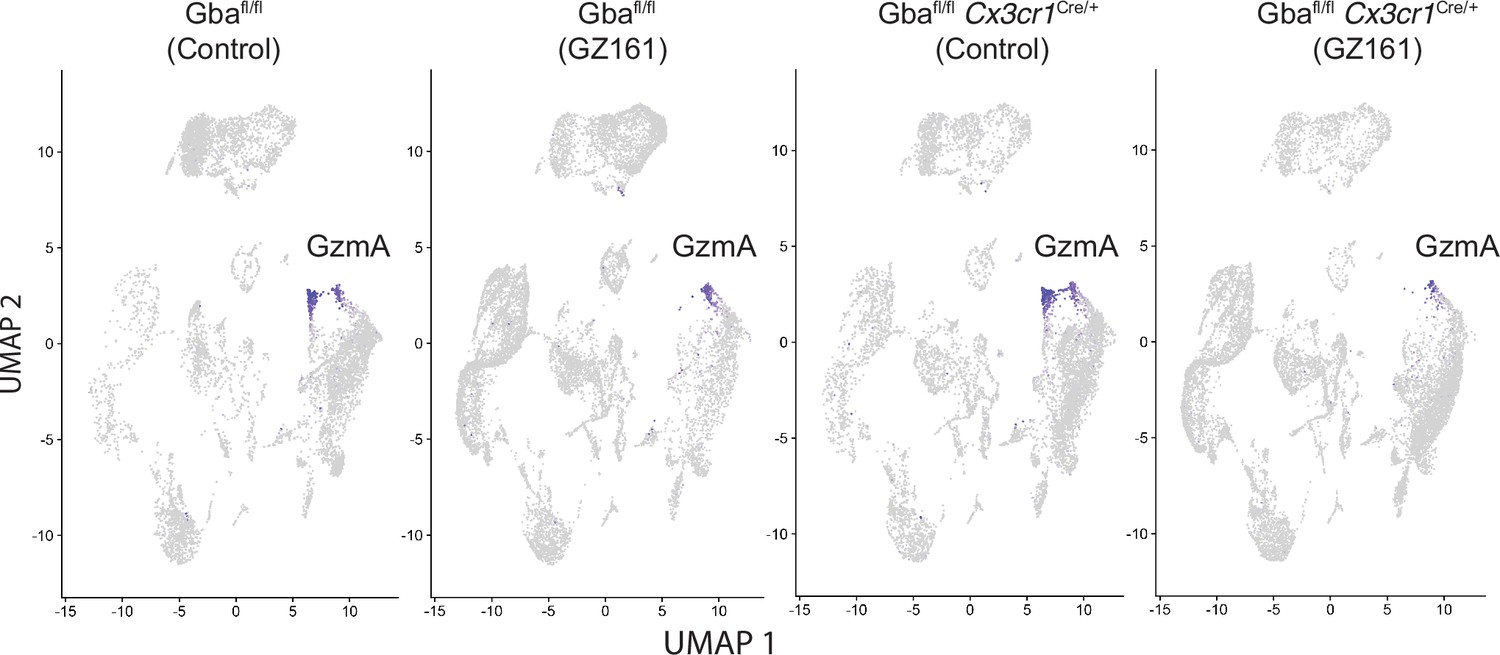
Long-term treatment with glucosylceramide synthase (GCS) inhibitor, GZ-161, counteracts glucosylceramide (GluCer) accumulation, improves microglial homeostasis, and abrogates NK cell activation in Gba-deficient microglia.
UMAP showing GzmA expression in the clusters from control and Gbafl/fl Cx3cr1Cre/wt mice treated with either vehicle or GZ161.
Figure 8 with 1 supplement
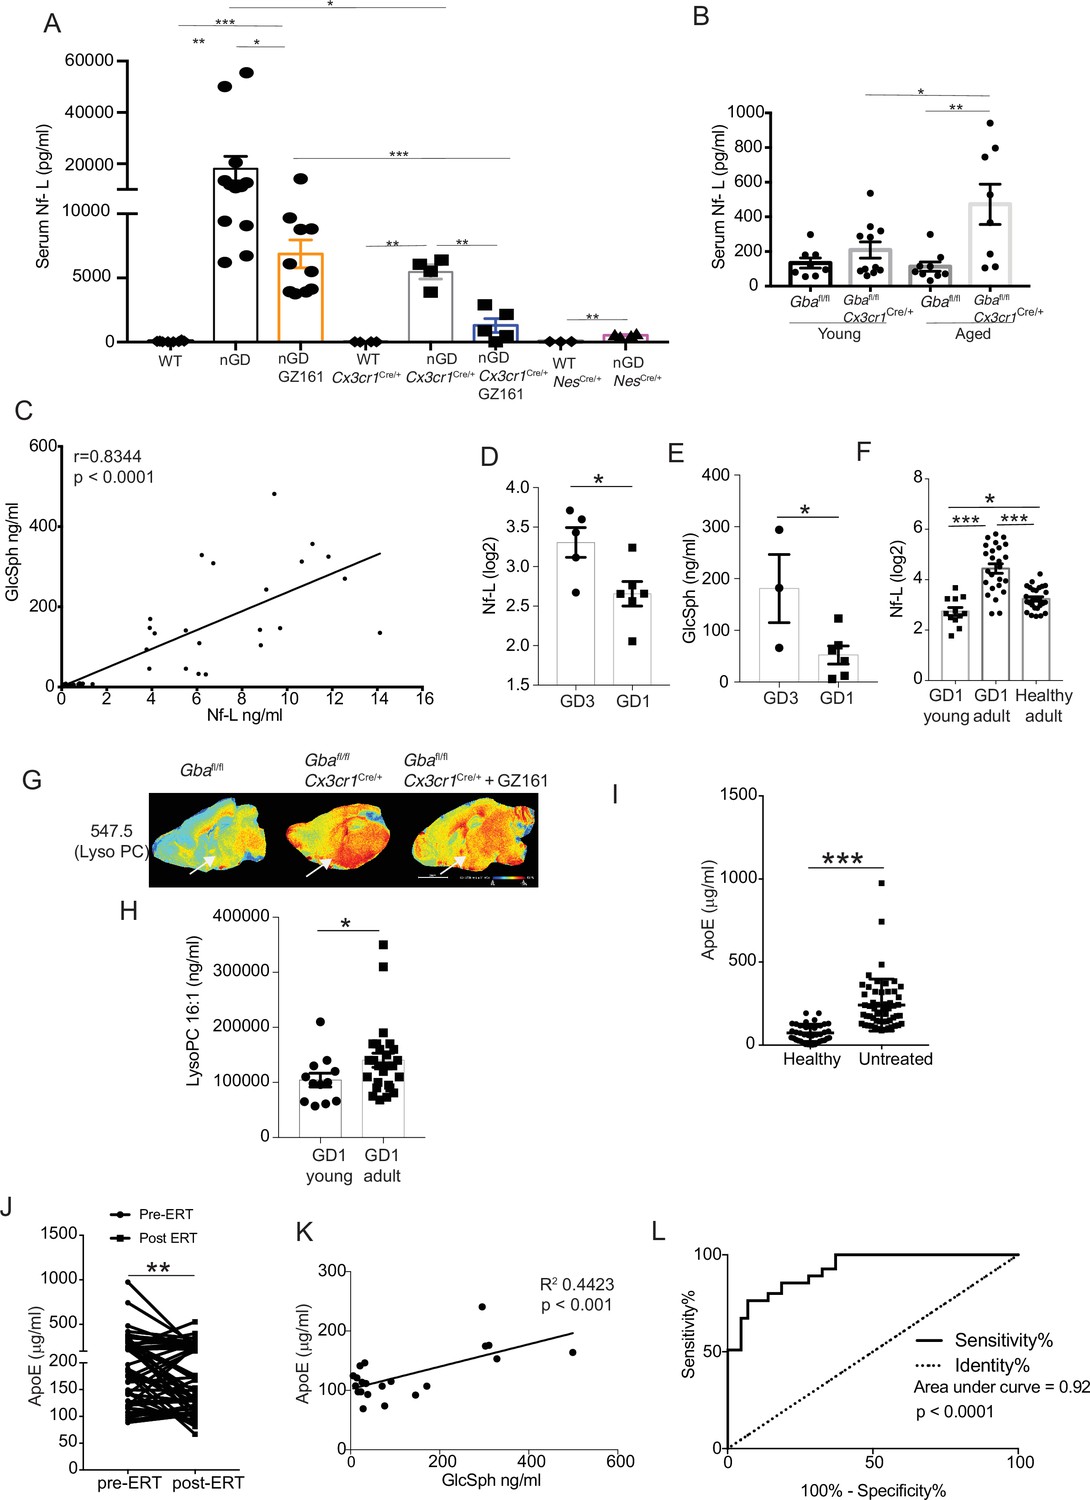
Clinical evaluation of ApoE and neurofilament light chain (Nf-L) as biomarkers of Gaucher disease (GD)-associated neurodegeneration.
(A) Quantitative analysis of serum Nf-L levels in neuronopathic Gaucher disease (nGD), nGD Cx3cr1Cre/+, and nGD NesCre/+ mice with and without GZ-161 treatment compared with the vehicle-treated controls (n = 4–10 mice/group; two independent experiments). (B) Comparison of serum Nf-L levels between young and aged Gbafl/flCx3cr1Cre/wt mice along with control mice (n = 8–11 mice/group). (C) Correlation between serum GlcSph and Nf-L levels in nGD, nGD Cx3cr1Cre/+ mice, nGD NesCre/+, and control mice. The p-value obtained from Spearman’s rank correlation coefficient test was <0.0001 (n = 69 mice). (D) Quantitative analysis of serum Nf-L levels (log2 scale) in GD3 patients (n = 5) compared with age-matched GD1 patient (n = 6). (E) Quantitative analysis of serum levels glucosylsphingosine (GlcSph) in GD3 patients (n = 3) compared with age-matched GD1 patient (n = 6). (F) Quantitative analysis of serum Nf-L levels (log2 scale) in young GD1 patients (n = 12) compared with adult GD1 patient (n = 25) and adult healthy controls (n = 28). (G) Signal intensities of lysophosphatidylcholine (LysoPC) identified by MALDI across Gbafl/flCx3cr1Cre/wt mice treated with either vehicle or GZ161 and control mice brain. The color bars in MALDI images show signal intensity: blue to red indicates low to high levels. (H) Quantitative analysis of serum levels of LysoPC 16:1 species in young GD1 patients (n = 12) compared with adult GD1 patient (n = 26). (I) Graph represents ApE levels in the sera of untreated GD1 patients (n = 55) and healthy controls (n = 43). (J) Graph represents ApoE levels in the sera of untreated GD1 patients (n = 55) and after enzyme replacement therapy (ERT) (n = 55). (K) Correlation between serum GlcSph and ApoE levels in sera of GD1 patients. The p-value obtained from Pearson’s correlation test was <0.001 (n = 21 patients). (L) Receiver-operating characteristic (ROC) curves for serum ApoE expression in GD1 patients and area under the curve (AUC). Means ± SEM are shown. Differences between groups were analyzed using unpaired t-test. (A, B) Mann–Whitey test (C, E, H, I), two-tailed. *p<0.05, **p<0.001, and ***p<0.0001.
Figure 8—figure supplement 1
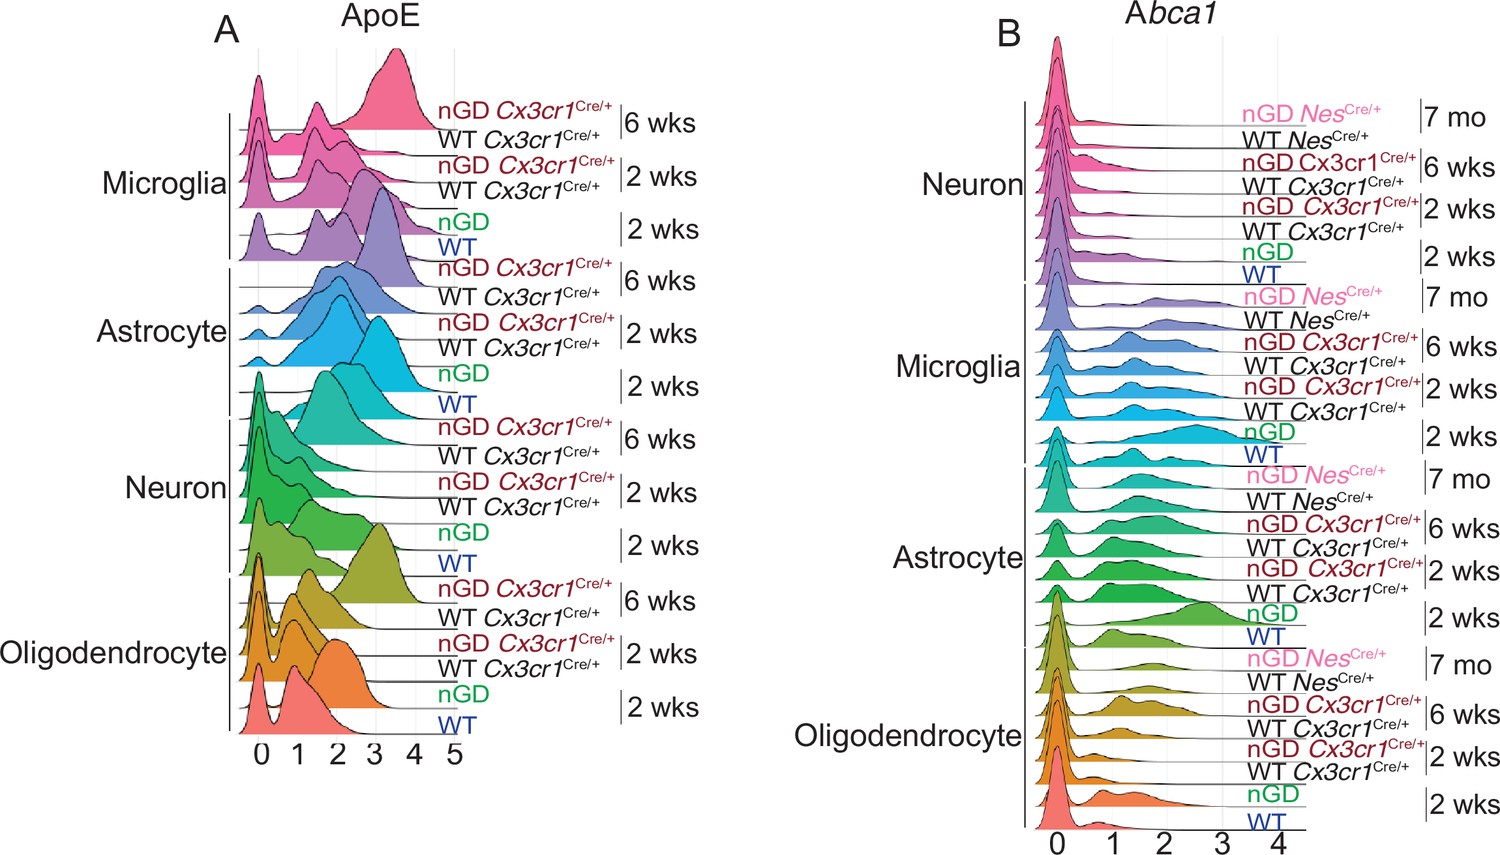
Expression of ApoE and Abca1 in different brain cell types of neuronopathic Gaucher disease (nGD) mice.
(A) Histogram showing differential expression of ApoE in microglia, astrocyte, neuron, and oligodendrocyte cluster from nGD (2 weeks old), nGD Cx3cr1Cre/+ (2 and 6 weeks old, respectively), and corresponding control mice. (B) Histogram showing expression of Abca1 in oligodendrocyte, microglia, astrocyte, and neuron from nGD (2 weeks old), nGD Cx3cr1Cre/+ (2 and 6 weeks old, respectively), nGD NesCre/+, and corresponding control mice.
Figure 9
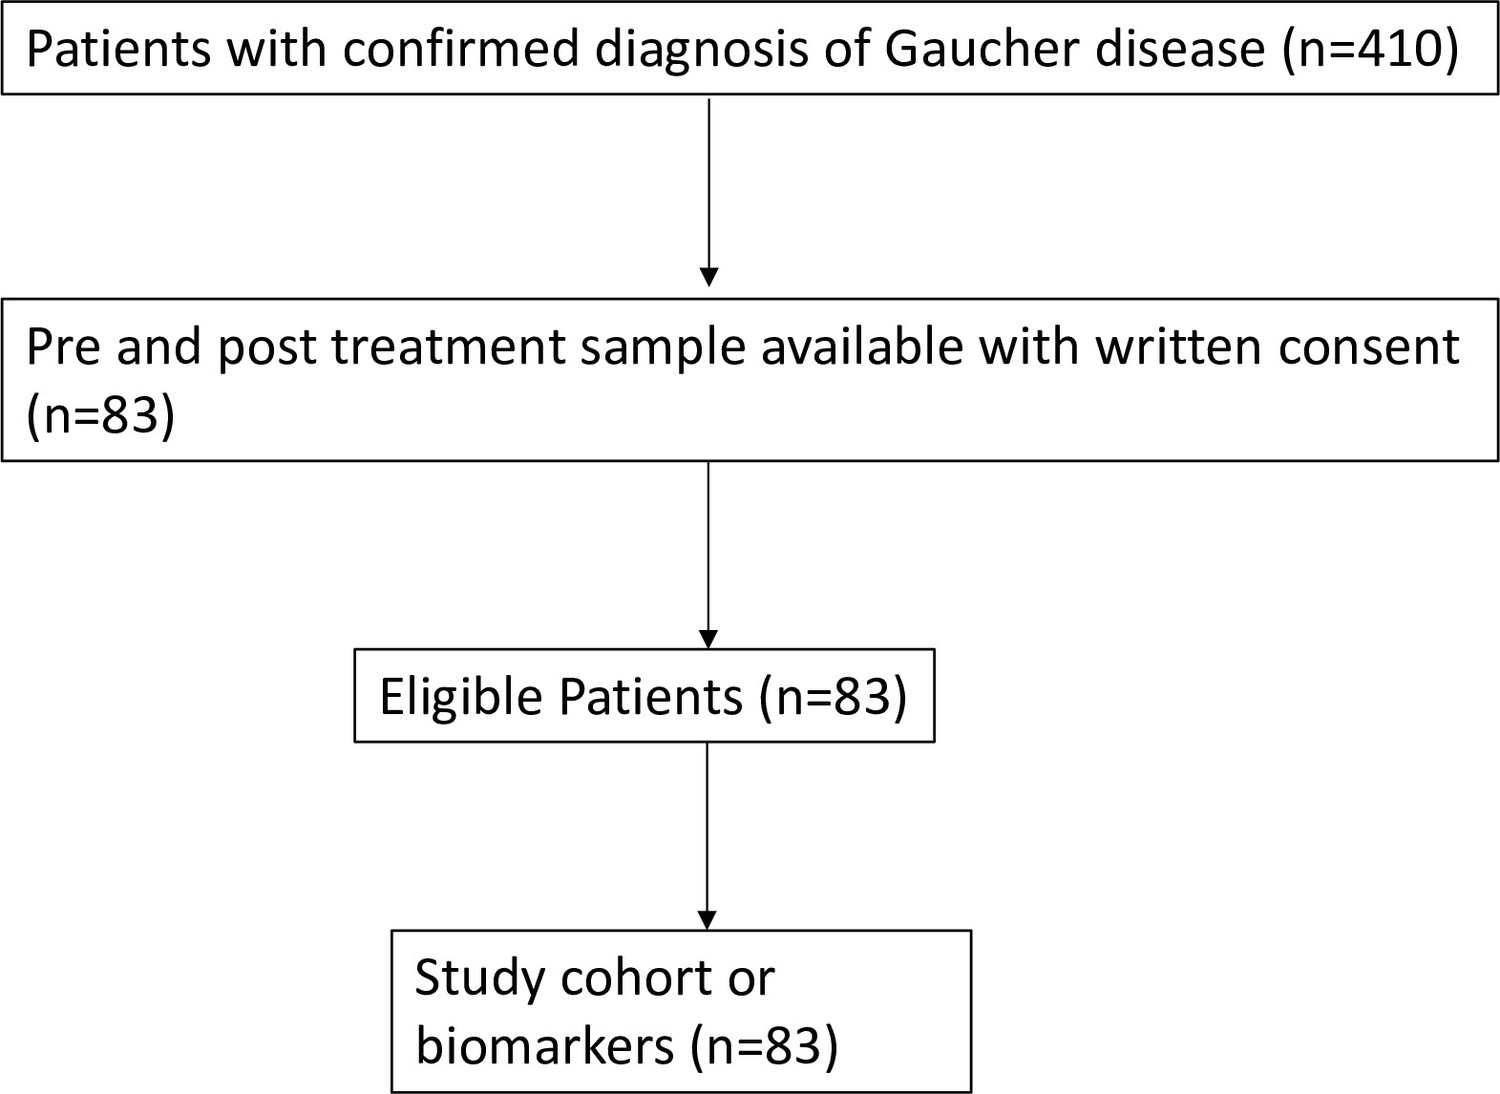
Remark flowchart.
Flow diagram of the study cohort used in the study.
Tables
Key resources table
| Reagent type (species) or resource | Designation | Source or reference | Identifiers | Additional information |
|---|---|---|---|---|
| Antibody | CD11b | BD Biosciences | 583,553 | (1:1000) |
| Antibody | CD11b | BD Biosciences | 552,850 | (1:1000) |
| Antibody | ACSA-2 | Miltenyi Biotech | 130-123-284 | (1:100) |
| Antibody | CD45 | Biolegend | 103,133 | (1:1000) |
| Antibody | NK1.1 | BD Biosciences | 562,864 | (1:250) |
| Antibody | CCR2 | R and D | FAB5538F | (1:100) |
| Antibody | CD3 | Biolegend | 100,241 | (1:250) |
| Antibody | NK1.1 | Biolegend | 108,753 | (1:250) |
| Antibody | 1 A/1-E | Biolegend | 107,639 | (1:1000) |
| Antibody | CD4 | BD Biosciences | 563,790 | (1:500) |
| Antibody | CD4 | BD Biosciences | 558,107 | (1:1000) |
| Antibody | Gr-1 | Biolegend | 108,440 | (1:1000) |
| Antibody | Ly-6C | Invitrogen | 47-5932-82 | (1:1000) |
| Antibody | CD64 | Biolegend | 139,306 | (1:200) |
| Antibody | B220 | eBioscience | 47-0452-80 | (1:200) |
| Antibody | CD8a | eBioscience | 56-0081-82 | (1:1000) |
| Antibody | IL-1Beta | Invitrogen | 17-7114-80 | (1:1000) |
| Antibody | IFNγ | Biolegend | 505,808 | (1:250) |
| Antibody | IFNγ | BD Biosciences | 562,020 | (1:250) |
| Other | Brdu Flow kit | BD Pharmingen | 51-9000019AK | |
| Other | 5-Bromo-2'-deoxyuridine | Cayam Chemical Company | 15,580 | 180 µg/ml (injected) and 800 µg/ml (in water) |
| Other | Cell Rox Deep Red kit | Invitrogen | C10422 |
Additional files
Download links
A two-part list of links to download the article, or parts of the article, in various formats.
Downloads (link to download the article as PDF)
Open citations (links to open the citations from this article in various online reference manager services)
Cite this article (links to download the citations from this article in formats compatible with various reference manager tools)
Neuroinflammation in neuronopathic Gaucher disease: Role of microglia and NK cells, biomarkers, and response to substrate reduction therapy
eLife 11:e79830.
https://doi.org/10.7554/eLife.79830


