Identification of Paired-related Homeobox Protein 1 as a key mesenchymal transcription factor in pulmonary fibrosis
- Université Paris Cité, Inserm, Physiopathologie et épidémiologie des maladies respiratoires, France
- Université Paris Cité, Inserm, Physiopathologie et épidémiologie des maladies respiratoires, Belgium
- Assistance Publique des Hôpitaux de Paris, Hôpital Bichat, Service de Pneumologie A, FHU APOLLO, France
- Assistance Publique des Hôpitaux de Paris, Hôpital Bichat, Département d’Anatomopathologie, FHU APOLLO, France
- Univ Rennes, Inserm, EHESP, Irset (Institut de recherche en santé, environnement et travail) - UMR_S 1085, France
- Assistance Publique des Hôpitaux de Paris, Hôpital Bichat, Service de Pneumologie et Transplantation, FHU APOLLO, France
- Assistance Publique des Hôpitaux de Paris, Hôpital Bichat, Service de Chirurgie Thoracique et Vasculaire, FHU APOLLO, France
- Plate-forme Orion, CIRB, Collège de France/CNRS-UMR7241/INSERM-U1050, PSL Research University, France
- Université Côte d'Azur, CNRS, IPMC, FHU-OncoAge, France
- CYU Université, ERRMECe(EA1391), France
- Secarna Pharmaceuticals GmbH & Co. KG, Germany
- Department of Internal Medicine II, University of Giessen-Marburg Lung Center, Justus-Liebig University Giessen, Germany
Figures
Figure 1 with 1 supplement
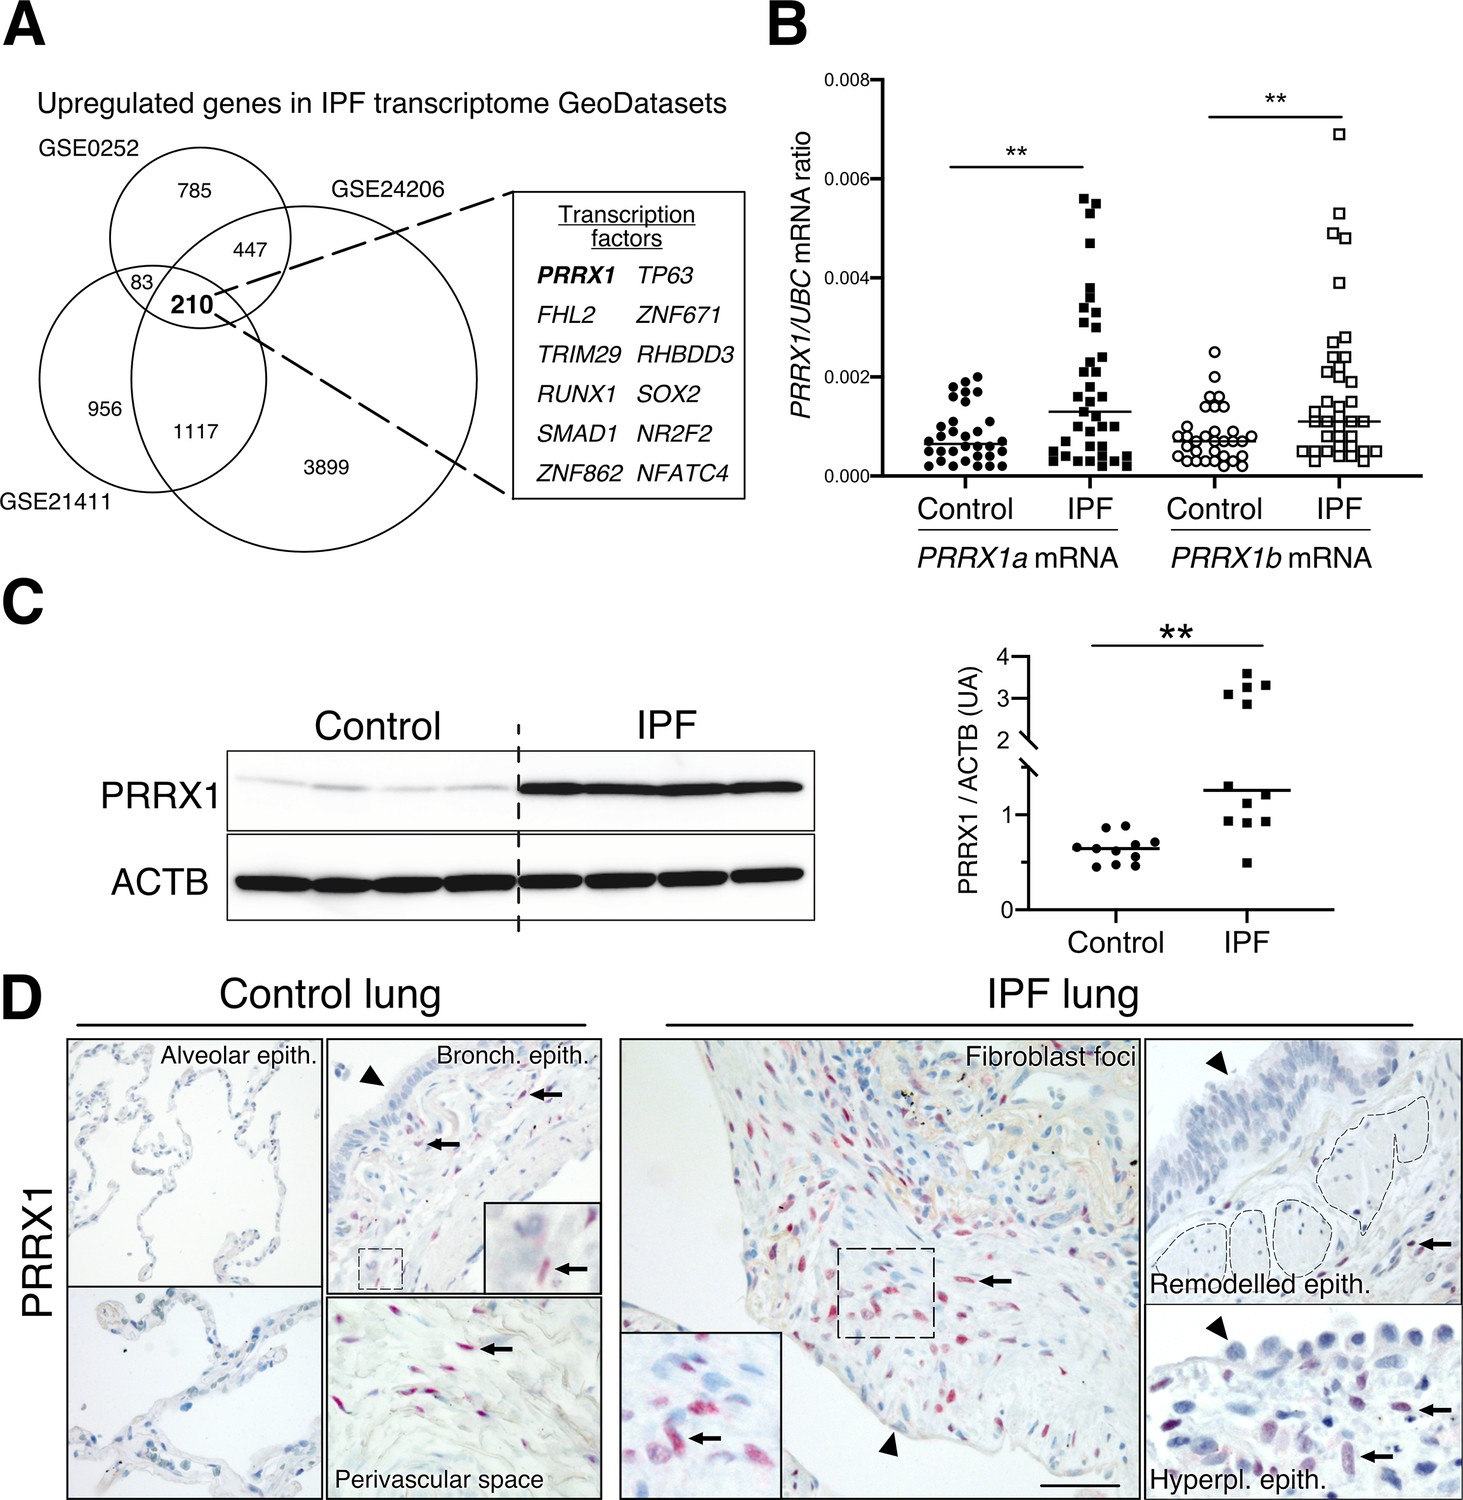
Identification of PRRX1 as a transcription factor reactivated in IPF lung.
(A) Venn diagram showing the number of genes up-regulated in three IPF lung Transcript microarray databases compared to controls (NCBI GEO GDS1252, GDS4279, GDS3951). Among the 210 common upregulated genes in all three datasets, 12 genes were annotated as transcription factors (see embedded table in the figure, PRRX1 is in bold). (B) Dot plots with median showing the mRNA expression of PRRX1a and PRRX1b isoforms in control (circle, n=32) and IPF (square, n=37) whole lung homogenates. (C) Immunoblot showing PRRX1 expression in control and IPF whole lung homogenates. ACTB was used as loading control. The quantification of PRRX1 relative expression to ACTB in control (circle, n=11) and IPF (square, n=12) is displayed as dot plot with median on the right. (D) Representative immunohistochemistry images (n=5 per group) showing PRRX1 staining (red) in control (left panels) and IPF (right panels). Nuclei were counterstained with hematoxylin. Note the absence of PRRX1 staining in the alveolar and bronchiolar epithelium (arrow head). PRRX1-positive cells were only detected in the peri-bronchiolar and peri-vascular spaces (arrows) in control lungs (left panels). In IPF, PRRX1-positive cells (arrow) were detected in the remodeled/fibrotic area (right panels). Note that epithelial cells (arrow head) and bronchiolar smooth muscle cells (dashed areas) are PRRX1 negative. The high-magnification pictures match the dashed boxes displayed in the main panels. Scale bar: 80 µm in low magnification images and 25 µm in high-magnification ones. Abbreviations: epithelium. (epith); bronchiolar. (bronch); Hyperpl. (hyperplastic). Mann Whitney U test, *p≤0.05, **p≤0.01.
-
Figure 1—source data 1
The zip folder contains the data presented in panels B-C (in an Excel document).
Labelled (.pdf) and raw (folder) blot images showed in panel C are also included.
- https://cdn.elifesciences.org/articles/79840/elife-79840-fig1-data1-v2.zip
Figure 1—figure supplement 1
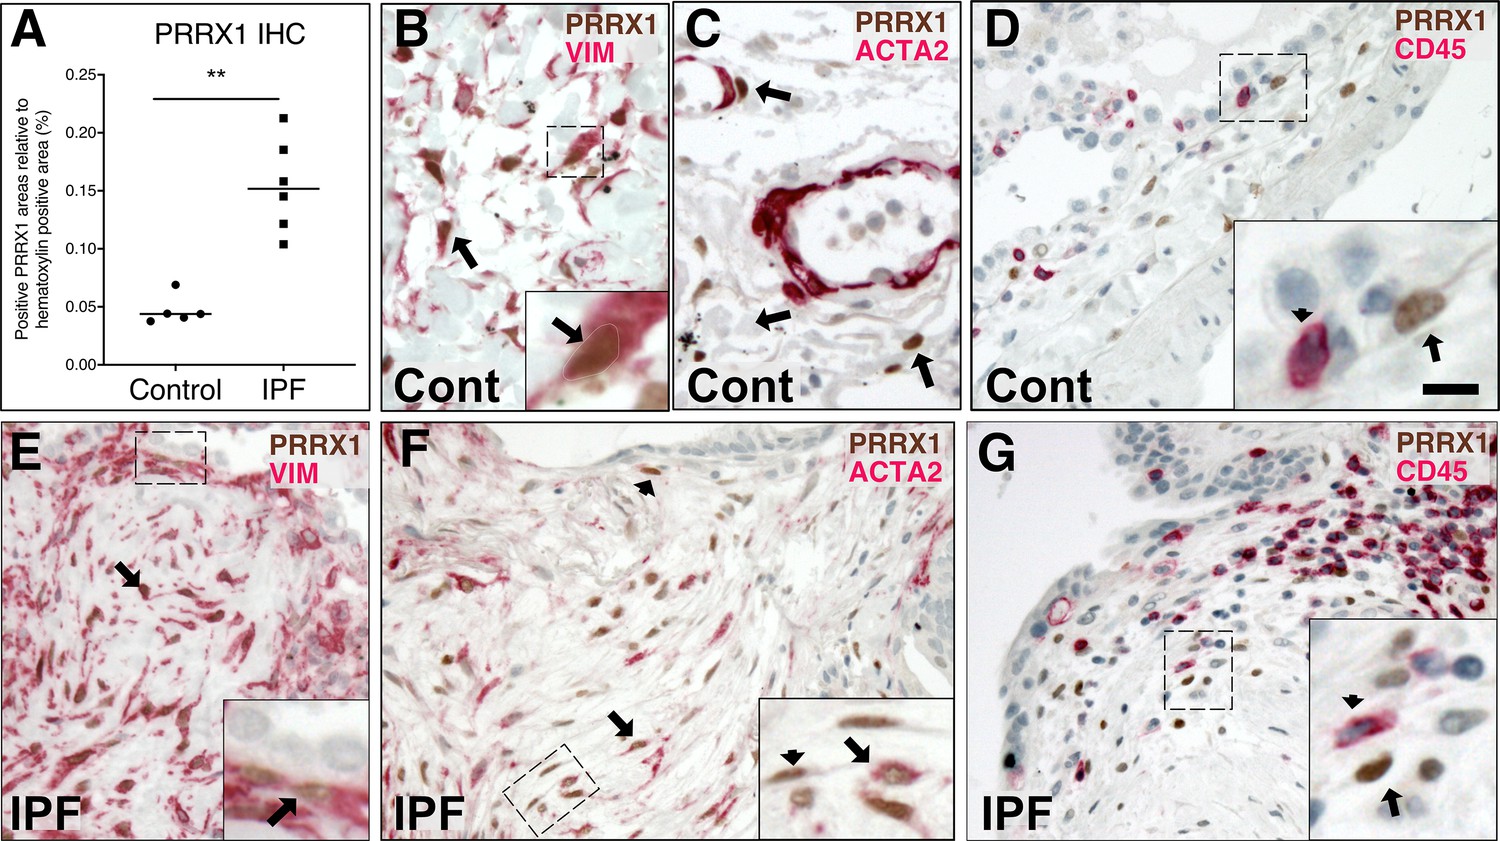
Co-expression of PRRX1 with Vimentin and ACTA2 in control and IPF lungs by immunochemistry.
(A) Dot plots with median showing the percentage of PRRX1-positive area relative to hematoxylin area (used as total nuclear area) in control (circle, n=5) and IPF (square, n=6) lung paraffin sections by immunocytochemistry (see Figure 1D). (B–D) Representative immunohistochemistry images (n=3 per group) in control lung showing PRRX1 staining (Brown Chromogen, nuclear staining) in perivascular space with (B) Vimentin (Red chromogen), (C) ACTA2 (Red chromogen) and (D) CD45 (Red chromogen). Note that PRRX1-positive cells (arrow) were Vimentine positive (B) but ACTA2 (C) and CD45 negative (D). Insert in (B): high magnification of the black dashed box in the main left panel showing a double positive PRRX1 (brown nuclear staining, outlined with dashed white line) and Vimentin (red cytoplasmic staining) cell. Insert in (D): high magnification of the black dashed box in the main bottom panel showing a PRRX1 (brown nuclear staining) positive but CD45-negative cell (arrow) as well as a CD45 (red cytoplasmic staining) positive but PRRX1-negative cell (arrowhead). (E–G) Representative immunohistochemistry images (n=3 per group) showing PRRX1 staining (Brown Chromogen, nuclear staining) in IPF fibroblast foci with (E) Vimentin (Red chromogen), (F) ACTA2 (Red chromogen) and (G) CD45 (Red chromogen). Note that PRRX1-positive cells were Vimentin positive (see black arrow in (E)) but only some were ACTA2 positive (arrow and dashed box in (F)). PRRX1pos ACTA2neg cells were also present (see arrowhead in (F)). All PRRX1pos cell populations were also CD45 negative (G). Insert in (E): high magnification of the black dashed box in the main left panel showing a double positive PRRX1 (brown nuclear staining, see black arrow) and Vimentin (red cytoplasmic staining) cells. Note that the epithelium is negative for both markers. Panel in (F): high magnification of the black dashed box in the main right panel showing a double positive PRRX1 (brown nuclear staining, see black arrow) and ACTA2 (red cytoplasmic staining) cell. PRRX1pos ACTA2neg cells were also present (see arrowhead). Panel in (G): high magnification of the black dashed box in main panel (G) showing a PRRX1 (brown nuclear staining) positive but CD45-negative cell (arrow) and a CD45pos (red cytoplasmic staining) positive but PRRX1neg cell (arrowhead). Nuclei were counterstained with hematoxylin in all panels. Abbreviations: Vim (Vimentin), Pos (positive), neg (negative). (Scale bar: 50 µm in (B–C), 80 μm in (D) and 25 µm in high magnification (B and D); 80 µm in (E–G) and 40 µm in high magnification (E–G)).
-
Figure 1—figure supplement 1—source data 1
The zip folder contains the data presented in the panel A (in an Excel document).
- https://cdn.elifesciences.org/articles/79840/elife-79840-fig1-figsupp1-data1-v2.zip
Figure 2 with 1 supplement
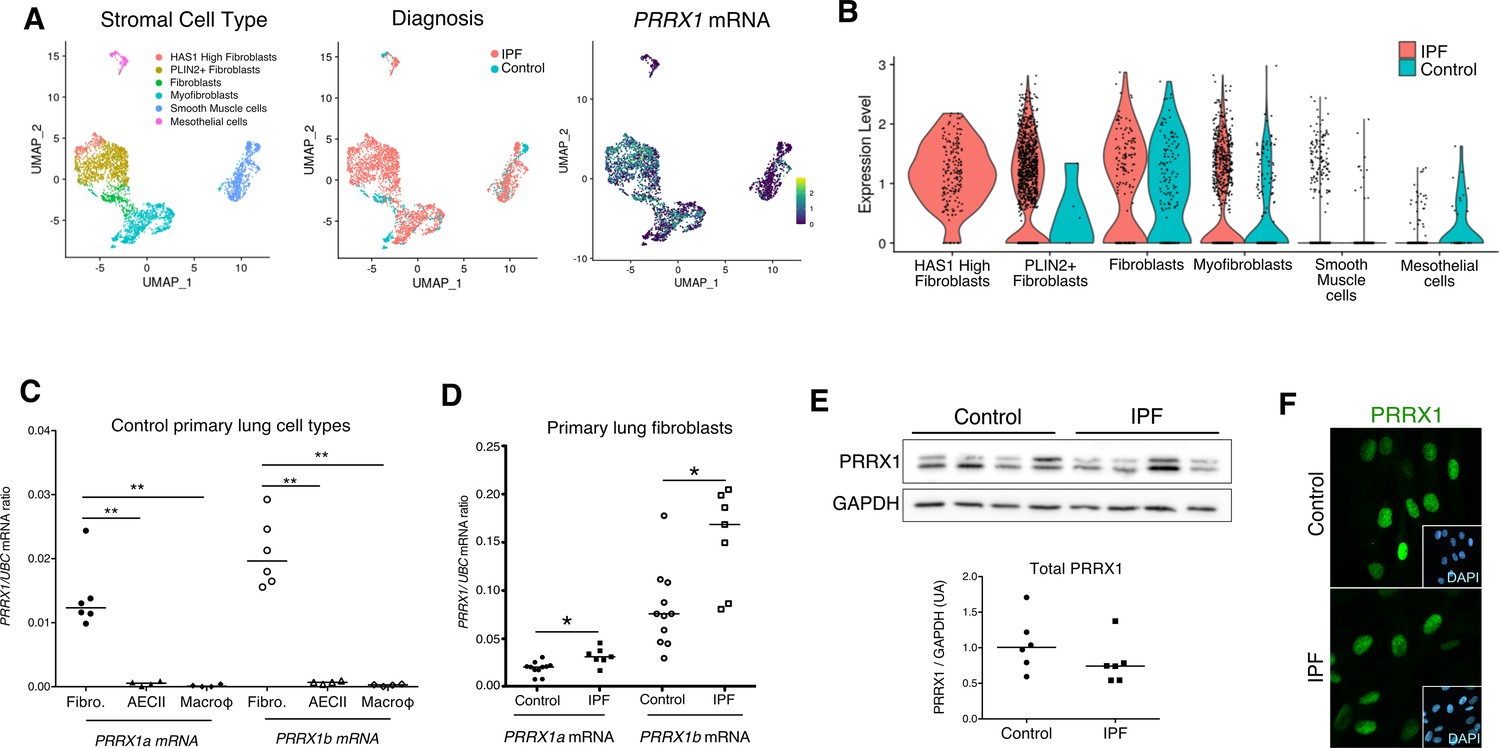
PRRX1 is a mesenchymal transcription factor upregulated in primary Human lung IPF fibroblasts.
(A) UMAP plots describing the distribution of PRRX1 expressing cells in stromal subpopulations using Banovich / Kropski’s dataset (Adams et al., 2020; Habermann et al., 2020). The labeling of each cell cluster is showed on the left, the diagnosis in the middle and PRRX1 relative expression on the right. (B) Violin plots visualizing PRRX1 mRNA expression from (A) in each cell type stratified by disease states (control lung cell types in blue and IPF ones in red). Note that PRRX1 mRNA expression was associated with stromal clusters in both conditions and expressed in IPF associated subpopulation (HAS1 high and PLIN2+ Fibroblasts). (C) Dot plots with median showing the mRNA expression of PRRX1a (black) and PRRX1b (white) isoforms in primary Human lung fibroblasts (circle, n=6), alveolar epithelial cells (triangle, n=4) and alveolar macrophages (diamond, n=4). (D) Dot plots with median showing the mRNA expression of PRRX1a (black) and PRRX1b (white) isoforms in control (circle, n=11) and IPF (square, n=7) primary Human lung fibroblasts. (E) Immunoblot showing PRRX1 expression in control and IPF primary Human lung fibroblasts. GAPDH was used as loading control. The quantification of PRRX1 relative expression to GAPDH in control (circle, n=6) and IPF (square, n=6) lung fibroblasts is displayed as dot plot with median below. (F) Representative Immunofluorescence images (n=8 per group) showing PRRX1 staining (green) in control (top panel) and IPF (bottom panel) fibroblasts. Nuclei were counterstained with DAPI (inserts in main panels). Scale bar 20 µm in main panels and 40 µm in inserts. Abbreviations: fibroblasts (fibro); alveolar epithelial cells (AECII); alveolar macrophages (macroϕ). Mann Whitney U test, *p≤0.05.
-
Figure 2—source data 1
The zip folder contains the data presented in panels C-E (in an Excel document).
Labelled (.pdf) and raw (folder) blot images showed in panel E are also included.
- https://cdn.elifesciences.org/articles/79840/elife-79840-fig2-data1-v2.zip
Figure 2—figure supplement 1
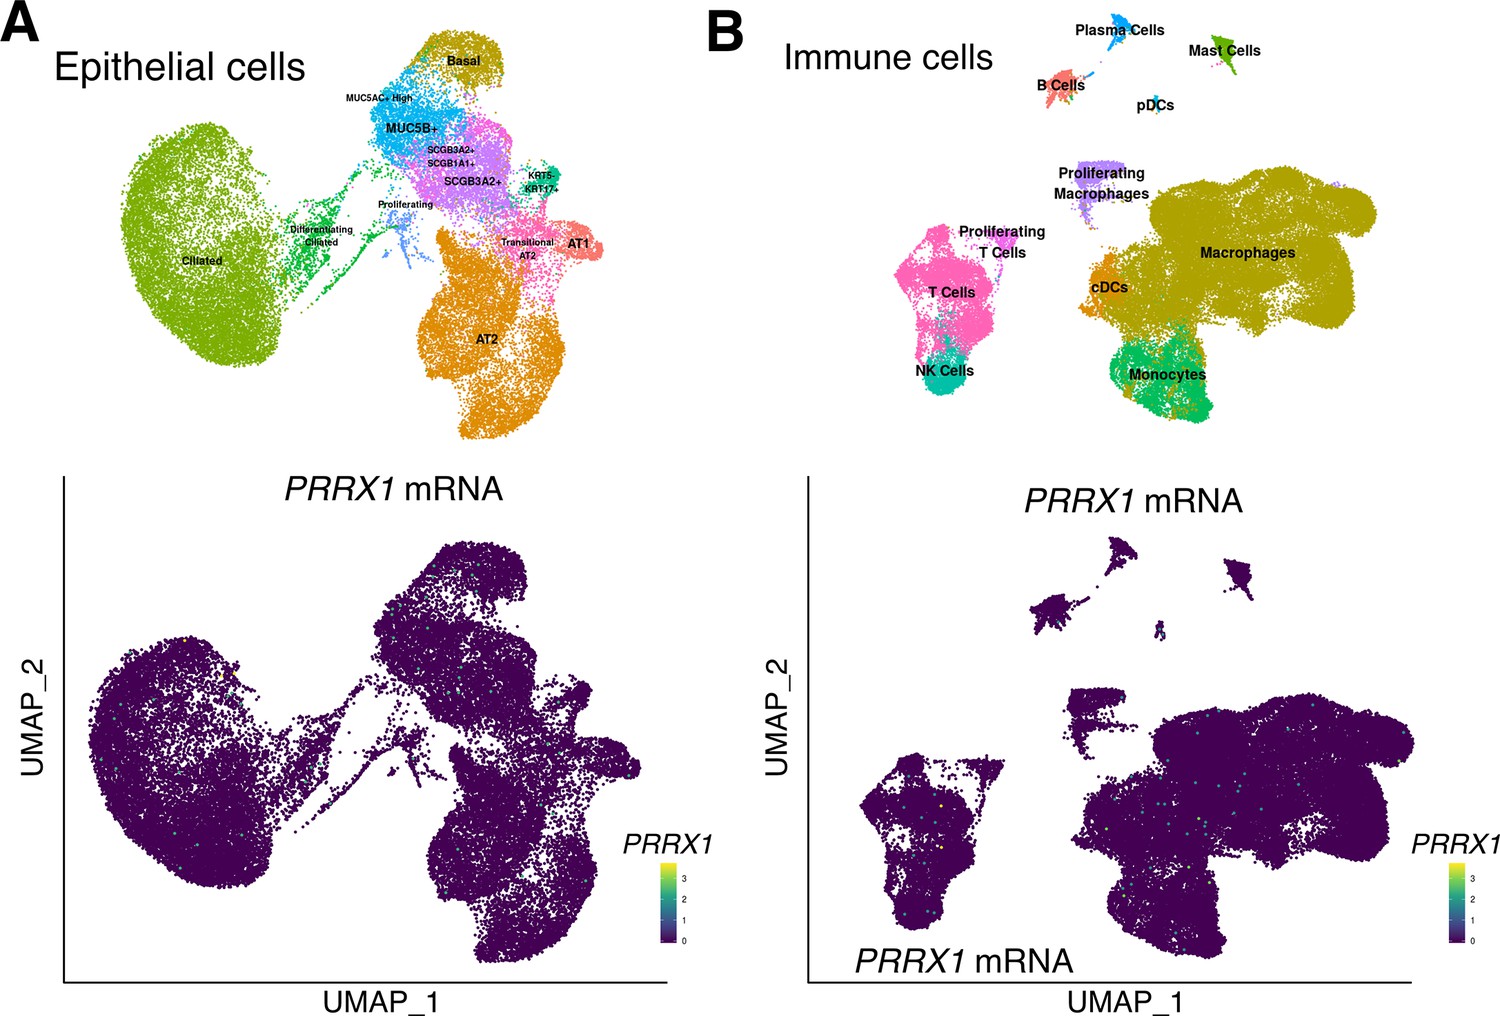
PRRX1 expression profiles at single-cell resolution using the ‘IPF Cell Atlas’ web database (http://ipfcellatlas.com/).
(A–B) UMAP plots describing the distribution of PRRX1 expressing cells in epithelial (A) and immune (B) cell lineage clusters were drawn with UMAP Explorer using the Banovich / Kropski’s datasets (Adams et al., 2020; Habermann et al., 2020). The labeling of each cell cluster is shown on the top and PRRX1 relative expression in those clusters is shown on the bottom. Note the absence of PRRX1-positive cells in these cell types. Abbreviations: AT1 (alveolar type 1 epithelial cell), AT2 (alveolar type 2 epithelial cell), Epith. (epithelial), B Cell (B lymphocyte), T Cell (T lymphocyte), cDCs (dendritic cells), pDCs (plasmacytoid dendritic cells), NK Cell (Natural Killer cell), PNEC (pulmonary neuroendocrine cell), VE (vascular endothelium), ILD (interstitial lung disease).
Figure 3 with 1 supplement
PRRX1 is modulated by growth factors and matrix environment.
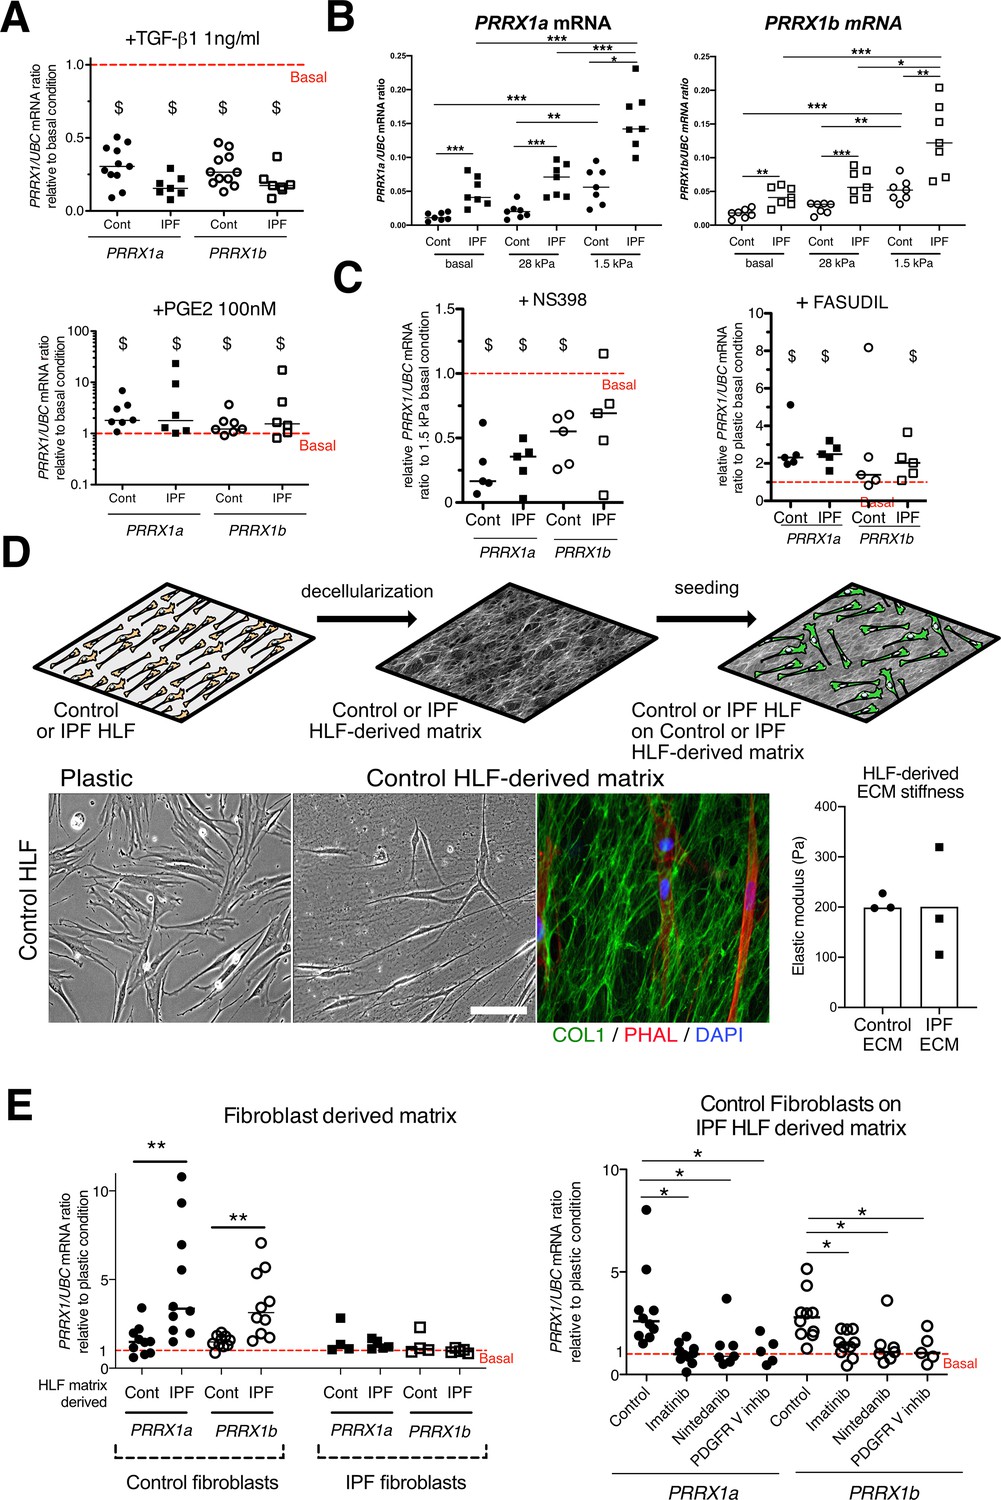
(A) Dot plots with median showing the mRNA expression of PRRX1a (black) and PRRX1b (white) isoforms in control (circle) and IPF (square) primary Human lung fibroblasts stimulated for 48 hr with TGF-β1 (left; n=11 control HLF, n=7 IPF HLF), PGE2 (middle; n=7 control HLF, n=6 IPF HLF) compared to basal condition (red dashed line). (B) Dot plots with median showing the mRNA expression of PRRX1a (left panel) and PRRX1b (right panel) isoforms in control (circle) and IPF (square) lung fibroblasts (n=7 per group) cultured on plastic (basal) or on stiff (28 kPa) and soft (1.5 kPa) substrate. (C) Dot plots with median showing the mRNA expression of PRRX1a and PRRX1b isoforms in control and IPF lung fibroblasts (n=5) stimulated 48 hr with NS398 (left), or Fasudil (right) compared to basal condition. (D) Summary sketch of Fibroblast-derived matrix experiments (upper part). Lower part: representative phase contrast pictures of control primary lung fibroblasts on plastic (left) or seeded in a control fibroblast-derived matrix (middle) and immunofluorescence pictures (right) of Collagen 1 (green) revealing the HLF-derived matrix and actin fibers stained with Phalloidin (red). Nuclei were counterstained with DAPI (blue). Right panel: column with mean and individual values showing the mean stiffness (elastic modulus) of control (circle) or IPF (square) fibroblast-derived matrix (n=3 per group). (E) Left panel: dot plots with median showing the mRNA expression of PRRX1a and PRRX1b isoforms in control or IPF fibroblasts seeded on control (n=10 per control) or IPF (n=4 control HLF and n=5 IPF HLF) derived matrix compared to basal condition. Right panel: dot plots with median showing the mRNA expression of PRRX1a and PRRX1b isoforms in control fibroblasts cultured on IPF derived matrix and stimulated with Imatinib (n=10), Nintedanib (n=7) or PDGFR V inhibitor (n=5) compared to basal condition. (Scale bar: 30 µm in phase contrast pictures and 15 µm in the immunofluorescence ones) Abbreviations: Control (Cont), Human lung fibroblast (HLF), Elastic/Young modulus (EM), PHAL (Phalloidin), COL1 (Collagen 1). Mann Whitney U test, *p≤0.05 **p≤0.01; Wilcoxon signed-rank test $ p≤0.05.
-
Figure 3—source data 1
The zip folder contains the data presented in panels A-C and E (in an Excel document).
- https://cdn.elifesciences.org/articles/79840/elife-79840-fig3-data1-v2.zip
Figure 3—figure supplement 1
Regulation of PRRX1 protein expression by growth factors as assayed by qPCR, immunoblots and immunofluorescence.
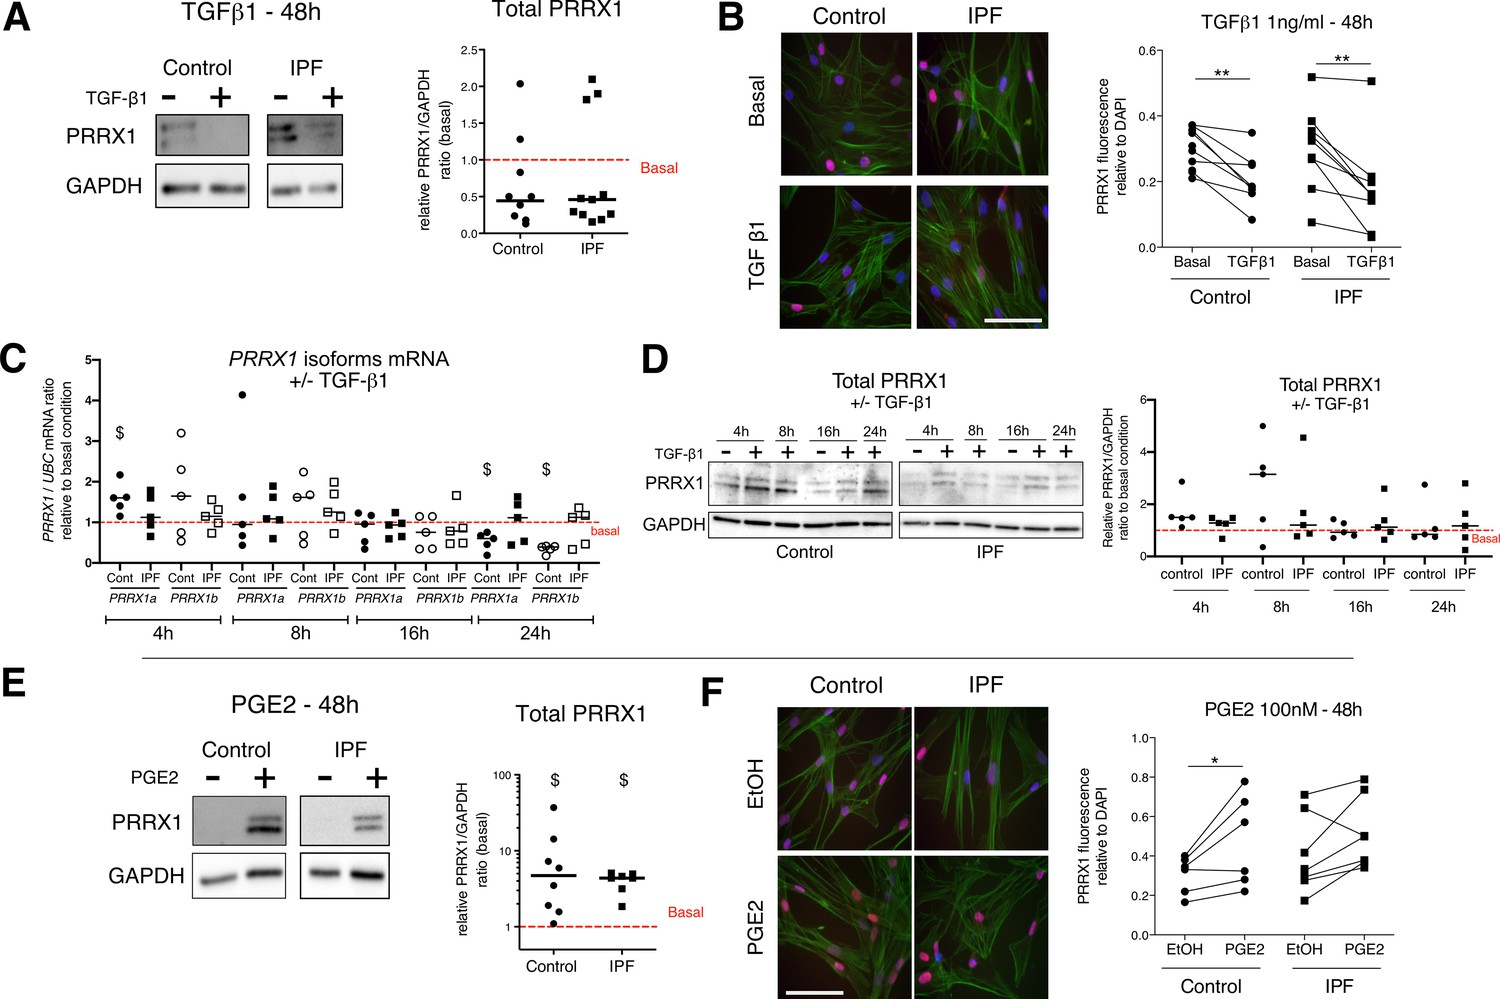
(A) Immunoblot showing PRRX1 expression in control and IPF primary Human lung fibroblasts stimulated 48 hr with TGF-β1. GAPDH was used as loading control. Middle panel: quantification of PRRX1 relative expression to GAPDH in control (circle, n=9) and IPF (square, n=11) lung fibroblasts stimulated for 48 hr with TGF-β1 compared to basal condition (red dashed line). (B) Representative immunofluorescence images of PRRX1 expression (red) in control and IPF lung fibroblasts at basal level or stimulated for 48 hr with TGF-β1 (1 ng/ml). DAPI was used as loading control. Actin fibers (green) were stained with Phalloidin. The quantification of PRRX1 relative expression to DAPI in control (circle, n=8) and IPF (square, n=9) lung fibroblasts at basal level or stimulated 48 hr with TGF-β1 is displayed as dot plot with median on the lower panel. (C) Time course of PRRX1A (black) and PRRX1B (white) mRNA expression levels in control (circle, n=5) and IPF fibroblasts (square, n=5) after TGF-β1 stimulation (1 ng/ml) for 4, 8, 16, and 24 hr compared to basal condition (red dashed line). (D) Representative immunoblots showing PRRX1 expression levels in control and IPF fibroblasts after TGF-β1 stimulation (1 ng/ml) for 4, 8, 16, and 24 hr compared to basal condition. GAPDH was used as loading control. Right panel: quantification of PRRX1 relative expression to GAPDH in control (circle, n=5) and IPF (square, n=5) lung fibroblasts stimulated for 4, 8, 16, and 24 hr with TGF-β1 compared to basal condition (red dashed line). (E) Immunoblot showing PRRX1 expression in control and IPF primary Human lung fibroblasts stimulated 48 hr with PGE2. GAPDH was used as loading control. Middle panel: quantification of PRRX1 relative expression to GAPDH in control (circle, n=8) and IPF (square, n=7) lung fibroblasts stimulated for 48 hr with PGE2 compared to basal condition (red dashed line). (F) Representative immunofluorescence images of PRRX1 expression (red) in control and IPF lung fibroblasts stimulated for 48 hr with EtOH or PGE2 (100 nM). Nuclei were stained with DAPI. Actin fibers (green) were stained with Phalloidin. The quantification of PRRX1 expression relative to DAPI signal in control (circle, n=6) and IPF (square, n=7) lung fibroblasts stimulated for 48 hr with EtOH or PGE2 are displayed as dot plot on the bottom. (Scale bar: 50 µm), (Abbreviations: Phalloidin (PHAL)). Mann Whitney U test, *p≤0.05, **p≤0.01, Wilcoxon signed-rank test $ p≤0.05.
-
Figure 3—figure supplement 1—source data 1
The zip folder contains the data presented in panels A-F (in an Excel document).
Labelled (.pdf) and raw (folder) blot images showed in panels A,D, and E are also included.
- https://cdn.elifesciences.org/articles/79840/elife-79840-fig3-figsupp1-data1-v2.zip
Figure 4 with 1 supplement
PRRX1 knock down decreased cell proliferation.
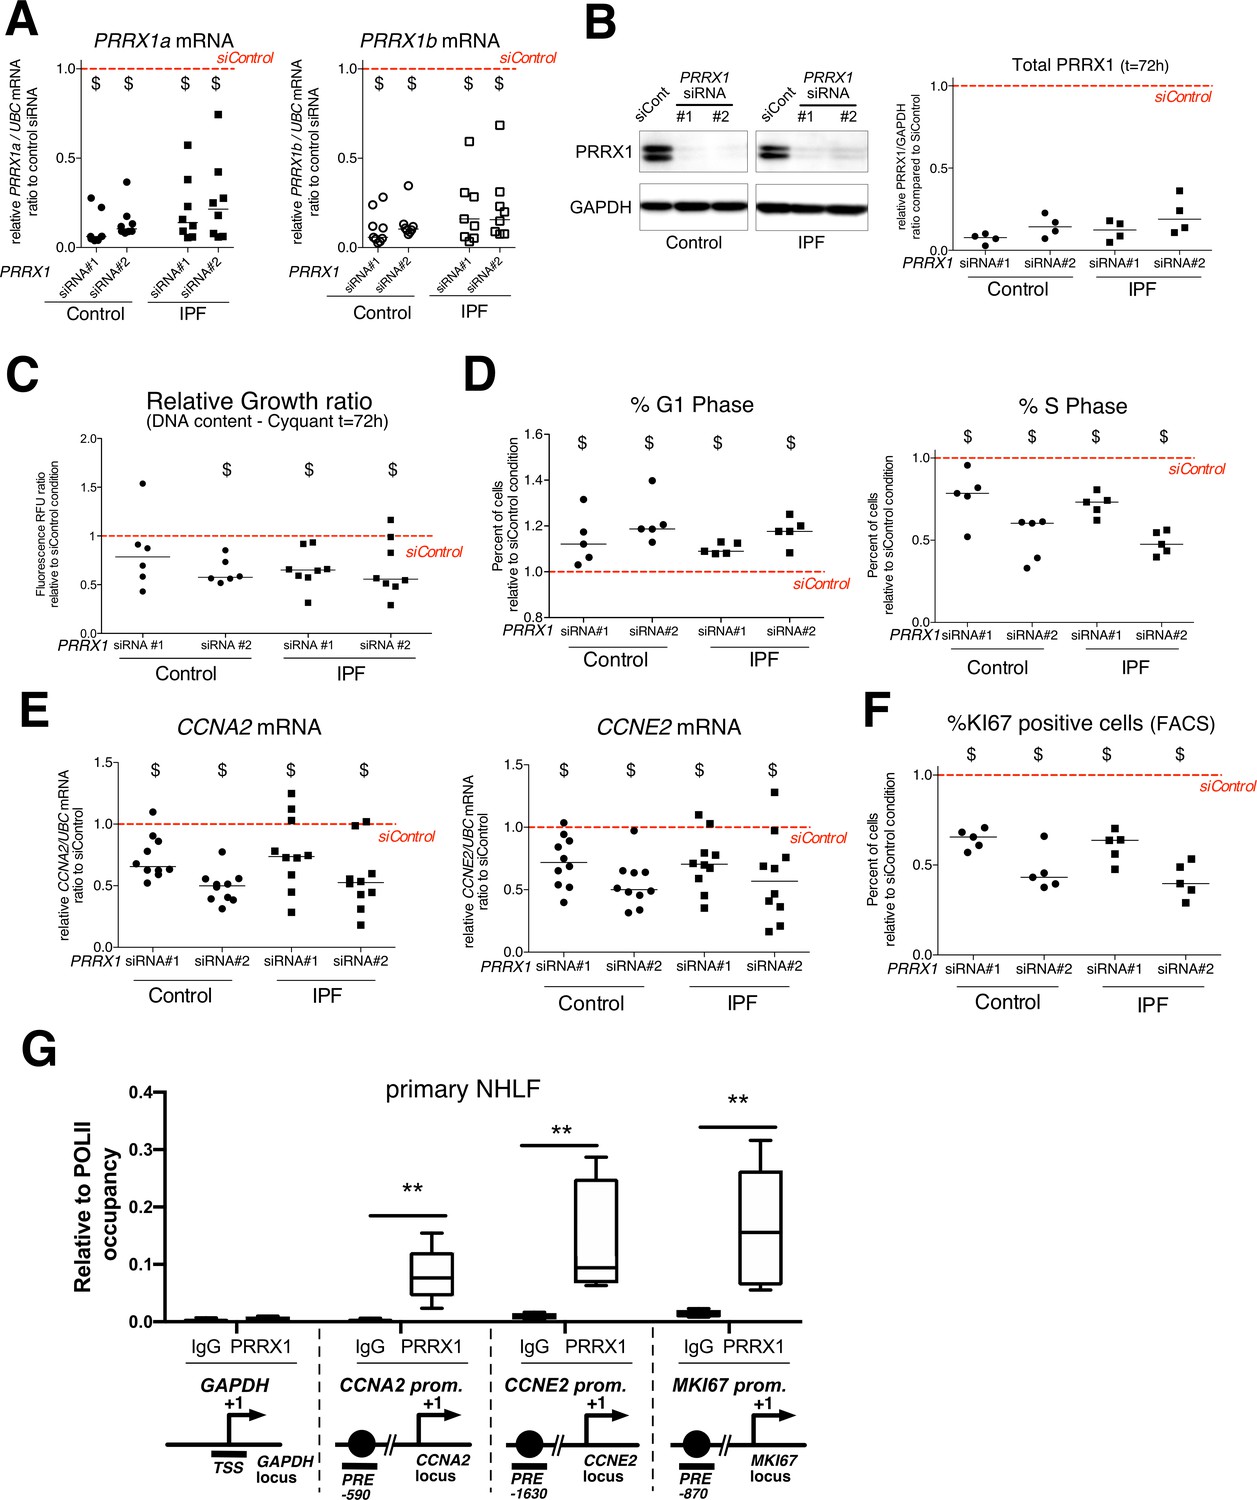
(A) Dot plots with median showing PRRX1a (black) and PRRX1b (white) mRNA expression relative to the siControl condition (red dashed line) in control (circle) and IPF (square) fibroblasts (n=8 per group) treated for 72 hr with PRRX1 siRNA (#1 or #2). (B) Immunoblot showing PRRX1 expression (n=4) in control and IPF fibroblasts treated 72 hr with PRRX1 siRNA (#1 or #2) or siControl. The quantification of PRRX1 expression relative to GAPDH (loading control) is displayed as dot plot with median. (C) Dot plots with median showing the relative growth ratio of control (n=6) and IPF (n=8) fibroblasts stimulated 72 hr with FCS 10% and treated with PRRX1 siRNA compared to siControl. (D) Dot plots with median showing the percent of cells in G1 (right) or S (left) phase in control and IPF fibroblasts (n=5) stimulated 72 hr with FCS and PRRX1 siRNA relative to siControl. (E) Dot plots with median showing mRNA expression of CCNA2 and CCNE2 relative to siControl in control and IPF fibroblasts stimulated 72 hr with FCS and treated with PRRX1 siRNA (n=10). (F) Dot plots with median showing the percent of cells positive for Ki67 marker in control and IPF fibroblasts stimulated 72 hr with FCS 10% and treated with PRRX1 siRNA relative to siControl (n=5). (G) ChIP analysis for PRRX1 recruitment at the promoter of GAPDH, CCNA2, CCNE2, and MKI67 in NHLF (n=5) relative to RNA POL-II occupancy, displayed as boxes with median and min to max. The diagrams of the different loci are showing the PRRX1 response element position relative to the TSS. The PCR amplified regions are underscored. Abbreviations: FCS (fetal calf serum); TSS (transcription starting site); IgG (Immunoglobulin); PRE (PRRX1 responses element); SRE (SRF response element), control siRNA sequence (siControl). Wilcoxon signed-rank test, $ p≤0.05, Wilcoxon matched-paired signed rank test ** p<0.01.
-
Figure 4—source data 1
The zip folder contains the data presented in panels A-G (in an Excel document).Labelled (.pdf) and raw (folder) blot images showed in panel B are also included.
- https://cdn.elifesciences.org/articles/79840/elife-79840-fig4-data1-v2.zip
Figure 4—figure supplement 1
PRRX1 inhibition impacted fibroblast proliferation.
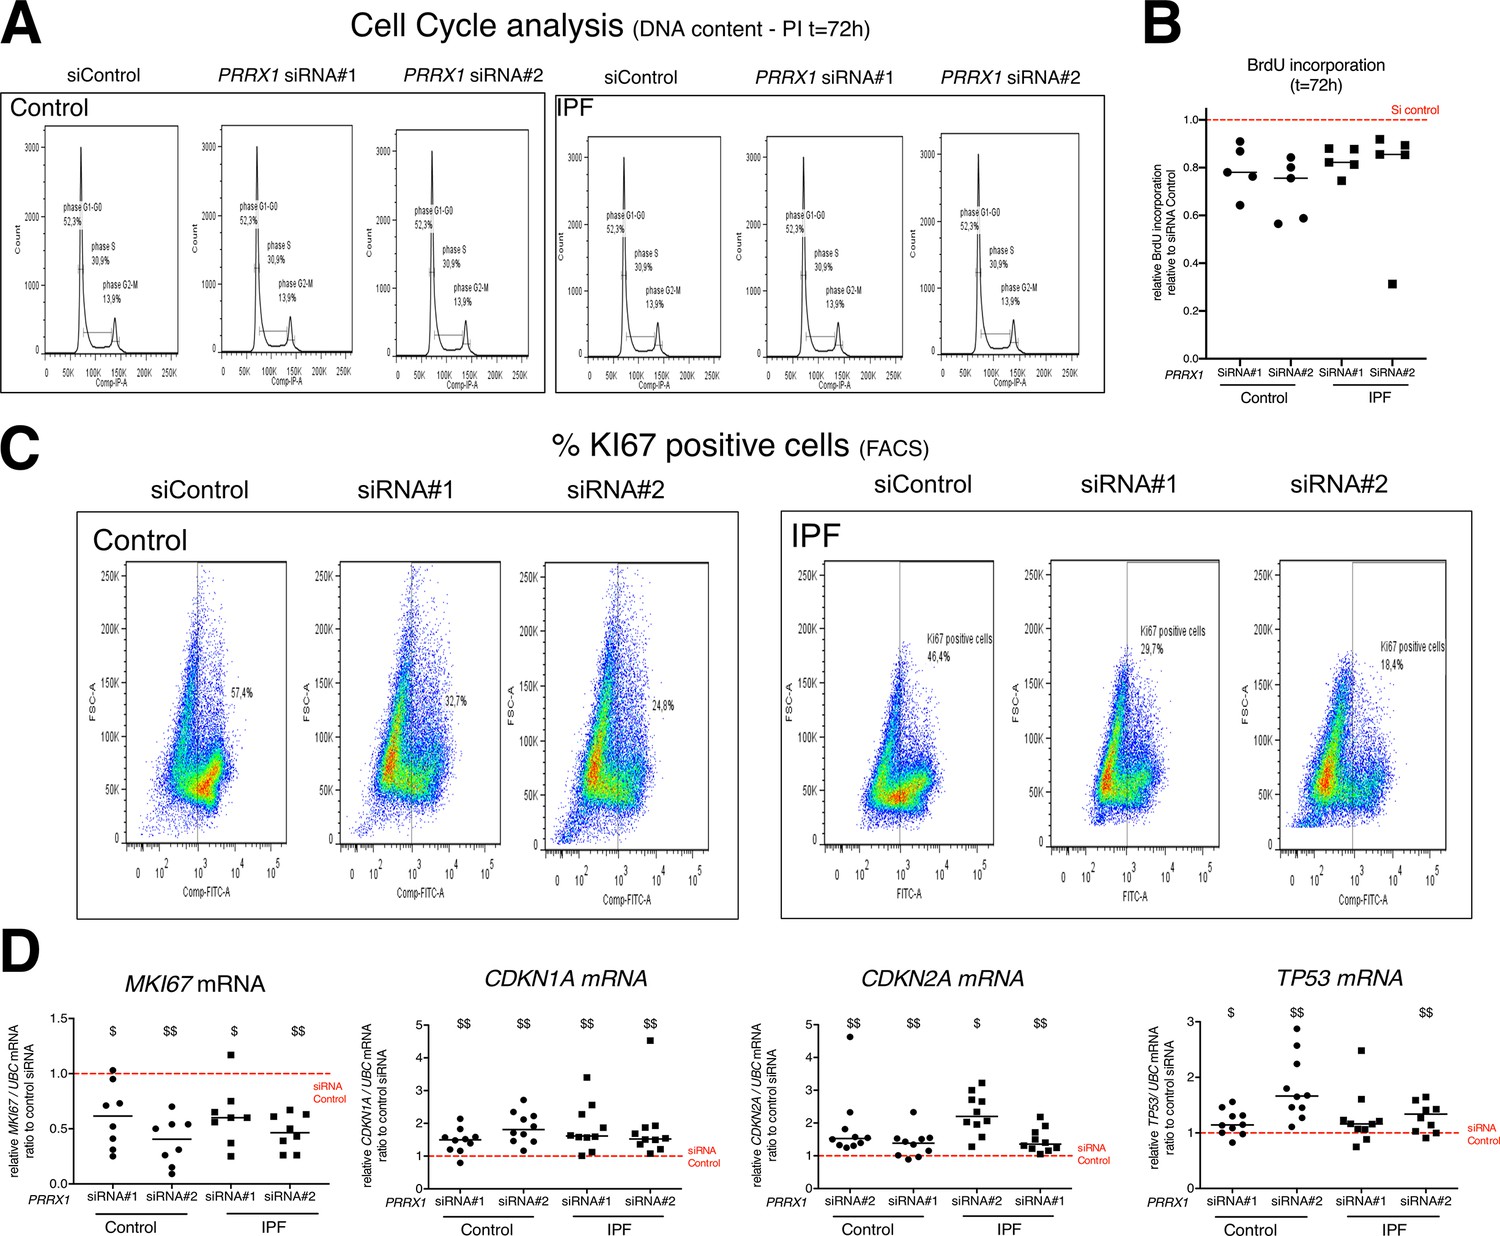
(A) Representative flow cytometry analysis of DNA content (n=5 per group) of control (upper panel) and IPF (lower panel) lung fibroblasts stimulated 72 hr with FCS 10% and treated with PRRX1 siRNA (#1 or #2) or siControl. (B) Dot plots with median showing the relative BrdU incorporation in control (circle) and IPF (square) fibroblasts stimulated 72 hr with FCS 10% and treated with PRRX1 siRNA relative to siControl (n=5 per group). (C) Representative flow cytometry analysis of Ki67-positive cells (n=5 per group) of control (top panel) and IPF (bottom panel) lung fibroblasts stimulated 72 hr with FCS 10% and treated with PRRX1 siRNA (#1 or #2) or siControl. (D) Dot plots with median showing the mRNA expression of MKI67, CDKN2A, CDKN1A and TP53 relative to the siControl condition in control (circle) and IPF (square) lung fibroblasts (n=8–10 per group) stimulated 72 hr with FCS 10% and treated with PRRX1 siRNA (#1 or #2). smid(Abbreviations: control siRNA sequence (siControl); Fluorescence-activated cell sorting (FACS)). Wilcoxon signed-rank test $ p≤0.05 $$ p≤0.01.
-
Figure 4—figure supplement 1—source data 1
The zip folder contains the data presented in panels B and D (in an Excel document).
- https://cdn.elifesciences.org/articles/79840/elife-79840-fig4-figsupp1-data1-v2.zip
Figure 5 with 5 supplements
PRRX1 inhibition decreased myofibroblast differentiation upon TGF-β1 stimulation.
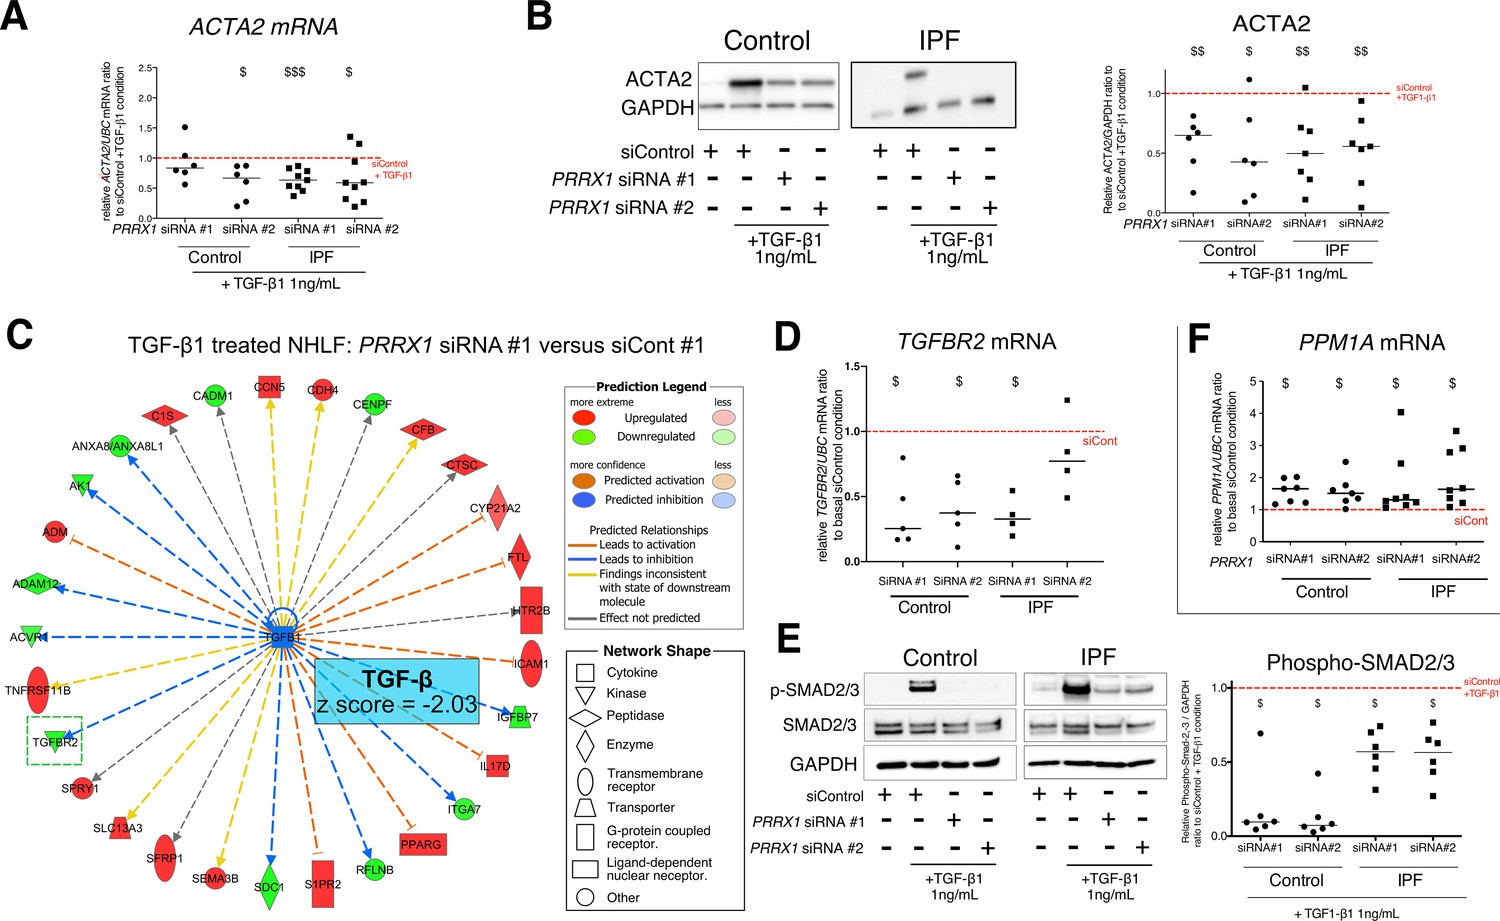
(A) Dot plots with median showing the mRNA expression of ACTA2 relative to the siControl +TGF-β1 condition (red dashed line), in control (circle, n=6) and IPF (square, n=9) lung fibroblasts treated with TGF-β1 and PRRX1 siRNA (#1 or #2). (B) Immunoblot showing ACTA2 expression in control (n=6) and IPF (n=7) fibroblasts treated with siControl in absence or presence of TGF-β1 or with PRRX1 siRNA and TGF-β1. The quantification of ACTA2 expression relative to GAPDH (loading control) in control and IPF fibroblasts treated with control or PRRX1 siRNA in presence of TGF-β1 relative to siControl +TGF-β1 condition is displayed as dot plot with median on the right. (C) Ingenuity Pathway Analysis of whole transcriptome in NHLF treated for 48 hr with PRRX1 siRNA in the presence of TGF-β1 indicated that the best predicted upstream regulator was TGFB1 (z score = −2.03, PRRX1 siRNA#1 versus siControl#1, n=2). Inhibition of TGFBR2 is framed with a green dashed border. Figure legend displays molecules and function symbol types and colors. (D) Dot plots with median showing the mRNA expression of TGFBR2 (n=4 control HLF and n=5 IPF HLF) relative to siControl in control and IPF fibroblasts treated for 48 hr with PRRX1 siRNA. (E) Immunoblot showing phospho-SMAD2/3 and SMAD2/3 expression in control and IPF fibroblasts treated for 30 min with TGF-β1 after 48 hr transfection with PRRX1 siRNA. The quantification of phospho-SMAD2/3 and SMAD2/3 expression relative to GAPDH (loading control) in control (n=6) and IPF (n=6) lung fibroblasts treated for 30 min with TGF-β1 after 48 hr transfection with PRRX1 siRNA relative to siControl +TGF-β1 condition (red dashed line), is displayed as dot plot with median on the right. (F) Dot plots with median showing the mRNA expression of PPM1A (n=7 control HLF and n=8 IPF HLF) relative to siControl in control and IPF fibroblasts treated for 48 hr with PRRX1 siRNA. Abbreviations: control siRNA sequence (siControl), β-Tubulin (TUB). Wilcoxon signed-rank test, $ p≤0.05, $$ p≤0.01, $$$ p≤0.001.
-
Figure 5—source data 1
The zip folder contains the data presented in panels A-B and D-F (in an Excel document).
Labelled (.pdf) and raw (folder) blot images showed in panels B and E are also included.
- https://cdn.elifesciences.org/articles/79840/elife-79840-fig5-data1-v2.zip
Figure 5—figure supplement 1
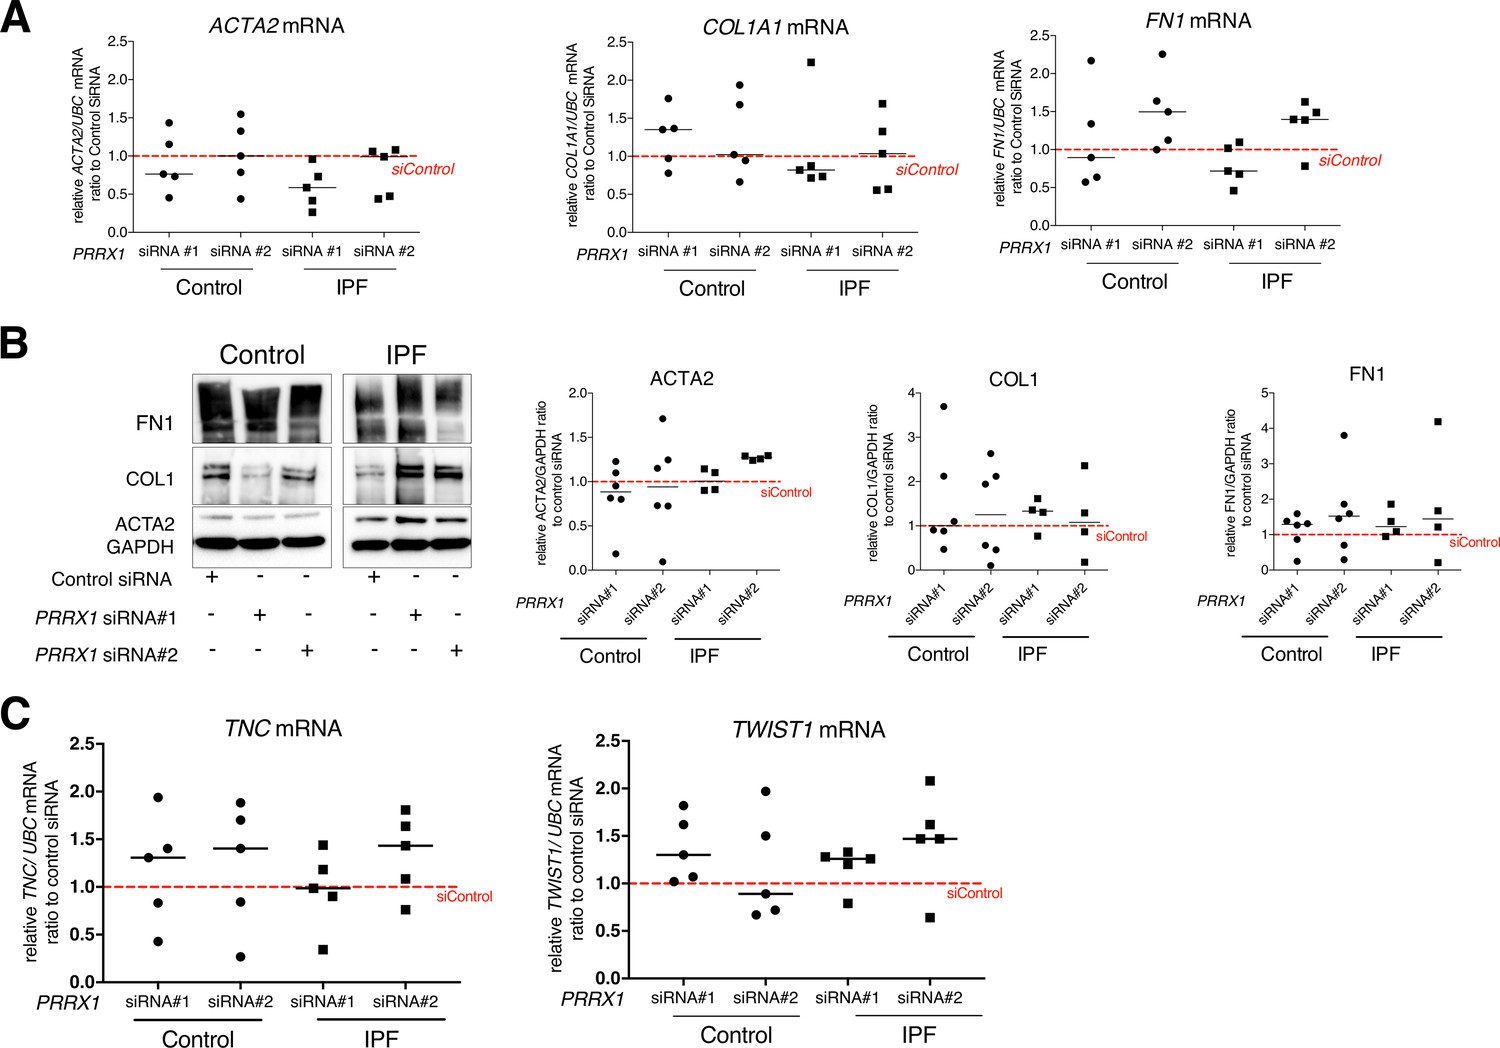
PRRX1 inhibition did not modulate the basal expression of myofibroblastic markers in control and IPF fibroblasts.
(A) Dot plots with median showing the mRNA expression of ACTA2, COL1A1, and FN1 relative to the siControl condition (red dashed line), in control (circle) and IPF (square) lung fibroblasts (n=5 per group) treated for 48 hr with PRRX1 siRNA (#1 or #2). (B) Immunoblot showing FN1, COL1 and ACTA2 expression in control (n=6) and IPF (n=4) lung fibroblasts treated for 48 hr with siControl or PRRX1 siRNA (#1 or #2). GAPDH was used as loading control. Right part: quantification of COL1, FN1 and ACTA2 relative expression to GAPDH in control (circle) and IPF (square) lung fibroblasts treated for 48 hr with PRRX1 siRNA (#1 or #2) relative to the siControl condition (red dashed line). (C) Dot plots with median showing the mRNA expression of TNC and TWIST1 relative to the siControl condition (red dashed line), in control (circle) and IPF (square) lung fibroblasts (n=5 per group) treated for 48 hr with PRRX1 siRNA (#1 or #2). (Abbreviations: control siRNA sequence (siControl)).
-
Figure 5—figure supplement 1—source data 1
The zip folder contains the data presented in panels A-C (in an Excel document).
Labelled (.pdf) and raw (folder) blot images showed in panel B are also included.
- https://cdn.elifesciences.org/articles/79840/elife-79840-fig5-figsupp1-data1-v2.zip
Figure 5—figure supplement 2
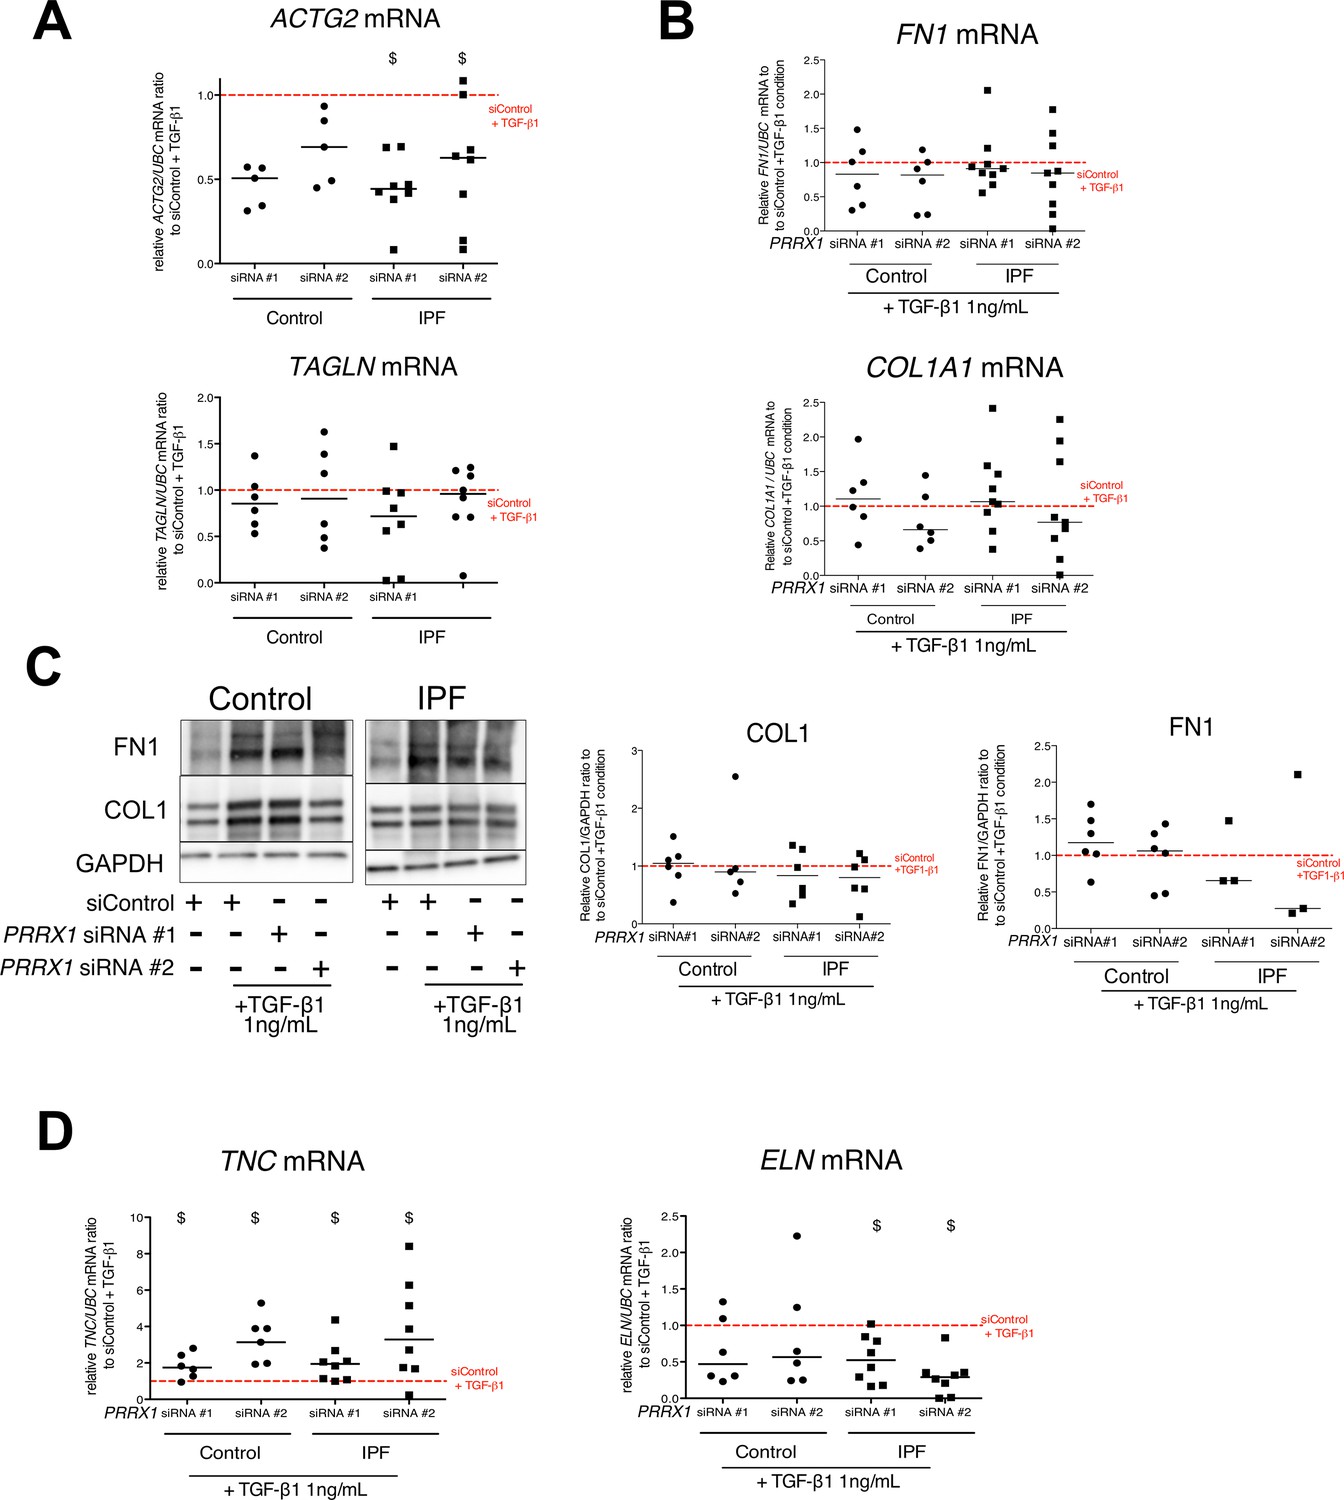
Effect of PRRX1 inhibition upon the expression of myofibroblastic markers after TGF-β1 stimulation in control and IPF fibroblasts.
(A) Dot plots with median showing the mRNA expression of ACTG2 and TAGLN relative to the siControl +TGF-β1 condition (red dashed line), in control (circle, n=5) and IPF (square, n=8) lung fibroblasts treated with TGF-β1 and PRRX1 siRNA (#1 or #2). (B) Dot plots with median showing the mRNA expression of FN1 and COL1A1 relative to the siControl +TGF-β1 condition (red dashed line), in control (circle, n=7) and IPF (square, n=10) lung fibroblasts treated with TGF-β1 with PRRX1 siRNA (#1 or #2). (C) Immunoblot showing FN1 and COL1 expression in control and IPF lung fibroblasts treated with control siRNA in absence or presence of TGF-β1 or with PRRX1 siRNA (#1 or #2) and TGF-β1. GAPDH was used as loading control. Middle panel: quantification of COL1 expression relative to GAPDH in control (circle, n=6) and IPF (square, n=7) lung fibroblasts treated with control or PRRX1 siRNA (#1 and #2) in presence of TGF-β1 relative to the siControl +TGF-β1 condition (red dashed line), is displayed as dot plot with median. Right panel: quantification of FN1 expressions relative to GAPDH in control (circle, n=7) and IPF (square, n=3) lung fibroblasts treated with control or PRRX1 siRNA (#1 and #2) in presence of TGF-β1 relative to the siControl +TGF-β1 condition (red dashed line), is displayed as dot plot with median. (E) Left part: dot plots with median showing the mRNA expression of TNC relative to the siControl +TGF-β1 condition (red dashed line), in control (circle, n=6) and IPF (square, n=8) lung fibroblasts treated with TGF-β1 and PRRX1 siRNA (#1 or #2). Right part: dot plots with median showing the mRNA expression of ELN relative to the siControl +TGF-β1 condition (red dashed line), in control (circle, n=6) and IPF (square, n=6) lung fibroblasts treated with TGF-β1 and PRRX1 siRNA (#1 or #2). (Abbreviations: TSS (transcription starting site); IgG (Immunoglobulin); PRE (PRRX1 responses element); SRE (SRF response element), control siRNA sequence (siControl)). Wilcoxon signed-rank test, $ p≤0.05.
-
Figure 5—figure supplement 2—source data 1
The zip folder contains the data presented in panels A-D (in an Excel document).
Labelled (.pdf) and raw (folder) blot images showed in panel C are also included.
- https://cdn.elifesciences.org/articles/79840/elife-79840-fig5-figsupp2-data1-v2.zip
Figure 5—figure supplement 3
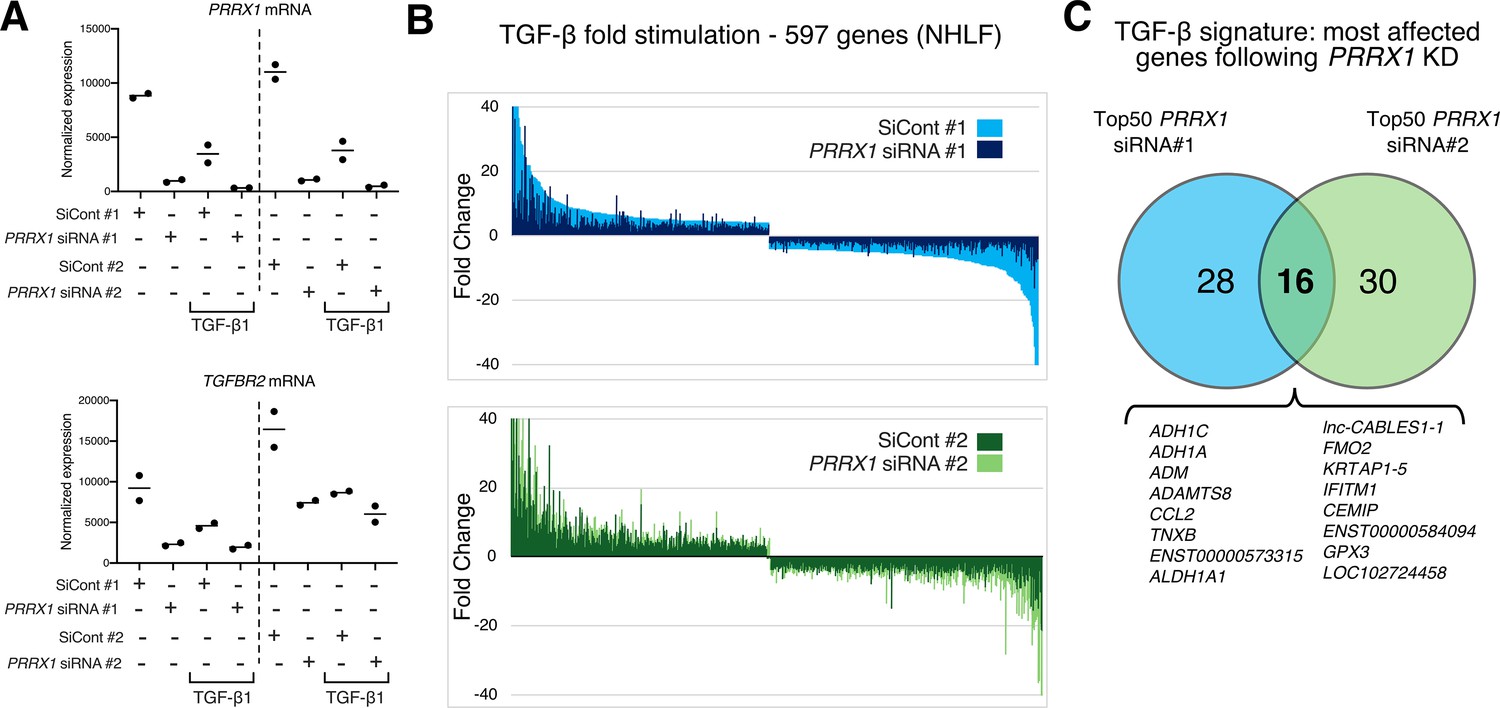
PRRX1 knock-down globally impacted TGF-β pathway response in NHLF.
(A–C) NHLF lung fibroblasts were first treated with control siRNA (#1 or #2) or with PRRX1 siRNA (#1 or #2) for 48 hr in the absence or presence of TGF-β for an additional 48 hr. RNA was extracted and analyzed at 96 hr using whole genome microarrays (n=2). (A) Dot blots showing normalized mean expression of PRRX1 and TGFBR2 in the different conditions (n=2). (B) Box plots showing the attenuation of the TGF-β response by PRRX1 siRNAs on the 597 most modulated genes by TGF-β in control conditions (threshold: log2 fold change >2, adj. p-Value <0.05, see Supplementary file 2). Average attenuation of the TGF-β response is 44.4 and 20% with siRNA#1 and #2, respectively. (C) Venn diagram showing the most affected genes following PRRX1 KD within the TGF-β signature in NHLF.
-
Figure 5—figure supplement 3—source data 1
The zip folder contains the data presented in panel A (in an Excel document).
- https://cdn.elifesciences.org/articles/79840/elife-79840-fig5-figsupp3-data1-v2.zip
Figure 5—figure supplement 4
PRRX1 TFs modulate TGF-β / SMAD signalling cascade by regulating TGFBR2 and PPM1A expressions.
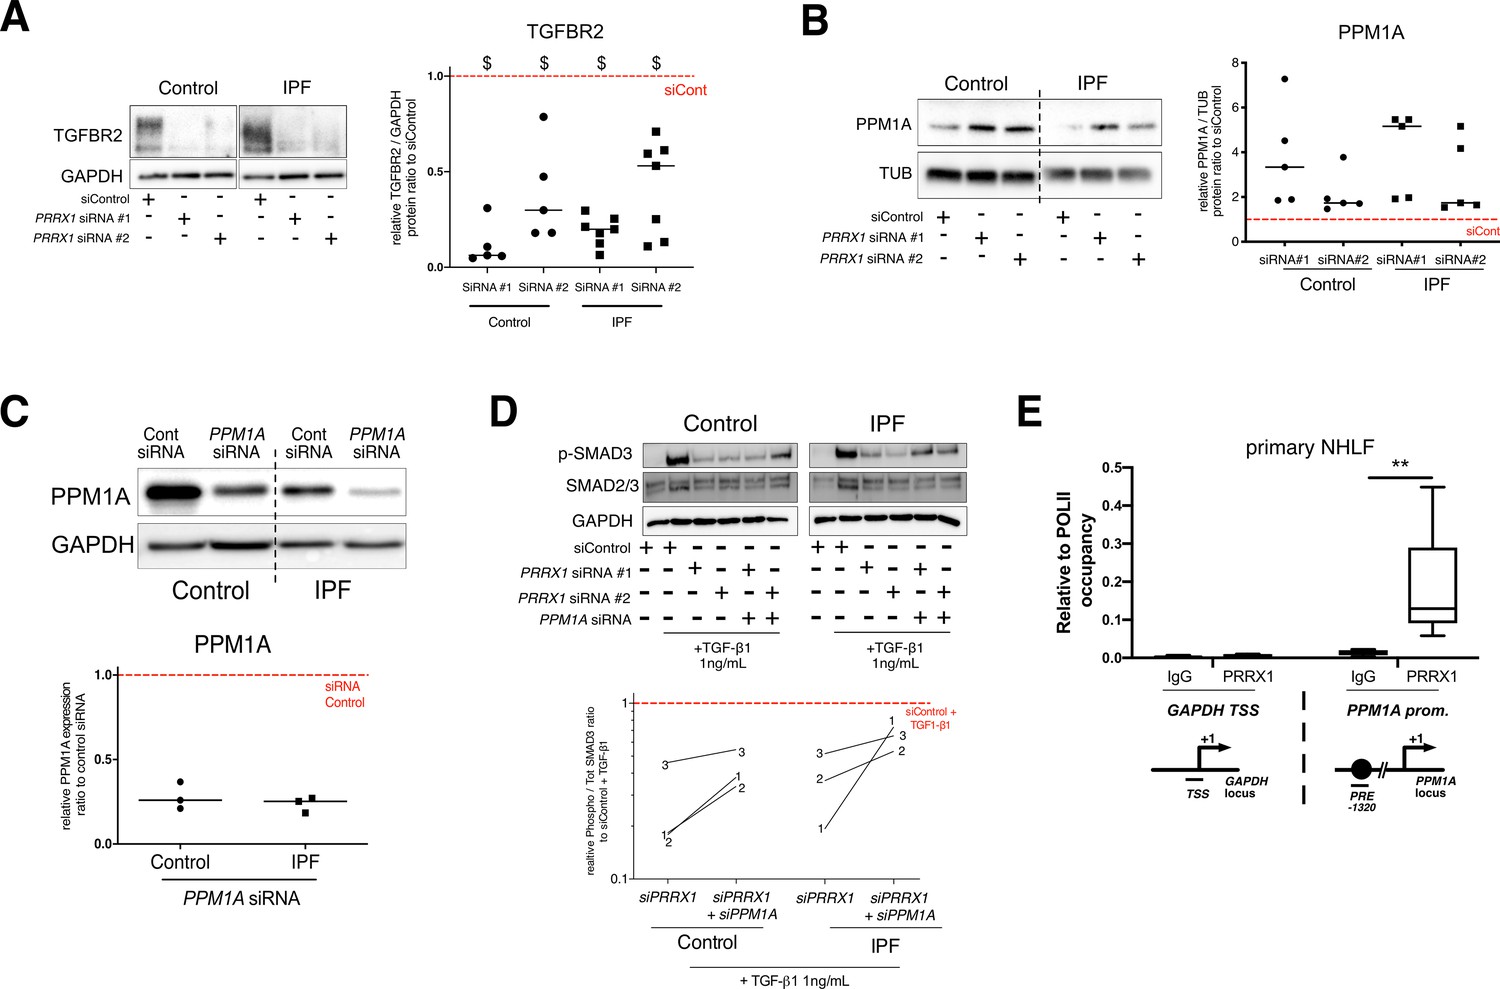
(A) Representative immunoblot showing TGFBR2 expression in control and IPF fibroblasts treated for 48 hr with PRRX1 siRNA. The quantification of TGFBR2 expression relative to loading controls in control (n=5) and IPF (n=7) fibroblasts treated for 48 hr with PRRX1 siRNA is displayed as dot plot with median. (B) Representative immunoblot showing PPM1A expression in control and IPF fibroblasts treated for 48 hr with PRRX1 siRNA. The quantification of PPM1A expression relative to loading controls in control (n=5) and IPF (n=5) fibroblasts treated for 48 hr with PRRX1 siRNA is displayed as dot plot with median. (C) Immunoblot showing PPM1A expression in control and IPF primary Human lung fibroblasts treated 48 hr with PPM1A siRNA or siControl. GAPDH was used as loading control. Quantification of PPM1A (n=3) expression relative to GAPDH in control (circle) and IPF (square) lung fibroblasts treated 48 hr with PPMA siRNA compared to the siControl condition (red dashed line). (D) Representative immunoblot (n=3) showing phospho-SMAD2/3 and SMAD2/3 expression in control and IPF lung fibroblasts treated 30 min with TGF-β1 after 48 hr transfection with PRRX1 siRNA (#1 or #2) and PPM1A siRNA. The quantification of phospho-SMAD2/3 and SMAD2/3 expression relative to GAPDH in control (circle) and IPF (square) lung fibroblasts treated for 30 min with TGF-β1 after 48 hr transfection with PRRX1 siRNA (#1 or #2) and PPM1A siRNA relative to the siControl +TGF-β1 condition (red dashed line), is displayed as connected line in the right part of the panel (n=3). (E) ChIP analysis for recruitment of PRRX1 at the promoter of GAPDH and PPM1A genes in NHLF (n=5). An unrelated control IgG was used as negative control. The results are expressed relative to RNA POL-II occupancy of a given locus and displayed as boxes with median and min to max. The schematic diagrams of the different loci are showing the PRE or SRE element positions relative to the TSS of the corresponding gene. The PCR amplified regions are underscored. (Abbreviations: control siRNA sequence (siControl), TSS (transcription starting site); IgG (Immunoglobulin); PRE (PRRX1 responses element); SRE (SRF response element), control siRNA sequence (siControl)). Wilcoxon signed-rank test, $ P≤0.05, Kruskal-Wallis test with Dunns post-test, **p≤0.01.
-
Figure 5—figure supplement 4—source data 1
The zip folder contains the data presented in panels A-E (in an Excel document).
Labelled (.pdf) and raw (folder) blot images showed in panels B and D are also included.
- https://cdn.elifesciences.org/articles/79840/elife-79840-fig5-figsupp4-data1-v2.zip
Figure 5—figure supplement 5
Prrx1 complete loss of function in mouse embryonic fibroblasts (MEFs) strongly inhibited myofibroblast differentiation upon TGF1-β1 stimulation but promoted lung spheroids formation.
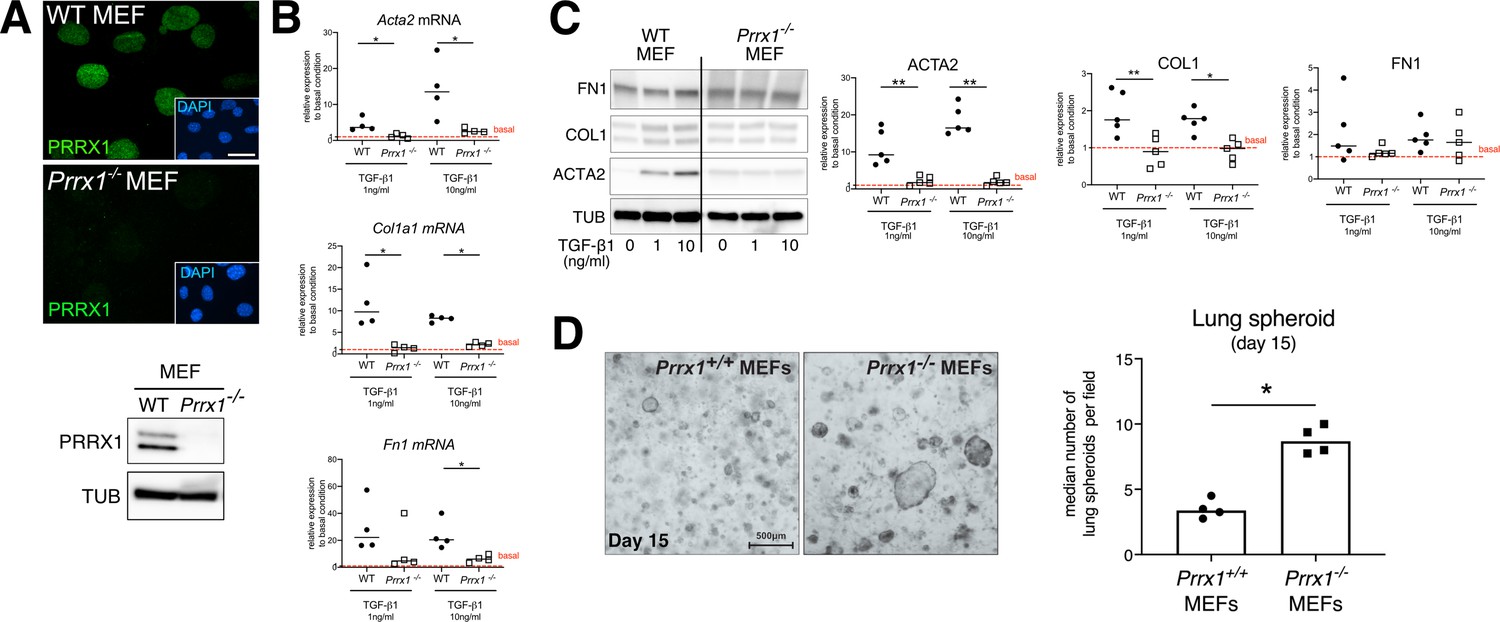
(A) Immunofluorescence pictures of PRRX1 in wild type (top panel) and Prrx1-/- MEFs (lower panel). Note the absence of PRRX1 nuclear staining in Prrx1-/- MEFs compared to WT ones. Nuclei were counterstained with DAPI (inserts in main panels). On the right, immunoblot confirming the lack of both PRRX1a and PRRX1b isoform expression Prrx1-/- MEFs compared to WT MEFs (Tubulin was used as loading gene). (B) Dot plots with median showing the mRNA expression of Acta2 (upper graph), Col1a (middle graph) and Fn1 (lower graph) in WT (black circle, n=4) and Prrx1-/- (white square, n=4) MEFs treated with 1 or 10 ng/ml of TGFβ1 for 48 hr, relative to untreated basal condition (red dashed line). (C) Representative immunoblot showing ACTA2, COL1 and FN1 expression in WT (n=5) and Prrx1-/- MEFs treated with 1 ng or 10 ng of TGFβ1 for 48 hr, relative to untreated basal condition (red dashed line). Tubulin was used as loading gene. Right panels: dot plots with median showing the protein expression of ACTA2 (upper graph), COL1 (middle graph) and FN1 (lower graph) in WT (black circle, n=5) and Prrx1-/- (white square, n=5) MEFs treated with 1 ng or 10 ng of TGFβ1 for 48 hr, relative to untreated basal condition (red dashed line). (D) Representative pictures of lung spheroids in matrigel (n=4 per group) derived from wild-type primary lung epithelial cells grown in presence of either Prrx1+/+ or Prrx1-/- MEFs for 15 days. Right panel: dot plots with median showing the median number of lung spheroid per field in presence of wild-type (black circle, n=4) or Prrx1-/- (black square, n=4) MEFs. (Scale bar: 50 µm, 20 μm (inserts) in (A); 500 μm in (D)). Abbreviations: Mouse embryonic fibroblasts (MEFs), Wild type (WT); Mann Whitney U test, *p≤0.05, **p≤0.01.
-
Figure 5—figure supplement 5—source data 1
The zip folder contains the data presented in panels B-D (in an Excel document).
Labelled (.pdf) and raw (folder) blot images showed in panels A and C are also included.
- https://cdn.elifesciences.org/articles/79840/elife-79840-fig5-figsupp5-data1-v2.zip
Figure 6 with 3 supplements
PRRX1 inhibition attenuates lung fibrosis in bleomycin murine model.
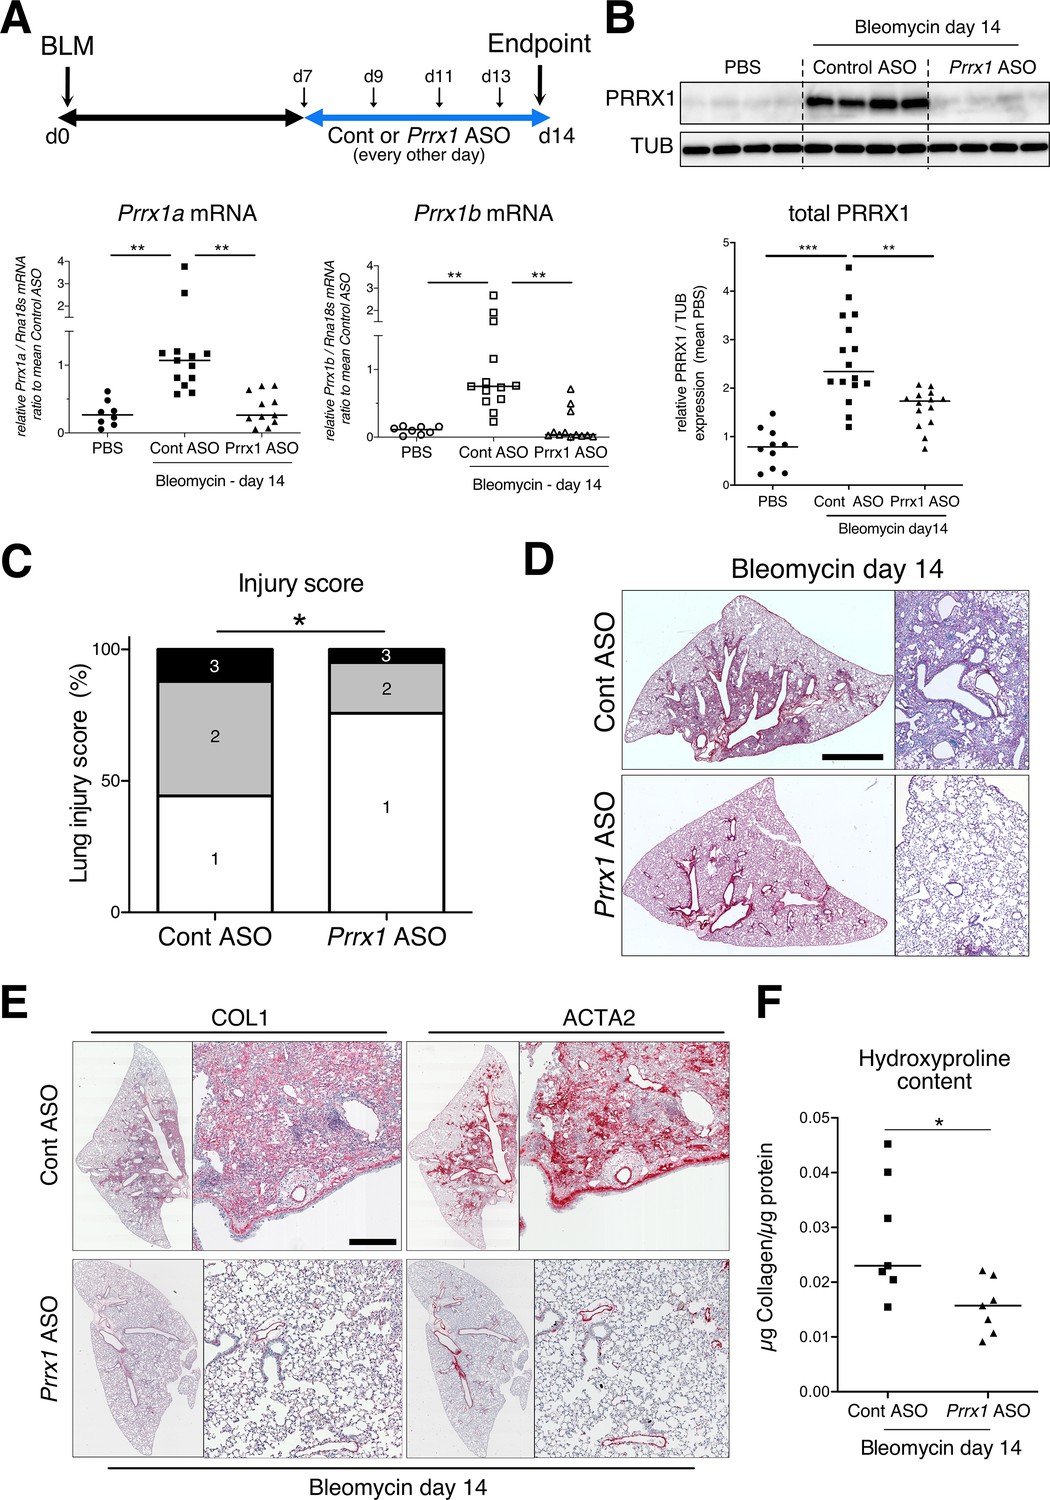
(A) Timeline of bleomycin and ASO treatments. Mice were first treated with bleomycin at day zero and then with control or Prrx1 ASO every other day from day 7, during the active fibrotic phase (in blue). Lungs were harvested at day 14. Lower part: dot plots with median showing the mRNA expression of Prrx1a (black) and Prrx1b (white) isoforms at day 14 (n=8) in PBS (circle) mice and bleomycin mice treated with control ASO (square, n=13) or PRRX1 ASO (triangle, n=11). (B) Immunoblot showing PRRX1 expression at day 14 in PBS mice and bleomycin mice treated with Control ASO or Prrx1 ASO. TUB was used as loading control. The quantification of PRRX1 expression relative to TUB at day 14 in PBS mice (circle, n=9) and bleomycin mice treated with Control ASO (square, n=15) or Prrx1 ASO (triangle, n=14) is displayed as dot plot with median on the lower panel. (C) Injury score at day 14 of bleomycin mice treated with Prrx1 ASO or Control ASO. (D) Representative images (n=7 per group) showing picrosirius staining (red) at day 14 in bleomycin mice treated with Control ASO or Prrx1 ASO. (E) Representative immunohistochemistry images (n=7 per group) showing COL1 (left panel) and ACTA2 (right panel) staining (red) at day 14 in bleomycin mice treated with Control ASO or Prrx1 ASO. Nuclei were counterstained with hematoxylin. (F) Dot plot with median showing the relative Collagen content as measured by hydroxyproline at day 14 in bleomycin mice treated with control ASO (square, n=7) or PRRX1 ASO (triangle, n=7). Scale bar: 80 µm in low-magnification images and 40 µm in high-magnification ones. Abbreviations: d (day), Control (Cont), Antisense oligonucleotide (ASO). Kruskal-Wallis test with Dunns post-test (A and B), Fisher’s exact test (C) and Mann Whitney U test (F); *p≤0.05, **p≤0.01, ***p≤0.001.
-
Figure 6—source data 1
The zip folder contains the data presented in panels A-C and F (in an Excel document).
Labelled (.pdf) and raw (folder) blot images showed in panel B are also included.
- https://cdn.elifesciences.org/articles/79840/elife-79840-fig6-data1-v2.zip
Figure 6—figure supplement 1
PRRX1 is increased during fibrotic phase in mice bleomycin-induced fibrosis.
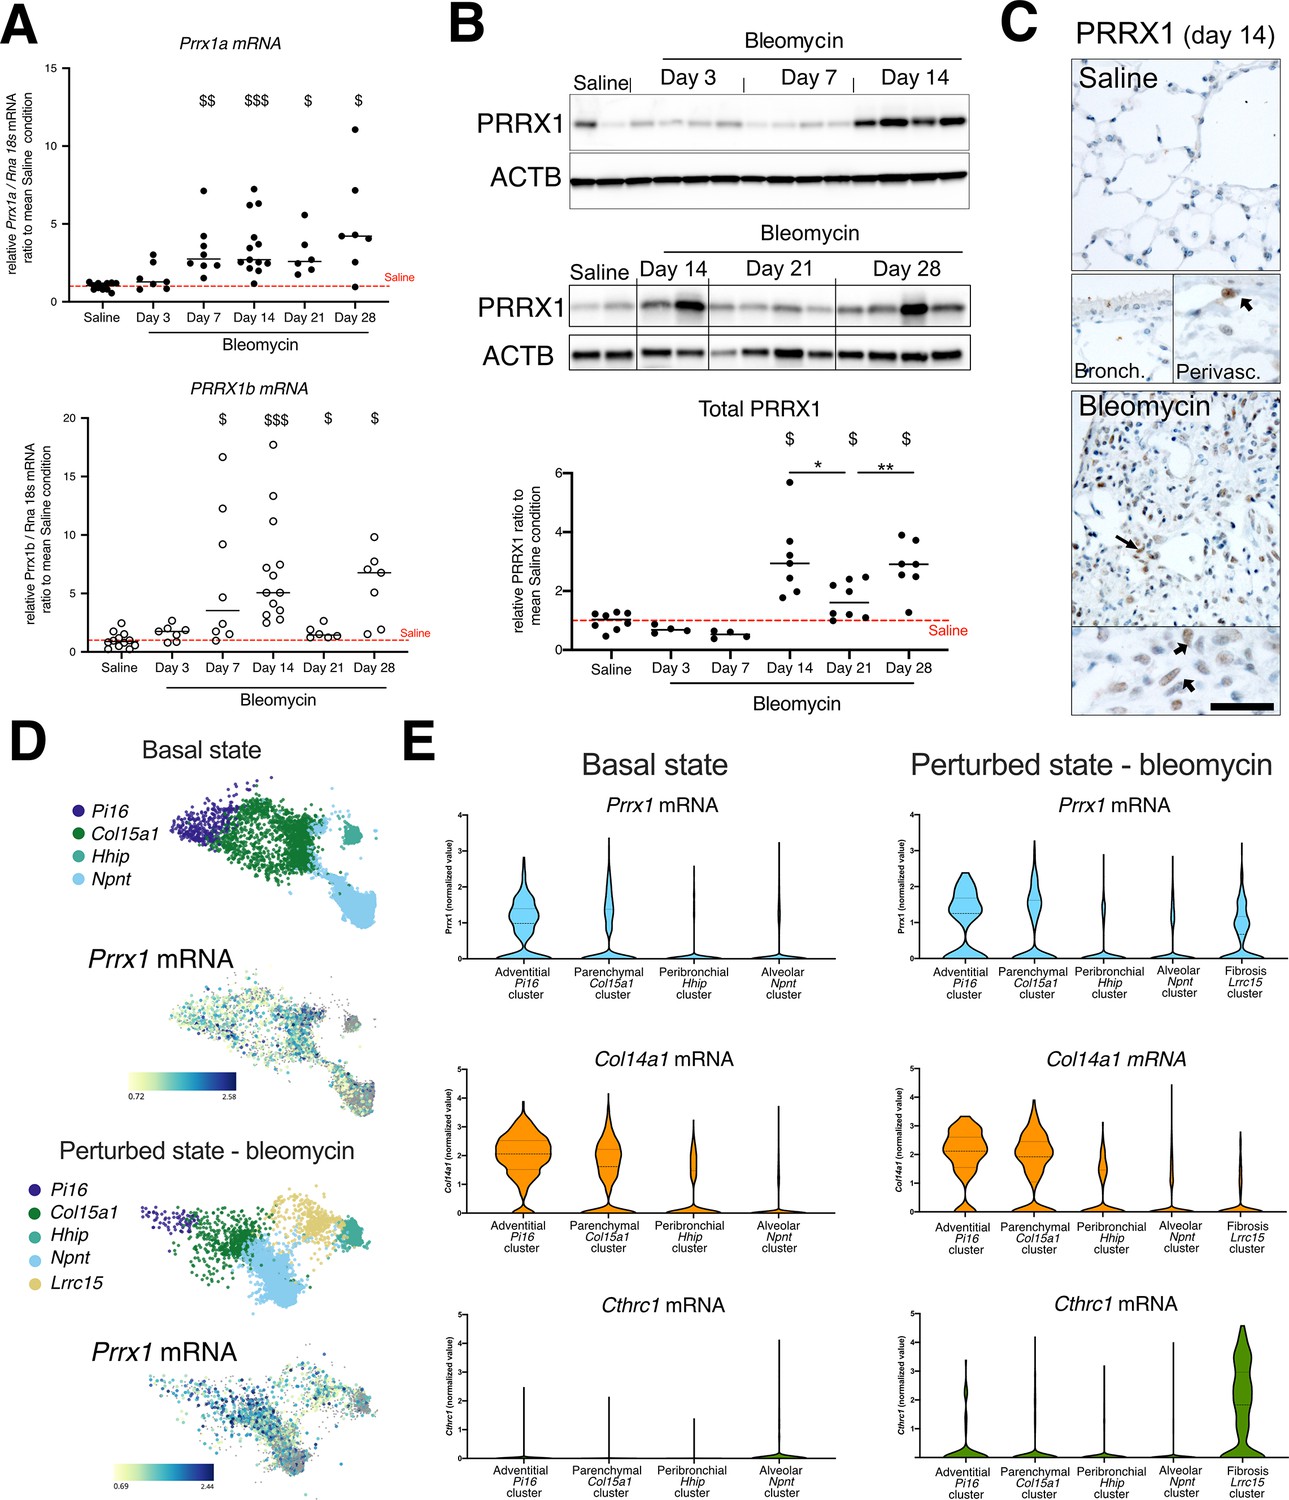
(A) Dot plots with median showing the mRNA expression of Prrx1a (black circle) and Prrx1b (white circle) isoforms in saline mice (n=12) and bleomycin-treated mice at day 3 (n=7), 7 (n=8) 14 (n=7), 21 (n=6), and 28 (n=7). (B) Immunoblot showing PRRX1 expression in saline and bleomycin-treated mice at days 3, 7, and 14 (upper panel) and at days 14, 21, and 28 (lower panel). ACTB was used as loading control. The quantification of PRRX1 expression relative to ACTB in saline and bleomycin mice is displayed as dot plot with median in the lower part of the panel. (C) Representative immunohistochemistry pictures (n=3 per group) showing PRRX1 staining (brown) in saline and bleomycin mice at day 14. Nuclei were counterstained with hematoxylin. Note the absence of PRRX1 staining in the bronchiolar epithelium. PRRX1-positive cells were only detected in the peri-vascular spaces (arrows) in naive mice lungs (lower left panels). In bleomycin-treated mice, PRRX1-positive cells (arrow) were detected in the remodeled/fibrotic area (right panels). (D) UMAP plots describing the distribution of PRRX1 expressing cells in Pdgfra-positive cell lineage clusters in the lung at baseline (upper panels) or in perturbed/fibrotic state after a bleomycin challenge (lower panels). Cell lineage clusters were drawn with BioTuring software using the lung data from FibroXplorer datasets (Buechler et al., 2021). The labeling of each cell cluster is shown on the top and Prrx1 relative expression in those clusters on the bottom. Note the presence of Prrx1-positive cells in the Pi16 ‘adventitial fibroblast’ cluster and in the Col15a1 ‘parenchymal fibroblast’ cluster in the basal state as well as in the Lrrc15 ‘fibrosis fibroblast’ cluster in the perturbed/fibrotic state. Prrx1-positive cells were scarce in the Hhip ‘peribronchial fibroblast’ and Npnt ‘alveolar fibroblast’ clusters in both conditions. (E) Violin plots visualizing Prrx1 (blue), Col14a1 (orange), and Chtrc1 (green) mRNA expression from (D) in each fibroblast type stratified by disease states (basal state on the left and fibrotic state on the right). Note that Prrx1 mRNA expression was associated with stromal clusters Pi16+ and Col15a+fibroblasts with Col14a1 mRNA in both conditions and expressed with Cthrc1 mRNA in the fibrosis associated subpopulation (Lrrc15+ Fibroblasts). Scale bar: 30 µm in low-magnification images and 15 µm in high-magnification ones.
-
Figure 6—figure supplement 1—source data 1
The zip folder contains the data presented in panels A-B (in an Excel document).
Labelled (.pdf) and raw (folder) blot images showed in panel B are also included.
- https://cdn.elifesciences.org/articles/79840/elife-79840-fig6-figsupp1-data1-v2.zip
Figure 6—figure supplement 2
lack of haploinsufficiency and lung fibrosis reduction in Prrx1+/- +/- mice.
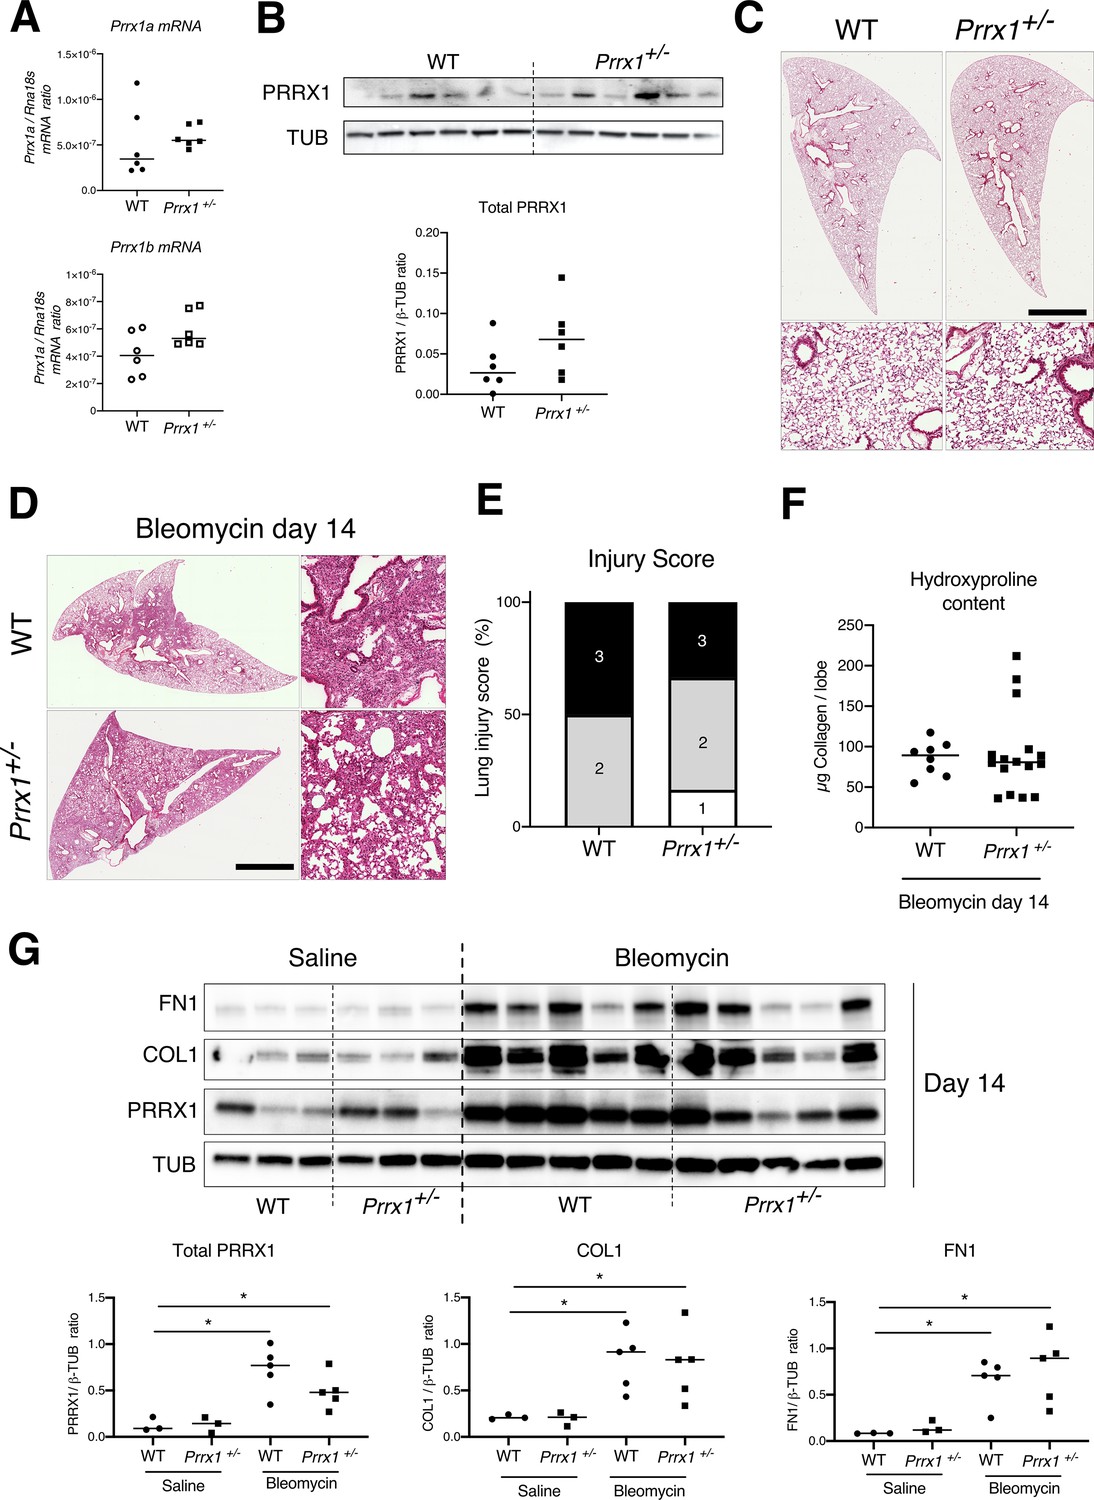
(A) Dot plots with median showing the mRNA expression of Prrx1a (black) and Prrx1b (white) isoforms in naive wild type (circle) and Prrx1+/- (square) mice (n=6 per group). (B) Immunoblot showing PRRX1 expression in naive wild type mice and Prrx1+/- +/-. TUB was used as loading control. The quantification of PRRX1 expression relative to TUB at day 14 in naive wild type (circle) and Prrx1+/- (square) mice is displayed as dot plot with median on the lower panel. Note the lack of Prrx1 haploinsufficiency at both mRNA and protein levels in Prrx1 heterozygous mice. No difference in COL1, FN1 and ACTA2 levels were also observed in Prrx1+/- +/- compared to wild type ones (data not shown). (C) Representative hematoxylin – eosin staining images (n=6 per group) showing no histological differences between naive wild type and Prrx1+/- +/-. (D) Representative hematoxylin – eosin staining images (n=7 at least per group) showing no histological differences between wild type and Prrx1+/- +/- at day 14 after bleomycin insult. (E) Injury score of wild type and Prrx1+/- +/- treated bleomycin at day 14 (at least n=7 per group). (F) Dot Plot with median showing the Collagen lung content (µg per lobe) as measured by hydroxyproline in wild type (n=8) and Prrx1+/- (n=16) mice treated with bleomycin at day 14. (G) Representative immunoblot showing FN1, COL1, and PRRX1 expression in wild type and Prrx1+/- +/- treated with saline or bleomycin at day 14. TUB was used as loading control. Lower panels: quantification of PRRX1, COL1, and FN1 relative expression to TUB in wild type and Prrx1+/- +/- treated with saline (n=3 per group) or bleomycin (n=5 per group) at day 14. Note that lung fibrosis is not reduced in Prrx1 heterozygous mice compared to wild type animals after bleomycin treatment at day 14 (D–G). (Scale bar in D: 80 µm in low magnification images and 40 µm in high-magnification ones); (Abbreviations: Wild type (WT), β-TUB (beta-Tubulin)). Kruskal-Wallis test with Dunns post-test, *p≤0.05.
-
Figure 6—figure supplement 2—source data 1
The zip folder contains the data presented in panels A-B and E-G (in an Excel document).
Labelled (.pdf) and raw (folder) blot images showed in panels B and G are also included.
- https://cdn.elifesciences.org/articles/79840/elife-79840-fig6-figsupp2-data1-v2.zip
Figure 6—figure supplement 3
PRRX1 inhibition decreases the accumulation of myofibroblasts as well as the expression of fibrosis and inflammatory markers in bleomycin mice.
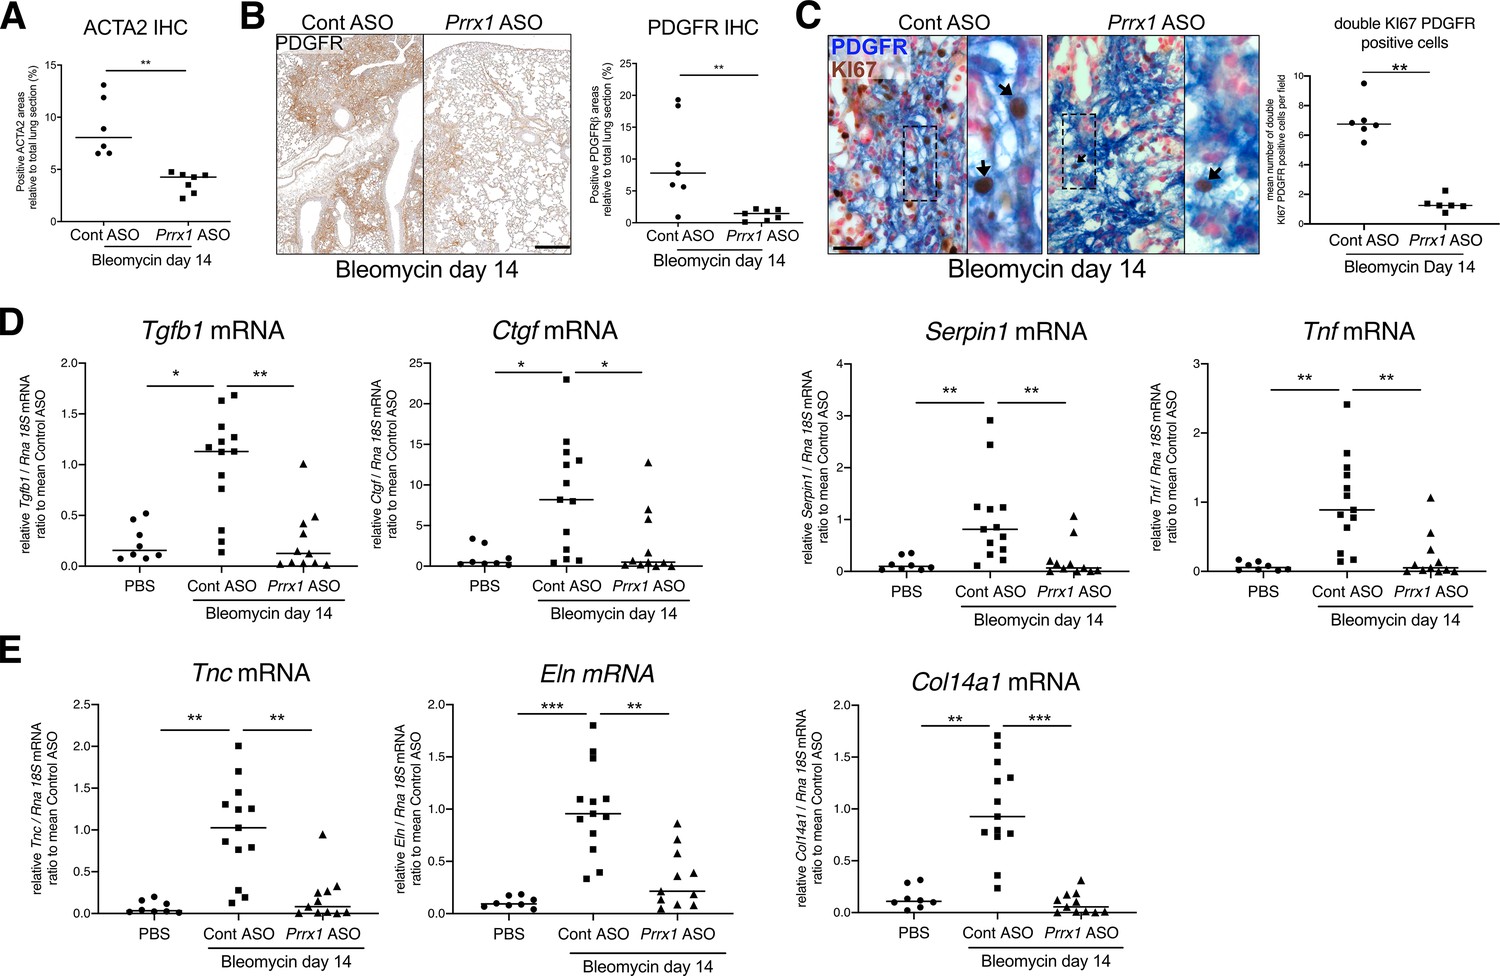
(A) Dot plots with median showing the percentage of ACTA2-positive areas (see Figure 7e) in bleomycin mice treated with Control ASO (circle, n=6) or Prrx1 ASO (square, n=7). (B) Representative PDGFR immunohistochemistry images (brown chromogen) at day 14 in bleomycin mice treated with Control ASO or Prrx1 ASO. Right part: dot plots with median showing the percentage of PDGFR-positive areas (n=7 per group) in bleomycin mice treated with control ASO (circle) or Prrx1 ASO (square). (C) Representative immunohistochemistry images (n=6 per group) showing KI67 (Brown chromogen, nuclear staining) and PDGFR (Blue chromogen) in bleomycin mice treated with Control ASO (circle) or Prrx1 ASO (square) at day 14. Inserts in (C): high magnification of the black dashed boxes in the main left and right panels. Right part: dot plots with median showing the percentage of double positive cells for KI67 and PDGFR per field (see arrows) within PDGFR-positive areas in bleomycin mice treated with control ASO (circle) or Prrx1 ASO (square). Nuclei were counterstained with Nuclear Fast Red. (D) Dot plots with median showing the mRNA expression of fibrotic markers and such as Tgfb1, Ctgf, Serpin1 and Tnf at day 14 in PBS mice (circle, n=8) and bleomycin mice treated with Control ASO (square, n=13) or Prrx1 ASO (triangle, n=11). (E) Dot plots with median showing the mRNA expression of ECM components such as Col14a1, Eln and Tnc at day 14 in PBS mice (circle, n=8) and bleomycin mice treated with Control ASO (square, n=13) or Prrx1 ASO (triangle, n=11). Scale bar: 40 µm in (B), 25 µm and 10 µm (inserts) in (C). (Abbreviations: Immunohistochemistry (IHC), Control (Cont), Antisense oligonucleotide (ASO)). Kruskal-Wallis test with Dunns post-test, *p≤0.05, **p≤0.01, ***p≤0.001.
-
Figure 6—figure supplement 3—source data 1
The zip folder contains the data presented in panels A-E (in an Excel document).
- https://cdn.elifesciences.org/articles/79840/elife-79840-fig6-figsupp3-data1-v2.zip
Figure 7 with 1 supplement
PRRX1 inhibition decreases fibrosis markers in bleomycin mice.
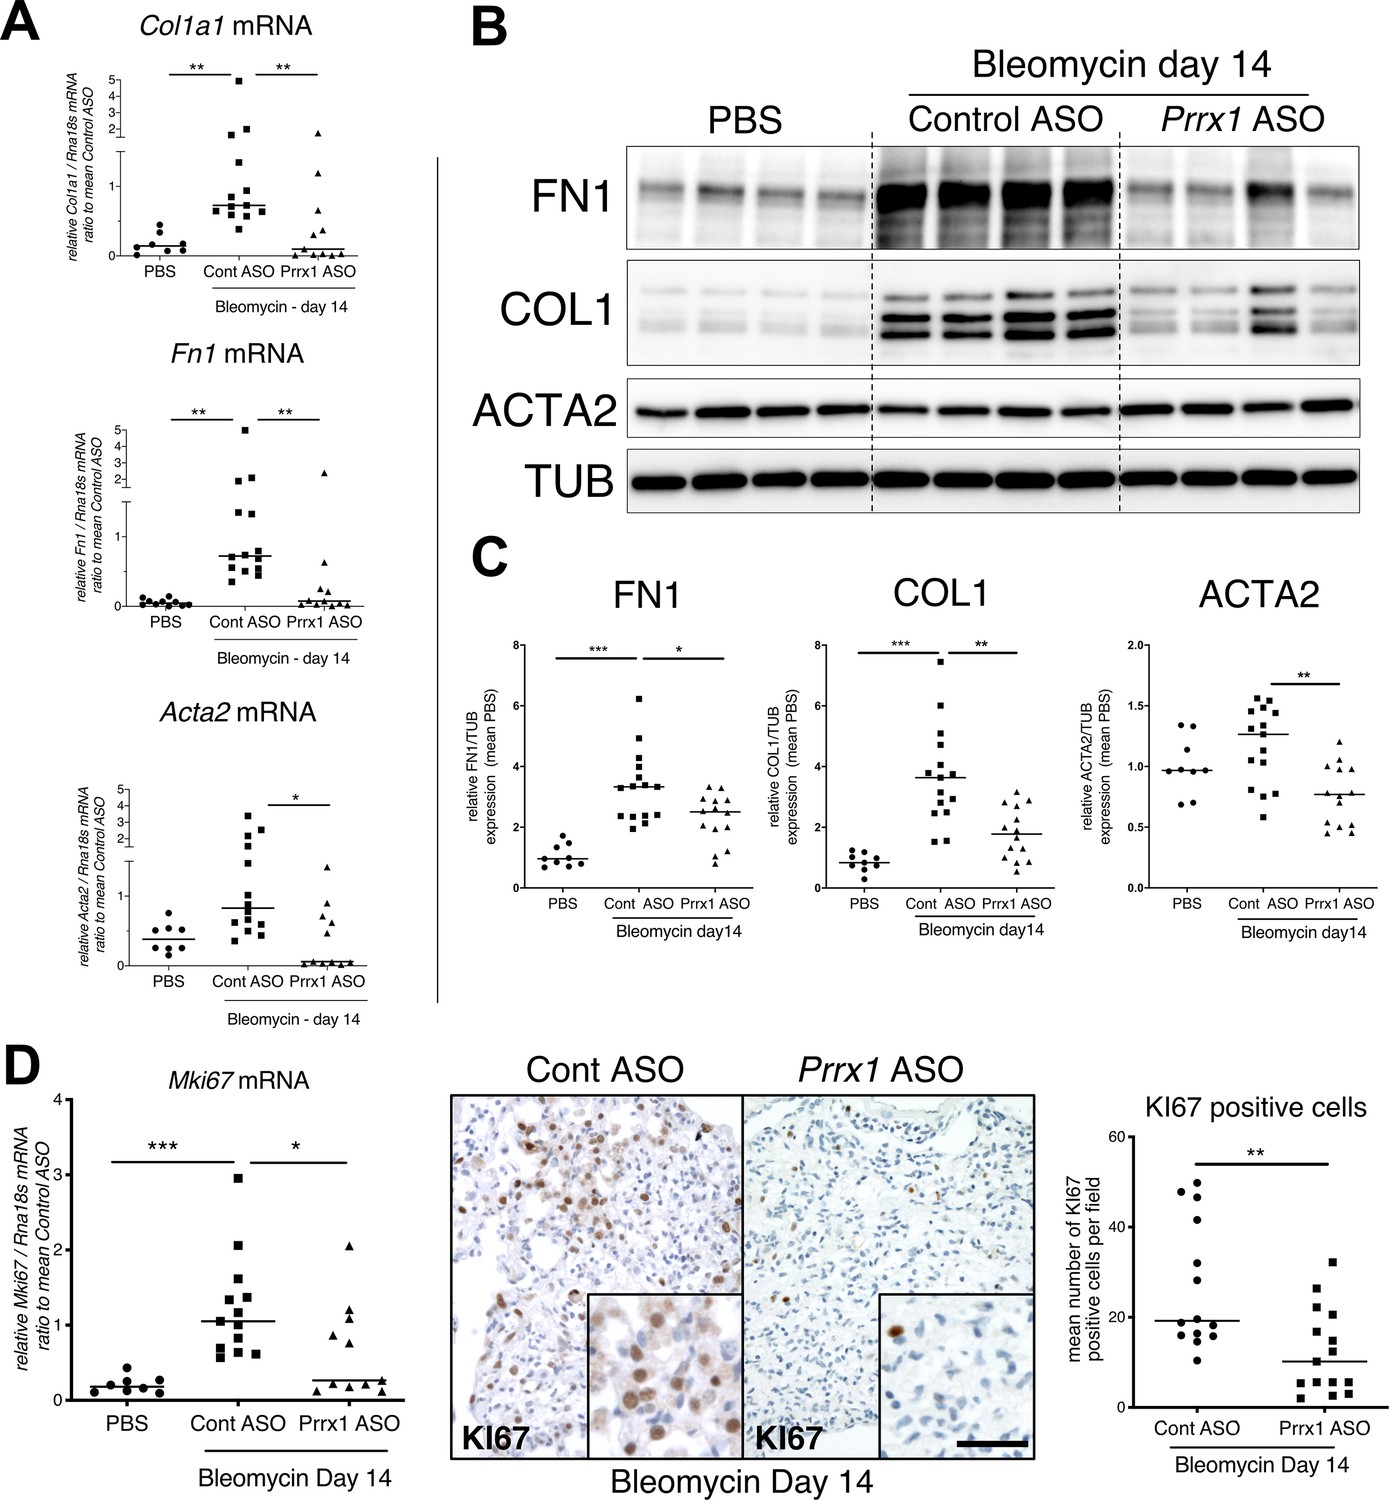
(A) Dot plots with median showing the mRNA expression of Col1a1, Fn1 and Acta2 at day 14 in PBS mice (circle, n=8) and bleomycin mice treated with Control ASO (square, n=13) or Prrx1 ASO (triangle, n=11). (B) Immunoblot showing FN1, COL1, and ACTA2 expression at day 14 in PBS mice and bleomycin mice treated with Control ASO or Prrx1 ASO. TUB was used as loading control. (C) Quantification of FN1, COL1, and ACTA2 relative expression to TUB at day 14 in PBS mice (n=9) and bleomycin mice treated with Control ASO (n=15) or Prrx1 ASO (n=14) (D) Left panel: dot plots with median showing Mki67 mRNA expression of at day 14 in PBS mice (circle, n=8) and bleomycin mice treated with Control ASO (square, n=13) or Prrx1 ASO (triangle, n=11). Middle panel: representative immunohistochemistry pictures (n=14 per group) showing KI67 staining (brown) in bleomycin treated with Control ASO (left) or Prrx1 ASO (right) mice at day 14. The quantification of the number of KI67-positive cells per high magnification field is shown on the right as dot plots with median. Scale bar: 40 µm in low-magnification images and 20 µm in high-magnification ones. Abbreviations: Control (Cont), Antisense oligonucleotide (ASO). Kruskal-Wallis test with Dunns post-test (A, B) and Mann Whitney U test (C); *p≤0.05, **p≤0.01 f, ***p≤0.001.
-
Figure 7—source data 1
The zip folder contains the data presented in panels A-D (in an Excel document).
Labelled (.pdf) and raw (folder) blot images showed in panel B are also included.
- https://cdn.elifesciences.org/articles/79840/elife-79840-fig7-data1-v2.zip
Figure 7—figure supplement 1
PRRX1 inhibition during late fibrosis phase reduces several fibrosis features and markers.
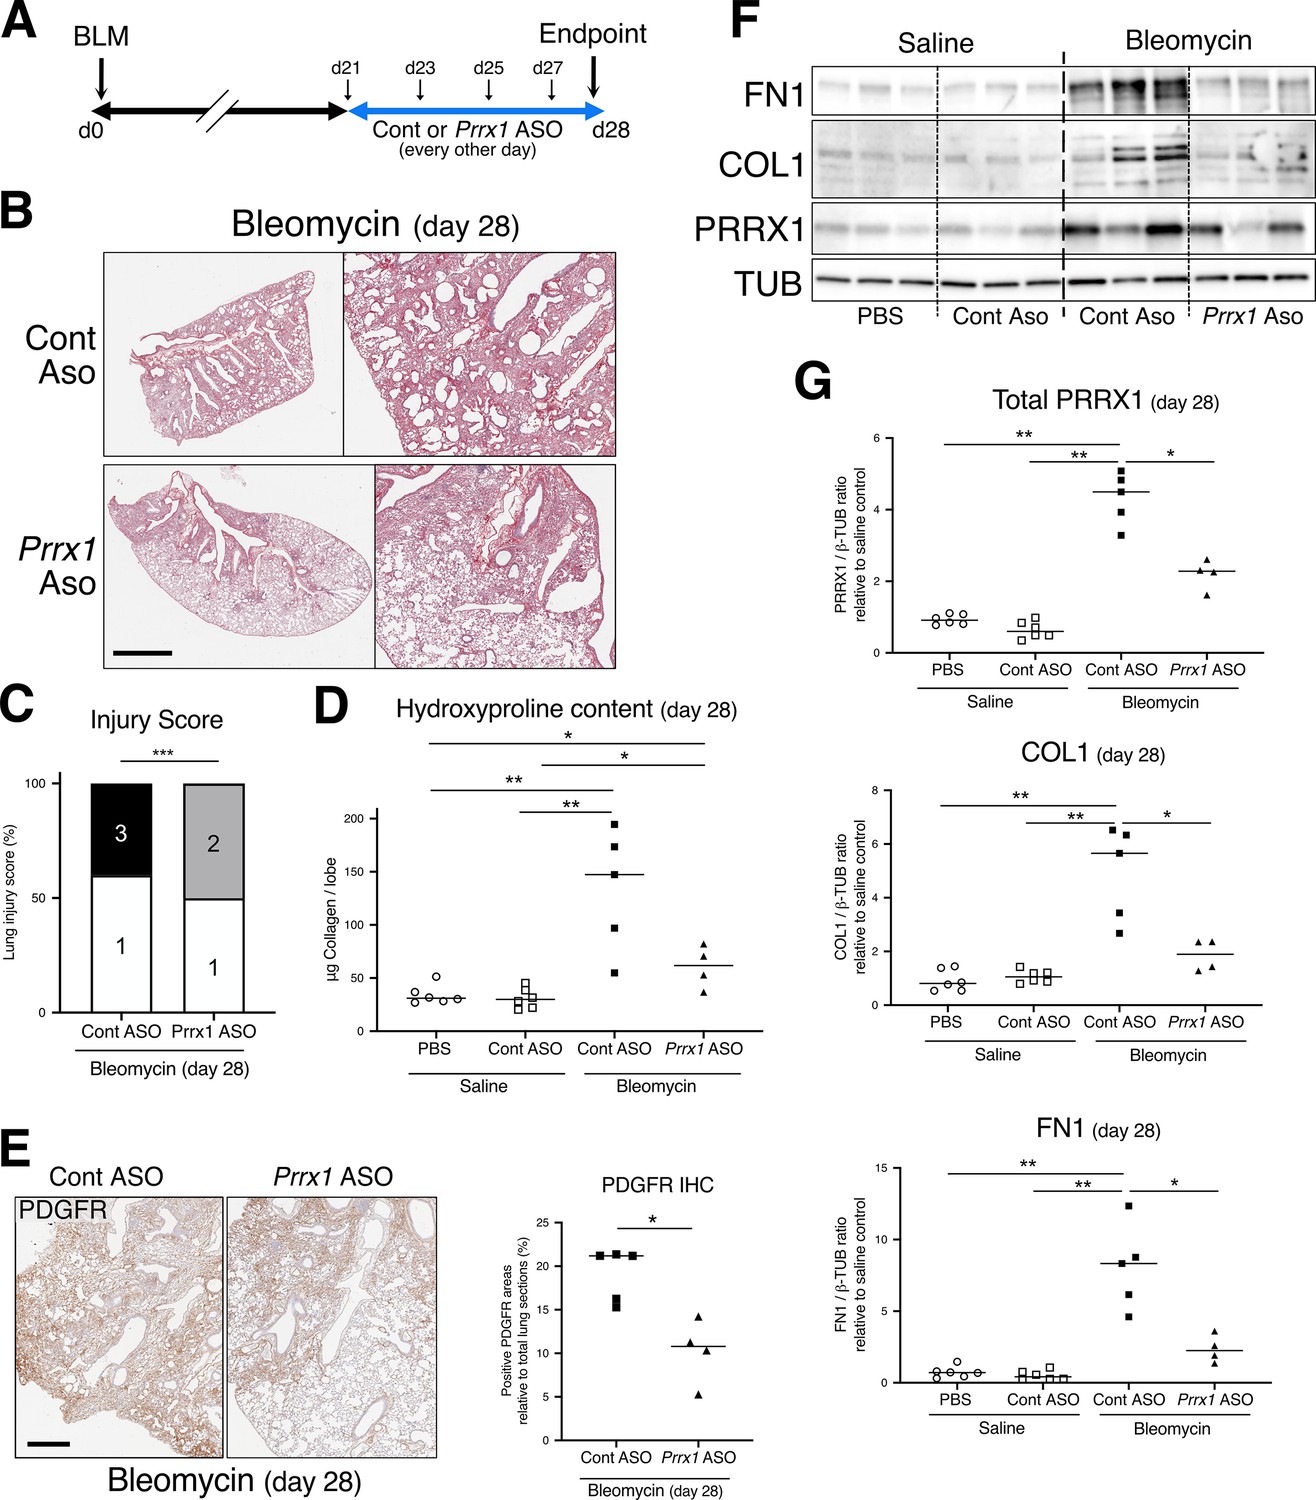
(A) Timeline of bleomycin and ASO treatments. Mice were first treated with bleomycin at day zero and then with control or Prrx1 ASO every other day from day 21, during the late fibrotic phase (in blue). Lungs were harvested at day 28. (B) Representative images (n=4–5 per group) showing picrosirius staining (red) at day 28 in bleomycin mice treated with Control ASO or Prrx1 ASO from day 21–27. (C) Injury score of control ASO or Prrx1 ASO-treated mice at day 28 (at least n=4 per group). (D) Dot Plot with median showing the Collagen lung content (µg per lobe) as measured by hydroxyproline at day 28. Mice treated with saline (white) at day 0 were then treated with saline (circle, n=6) or control ASO (square, n=6) from day 21–27. Bleomycin treated mice at day 0 (black) were then treated with control ASO (square, n=5) or Prrx1 ASO (triangle, n=4) from day 21–27. (E) Representative immunohistochemistry images (n=4–5 per group) showing PDGFR staining (brown) at day 28 in bleomycin mice treated with Control ASO or Prrx1 ASO. Nuclei were counterstained with hematoxylin. Right part: dot plots with median showing the percentage of PDGFR-positive areas (n=4–5 per group) in bleomycin mice treated with control ASO (square) or Prrx1 ASO (triangle) at day 28. (F) Immunoblot showing FN1, COL1 and PRRX1 expression at day 28 in saline mice (treated with saline or control ASO) and in bleomycin mice (treated with Control ASO or Prrx1 ASO). TUB was used as loading control. (G) Quantification of PRRX1, COL1 and FN1 relative expression to TUB at day 28 in saline mice treated with saline (n=6, white circle) or Control ASO (n=7, white square) and in bleomycin mice treated with control ASO (n=5, black square) Prrx1 ASO (n=4, black triangle). Scale bar: 80 µm in low-magnification images and 40 µm in high-magnification ones. Abbreviations: Control (Cont), Antisense oligonucleotide (ASO), immunohistochemistry (IHC). Fisher’s exact test (C), Kruskal-Wallis test with Dunns post-test (D and G) and Mann Whitney U test (E); *p≤0.05, **p≤0.01 f, ***p≤0.001.
-
Figure 7—figure supplement 1—source data 1
The zip folder contains the data presented in panels C-E and G (in an Excel document).
Labelled (.pdf) and raw (folder) blot images showed in panel F are also included.
- https://cdn.elifesciences.org/articles/79840/elife-79840-fig7-figsupp1-data1-v2.zip
Figure 8 with 1 supplement
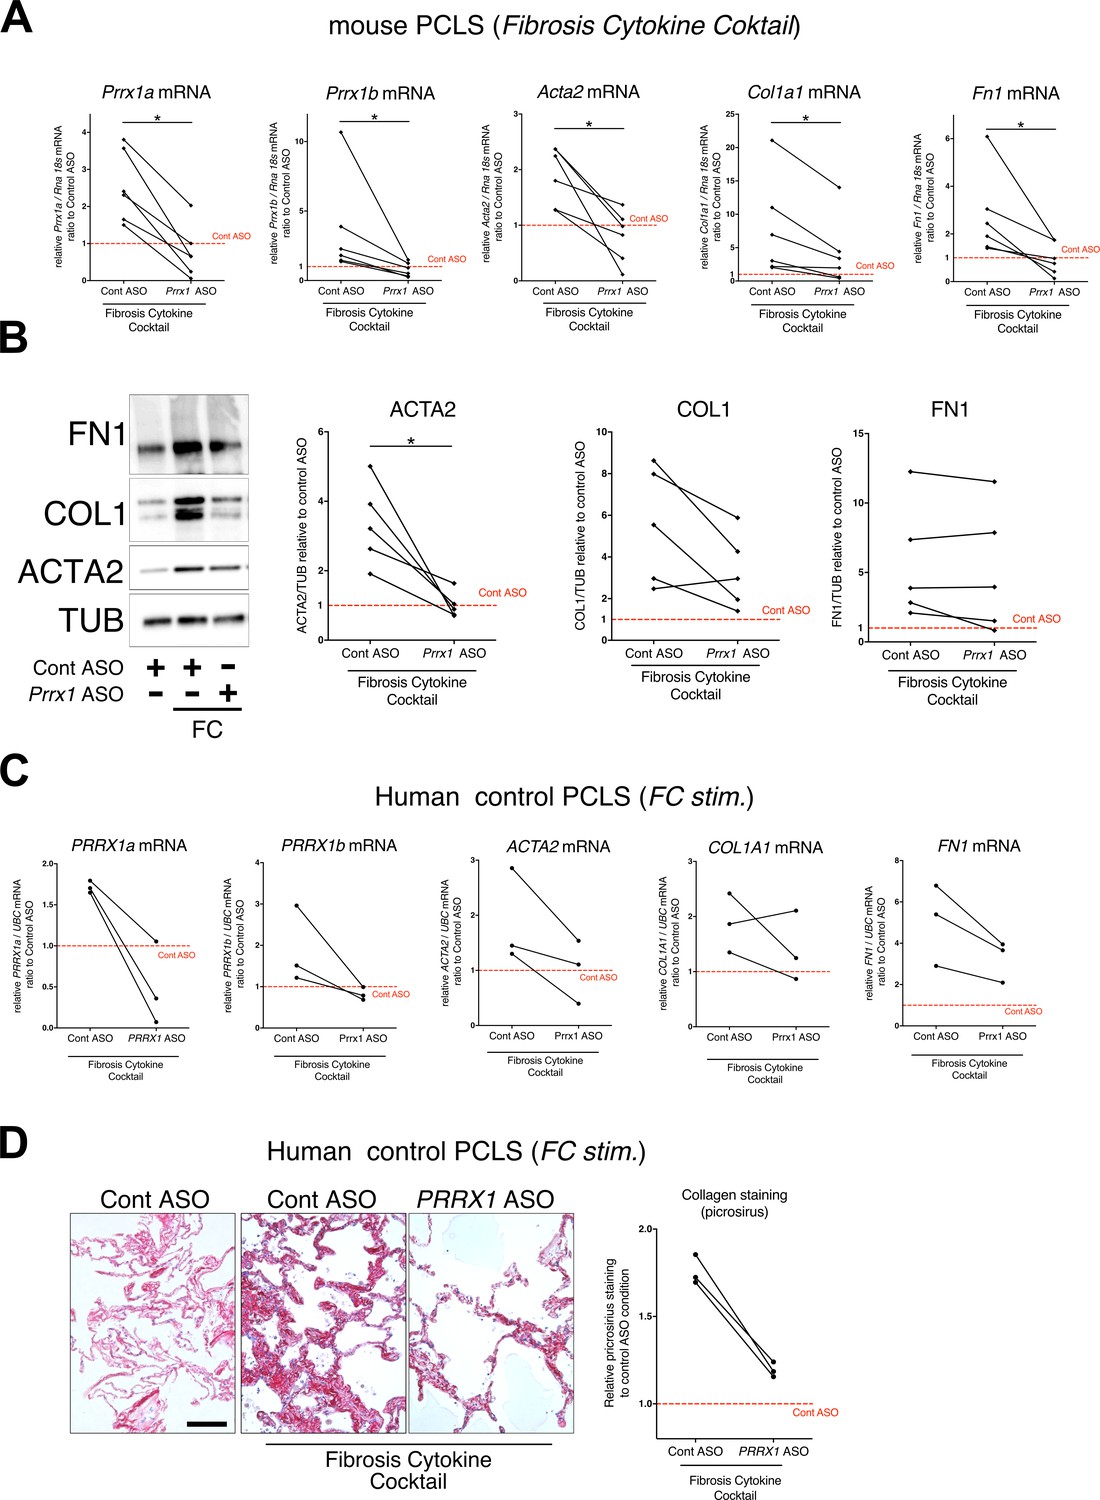
PRRX1 ASO attenuates lung fibrosis in mouse and Human Precision-cut Lung slices (PCLS).
(A) Before-after plots showing the mRNA expression of Prrx1a, Prrx1b, Acta2, Col1a1, and Fn1 (n=6) relative Control ASO alone condition (red dashed line) in mouse PCLS stimulated with fibrosis cytokine cocktail (FC) and then treated either with control ASO or PRRX1 ASO. (B) Representative immunoblot showing FN1, COL1, and ACTA2 expression (n=5) relative to control ASO alone condition (red dashed line) in mouse PCLS stimulated with FC and then treated either with control or Prrx1 ASO. The corresponding quantifications of ACTA2, COL1, and FN1 expression ratio to Tubulin are displayed as before-after plots on the right. Note that COL1 expression was decreased in 4 out 5 experiments. (C) Before-after plots showing the mRNA expression of PRRX1a, PRRX1b, ACTA2, COL1A1 and FN1 (n=3) relative Control ASO condition (red dashed line) in Human PCLS treated either with control ASO or PRRX1 ASO in presence or absence of FC. COL1A1 upregulation was lessened in 2 out 3 experiments while ACTA2 and FN1 levels were decreased in 3 out of 3 experiments. (D) Representative picrosirius staining (n=3) in Human PCLS treated with control ASO alone (left panel, basal condition) or after stimulation with Fibrosis Cytokine cocktail and treated with either control (middle panel) or PRRX1 (right panel) ASO. Nuclei were counterstained with hematoxylin. The quantification of picrosirius staining relative to control ASO alone (red dashed line) is showed on the right (Before-after plot). Scale bar: 50 µm. Abbreviations: Precision-Cut Lung slices (PCLS), Fibrosis Cytokine Cocktail (FC), Control (Cont), Antisense oligonucleotide (ASO), Stimulation (stim.). Wilcoxon test * P≤0.05.
-
Figure 8—source data 1
The zip folder contains the data presented in panels A-D (in an Excel document).
Labelled (.pdf) and raw (folder) blot images showed in panel B are also included.
- https://cdn.elifesciences.org/articles/79840/elife-79840-fig8-data1-v2.zip
Figure 8—figure supplement 1
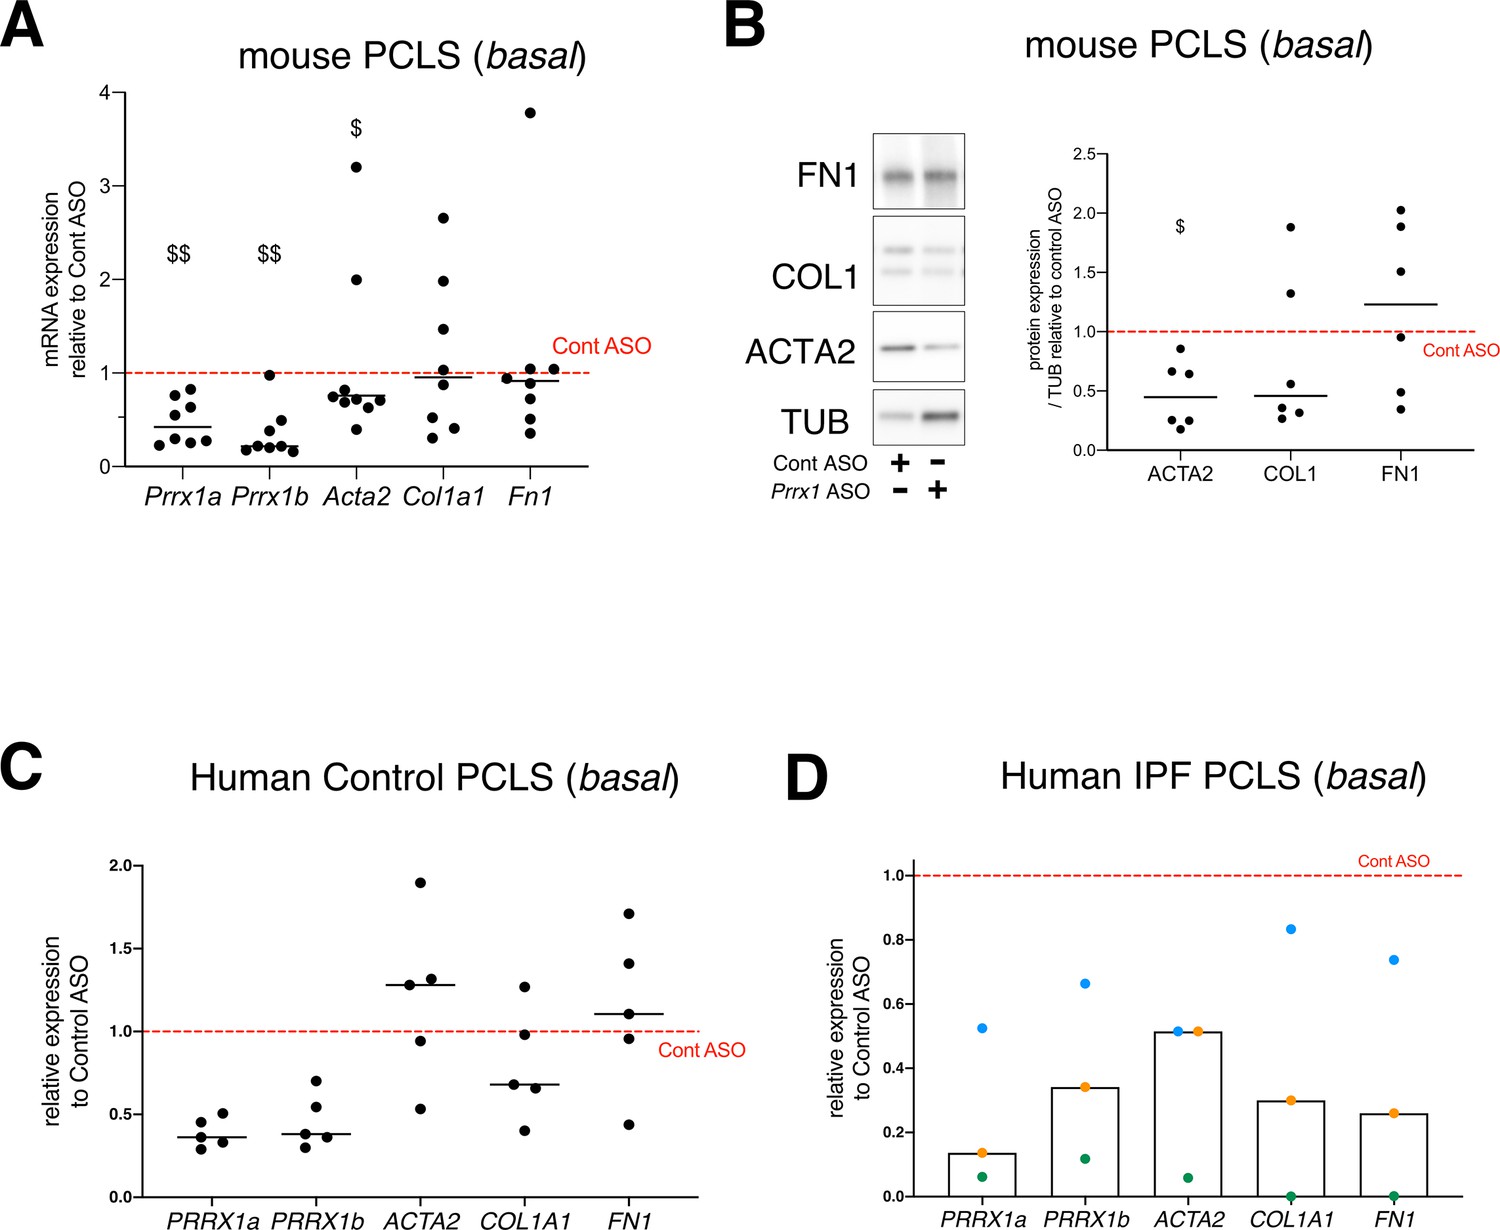
effect of PRRX1 ASO on the expression of myofibroblastic differentiation markers in mouse and Human PCLS at basal condition.
(A) Dot plots with median showing the relative mRNA expression of Prrx1a, Prrx1b, Acta2, Col1a1, and Fn1 in mouse PLCS treated with Prrx1 ASO alone (n=8) relative to control ASO (red dashed line). Note that Prrx1a, Prrx1b, and Acta2 mRNA levels were decreased in presence of Prrx1 ASO compared to control ASO. (B) Immunoblot showing FN1, COL1 and ACTA2 expression in mouse PCLS (n=6) treated with control or Prrx1 ASO. TUB was used as loading control. Right part: quantification of COL1, FN1 and ACTA2 relative expression to TUB in mouse PCLS treated with Prrx1 ASO relative to control ASO (red dashed line). (C) Dot plots with median showing the relative mRNA expression of PRRX1A, PRRX1B, ACTA2, COL1A1, and FN1 in control Human PLCS (n=5) treated with PRRX1 ASO alone relative to control ASO (red dashed line). Note that PRRX1a, PRRX1b mRNA levels were effectively downregulated in presence of PRRX1 ASO compared to control ASO. (D) Column with median and individual values showing the relative mRNA expression of PRRX1A, PRRX1B, ACTA2, A1COL1, and FN1 in Human IPF PLCS (n=3) treated with PRRX1 ASO alone relative to control ASO (red dashed line). Each color represents individual experiments. Abbreviations: Precision-Cut Lung slices (PCLS), Control (Cont), Antisense oligonucleotide (ASO). Wilcoxon signed-rank test, $ p≤0.05 $$ p≤0.01.
-
Figure 8—figure supplement 1—source data 1
The zip folder contains the data presented in panels A-D (in an Excel document).
Labelled (.pdf) and raw (folder) blot images showed in panel B are also included.
- https://cdn.elifesciences.org/articles/79840/elife-79840-fig8-figsupp1-data1-v2.zip
Figure 9
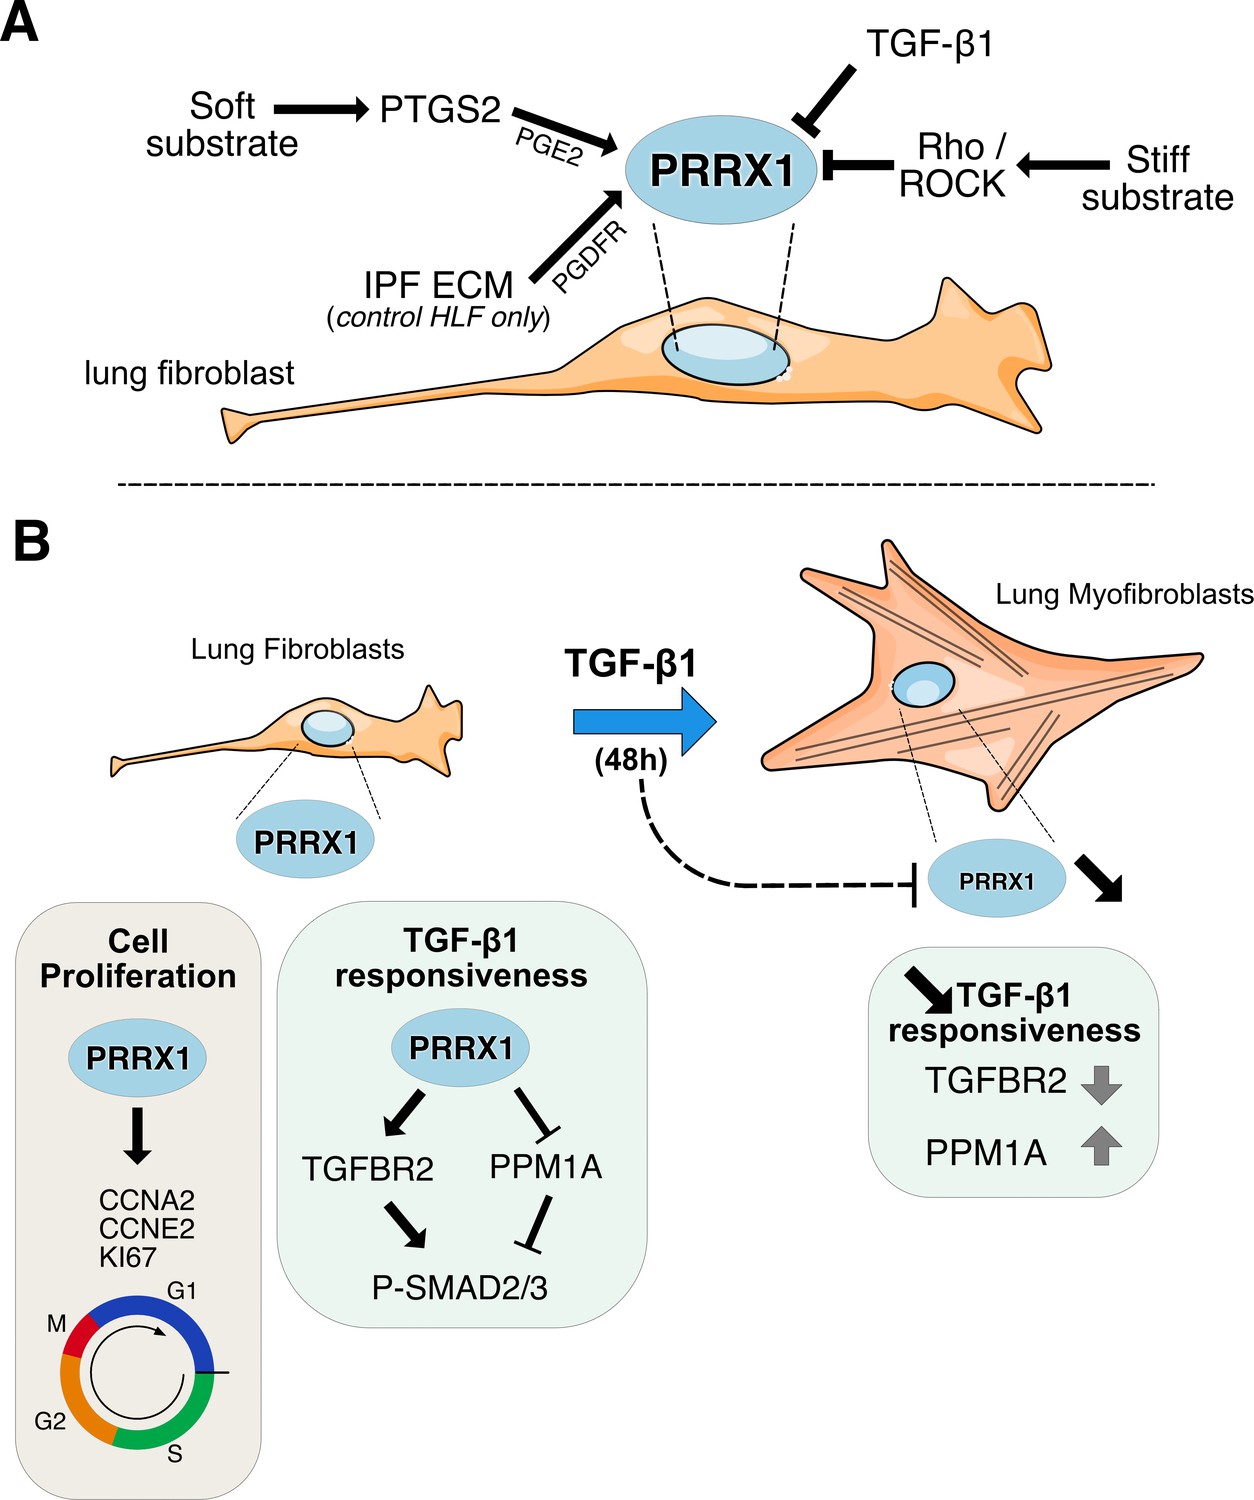
Summary sketch of PRRX1 regulation and functions in lung fibroblasts.
(A) Regulation of PRRX1 TF expression in lung fibroblasts. On one hand, PRRX1 expression was up-regulated by the anti-fibrotic factor PGE2 and soft culture substrate (in a PTGS2 dependent-manner). IPF fibroblast-derived matrix also increased PRRX1 TFs expression in a PDGFR dependent manner in control primary lung fibroblasts only. On the other hand, stiff culture substrate (in a Rho/ROCK dependent manner) and TGF-β1 stimulation, which both promote myofibroblastic differentiation, decreased PRRX1 TF expression levels in both control and IPF fibroblasts seeded on plastic. (B) Model of PRRX1 function in lung fibroblasts at steady state and after TGF-β1 driven myofibroblastic differentiation. Left panel: in complete growth medium, PRRX1 TFs influence cell cycle progression by regulating key factors associated with cycle progression during the G1 and S phases (KI67, Cyclin A2 and E2). PRRX1 was detected in the promoter regions of those genes by chromatin immunoprecipitation (ChIP). In presence of PRRX1, the expression of the serine / threonine phosphatase PPM1A is downregulating (PRRX1 TFs binding to PPM1A promoter region was demonstrated by ChIP) and TGFBR2 expression is also maintained. Thus, TGF-β1 responsiveness and the phosphorylation of SMAD2 and SMAD3 may be therefore promoted by PRRX1 TFs in lung fibroblasts at steady state. Right panel: TGF-β1 stimulation of lung fibroblasts will trigger their differentiation into myofibroblasts, concomitantly with a downregulation of PRRX1 TFs at late time point (48 hr). This negative feedback loop could limit cell-responsiveness to long exposure of TGF-β1 by upregulating the expression of PPM1A and downregulating TGFBR2 levels. Abbreviations: IPF (Idiopathic Pulmonary Fibrosis), HLF (Human Lung Fibroblasts), ECM (Extracellular matrix), G1 (Gap 1 phase 1), S (Synthesis / Replicative phase), G2 (Gap phase 2), M (Mitosis), CCNA2 (Cyclin A2), CCNE2 (Cyclin E2).
Author response image 1
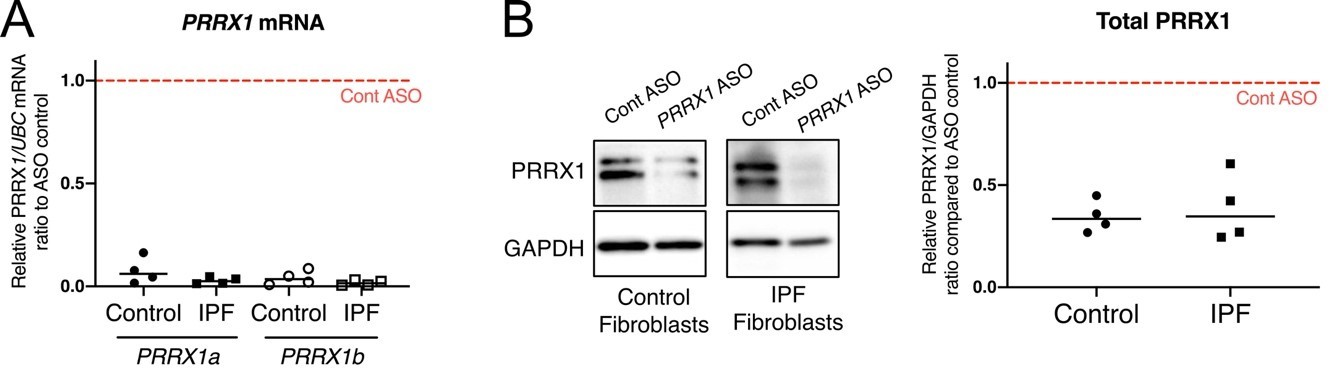
K. nock down efficiency of Prrx1 ASO in primary control and IPF lung fibroblasts.
(A) Dot plots with median showing PRRX1a (black) and PRRX1b (white) mRNA expression relative to the Control ASO condition (red dashed line) in control (circle) or IPF (square) primary lung fibroblasts (n=4 per group) treated for 72h with Prrx1 ASO (B) Immunoblot showing PRRX1 expression (n=4) in control and IPF fibroblasts treated 72h with control or Prrx1 ASO. The quantification of PRRX1 expression relative to GAPDH (loading control) is displayed as dot plot with median. Abbreviations: Control (Cont), Antisense oligonucleotide (ASO).
Author response image 2
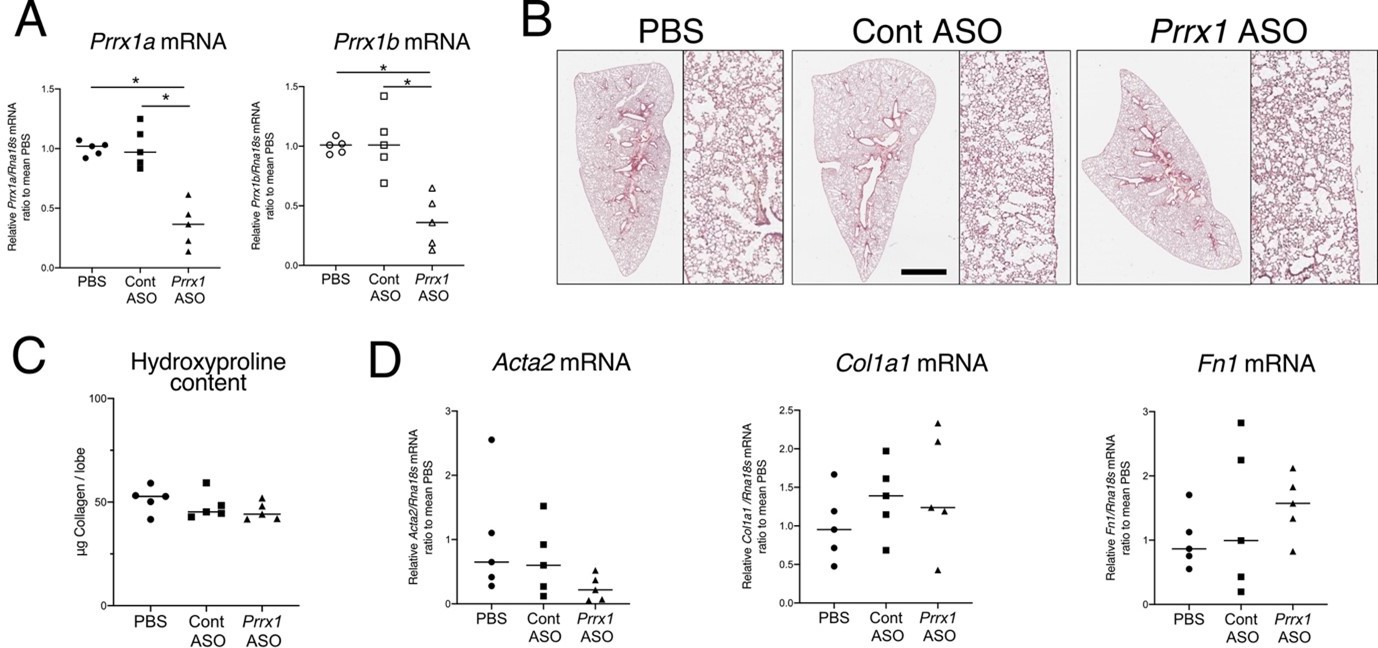
ASO-mediated Prrx1 inhibition is not associated with an increase in fibrosis markers in healthy mouse lung.
(A) Dot plots with median showing the mRNA expression of Prrx1a (black) and Prrx1b (white) isoforms at day 7 in wild-type mice treated every other day with PBS (circle), control ASO (square) or Prrx1 ASO (triangle); n=5 per group. Note the inhibition of Prrx1a and Prr1b mRNA expression levels in Prrx1 ASO treated mice compared to the PBS and control ASO groups. (B) Representative hematoxylin – eosin staining images (n=5 per group) showing no histological differences between wild type mice treated with either PBS, control or Prrx1 ASO at day 7. High magnifications are displayed on the right of the main panels. (C) Dot Plot with median showing the Collagen lung content (µg per lobe) at day 7 as measured by hydroxyproline in wild type mice treated with either PBS (circle), control (square) or Prrx1 (triangle) ASO; n=5 per group. (D) Dot plots with median showing the mRNA expression of Acta2, Col1a1 and Fn1 at day 7 in mice treated with either PBS (circle), Control (square) or Prrx1 (triangle) ASO; n=5 per group. (Scale bar in B: 80µm in low magnification images and 40µm in high magnification ones); (Abbreviations: Control (Cont), Antisense oligonucleotide (ASO)). Kruskal-Wallis test with Dunns post-test, *p≤0.05.
Additional files
-
Supplementary file 1
List of common up-regulated genes in all three IPF transcriptome database analyzed.
- https://cdn.elifesciences.org/articles/79840/elife-79840-supp1-v2.docx
-
Supplementary file 2
Attenuation of the TGF-β response following PRRX1 knock-down.
The table contains the best 597 genes significantly modulated by TGF-β in NHLF treated with siControl#1 and #2 (log2 fold change >4; adj. P Val <0.05). The table indicates the Fold Change (FC) for each of the genes: (i) column 1: TGF-β1" stimulation in presence of siControl#1; column 2: TGFβ1 fold stimulation in presence of siRNA#1; column 4: TGFβ1 fold stimulation in presence of siControl#2; column 5: TGFβ1 fold stimulation in presence of siRNA#2". Columns 5 and 6 give the percentage of residual modulation by TGF-β for each PRRX1 siRNA. Modulations are shown in progressively brighter shades of blue (attenuation) and orange (over-activation). The mean residual fold change following PRRX1 KD is 56.6% (siRNA#1) and 80.0% (siRNA#2).
- https://cdn.elifesciences.org/articles/79840/elife-79840-supp2-v2.docx
-
Supplementary file 3
PCR primer sequences.
- https://cdn.elifesciences.org/articles/79840/elife-79840-supp3-v2.docx
-
Supplementary file 4
Antibody list.
- https://cdn.elifesciences.org/articles/79840/elife-79840-supp4-v2.docx
-
MDAR checklist
- https://cdn.elifesciences.org/articles/79840/elife-79840-mdarchecklist1-v2.pdf
Download links
A two-part list of links to download the article, or parts of the article, in various formats.
Downloads (link to download the article as PDF)
Open citations (links to open the citations from this article in various online reference manager services)
Cite this article (links to download the citations from this article in formats compatible with various reference manager tools)
Identification of Paired-related Homeobox Protein 1 as a key mesenchymal transcription factor in pulmonary fibrosis
eLife 12:e79840.
https://doi.org/10.7554/eLife.79840


