Fast, high-throughput production of improved rabies viral vectors for specific, efficient and versatile transsynaptic retrograde labeling
- Institute of Science and Technology Austria (ISTA), Austria
- Department of Neurophysiology and Neuropharmacology, Vienna Medical University, Austria
- Allen Institute for Brain Science, United States
Figures
Figure 1 with 3 supplements
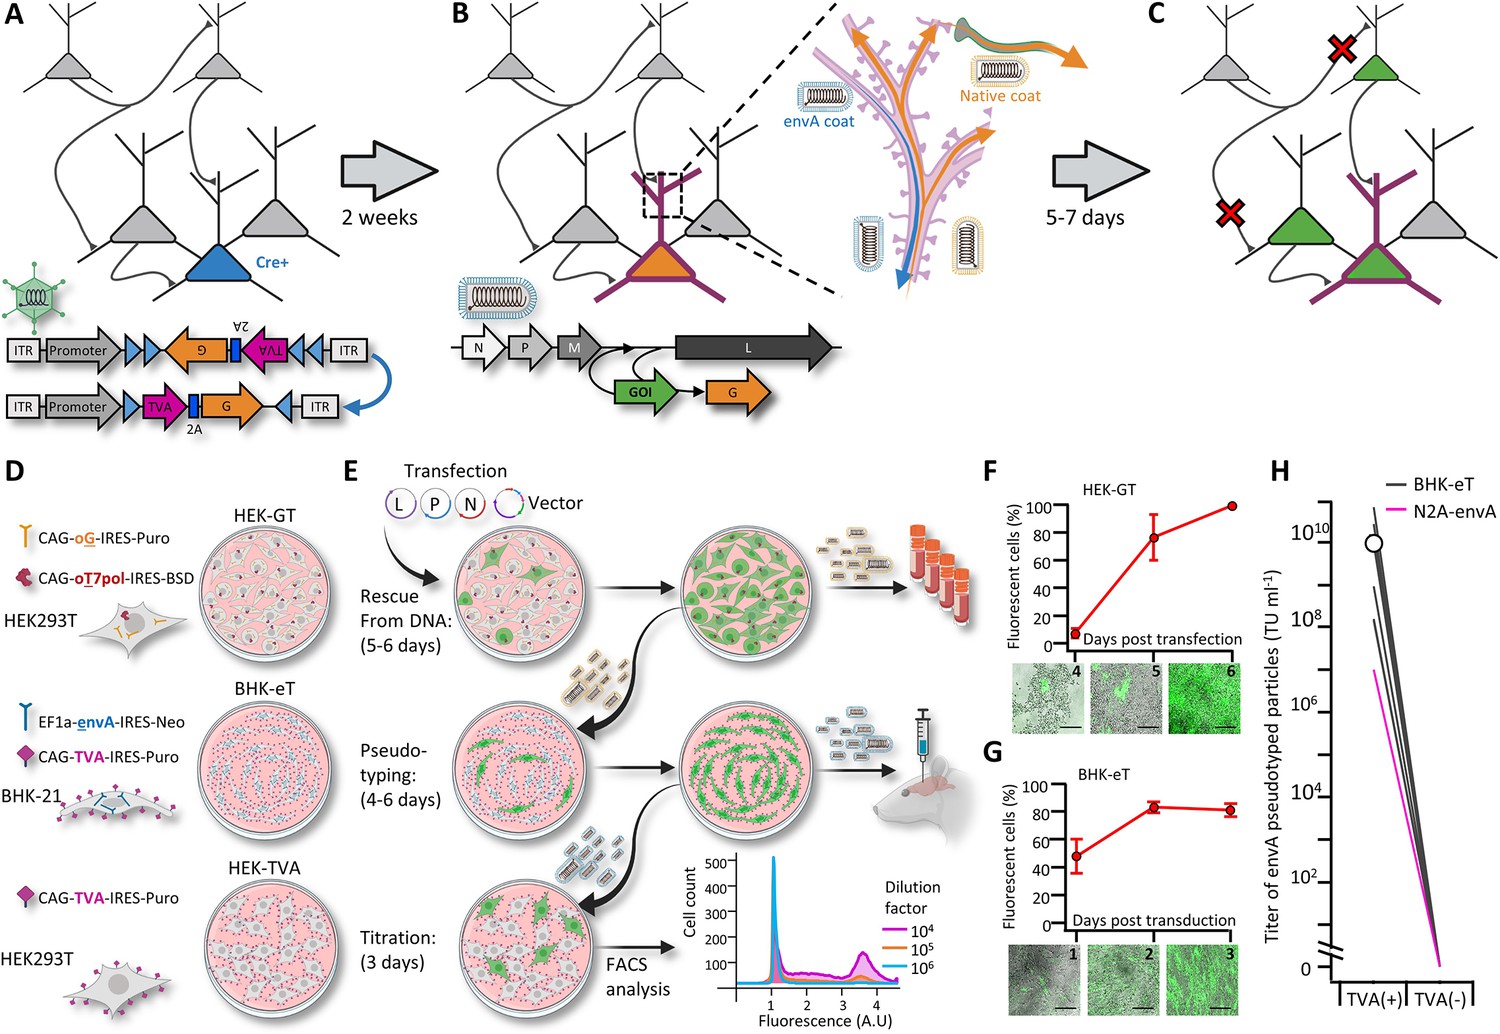
A new viral packaging system for fast, clean and high-throughput production of RVdG-CVS-N2c vectors.
(A–C) A schematic representation of the experimental workflow for achieving cell type-specific trans-synaptic retrograde labeling using G-deleted, envA-pseudotyped rabies viral vectors: Genetic dissection of cre+ neurons (blue) for conditional expression of TVA and G (A); targeting of RVdGenvA particles to labeled neurons for expression of a gene of interest (GOI), (B) and subsequent propagation of native-coat RVdG particles from starter cells to their presynaptic partners (C). (D) A schematic representation of the three different cell lines designed for rescue (HEK-GT), pseudotyping and amplification (BHK-eT) and titration (HEK-TVA) of RVdG viral particles, alongside the transgenes used to generate them. (E) Schematic representation of the production process and timeline. L,P and N represent the plasmids encoding the corresponding rabies genes and V represents the vector plasmid. (F) Quantification of the time course for the rescue stage, starting at day 4 after transfection of viral plasmids. (G) Quantification of the time course for amplification of pseudotyped particles, starting at day 1 after transduction with native-coat particles. (H) Quantification of the average titer of concentrated pseudotyped stock from 19 individual productions, with comparison to the titer of a representative production of RVdg-CVS-N2c virus, produced using N2a cells (magenta). Lines represent titers of individual productions. Data in F and G represents the average and SEM of three individual and independent measurements.
-
Figure 1—source data 1
Quantification of RVdG propagation rates and viral titers.
Tables for Figure 1F and G show the fractions of labeled cells obtained using FACS analysis at the indicated days post transduction and table for Figure 1H details viral titers for 37 individual productions, along with the identity of each vector and the raw data used to calculate the titer (colored columns to the left).
- https://cdn.elifesciences.org/articles/79848/elife-79848-fig1-data1-v2.xlsx
Figure 1—figure supplement 1

Efficiency of stable cell selection using antibiotic resistance genes.
(A and B) HEK-GT (A) and BHK-eT (B) cells (bright-field illumination shown in cyan) were mixed with HEK293 or BHK-21 cells, respectively, stably expressing tdTomato only (red). Representative images show the gradual removal of tdTomato+ cells following exposure to either of the antibiotics Puromycin, blasticidin, or neomycin used in the generation of the stable cells. Scale bars represent 100 µm. (C) FACS-assisted quantification of the fraction of tdTomato+ cells shows the time course for their removal from the antibiotics-exposed cultures.
Figure 1—figure supplement 2

Leak expression of envA-pseudotyped particles can occur around damaged tissue.
(A) Illustration of the injection scheme designed to reveal the extent of leak expression following injection of envA-pseudotyped RVcG-CVS-N2c particles produced in BHK-eT cells. (B) Representative confocal image of a coronal section (left) shows extensive labeling of low-titer N2c-tdTomato vectors (magenta) from the hemisphere previously injected AAV-DIO-EF1a-TVA-2A-N2cG but only a small number of cells labeled with N2c-EGFP (green, left) which was injected into the contralateral hemisphere at a titer 500-fold higher. DAPI signal is labeled blue. (C) Protocol for the experiment in organotypic hippocampal slice cultures, designed to assess the contribution of tissue damage to non-specific labeling by envA-pseudotyped particles. (D and E) Images from three separate cultures transduced with envA-pseudotyped CVS-N2c-tdTomato vectors (red), either immediately (D) or 1 hr after the incision of the tissue (E). The substantially higher number of labeled cells in the cultures shown in (D) suggests that non-specific labeling from envA-pseudotyped particles can occur around injection sites when high-titer virus is applied.
Figure 1—figure supplement 3

Effective retrograde labeling with oG coated CVS-N2c particles.
(A) Illustration of the injection scheme for hippocampus-specific retrograde labeling with native coat RVdGoGCVS-N2c-EGFP particles. (B) Representative coronal (left) and sagittal (right) images demonstrating specific and robust retrograde labeling of cortical and subcortical regions projecting to the hippocampus. LEC – Lateral entorhinal cortex; DBB – Diagonal band of Broca; Re – Nucleus reuniuns of thalamus; SuM – Supramammilary Nucleus; MnR – Median nucleus Raphe. 4′,6-diamidino-2-phenylindole (DAPI) signal is labeled blue.
Figure 2 with 1 supplement
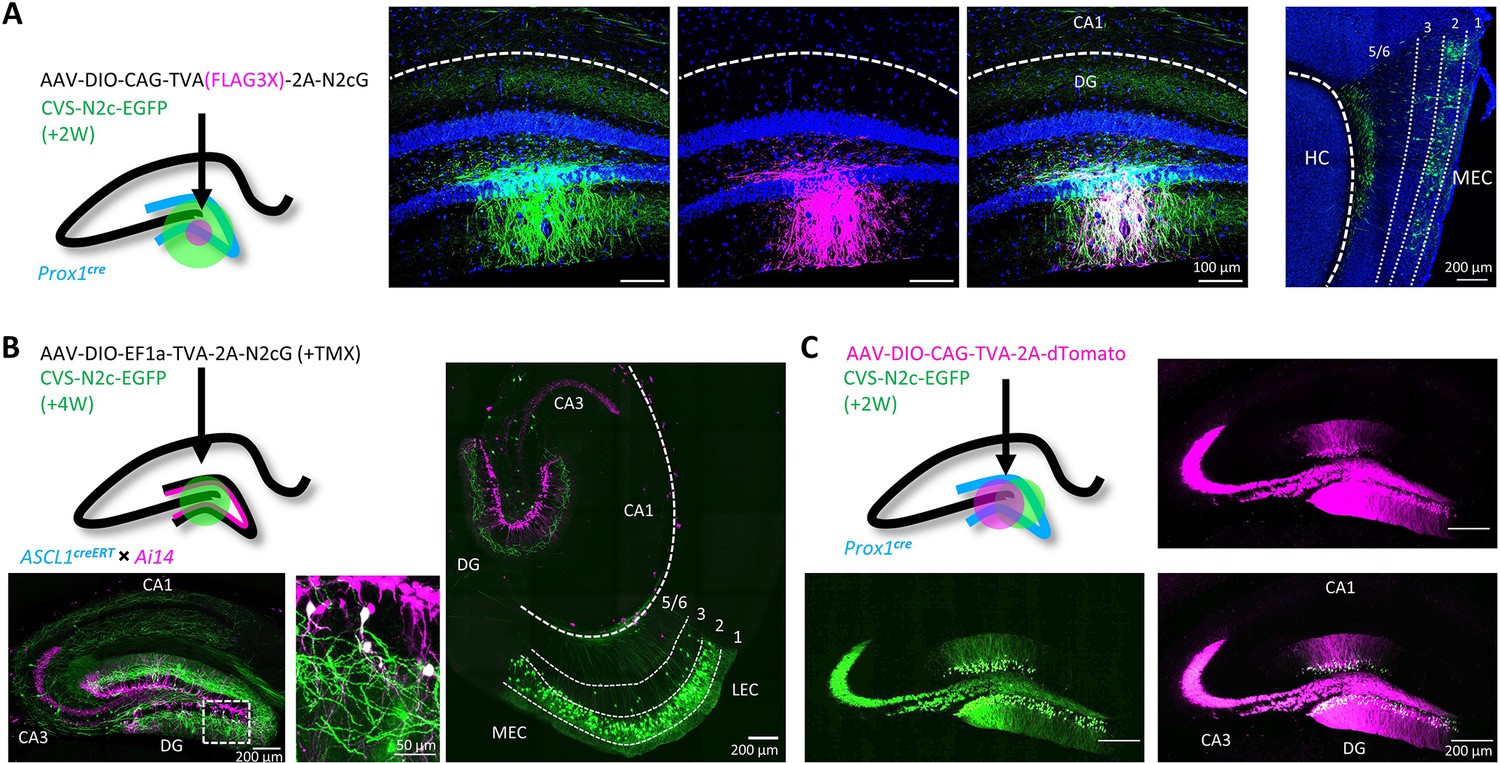
Target specificity and retrograde labeling efficacy of envA-pseudotyped RVdG-CVS-N2c particles, produced in BHK-eT cells.
(A) Illustration of the injection scheme (left) and corresponding representative confocal images demonstrating the targeting specificity of CVS-N2c particles (green) to FLAG3X tagged cells (magenta) along with retrograde labeling to EC layer 2 cells (rightmost image, EC layers are separated by dashed lines and their numbers are denoted above). (B) Illustration of the injection scheme (top left) and corresponding representative confocal images demonstrating efficiency and specificity of CVS-N2c-mediated retrograde labeling from adult-born DGCs. (C) Illustration of the injection scheme (top left) and corresponding representative confocal images demonstrating target specificity, with no accompanying retrograde labeling, in the absence of the rabies glycoprotein in any of its projections in four separate experiments.
Figure 2—figure supplement 1
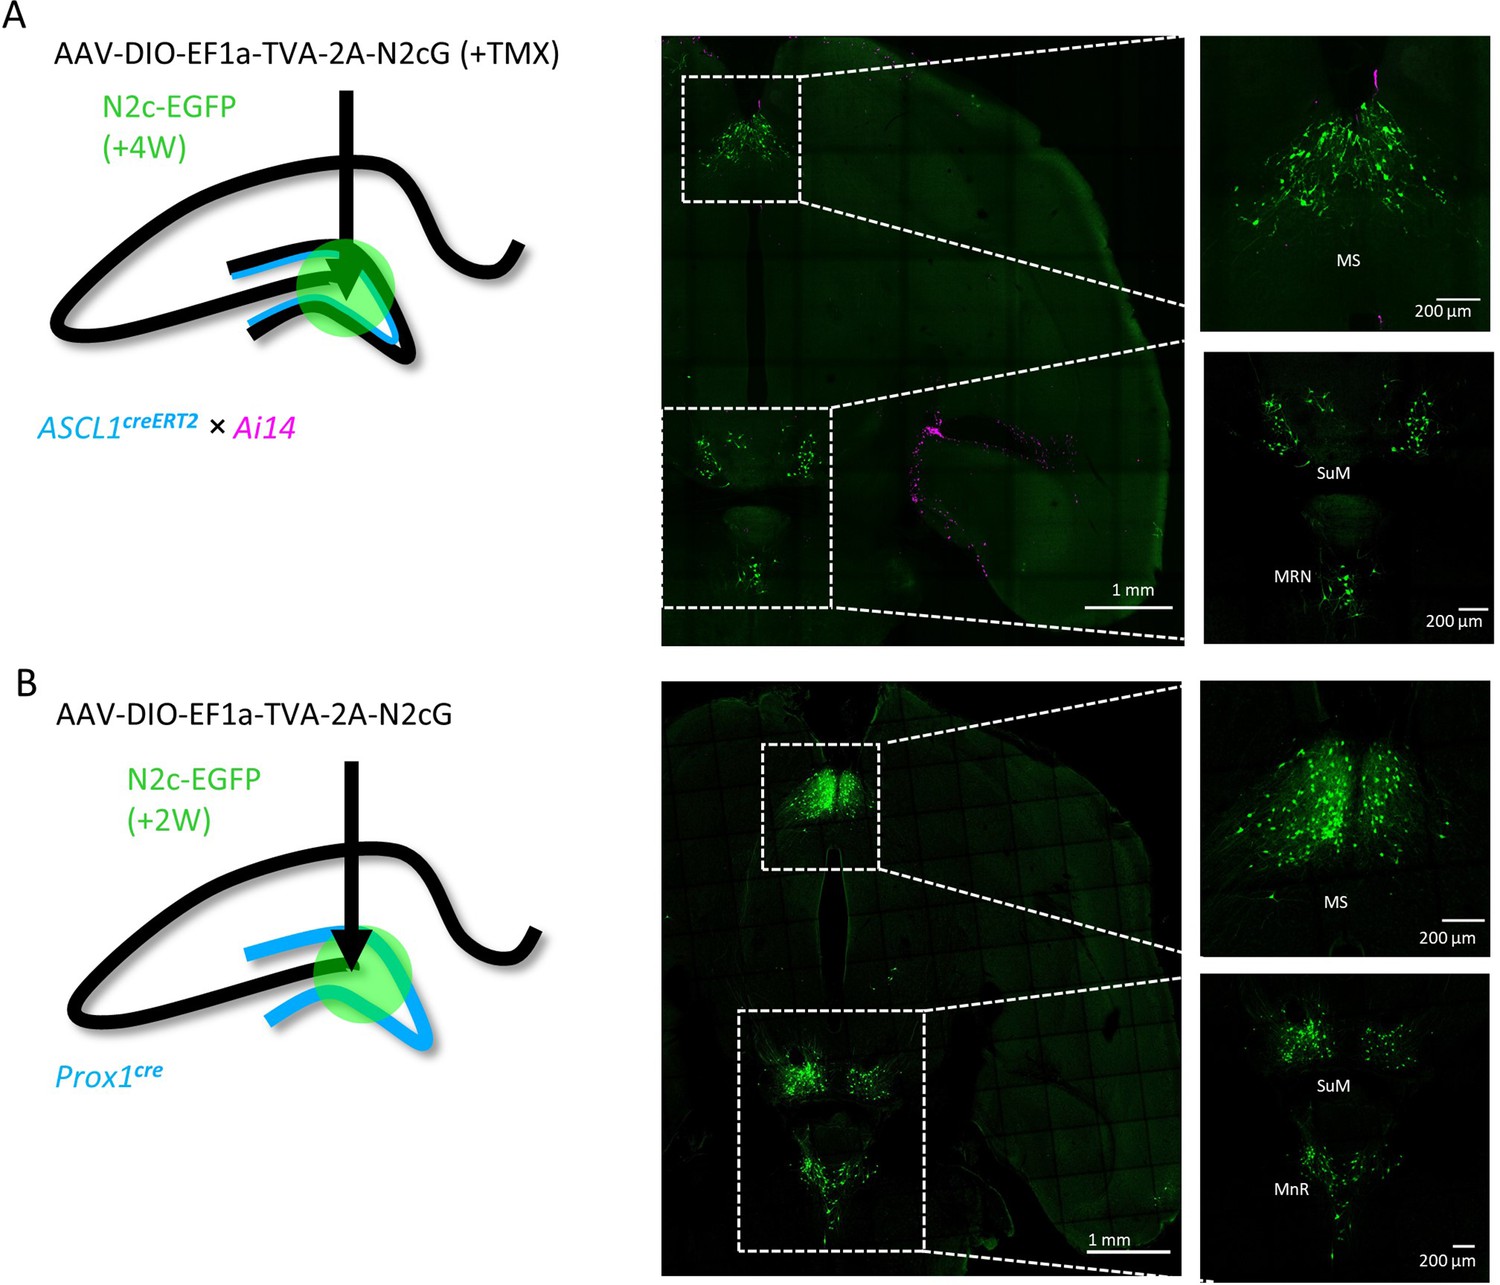
Transsynaptic retrograde labeling pattern from adult-born hippocampal DGCs in subcortical regions.
(A and B) Transsynaptic retrograde labeling with CV-N2c vectors from adult-born cells in the hippocampal DG, using the Ascl1creERT2 line (A) reveals identical labeling pattern in subcortical regions as following the same manipulation on the general population of DGCs, using the DG-specific Prox1cre line (B) MS – Medial Septal Nucleus; SuM – Supramammilary Nucleus; MnR – Median nucleus Raphe.
Figure 3 with 1 supplement
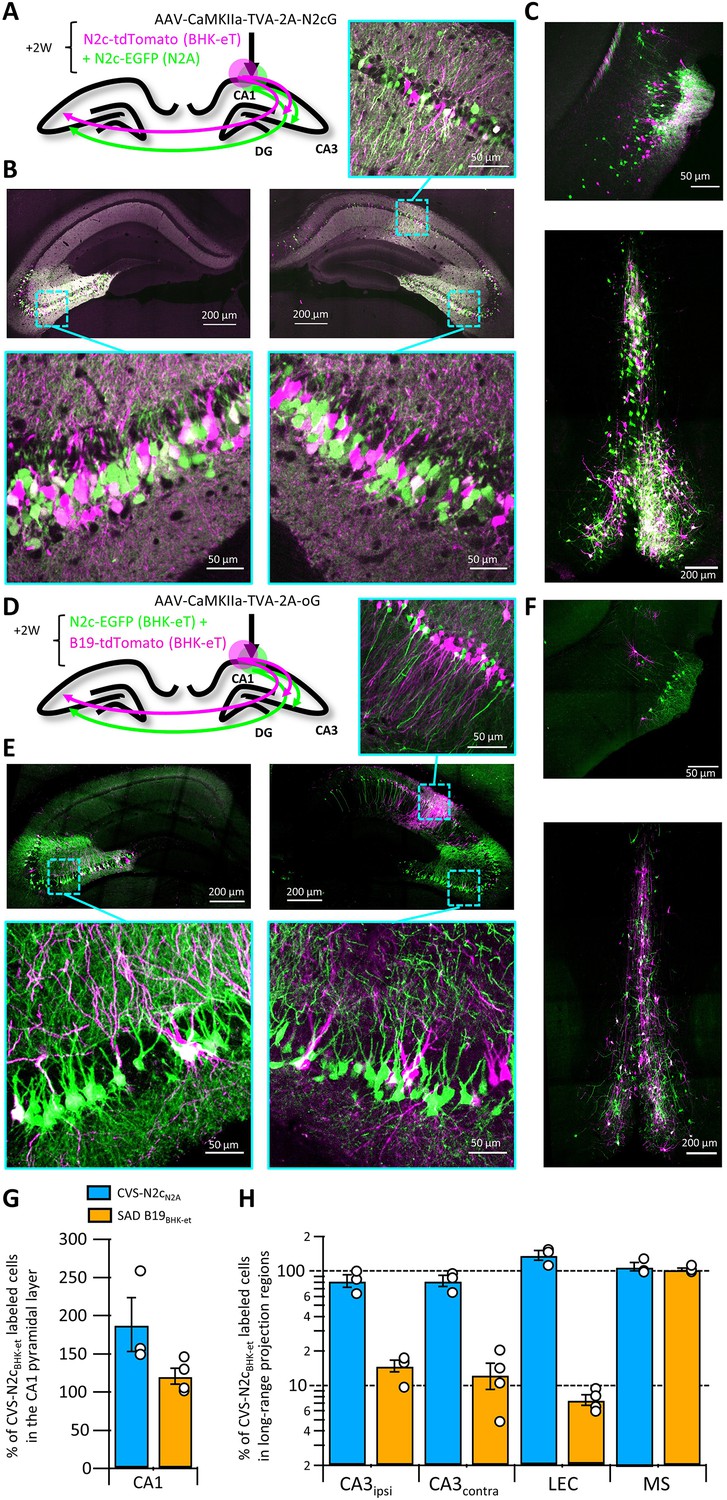
Retrograde labeling efficiency is determined by the viral strain, and not the packaging cell lines.
(A) Schematic illustration of the injection scheme, designed for comparison of retrograde labeling efficacy between CVS-N2c vectors produced using either the N2a-based or BHK-based packaging cell lines, propagating using the N2c glycoprotein. (B) Representative confocal images of the ipsi- and contra-lateral hippocampus. Expanded images of the CA3 region of both hemispheres and the CA1 of the injection site correspond to the areas delineated by cyan rectangles. (C) Representative confocal images of the LEC (top) and the septal complex (bottom). (D–F) Same as (A–C) but for comparison of CVS-N2c and SAD B19 vectors, both produced with BHK-based packaging cell line and propagating using the SAD-B19 optimized glycoprotein (oG). (G) Summary bar plot showing the ratio of first order starter cells in the CA1 pyramidal layer, between neurons labeled with either CVS-N2cN2a (blue) or SAD B19BHK-et (orange) and the neurons labeled with CVS-N2cBHK-et. (H) Summary bar plot showing the differences in retrograde labeling efficiency, under both injections schemes described in (A) and (D). All values were normalized to the ratio of starter cells shown in (G). N=4 and 3 animals for the N2c-N2c and N2c-B19 comparisons, respectively. Data shown as mean and SEM with black circles denoting individual animals.
-
Figure 3—source data 1
Cell count for experimental designs and ratio calculations.
Two tables on top of page show the number of labeled cells per region for each individual slice and animal. Table on left shows data corresponding to Figure 3A–C and table on the right shows data corresponding to Figure 3D–F. Below each table are the calculated averages for each condition shown in Figure 3G and H.
- https://cdn.elifesciences.org/articles/79848/elife-79848-fig3-data1-v2.xlsx
Figure 3—figure supplement 1
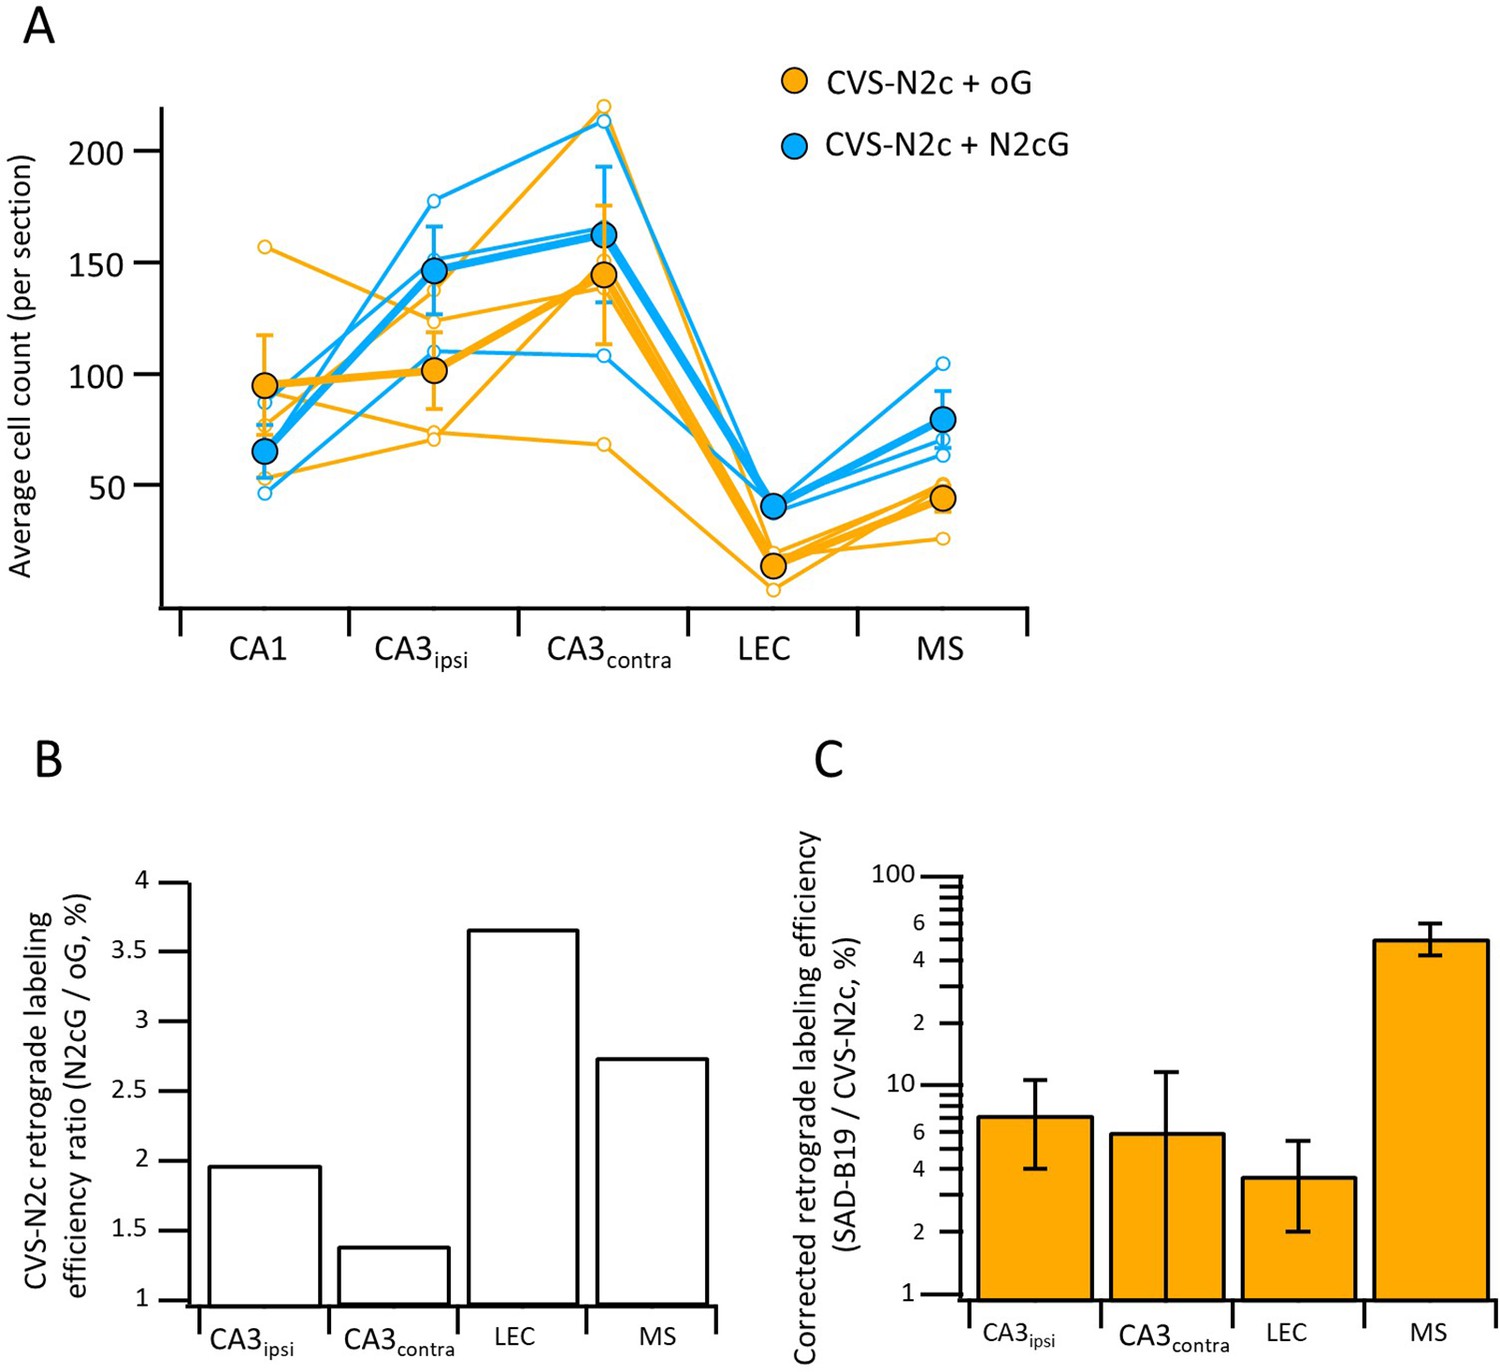
Differential effects of N2c and B19 glycoproteins on propagation efficiency of CVS-N2c vectors.
(A) Average neuron count per slice for individual animals (empty circles) and averaged count for all animals (full circles) in the different regions projecting to the CA1 following retrograde labeling with CVS-N2c vectors using either the B19-oG (orange) or the N2cG (cyan). (B) Ratio of 2nd order neurons between the two conditions in (A), normalized by the number of putative starter neurons in the CA1 pyramidal layer, demonstrates higher efficacy of propagation under the N2cG, for all regions tested. (C) Retrograde labeling efficacy ratio between CVS-N2c and SAD-B19 vectors shown in Figure 3H, corrected for the added effect of the glycoprotein to the propagation efficacy of the CVS-N2c vectors by dividing the values for the SAD-B19 condition in Figure 2H, with the corresponding ratio estimates measured in (B).
Figure 4 with 1 supplement
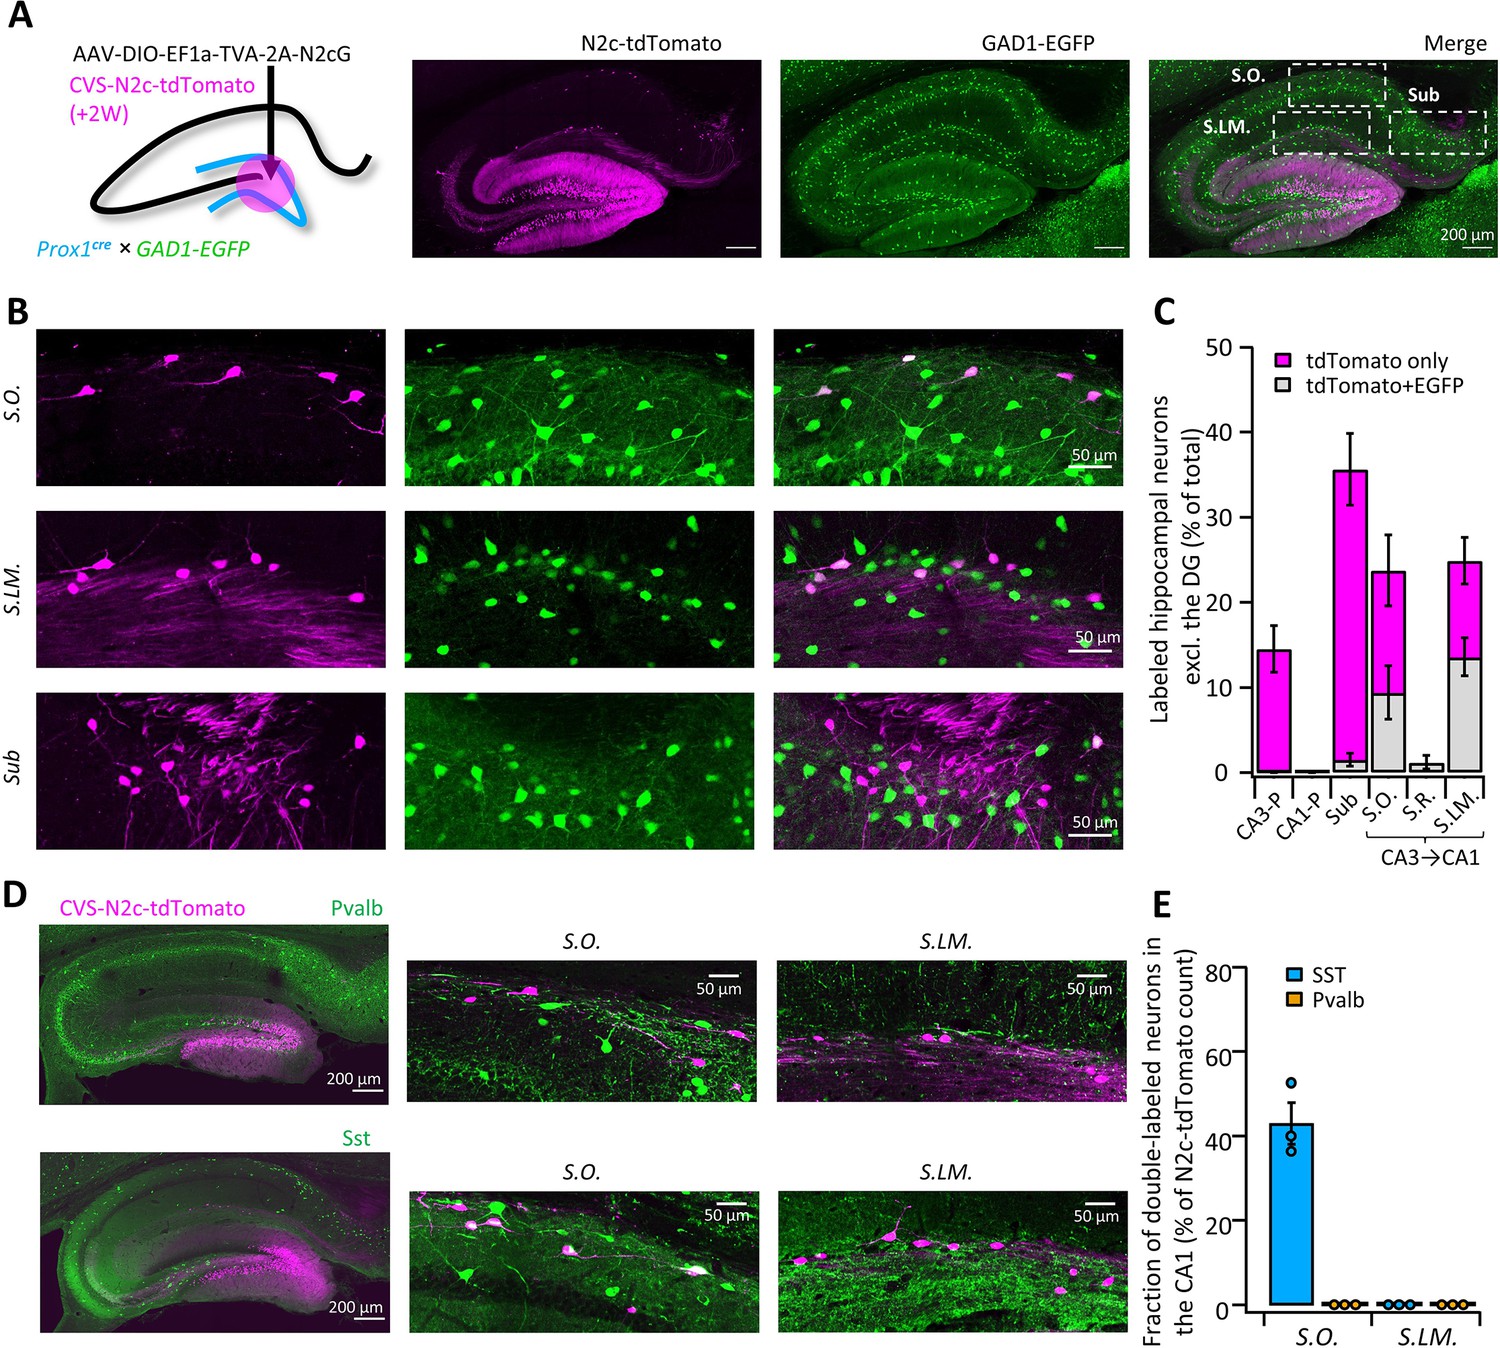
High-throughput retrograde labeling with CVS-N2c enables identification of non-canonical projections to DGCs.
(A) Schematic illustration and representative confocal images, describing the injection scheme designed to target DGCs for retrograde labeling in an interneuron reporter line. (B) Representative confocal images (left) of the regions highlighted in (A) showing retrogradely-labeled neurons along specific hippocampal layers and their overlay with the interneuron-specific marker. (C) Summary bar plot showing the distribution of DG-projecting hippocampal neurons outside of the DG (magenta) and of them, the fraction of double-labeled neurons (grey). Calculation of cell numbers in the dendritic cell layers combined cells along the entire proximo-distal hippocampal axis, from CA3 to CA1. N=189 cells from 3 animals. (D) Representative parasagittal sections of the hippocampus following retrograde labeling from the DG with CVS-N2c-tdTomato, along with immunolabeling of parvalbumin (Pvalb, top) and Somatostatin (Sst, bottom). Expanded view of the S.O. and S.LM. are shown to the right of each image. (E) Summary plot describing the proportion of Pvalb- or Sst-positive neurons of the total CVS-N2c labeled neurons in the S.O. or S.LM. of the CA1. N=125 cells from three animals.
-
Figure 4—source data 1
Cell count for experimental designs and ratio calculations.
Tables showing the cell count for tdTomato only and tdTomato +EGFP + cells per layer/section/animal along with the calculated normalized averages used to plot Figure 4C. Below, are two tables showing the average cell count per layer/slice in three individual animals, following immunolabeling for PV and Sst, used to plot Figure 4E.
- https://cdn.elifesciences.org/articles/79848/elife-79848-fig4-data1-v2.xlsx
Figure 4—figure supplement 1
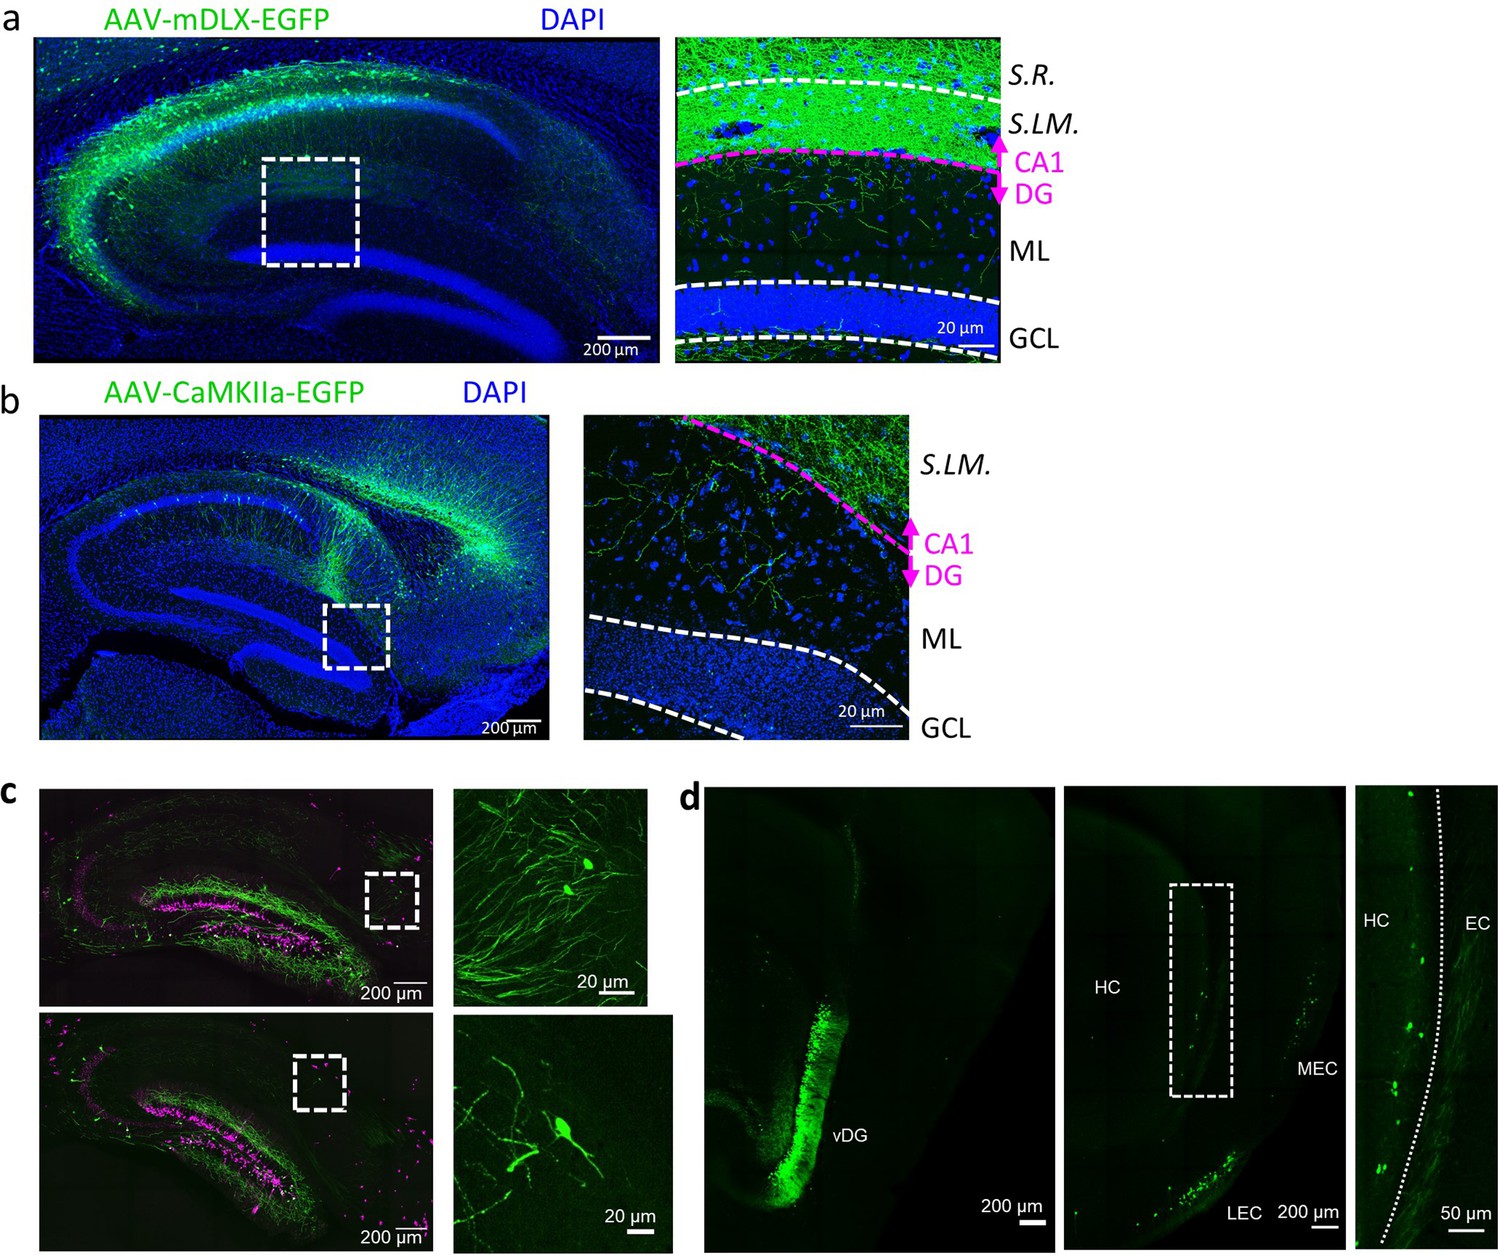
Cross validation of novel excitatory and inhibitory intrahippocampal projections to DGCs.
(A and B) Both injection of AAV-mDLX-EGFP, for specific expression in inhibitory neurons, into the CA1 (A), as well as injection of AAV-CaMKII-EGFP, for specific expression in excitatory neurons, into the subiculum (B) reveal axonal arborizations in the molecular layer of the DG. (C) Retrograde labeling from a sparse population of adult-born DGCs (as shown in Figure 2B) also reveals projections from the subiculum (top) and S.O. (bottom). (D) Retrograde labeling from the ventral DG (vDG) using the Prox1cre line (left panel) shows projection neurons along the superficial most layer of the ventral subiculum (middle and right panels).
Figure 5 with 1 supplement
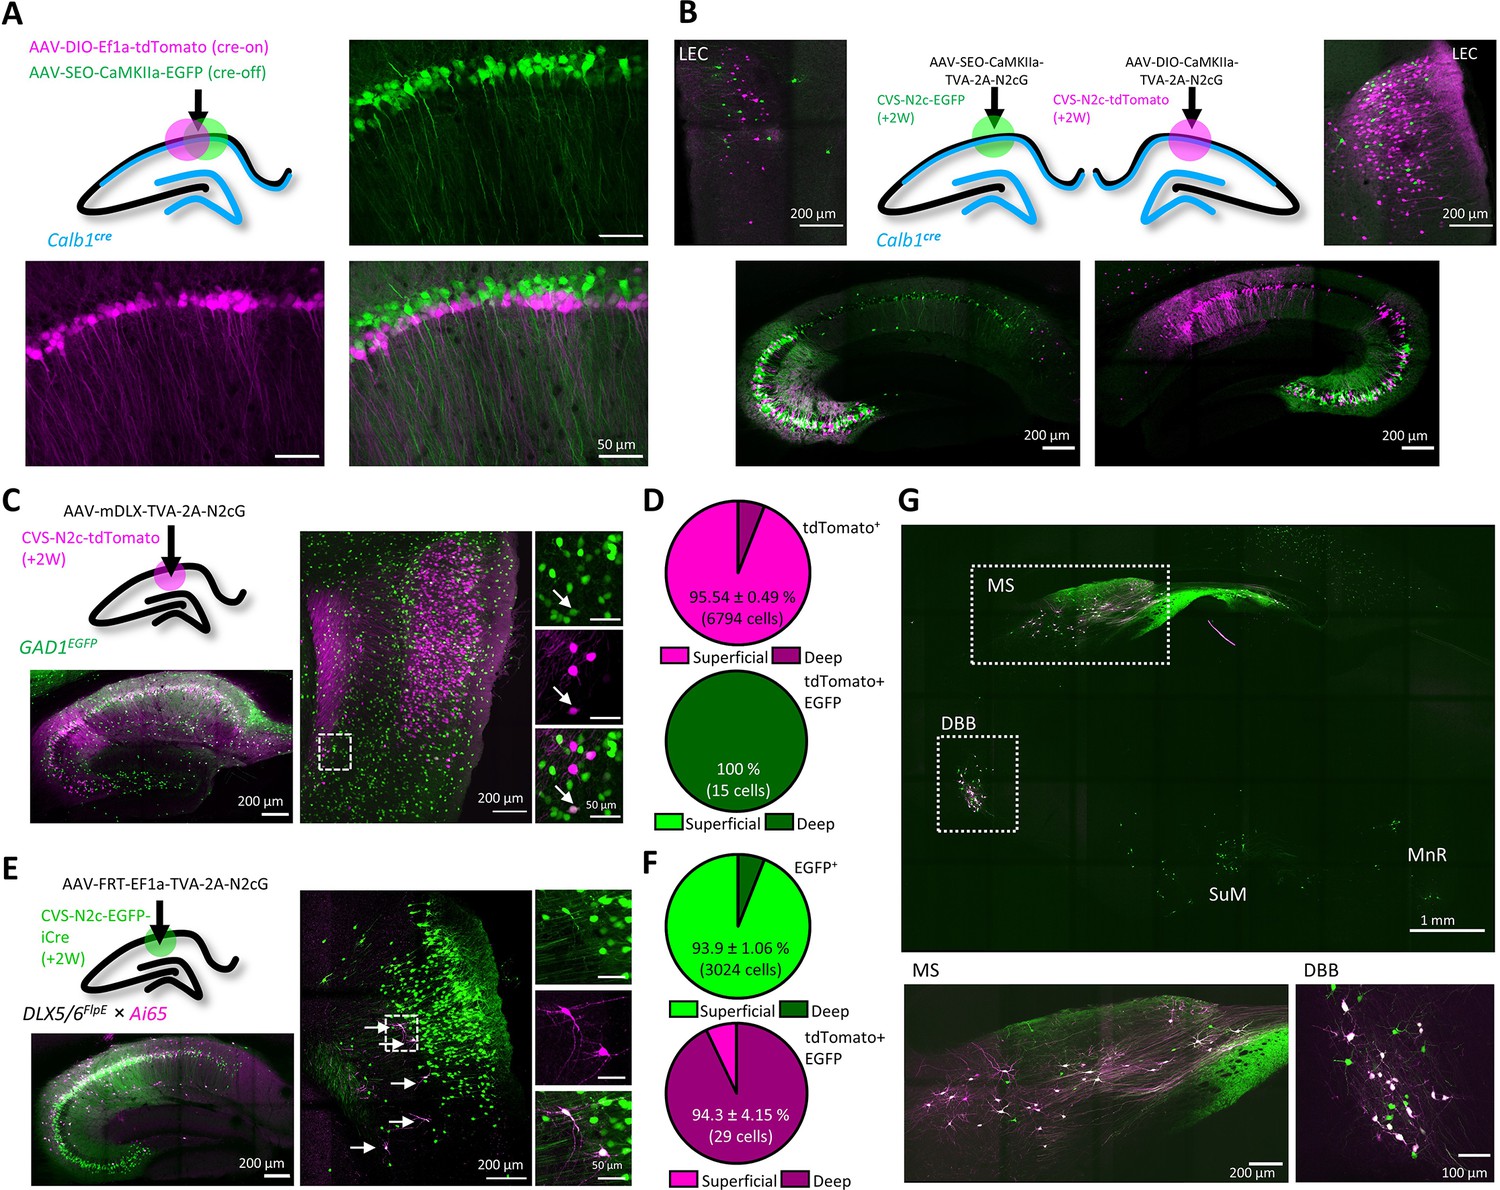
An AAV vector suite for targeting multiple and diverse neuronal populations.
(A) Graphical representation (top left) and representative confocal images, demonstrating differential targeting of superficial and deep CA1 pyramidal neurons using a combination of cre-on and cre-off AAV vectors. (B) Graphical representation (top center) for dual retrograde labeling from superficial (bottom left, green) and deep (bottom right, magenta) CA1 pyramidal neurons and the resulting distribution pattern of their corresponding projection neurons in the EC (top left and top right). (C) Graphical representation of the viral injection scheme for mapping inputs into hippocampal inhibitory neurons (top left), and representative parasagittal images of labeled cells in the HC (bottom left) and LEC (right). Expanded images show a double-labeled neuron in EC-6. (D) Distribution of all retrogradely labeled cells (top) and of double-labeled cells only (bottom) among the superficial layers 2 and 3 and the deep layers 5 and 6 of the LEC. N=8 sections/3 animals. (E) Same as (C), but for Dlx5/6FlpE × Ai65 mice. (F) Same as (D) for the experiments described in (E). N=8 sections/3 animals. (G), A representative parasagittal image of deep brain structures following the injection scheme described in (E). SuM – Supramammilary Nucleus; MnR – Median nucleus Raphe.
Figure 5—figure supplement 1

Targeting specificity of newly designed AAV vectors.
(A) A schematic illustration demonstrating the differential effect of cre-mediated recombination on double-floxed, inverted open reading frames (DIO, left) or single-floxed, excisable open reading frames (SEO, right). (B) Representative confocal images from the hippocampus of a GAD1-EGFP mouse (cyan), injected with AAV-mDLX-TVA-2A-N2cG (orange) and subsequently CVS-N2c-tdTomato (magenta) into the hippocampal CA1. Green arrows in the expanded images indicate starter neurons expressing all three markers, grey arrows indicate 2nd order interneurons, expressing EGFP and tdTomato, but not TVAFLAG-2A-N2cG, and white arrows indicate potential, yet non-participating interneurons expressing GAD1 and TVAFLAG-2A-N2cG, but not tdTomato.
Figure 6 with 1 supplement
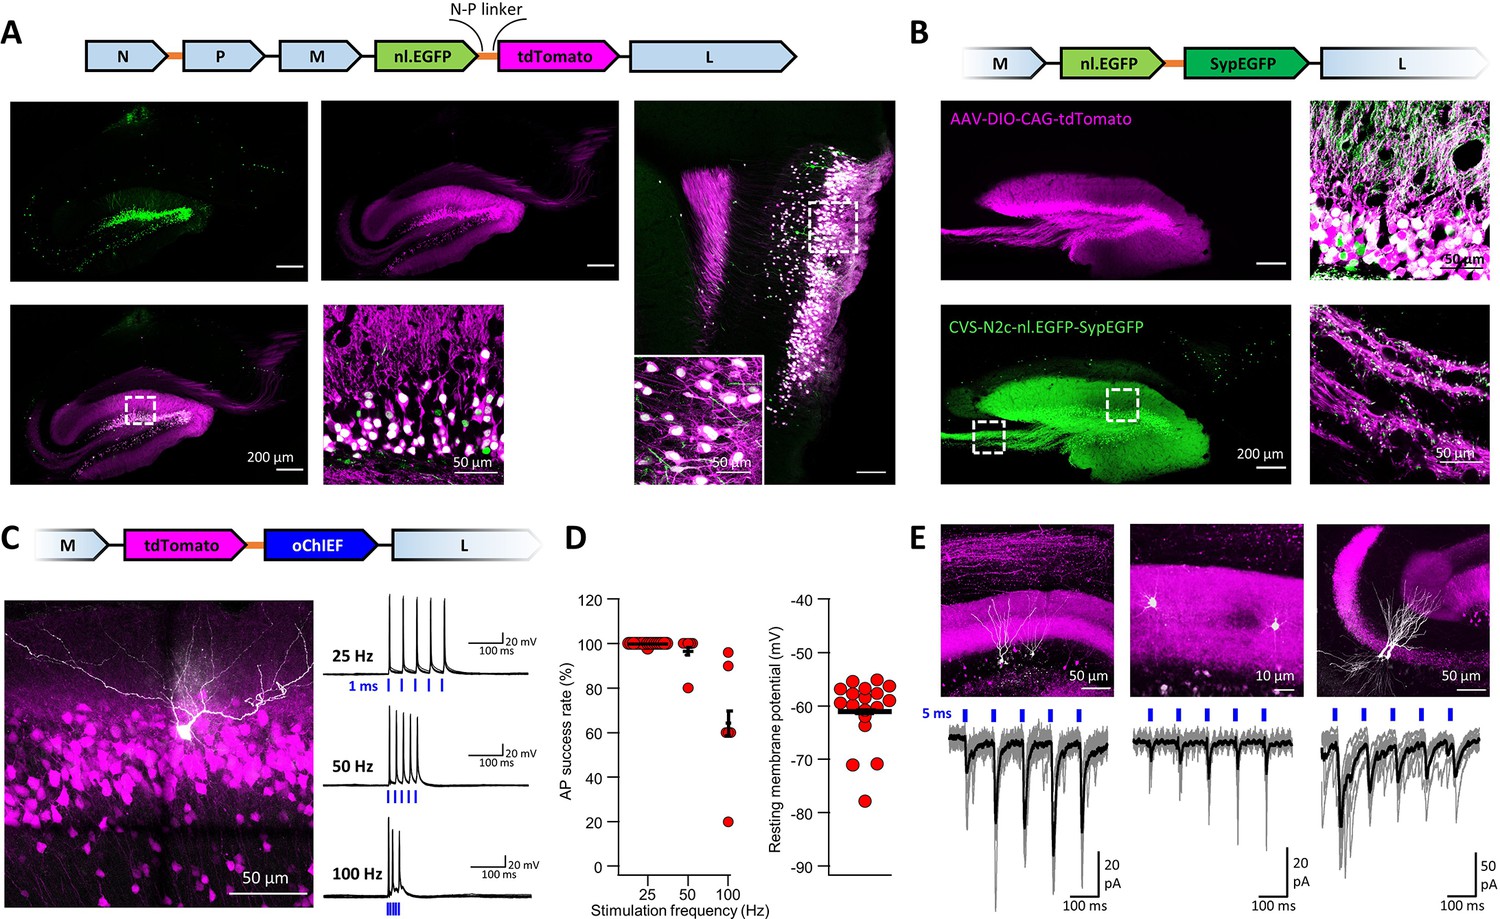
An extended suite of RVdG-CVS-N2c vectors for bicistronic expression of fluorescent markers and optogenetic effectors.
(A) Schematic illustration of the vector sequence, designed to drive independent bicistronic expression of a nuclear-localized EGFP (nl.EGFP) alongside tdTomato, using the N-P linker sequence (top). Representative confocal images of the HC (bottom right) and EC (bottom left) following retrograde labeling from the DG, demonstrate the differential localization, indicating effective separation of the fluorophores. (B) Schematic diagram of a bicistronic nl.EGFP +SypGFP CVS-N2c vector (top) used for retrograde labeling from the DG (right panels) and representative confocal images demonstrating dual nuclear and synaptic localization of EGFP in the dentate granular and molecular layer (top right image) and purely synaptic localization at the mossy fibers terminals (bottom right image). (C) Schematic diagram of a bicistronic tdTomato +oChIEF CVS-N2c vector (top) used for retrograde labeling from the DG, and a representative image of a biocytin-filled neuron (white) in MEC-2 (bottom left) along with representative traces from 10 overlaid recordings at different frequencies (bottom right). (D) Summary plots of the action potential success rate for recordings made 6–7 days after introduction of RVdG (left) and their resting membrane potential at the time of recording (right) demonstrate the light responsiveness and physiological condition of the labeled neurons. (E) Representative confocal images (top) of DGCs (left), DG molecular layer interneurons (center) and CA3 pyramidal neurons (right) and their synaptic responses to optogenetic activation of the perforant path (bottom) following retrograde labeling from the dorsal DG with the bicistronic CVS-N2c-tdTomato-oChIEF vector.
-
Figure 6—source data 1
Firing rate and membrane potential properties of neurons transduced with CVS-N2c-tdTomato-ChIEF, 7 days post transduction.
The table details the firing properties of 6 cells to stimulation frequencies of 25, 50, and 100 Hz and 12 additional cells to stimulation of 25 Hz only. The average resting membrane potential for each cell is shown in the rightmost column.
- https://cdn.elifesciences.org/articles/79848/elife-79848-fig6-data1-v2.xlsx
Figure 6—figure supplement 1
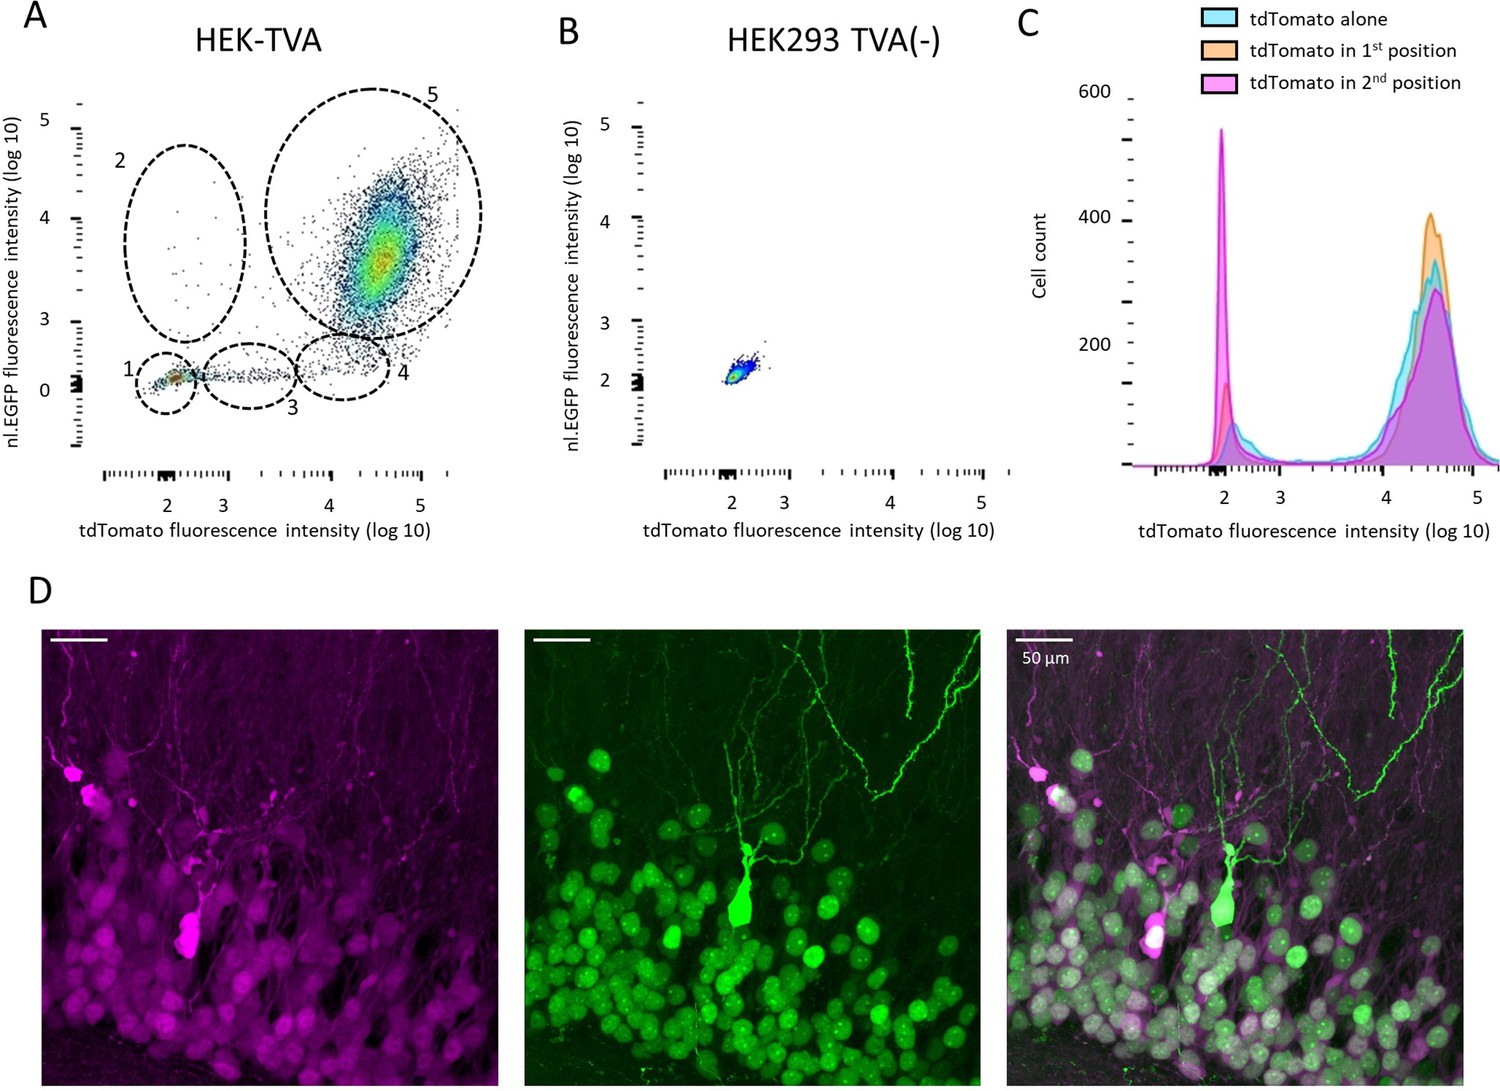
Additional properties of bicistronic RVdG-CVS-N2c vectors.
(A and B) FACS analysis of fluorescence intensity in HEK-TVA cells transduced with RVdGenvA-CVS-N2c-nl.EGFP-tdTomato (A) or HEK293 cells transduced with 10 X concentration of the same vector (B). Five different clusters of labeled cells are highlighted in (A), likely representing: (1) tdTomato-/nl.EGFP- Non-transduced cells; (2) tdTomato-/nl.EGFP+ Cells with a putative null mutation in the tdTomato gene; (3) tdTomatolow/nl.EGFP- putatively undergoing mitosis and lacking a defined nucleus; (4) tdTomato+/nl.EGFP- with a putative null mutation in the EGFP gene; (5) tdTomato+/nl.EGFP+ with no putative mutations. (C) Quantification of fluorescence intensity for three different RVdG-CVS-N2c vectors, in which tdTomato is expressed alone, or in a bicistronic vector in either the first (tdTomato-FlpO) or second (nl.EGFP-tdTomato) position shows no substantial differences in tdTomato fluorescence intensity. (D) A representative, high-magnification confocal image of the granule cell layer of the DG, following targeting of the RVdGenvA-CVS-N2c-nl.EGFP-tdTomato vector, showing a cell expressing a soluble EGFP, which is likely the result of a mutation in the nuclear localization signal.
Figure 7 with 1 supplement
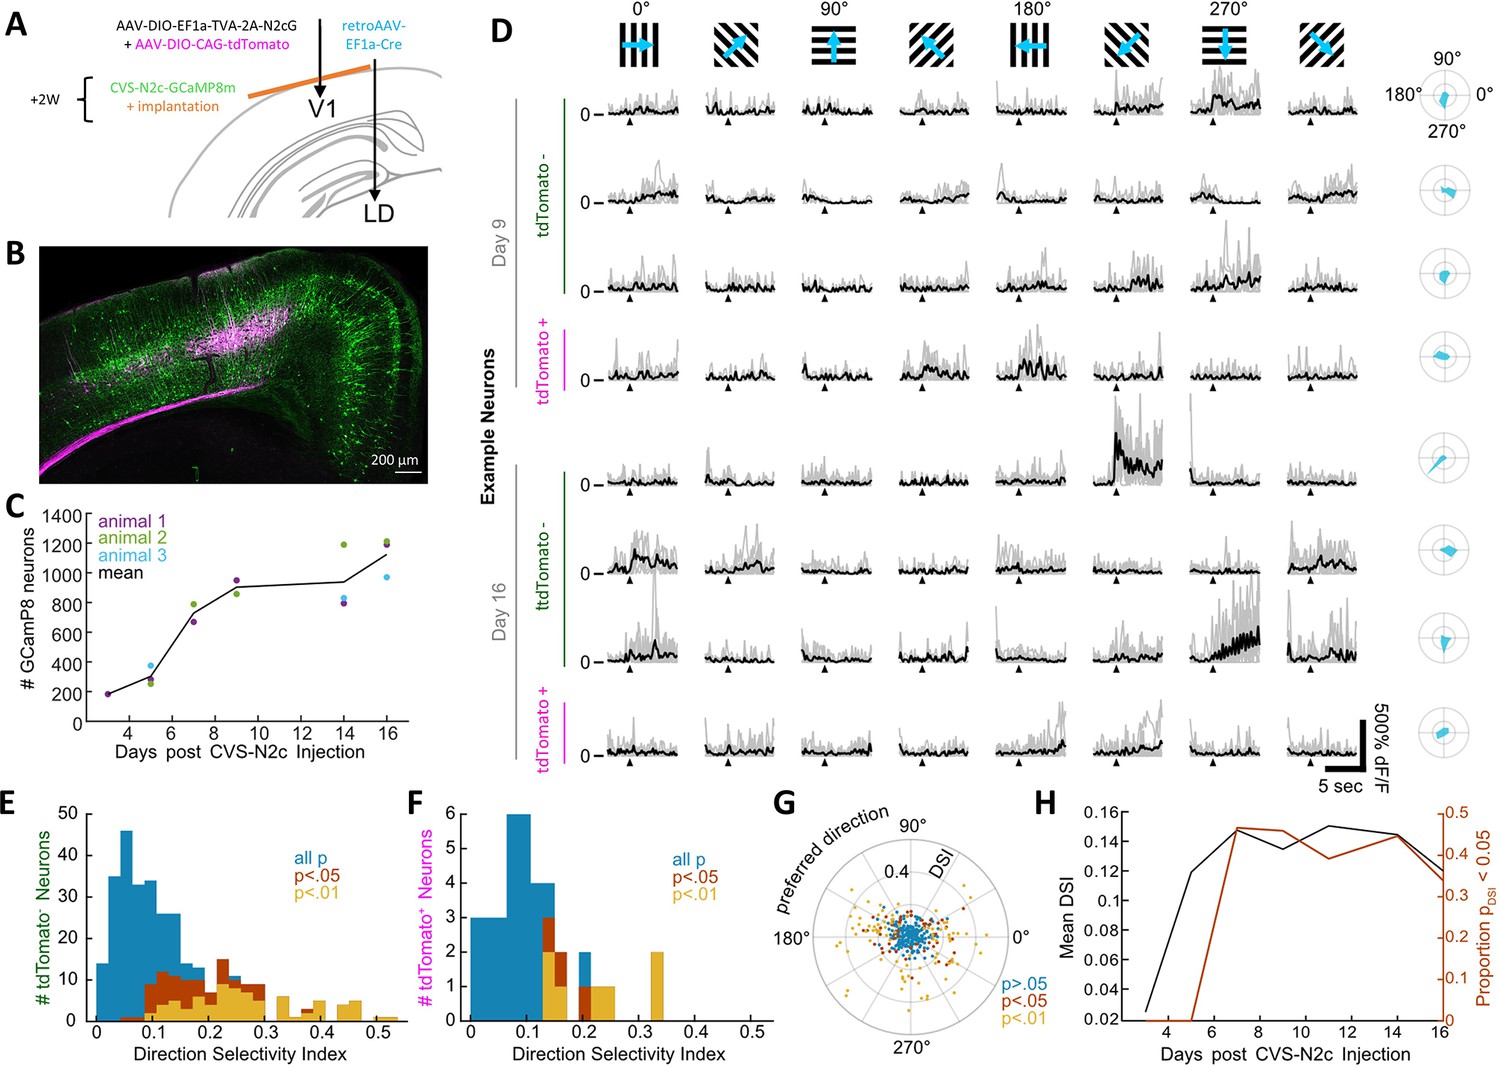
New CVS-N2c vectors for in vivo two-photon long-term imaging of activity in a cortical microcircuit.
(A) Illustration of the injection scheme for labeling projections onto the V1 region’s layer 5 neurons with GCaMP8m. (B) A representative confocal image of a coronal section following the injection scheme described in (A). (C) GCaMP8m-positive neuron numbers over recording days. (D) In vivo two-photon imaging in presynaptic neurons. Drifting gratings in 8 directions (top row). Trial responses (grey) and average (black) for example neurons on day 9 and day 16, stimulation starts at black triangle. Polar plot of the directional responses in right column. (E) Histogram of direction selectivity for tdTomato-negative (2nd order) neurons. (F) Same as in E for tdTomato-positive (starter) neurons. (G) Polar scatter plot of direction selectivity (radial) over preferred direction (angular) for all recorded neurons. (H) Mean DSI and proportion of significant direction selectivity over recording days.
-
Figure 7—source data 1
Calcium transient properties of GCaMP8m expressing neurons in vivo.
The data file is divided into 5 separate tabs, each labeled according to the plot it was used to generate. All data is presented in tables, with the individual animal, recording day and identity (tdTomato+ or tdTomato-) indicated for each data line.
- https://cdn.elifesciences.org/articles/79848/elife-79848-fig7-data1-v2.xlsx
Figure 7—figure supplement 1
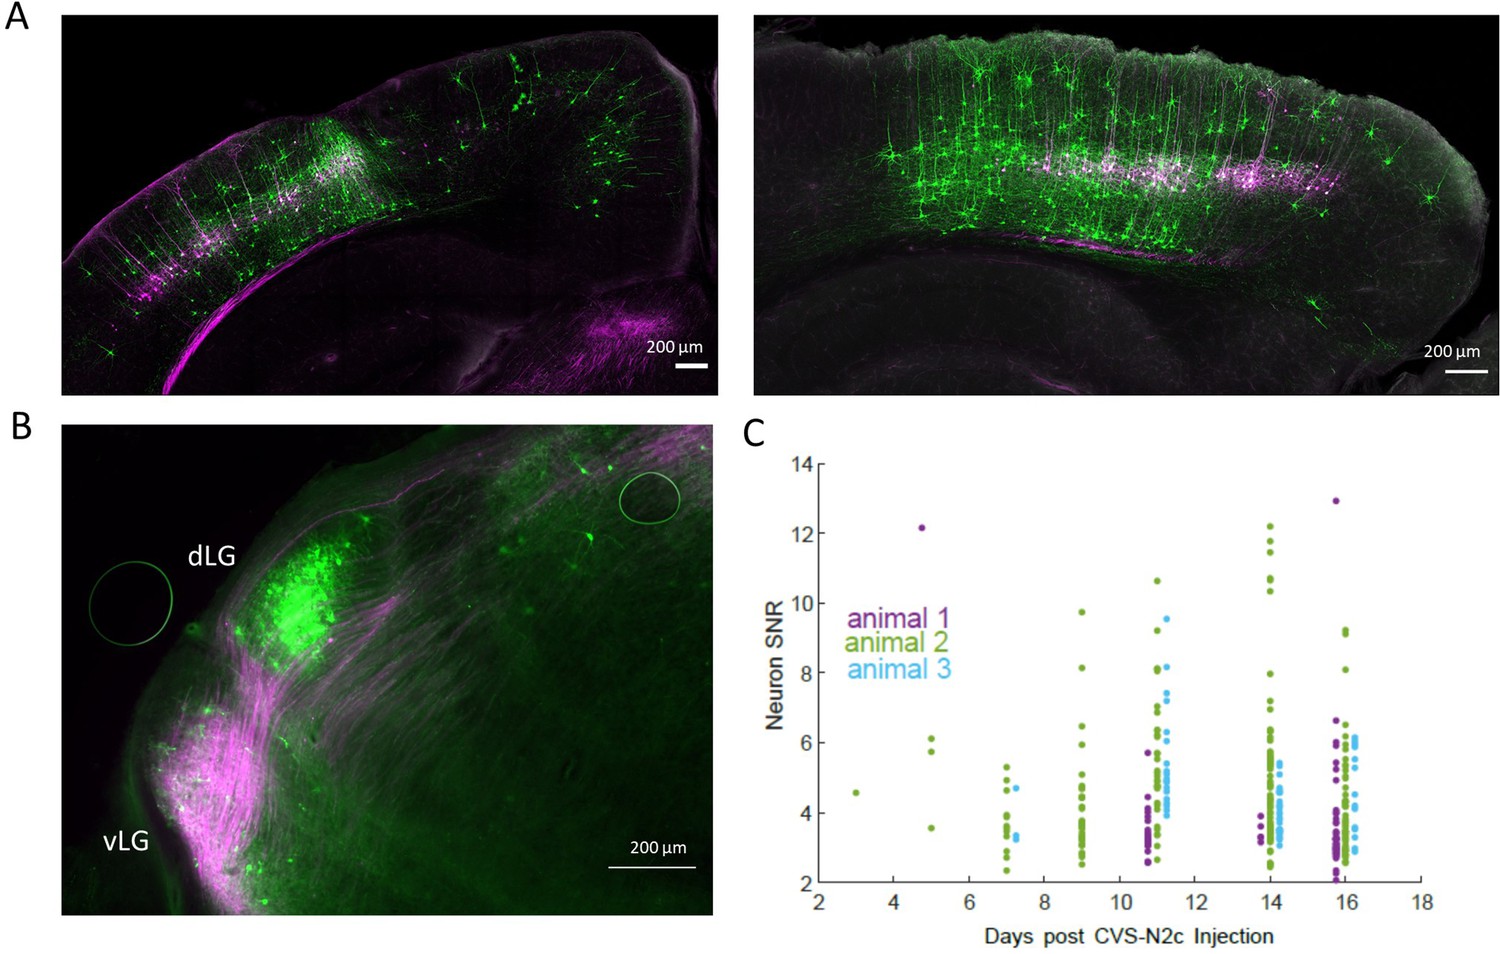
Retrograde labeling specificity for in vivo calcium imaging with RVdGenvA-CVS-N2c-GCaMP8m.
(A) Representative confocal images of the V1 area in the coronal plane (animal 2, left) or of the sagittal plane (animal 3, right) of the two additional animals used in the experiment. (B) A representative fluorescent microscope image of the lateral geniculate nucleus showing retrogradely-labeled, V1 layer 5-projecting neurons in the dorsolateral geniculate nucleus (dLG) and fibers originating in V1 layer 5 neurons in the ventrolateral geniculate nucleus (vLG). (C) A time plot showing the gradual change in signal-to-noise ratio (SNR) for all three animals throughout the experiment.
Tables
Table 1
Rescue from DNA and amplification of native-coat stock.
| B7GG (Osakada and Callaway, 2013) | Neuro2a-N2cG (Reardon et al., 2016) | HEK-GT | |
|---|---|---|---|
| Stably-expressed transgenes | T7 polymerase +SAD-B19G | CVS-N2cG | Optimized T7 polymerase (oT7)+optimized SAD-B19G (oG) |
| Selection markers | Fluorescence | Fluorescence | Antibiotic resistance genes |
| Transfected genes | Vector +N,P, G & L | Vector +T7, N,P,G & L | Vector +N,P & L |
| Transfection efficiency | Low | Low | High |
| Growth conditions | 3% CO2 at 35 °C | 3% CO2 at 35 °C | 5% CO2 at 37 °C |
| Rescue timeline | 10–11 days | 10–11 days | 5–6 days |
| Initial amplification timeline | 9–11 days | 14–21 days | Not required |
| Compatibility | SAD-B19 (CVS-N2c) possible, but not tested | CVS-N2c only | Both SAD-B19 and CVS-N2c |
Table 2
Pseudotyping of rescued vectors.
| BHK-EnvA (Osakada and Callaway, 2013) | Neuro2a-envA (Reardon et al., 2016) | BHK-eT | |
|---|---|---|---|
| Stably-expressed transgenes | envA or envB | envA | envA +TVA |
| Selection markers | Fluorescence | Fluorescence | Antibiotic resistance genes |
| Growth conditions | 3% CO2 at 35 °C | 3% CO2 at 35 °C | 5% CO2 at 37 °C |
| Pseudotyping timeline | 7–10 days | 28 days | 4–6 days |
| Requirements for pseudotyping | Large stock of native-coat particles | Large stock of native-coat particles | Trace amounts of either native-coat or evA pseudotyped stock |
| Titer | Low 10^8 typical | Low 10^7 typical | High 10^9 typical |
| Native-coat background | 10^2 typical | Not detectable | Not detectable |
Key resources table
| Reagent type (species) or resource | Designation | Source or reference | Identifiers | Additional information |
|---|---|---|---|---|
| Strain, strain background (mouse Prox1cre) | Tg(Prox1-cre)SJ32Gsat/Mmucd | MMRRC (N. Heintz) | 036644-UCD | |
| Strain, strain background (mouse Calb1cre) | B6;129S-Calb1tm2.1(cre)Hze/J | Jackson labs (H. Zeng) | 028532 | |
| Strain, strain background (mouse Ascl1creERT2) | Ascl1tm1.1(Cre/ERT2)Jejo/J | Jackson labs (J. Johnson) | 012882 | |
| Strain, strain background (mouse Ai14) | B6.Cg-Gt(ROSA)26Sortm14(CAG-tdTomato)Hze/J | Jackson labs (H. Zeng) | 007914 | |
| Strain, strain background (mouse GAD1EGFP) | Not deposited | K.Obata and Y.Yanagawa Tamamaki, N., Yanagawa, Y., Tomioka, R., Miyazaki, J.I., Obata, K., and Tamamaki et al., 2003. Green fluorescent protein expression and colocalization with calretinin, parvalbumin, and somatostatin in the GAD67-GFP knock-in mouse. Journal of Comparative Neurology 467, 60–79. https://doi.org/10.1002/cne.10905. | ||
| Strain, strain background (mouse Dlx5/6FlpE) | Tg(mI56i-flpe)39Fsh/J | Jackson labs (G. Fishell) | 010815 | |
| Strain, strain background (mouse RCE-FRT) | Gt(ROSA)26Sortm1.2(CAG-EGFP)Fsh/Mmjax | Jackson labs (G. Fishell) | 32038 | |
| Strain, strain background (mouse Ai65) | B6;129S-Gt(ROSA)26Sortm65.1(CAG-tdTomato)Hze/J | Jackson labs (H. Zeng) | 010815 | |
| Cell line (human) | HEK293T | ATCC | CRL-3216 | |
| Cell line (hamster) | BHK-21 | ATCC | CCL-10 | |
| Cell line (human) | HEK-GT | This paper | ||
| Cell line (human) | HEK-TVA | This paper | ||
| Cell line (hamster) | BHK-eT | This paper | ||
| Recombinant DNA reagent (plasmid) | pCAG-B19N | AddGene (I. Wickersham) | #59924 | |
| Recombinant DNA reagent (plasmid) | pCAG-B19P | AddGene (I. Wickersham) | #59925 | |
| Recombinant DNA reagent (plasmid) | pCAG-B19L | AddGene (I. Wickersham) | #59922 | |
| Recombinant DNA reagent (plasmid) | pAdDeltaF6 | AddGene (J. Wilson) | #112867 | |
| Recombinant DNA reagent (plasmid) | rAAV-DJ RepCap | Mark A. Kay | ||
| Recombinant DNA reagent (plasmid) | rAAV2-retro helper | AddGene (A. Karpova and D. Schaffer) | #81070 | |
| Recombinant DNA reagent (plasmid) | pAAV-EF1a-Cre | AddGene (K. Deisseroth) | #55636 | |
| Recombinant DNA reagent (plasmid) | pAAV-DIO-hSyn-mCherry | AddGene (K. Deisseroth) | #114472 | |
| Recombinant DNA reagent (plasmid) | RVdG-RVDG-CVS-N2c-EGFP | AddGene (T. Jessell) | #73461 | |
| Recombinant DNA reagent (plasmid) | RVdG-RVDG-CVS-N2c-tdTomato | AddGene (T. Jessell) | #73462 | |
| Recombinant DNA reagent (plasmid) | pAAV-DIO-Ef1a-TVA-2A-oG | This paper | #172359 | |
| Recombinant DNA reagent (plasmid) | pAAV-DIO-Ef1a-TVA-2A-N2cG | This paper | #172360 | |
| Recombinant DNA reagent (plasmid) | pAAV-FRT-EF1a-TVA-2A-N2cG | This paper | #172361 | |
| Recombinant DNA reagent (plasmid) | pAAV-DIO-CaMKII-TVA-P2A-N2cG | This paper | #172362 | |
| Recombinant DNA reagent (plasmid) | pAAV-SEO-CaMKII-TVA-P2A-N2cG | This paper | #172363 | |
| Recombinant DNA reagent (plasmid) | pAAV-mDLX-TVA-2A-N2cG | This paper | #172364 | |
| Recombinant DNA reagent (plasmid) | pAAV-DIO-mDLX-TVA-2A-N2cG | This paper | #172365 | |
| Recombinant DNA reagent (plasmid) | pAAV-DIO-CAG-TVA-P2A-dTomato | This paper | #177016 | |
| Recombinant DNA reagent (plasmid) | pAAV-DIO-EF1a-TVA-P2A-EYFP | This paper | #177017 | |
| Recombinant DNA reagent (plasmid) | pAAV-SEO-CaMKII-EGFP | This paper | #177018 | |
| Recombinant DNA reagent (plasmid) | MMLV-CAG-TVA-IRES-Puro | This paper | #172366 | |
| Recombinant DNA reagent (plasmid) | MMLV-CAG-SADB19_oG-IRES-Puro | This paper | #172367 | |
| Recombinant DNA reagent (plasmid) | MMLV-CAG-G_oT7pol-IRES-BSD | This paper | #172369 | |
| Recombinant DNA reagent (plasmid) | pLV-EF1a-N2c_envA-IRES-Neo | This paper | #172368 | |
| Recombinant DNA reagent (plasmid) | RVDG-CVS-N2c-tdTomato-ChIEF | This paper | #172370 | |
| Recombinant DNA reagent (plasmid) | RVDG-CVS-N2c-EGFP-ChIEF | This paper | #172371 | |
| Recombinant DNA reagent (plasmid) | RVDG-CVS-N2c-EGFP-iCre | This paper | #172372 | |
| Recombinant DNA reagent (plasmid) | RVDG-CVS-N2c-EGFP-FlpO | This paper | #172373 | |
| Recombinant DNA reagent (plasmid) | RVDG-CVS-N2c-tdTomato-iCre | This paper | #172374 | |
| Recombinant DNA reagent (plasmid) | RVDG-CVS-N2c-tdTomato-FlpO | This paper | #172375 | |
| Recombinant DNA reagent (plasmid) | RVDG-CVS-N2c-mTurquoise | This paper | #172376 | |
| Recombinant DNA reagent (plasmid) | RVDG-CVS-N2c-E2_Crimson | This paper | #172377 | |
| Recombinant DNA reagent (plasmid) | RVDG-CVS-N2c-nl.mCherry-FlpO | This paper | #172378 | |
| Recombinant DNA reagent (plasmid) | RVDG-CVS-N2c-nl.EGFP-FlpO | This paper | #172379 | |
| Recombinant DNA reagent (plasmid) | RVDG-CVS-N2c-nl.EGFP-SypGFP | This paper | #172380 | |
| Recombinant DNA reagent (plasmid) | RVDG-CVS-N2c-SypRFP | This paper | #172381 | |
| Recombinant DNA reagent (plasmid) | RVDG-CVS-N2c-nl.EGFP-tdTomato | This paper | #172382 | |
| Recombinant DNA reagent (plasmid) | RVDG-CVS-N2c-EYFP | This paper | #172383 | |
| Recombinant DNA reagent (plasmid) | RVDG-CVS-N2c-mCitrine | This paper | #172384 | |
| Recombinant DNA reagent (plasmid) | RVDG-CVS-N2c-nl.mCherry-GCaMP7s | This paper | #172385 | |
| Recombinant DNA reagent (plasmid) | RVDG-CVS-N2c-nl.EGFP-jRGECO1a | This paper | #172386 | |
| Recombinant DNA reagent (plasmid) | RVDG-CVS-N2c-GCaMP8f | This paper | #172387 | |
| Recombinant DNA reagent (plasmid) | RVDG-CVS-N2c-GCaMP8m | This paper | #172388 | |
| Recombinant DNA reagent (plasmid) | RVDG-CVS-N2c-GCaMP8s | This paper | #172389 | |
| Antibody | Anti parvalbumin (rabbit polyclonal) | Swant antibodies | PV-27 | 1:1000 dilution |
| Antibody | Anti somatostatin (rabbit polyclonal) | BMA Biomedicals | T-4102 | 1:1000 dilution |
| Antibody | Anti EGFP (Chicken polyclonal) | Abcam | AB13970 | 1:1000 dilution |
| Antibody | Anti FLAG (mouse monoclonal) | Sigma Alderich | F1804 | 1:1000 dilution |
| Antibody | Alexa Fluor 647-conjugated goat anti-rabbit | Invitrogen | A-21244 | 1:1000 dilution |
| Antibody | Alexa Fluor 647-conjugated goat anti-mouse | Invitrogen | A-21235 | 1:1000 dilution |
| Antibody | Alexa Fluor 488-conjugated goat anti-chicken | Invitrogen | A-11039 | 1:1000 dilution |
Additional files
Download links
A two-part list of links to download the article, or parts of the article, in various formats.
Downloads (link to download the article as PDF)
Open citations (links to open the citations from this article in various online reference manager services)
Cite this article (links to download the citations from this article in formats compatible with various reference manager tools)
Fast, high-throughput production of improved rabies viral vectors for specific, efficient and versatile transsynaptic retrograde labeling
eLife 11:e79848.
https://doi.org/10.7554/eLife.79848


