Trends in female-selective abortion among Asian diasporas in the United States, United Kingdom, Canada and Australia
- Centre for Global Health Research, Unity Health Toronto and Dalla Lana School of Public Health, University of Toronto, Canada
Figures
Figure 1
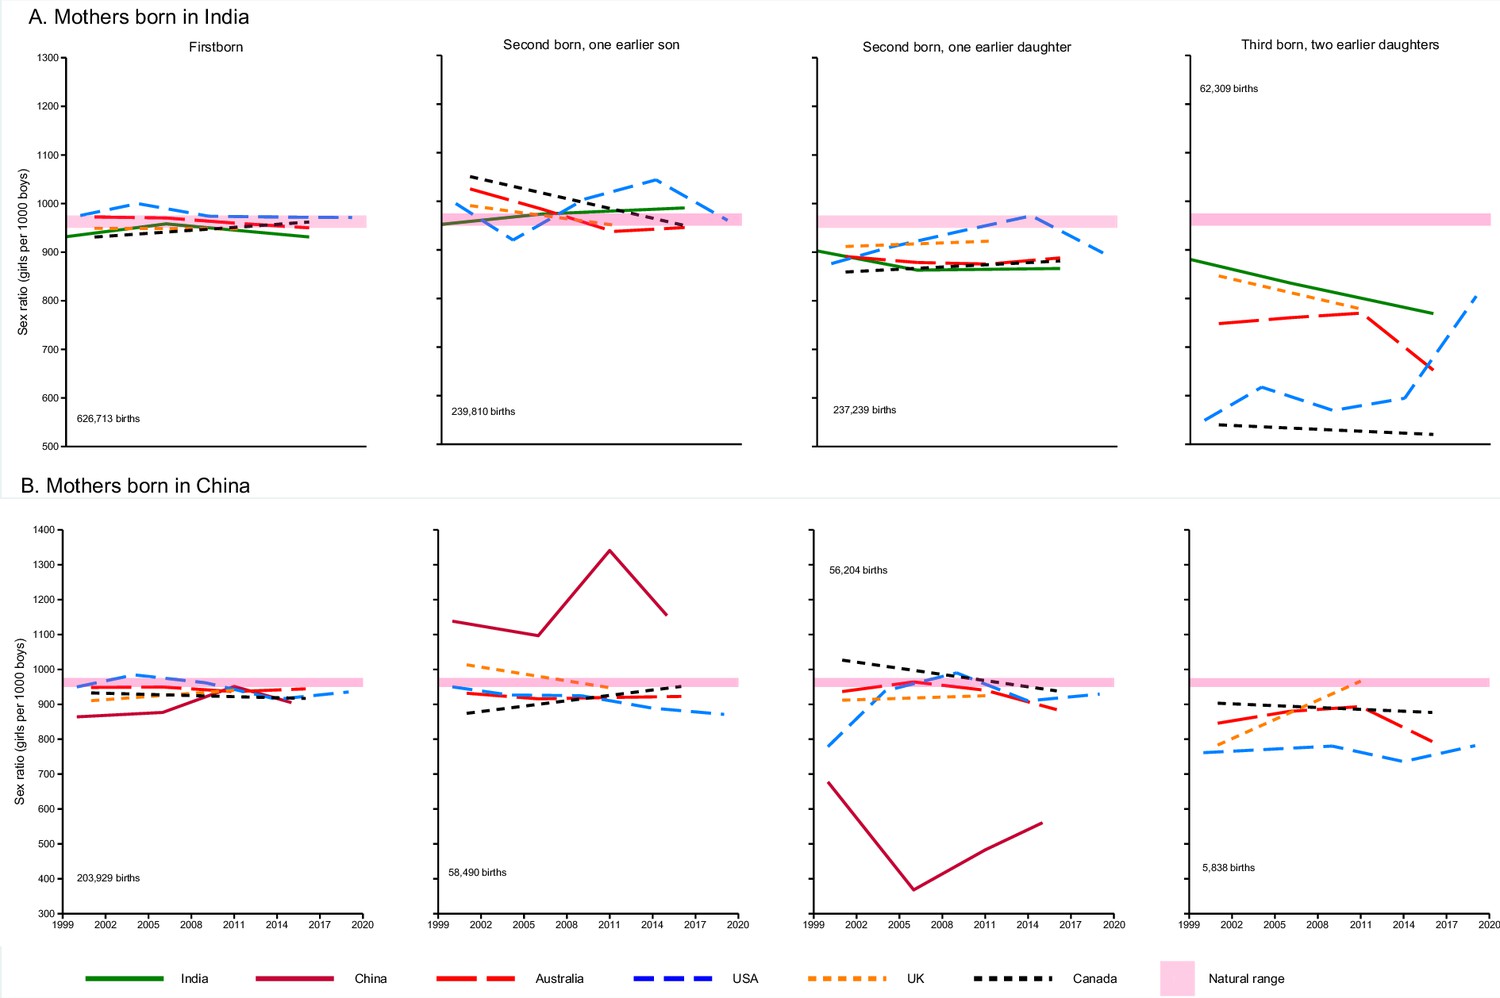
Conditional sex ratio (CSR) by birth order and country of birth.
Second and third births in China indicate births in provinces or areas where more than one child was allowed. Solid lines represent births in India (green) and China (burgundy). Dash lines represent births among Indian and Chinese diasporas in Australia, Canada, UK, and US. CSRs shown are based on the total number of births (shown on each graph) for each birth order and its corresponding sex composition for all women of the specified background in each country. Deviations from the natural range are indicative of the difference in the observed CSRs from the baseline.
Figure 2
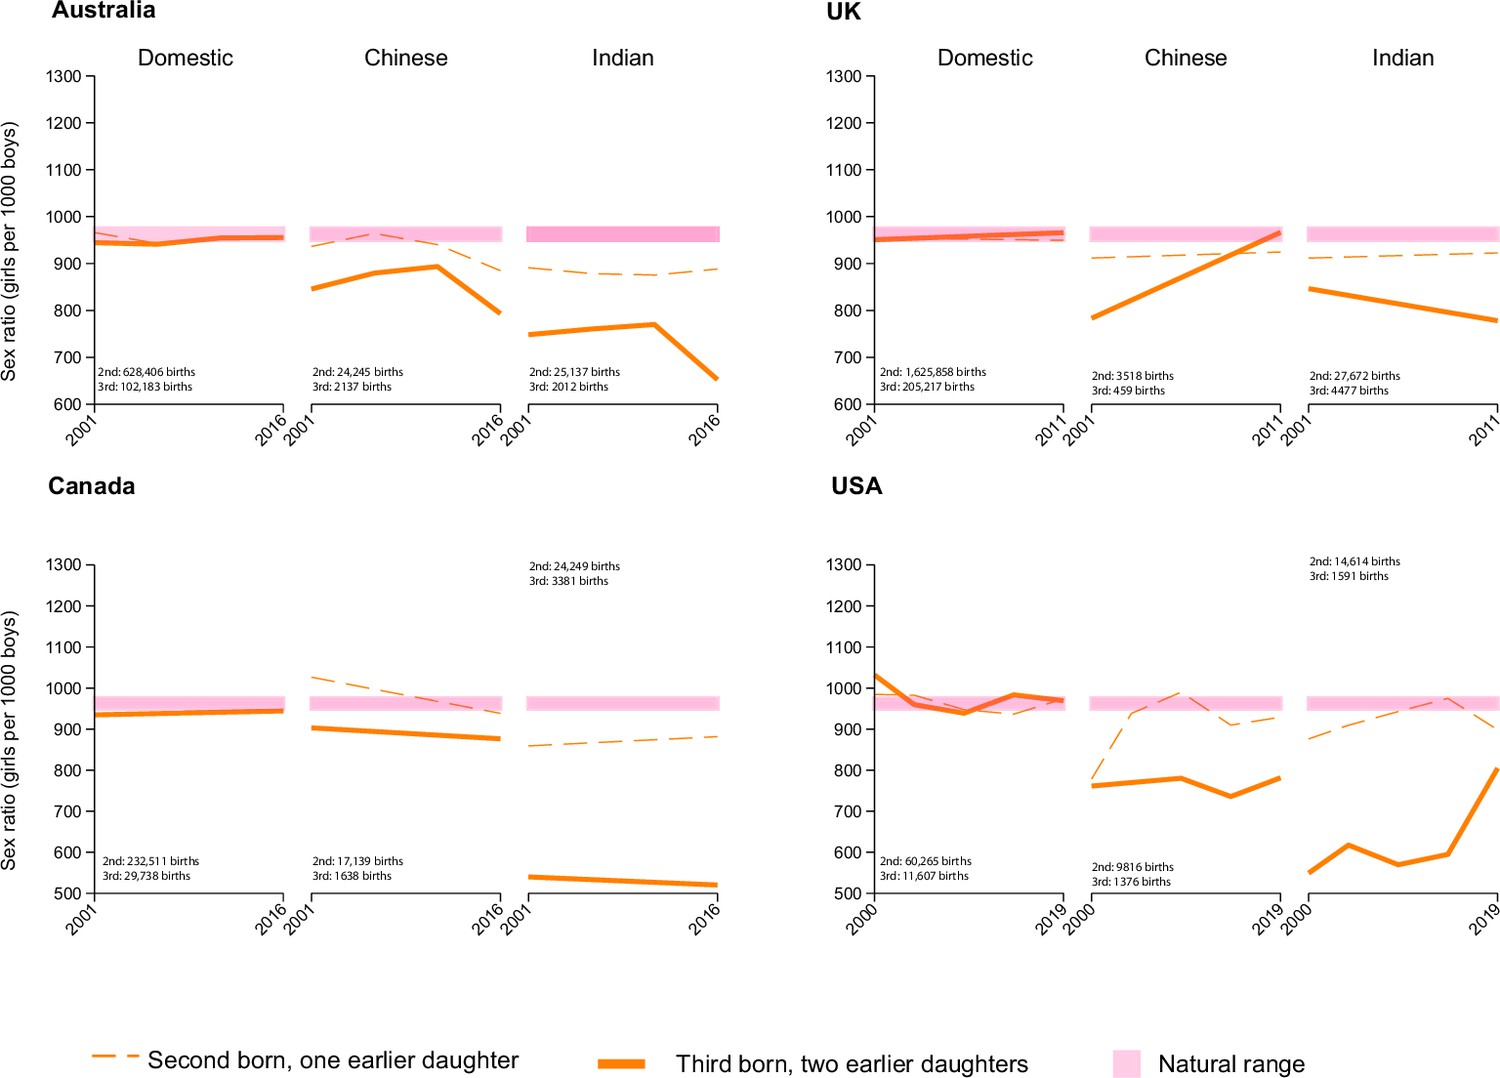
Conditional sex ratio (CSR) of second and third order births by mother’s ethnicity and country of residence.
CSRs shown are based on the total number of births (shown on each graph) for each birth order and its corresponding sex composition for all women of the specified background in each country.
Figure 3
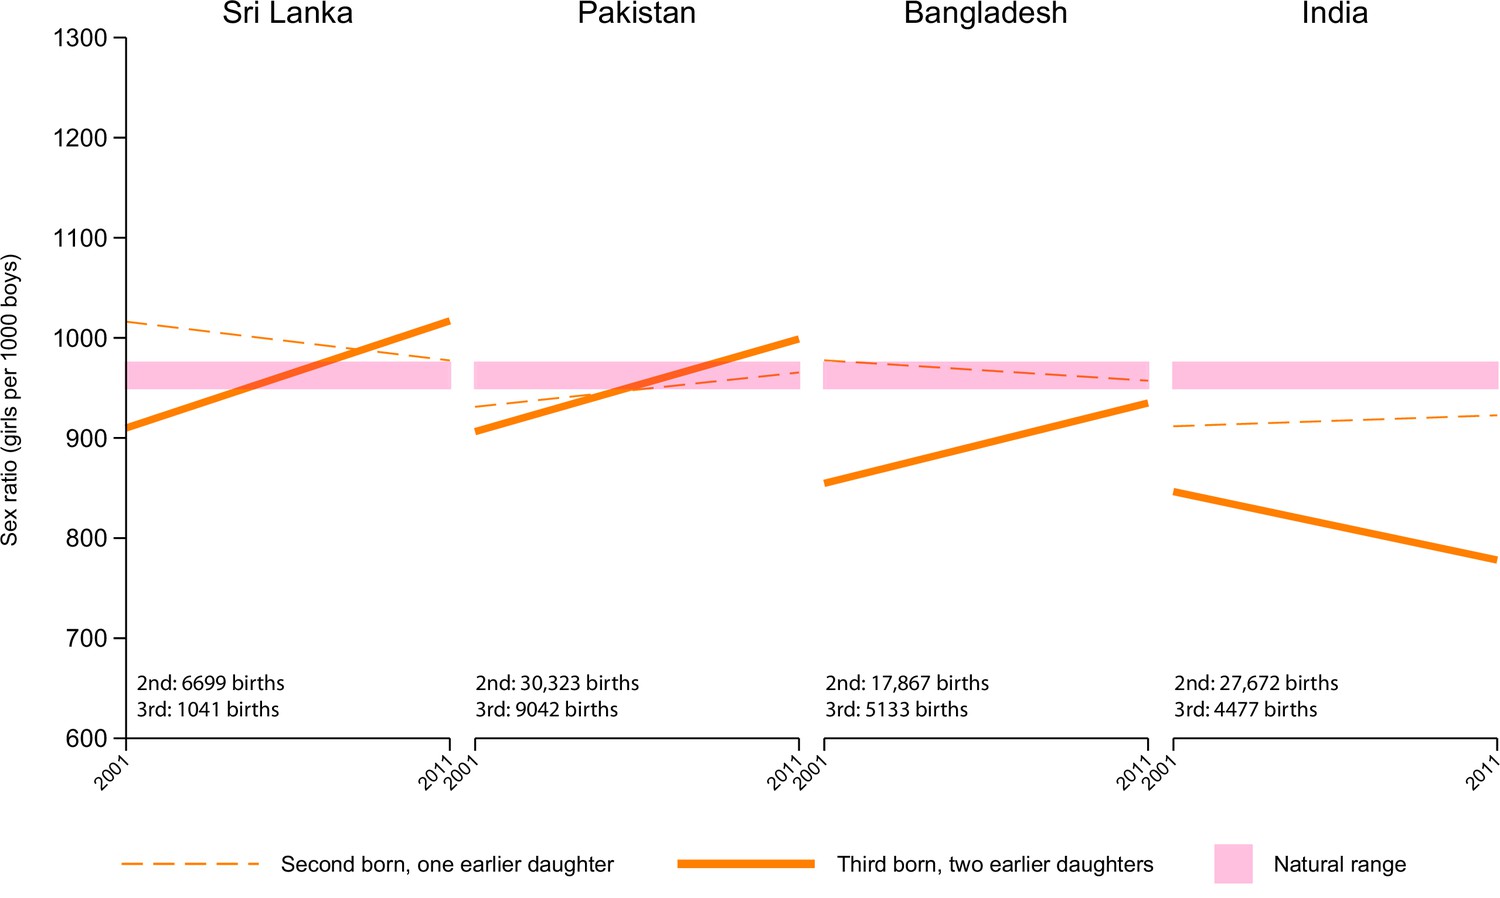
Conditional sex ratio (CSR) of second and third order births in the UK by mother’s country of birth.
CSRs shown are based on the total number of births (shown on each graph) for each birth order and its corresponding sex composition for all women of the specified background in each country.
Tables
Table 1
Number of births by country and birth order.
| Country (year) | Source | Year | First born | Second born, one earlier son | Second born, one earlier daughter | Third born, two earlier sons | Third born, two earlier daughters | Third born, one earlier son and daughter | All births, children 14 and below | Total Births among Indians diaspora | Total Births among Chinese diaspora |
|---|---|---|---|---|---|---|---|---|---|---|---|
| Births in diaspora settings | |||||||||||
| Australia | Census | 2001 | 530,793 | 176,934 | 168,100 | 32,223 | 28,342 | 47,651 | 1,004,114 | 14,155 | 30,233 |
| Australia | Census | 2006 | 575,914 | 188,474 | 179,022 | 32,211 | 27,898 | 48,020 | 1,071,050 | 19,202 | 37,305 |
| Australia | Census | 2011 | 572,686 | 185,248 | 176,499 | 31,242 | 27,337 | 47,063 | 1,059,141 | 38,649 | 48,175 |
| Australia | Census | 2016 | 617,168 | 200,965 | 191,349 | 31,609 | 27,788 | 47,853 | 1,134,915 | 84,452 | 78,827 |
| Canada | Census | 2001 | 87,718 | 27,882 | 26,404 | 4,345 | 4,042 | NA | 162,082 | 6,639 | 5,931 |
| Canada | Census | 2016 | 958,730 | 295,240 | 279,605 | 38,185 | 35,625 | 60,345 | 1,689,395 | 154,400 | 130,730 |
| United Kingdom | Census | 2001 | 2,926,117 | 918,845 | 866,111 | 138,203 | 118,736 | 203,188 | 5,171,200 | 111,176 | 7,505 |
| United Kingdom | Census | 2011 | 3,256,113 | 944,567 | 892,899 | 133,190 | 116,264 | 204,393 | 5,547,426 | 156,836 | 24,200 |
| United States | Census 5% | 2000 | 35,391 | 13,338 | 12,811 | 2,181 | 2,384 | 3,542 | 72,082 | 9,422 | 9,246 |
| United States | ACS | 2004 | 20,377 | 7,828 | 7,378 | 1,286 | 1,276 | 2,042 | 41,344 | 4,178 | 4,120 |
| United States | ACS | 2009 | 66,217 | 25,696 | 24,235 | 4,260 | 4,106 | 6,615 | 135,263 | 16,887 | 14,588 |
| United States | ACS | 2014 | 78,804 | 31,029 | 29,203 | 5,386 | 5,070 | 8,470 | 164,040 | 20,969 | 17,629 |
| United States | ACS | 2019 | 76,155 | 29,878 | 28,599 | 4,925 | 4,775 | 7,761 | 158,062 | 26,432 | 21,213 |
| Total | 9,802,183 | 3,045,924 | 2,882,215 | 459,246 | 403,643 | 686,943 | 17,410,114 | 663,397 | 429,702 | ||
| Proportion | 56% | 17% | 17% | 3% | 2% | 4% | 100% | ||||
| Births in home country | |||||||||||
| China | CHNS | 2000 | 1,687 | 402 | 468 | 59 | 110 | 105 | 2,944 | ||
| China | CHNS | 2006 | 1,325 | 195 | 301 | 16 | 36 | 29 | 1,933 | ||
| China | CHNS | 2011 | 1,561 | 206 | 344 | 8 | 34 | 22 | 2,193 | ||
| China | CHNS | 2015 | 1,364 | 265 | 373 | 7 | 48 | 22 | 2,093 | ||
| India | NFHS-2 | 1998/99 | 44,907 | 20,530 | 19,415 | 7,141 | 7,657 | 14,397 | 161,523 | ||
| India | NFHS-3 | 2005/06 | 48,299 | 21,761 | 21,459 | 6,781 | 8,080 | 14,398 | 166,861 | ||
| India | NFHS-4 | 2015/16 | 250,233 | 106,712 | 104,693 | 24,004 | 35,111 | 53,058 | 693,227 | ||
| Total | 349,376 | 150,071 | 147,053 | 38,016 | 51,076 | 82,031 | 1,030,774 | ||||
| Proportion | 34% | 15% | 14% | 4% | 5% | 8% | 100% | ||||
| All study births | |||||||||||
| Total | 10,151,559 | 3,195,995 | 3,029,268 | 497,262 | 454,719 | 768,974 | 18,440,888 | 663,397 | 429,702 | ||
| Proportion | 55% | 17% | 16% | 3% | 2% | 4% | 100% | ||||
Table 2
Conditional sex ratio: second and third order births with one or two earlier daughters among Indian and Chinese women in the diaspora.
| Mother’s ethnicity/ancestry | Indian | Chinese | ||||||
|---|---|---|---|---|---|---|---|---|
| Country (Year) | Birth order and sex of previous child | Male | Female | Sex Ratio | Male | Female | Sex Ratio | |
| Mother’s country of birth | India | China | ||||||
| Australia | ||||||||
| Second born, one earlier daughter | 1267 | 1129 | 891 | 2017 | 1889 | 937 | ||
| 2001 | Third born, two earlier daughters | 155 | 116 | 748 | 214 | 181 | 846 | |
| Second born, one earlier daughter | 1592 | 1399 | 879 | 2428 | 2341 | 964 | ||
| 2006 | Third born, two earlier daughters | 167 | 127 | 760 | 241 | 212 | 880 | |
| Second born, one earlier daughter | 3061 | 2680 | 876 | 2904 | 2731 | 940 | ||
| 2011 | Third born, two earlier daughters | 261 | 201 | 770 | 282 | 252 | 894 | |
| Second born, one earlier daughter | 7419 | 6590 | 888 | 5271 | 4664 | 885 | ||
| 2016 | Third born, two earlier daughters | 596 | 389 | 653 | 421 | 334 | 793 | |
| Mother’s country of birth | India | China | ||||||
| Canada | ||||||||
| Second born, one earlier daughter | 618 | 531 | 859 | 451 | 463 | 1027 | ||
| 2001 | Third born, two earlier daughters | 137 | 74 | 540 | 62 | 56 | 903 | |
| Second born, one earlier daughter | 12275 | 10825 | 882 | 8370 | 7855 | 938 | ||
| 2016 | Third born, two earlier daughters | 2085 | 1085 | 520 | 810 | 710 | 877 | |
| Mother’s country of birth | India | China | ||||||
| UK | ||||||||
| Second born, one earlier daughter | 6049 | 5515 | 912 | 465 | 424 | 912 | ||
| 2001 | Third born, two earlier daughters | 1192 | 1009 | 846 | 60 | 47 | 783 | |
| Second born, one earlier daughter | 8378 | 7730 | 923 | 1366 | 1263 | 925 | ||
| 2011 | Third born, two earlier daughters | 1280 | 996 | 778 | 179 | 173 | 966 | |
| Mother’s country of birth | India | China | ||||||
| US | ||||||||
| Second born, one earlier daughter | 930 | 815 | 876 | 710 | 553 | 779 | ||
| 2000 | Third born, two earlier daughters | 182 | 100 | 549 | 109 | 83 | 761 | |
| Second born, one earlier daughter | 398 | 362 | 910 | 292 | 274 | 938 | ||
| 2004 | Third born, two earlier daughters | 68 | 42 | 618 | 42 | 42 | ||
| Second born, one earlier daughter | 1613 | 1521 | 943 | 1105 | 1094 | 990 | ||
| 2009 | Third born, two earlier daughters | 244 | 139 | 570 | 173 | 135 | 780 | |
| Second born, one earlier daughter | 1997 | 1947 | 975 | 1374 | 1250 | 910 | ||
| 2014 | Third born, two earlier daughters | 274 | 163 | 595 | 212 | 156 | 736 | |
| Second born, one earlier daughter | 2650 | 2381 | 898 | 1640 | 1524 | 929 | ||
| 2019 | Third born, two earlier daughters | 210 | 169 | 805 | 238 | 186 | 782 | |
-
Example of CSR computation for Australia 2001 among Indian mother, parity 2: total births = 2396. Pf = 1129/2396=0.47, CSR = (0.47/(1–0.47)*1000=891). For parity 3: total = 271 pf = 116/271=0.43, CSR = (0.43/(1–0.43)*1000=748). Due to rounding of Pf value, CSR values may differ slightly.
Additional files
-
Supplementary file 1
Births and conditional sex ratios.
(A) Births and conditional sex ratios (CSRs) from Australia Census 2001, 2006, 2011, 2016. (B) Births and CSRs from Canada Census 2001, 2016. (C) Births and CSRs from UK Census 2001, 2011. (D )Births and CSRs from US Census and American Community Survey (ACS). (E) Births and CSRs for domestic population.
- https://cdn.elifesciences.org/articles/79853/elife-79853-supp1-v1.xlsx
-
MDAR checklist
- https://cdn.elifesciences.org/articles/79853/elife-79853-mdarchecklist1-v1.docx
Download links
A two-part list of links to download the article, or parts of the article, in various formats.
Downloads (link to download the article as PDF)
Open citations (links to open the citations from this article in various online reference manager services)
Cite this article (links to download the citations from this article in formats compatible with various reference manager tools)
Trends in female-selective abortion among Asian diasporas in the United States, United Kingdom, Canada and Australia
eLife 11:e79853.
https://doi.org/10.7554/eLife.79853


