Specific binding of Hsp27 and phosphorylated Tau mitigates abnormal Tau aggregation-induced pathology
- Interdisciplinary Research Center on Biology and Chemistry, Shanghai Institute of Organic Chemistry, Chinese Academy of Sciences, China
- Department of Molecular and Cellular Pharmacology, University of Miami Miller School of Medicine, United States
- Bio-X Institutes, Key Laboratory for the Genetics of Developmental and Neuropsychiatric Disorders (Ministry of Education), Shanghai Jiao Tong University, China
- University of the Chinese Academy of Sciences, China
- Graduate Program in Human Genetics and Genomics, University of Miami Miller School of Medicine, United States
- Graduate Program in Molecular and Cellular Pharmacology, University of Miami Miller School of Medicine, United States
- Department of Neurology and Institute of Neurology, Ruijin Hospital, Shanghai Jiao Tong University School of Medicine, China
- Zhangjiang Institute for Advanced Study, Shanghai Jiao Tong University, China
Figures
Figure 1
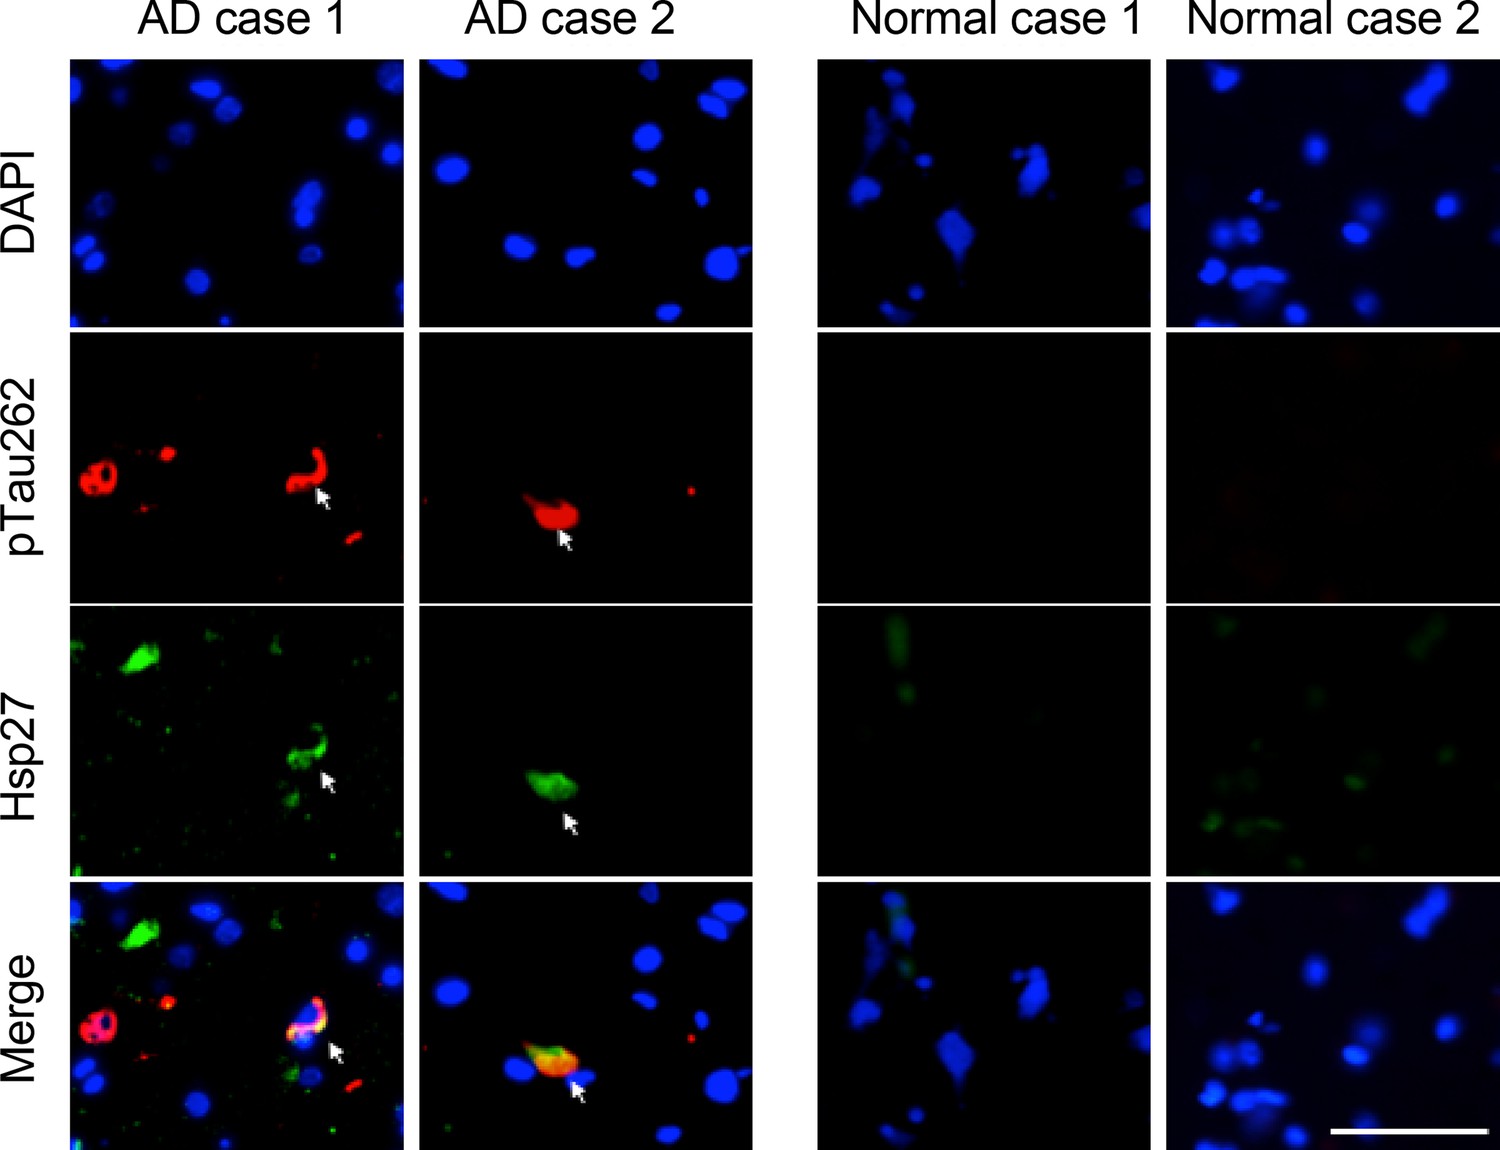
Hsp27 partially co-localizes with pTau aggregates in the brains of AD patients.
Representative images of immunofluorescence staining using anti-hyper-phosphorylated Tau at Ser262 and anti-Hsp27 antibodies on the brain slices from two AD and two age-matched normal cases. Green, Hsp27; red, pTauS262; blue, DAPI; Scale bar, 50 μm.
Figure 2
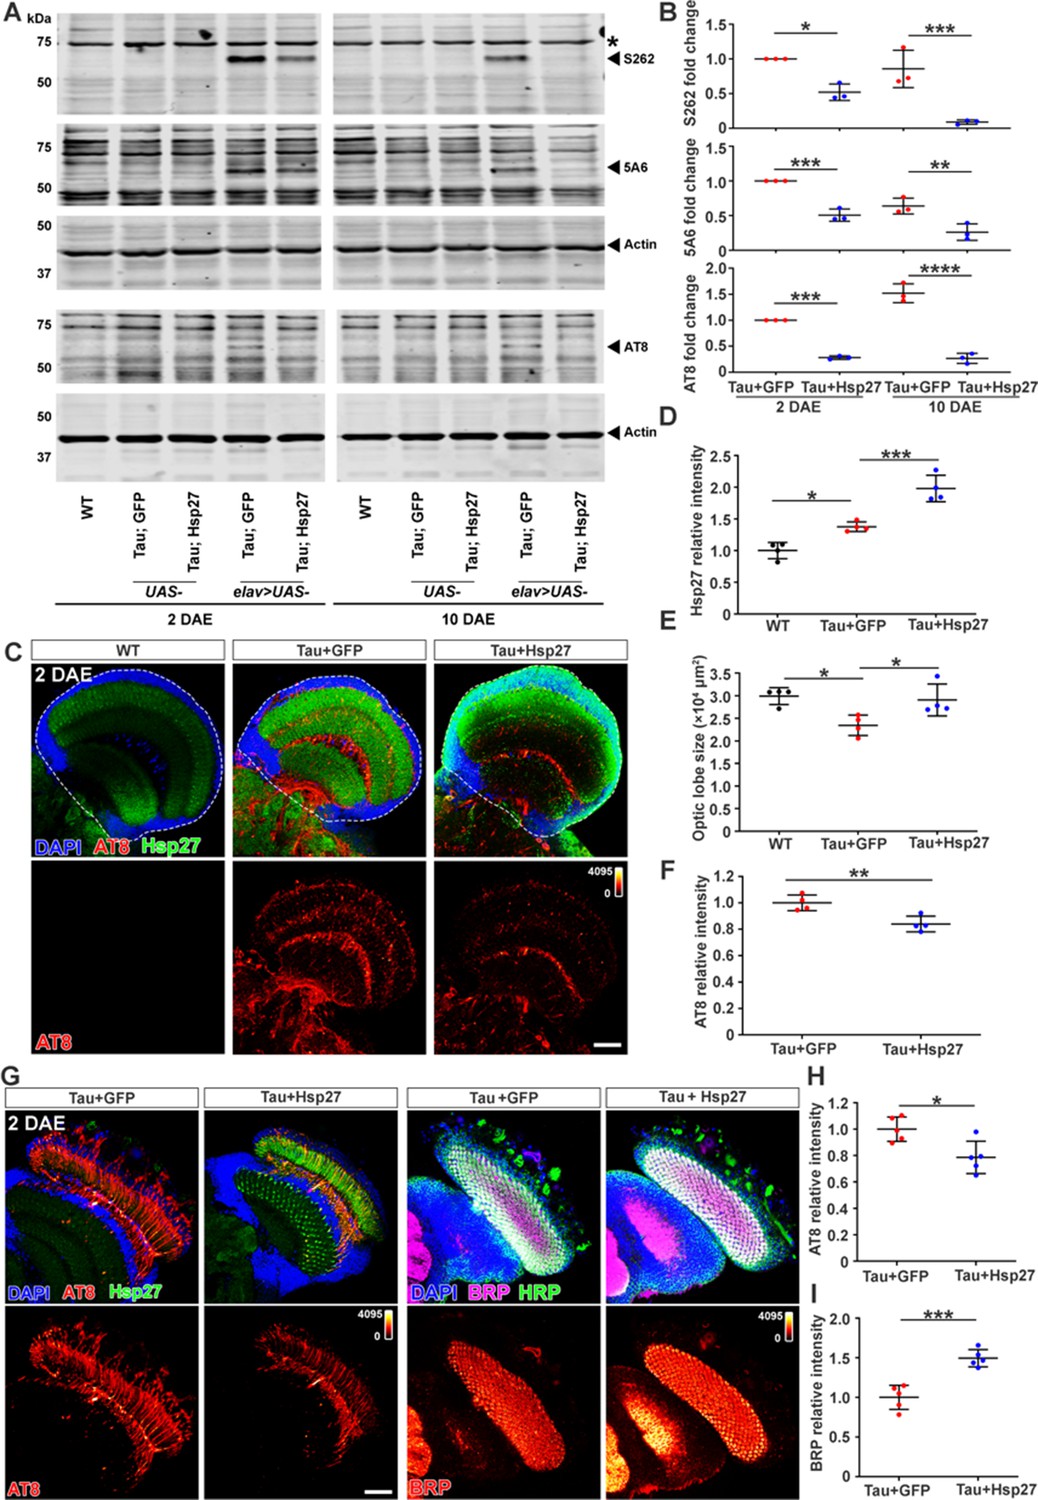
Hsp27 reduces pTau level and protects against pTau-induced synaptopathy in Drosophila.
(A) Brain lysates of 2 and 10 days after eclosion (DAE) wild-type (WT) flies (lanes 1 and 6), flies expressing human Tau with GFP (lanes 4 and 9), or human Tau with Hsp27 (lanes 5 and 10) in the nervous system were probed with antibodies for disease-associated phospho-tau epitopes S262, Ser202/Thr205 (AT8), and total Tau (5A6). Actin was probed as a loading control. Brain lysates of flies carrying only UAS elements were loaded for control (lanes 2, 3, 7, and 8). (B) Quantification of protein fold changes in (A). The levels of Tau species were normalized to actin. Fold changes were normalized to the Tau +GFP group at 2 DAE. n=3. (C) Brains of WT flies or flies expressing Tau +GFP or Tau +Hsp27 in the nervous system at 2 DAE were probed for AT8 (heatmap) and Hsp27 (green), and stained with DAPI (blue). Scale bar, 30 μm. (D–F) Quantification of the Hsp27 intensity (D, data normalized to WT), brain optic lobe size (E), and AT8 intensity (F, data normalized to the Tau +GFP group). n=4. (G) Brain of flies expressing Tau +GFP or Tau +Hsp27 in photoreceptors were probed for AT8, Hsp27, bruchpilot (BRP), and horseradish peroxidase (HRP). Scale bar, 30 μm. (H, I) Quantification of AT8 intensity (H) and BRP intensity (I). Data were normalized to the Tau +GFP group. n=5. Statistical analyses were performed using one-way ANOVA with Bonferroni’s post hoc test (B, D, E) or independent samples t-test (F, H, I). All data are presented as mean ± SD. *p<0.05, **p<0.01, ***p<0.001, ****p<0.0001.
-
Figure 2—source data 1
The full blots for Figure 2A.
- https://cdn.elifesciences.org/articles/79898/elife-79898-fig2-data1-v1.doc
-
Figure 2—source data 2
Quantification of protein fold changes.
(Figure 2B).
- https://cdn.elifesciences.org/articles/79898/elife-79898-fig2-data2-v1.xlsx
Figure 3 with 1 supplement
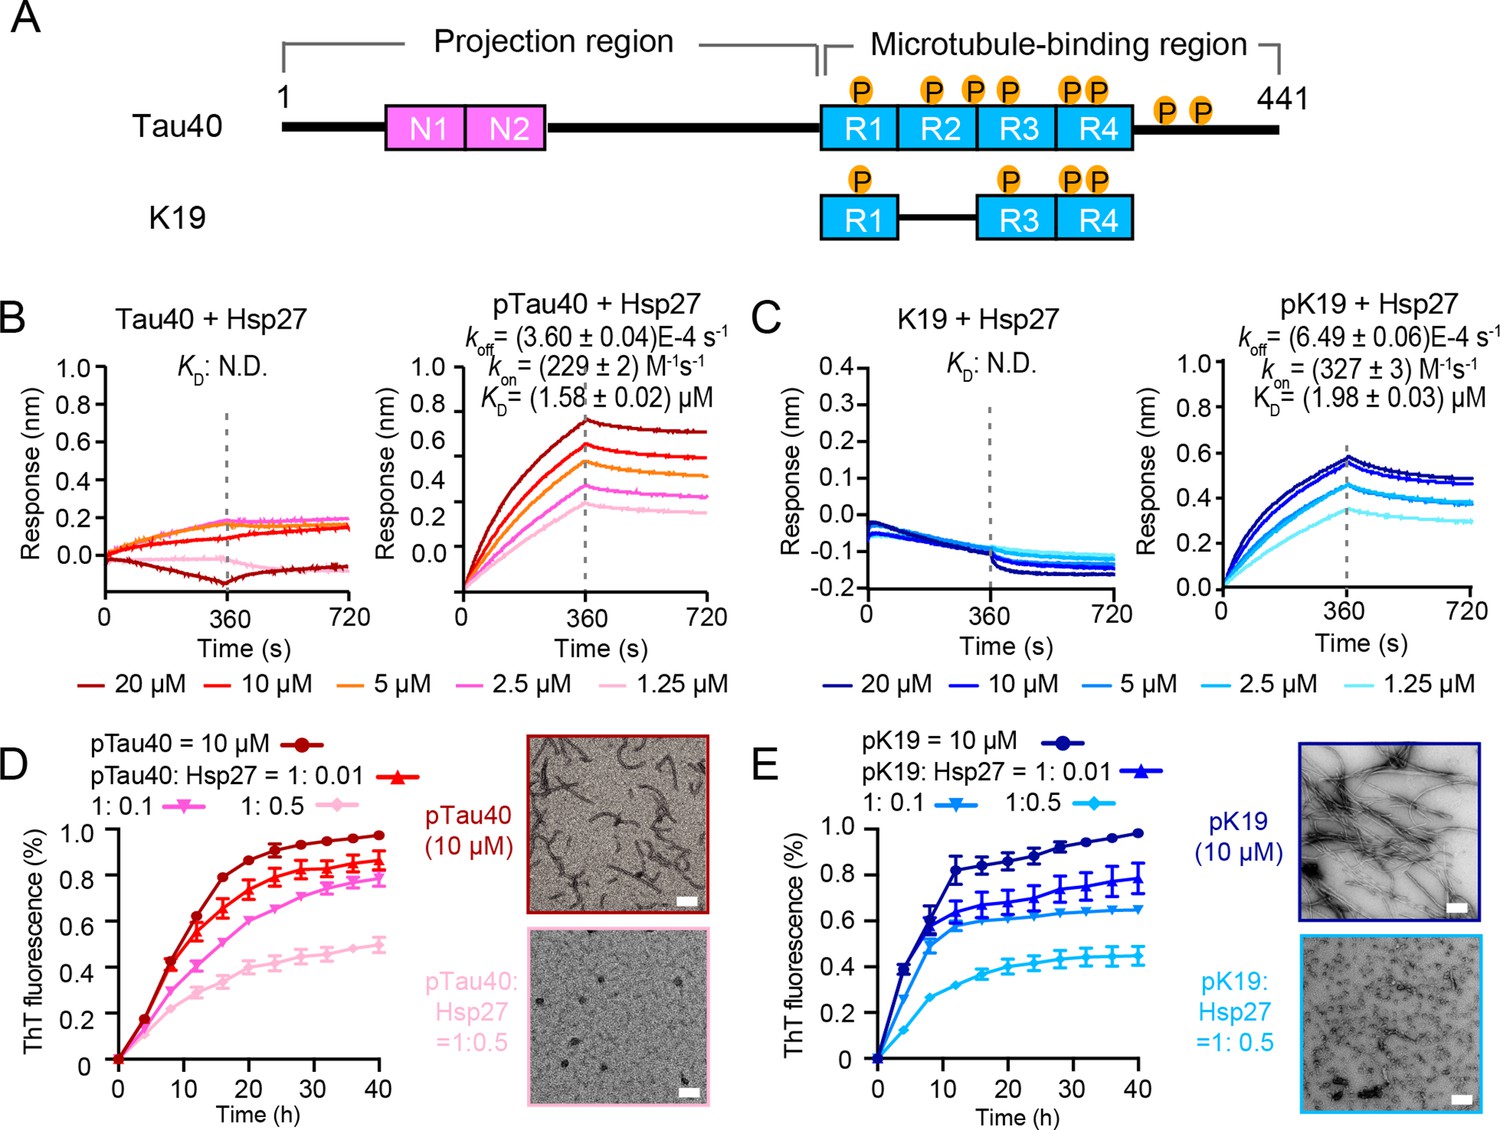
Hsp27 specifically binds MARK2-phosphorylated Tau and prevents its amyloid aggregation.
(A) Domain schematic of the longest isoform of Tau (Tau40) and a truncated construct K19. Different isoforms of Tau are characterized by 0, 1, or 2 N-terminal insertions (N1 and N2), and three (R1–R3–R4) or four (R1-4) microtubule-binding repeats. The MARK2-phosphorylated sites are indicated. (B) Binding affinity of Tau40/pTau40 with Hsp27 determined by BLI. The association and dissociation profiles of Tau40/pTau40 to Hsp27 were divided by a vertical dash line. Tau40/pTau40 was fixed to the sensor, and the 5 concentrations of Hsp27 used are indicated. N.D., not detectable. The determined equilibrium constant (KD), and the association (kon) and dissociation (koff) rates are labelled. (C) Binding affinity of K19/pK19 with Hsp27 determined by BLI. The determined equilibrium constant (KD), and the association (kon) and dissociation (koff) rates are labelled. (D&E) Inhibition of Hsp27 on the amyloid aggregation of 10 μM pTau40 (D)/pK19 (E) revealed by ThT fluorescence kinetic assay (left) and TEM microscopy (right). A gradient concentration of Hsp27 was applied as indicated. The ThT data showed correspond to mean ± SEM, with n=3 technical replicates. The top and bottom panel on the right are the TEM images of 10 μM pTau40 (D)/pK19 (E), and 10 μM pTau40 (D)/pK19 (E) with Hsp27 at a molar ratio of 1:0.5 taken at the end point of the ThT kinetic assay on the left, respectively. Scale bar in TEM images, 50 nm.
-
Figure 3—source data 1
The association and dissociation response of Tau40/pTau40 and K19/pK19 with Hsp27 (Figure 3B and C).
- https://cdn.elifesciences.org/articles/79898/elife-79898-fig3-data1-v1.xlsx
Figure 3—figure supplement 1
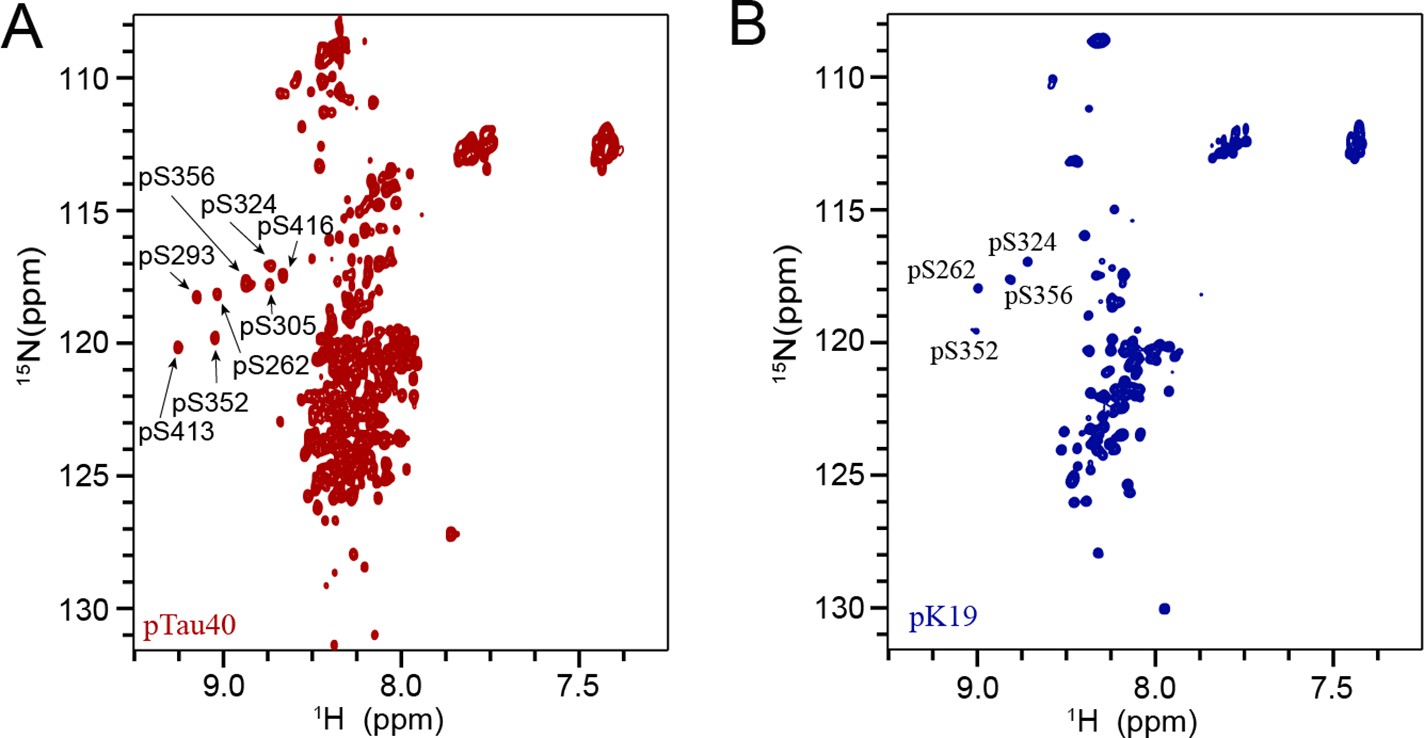
2D 1 H-15N HSQC spectra of pTau40 (A) and pK19 (B) collected at 298 K on a Bruker Avance 900 MHz spectrometer.
100 μM pTau40 and pK19 were in the NMR buffer of 50 mM Na2HPO4, 50 mM NaCl and 10% (v/v) D2O at pH 7.0. The eight and four phosphorylated residues are labeled in the spectra of pTau40 and pK19, respectively.
Figure 4 with 1 supplement
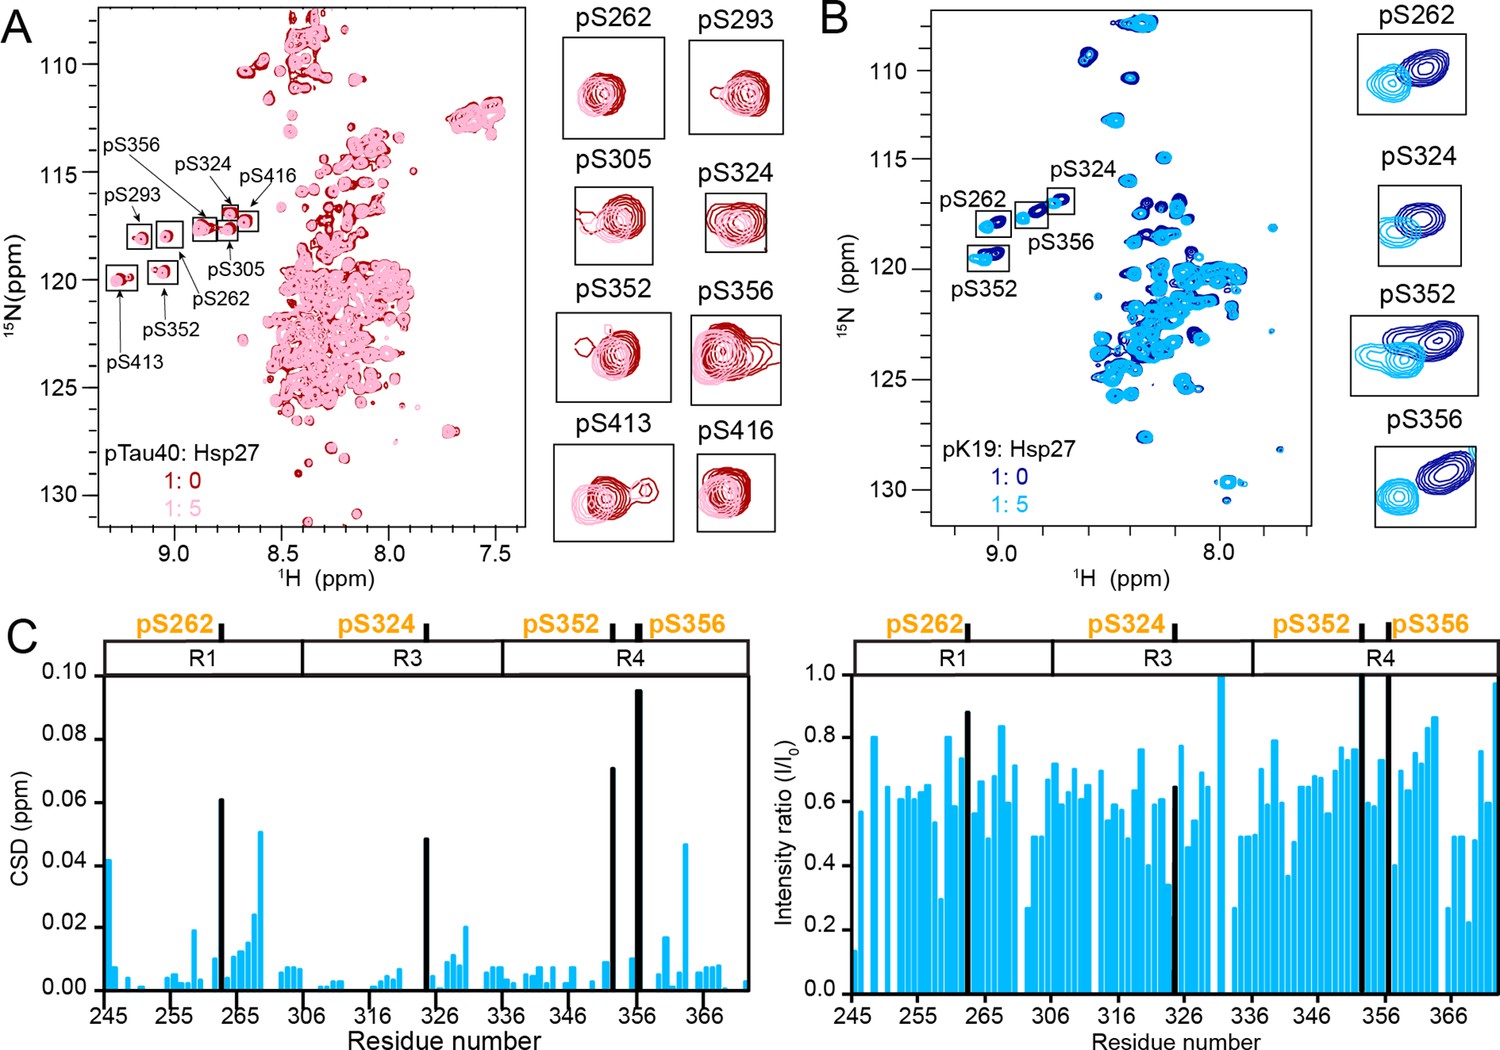
The phosphorylation sites of pTau strongly interact with Hsp27.
(A&B) Overlay of the 2D 1H-15N HSQC spectra of 50 μM pTau40 (A) and 50 μM pK19 (B) in the absence and presence of 250 μM Hsp27. Signals of pSer residues are enlarged and labeled on the right. (C) Residue-specific CSDs (left) and intensity changes (right) of pK19 titrated by Hsp27 from (B). The domain organization of pK19 is indicated on top and the data of pSer residues are labeled.
-
Figure 4—source data 1
Residue-specific chemical shift changes and intensity changes of pK19 titrated by Hsp27.
(Figure 4C).
- https://cdn.elifesciences.org/articles/79898/elife-79898-fig4-data1-v1.xlsx
Figure 4—figure supplement 1
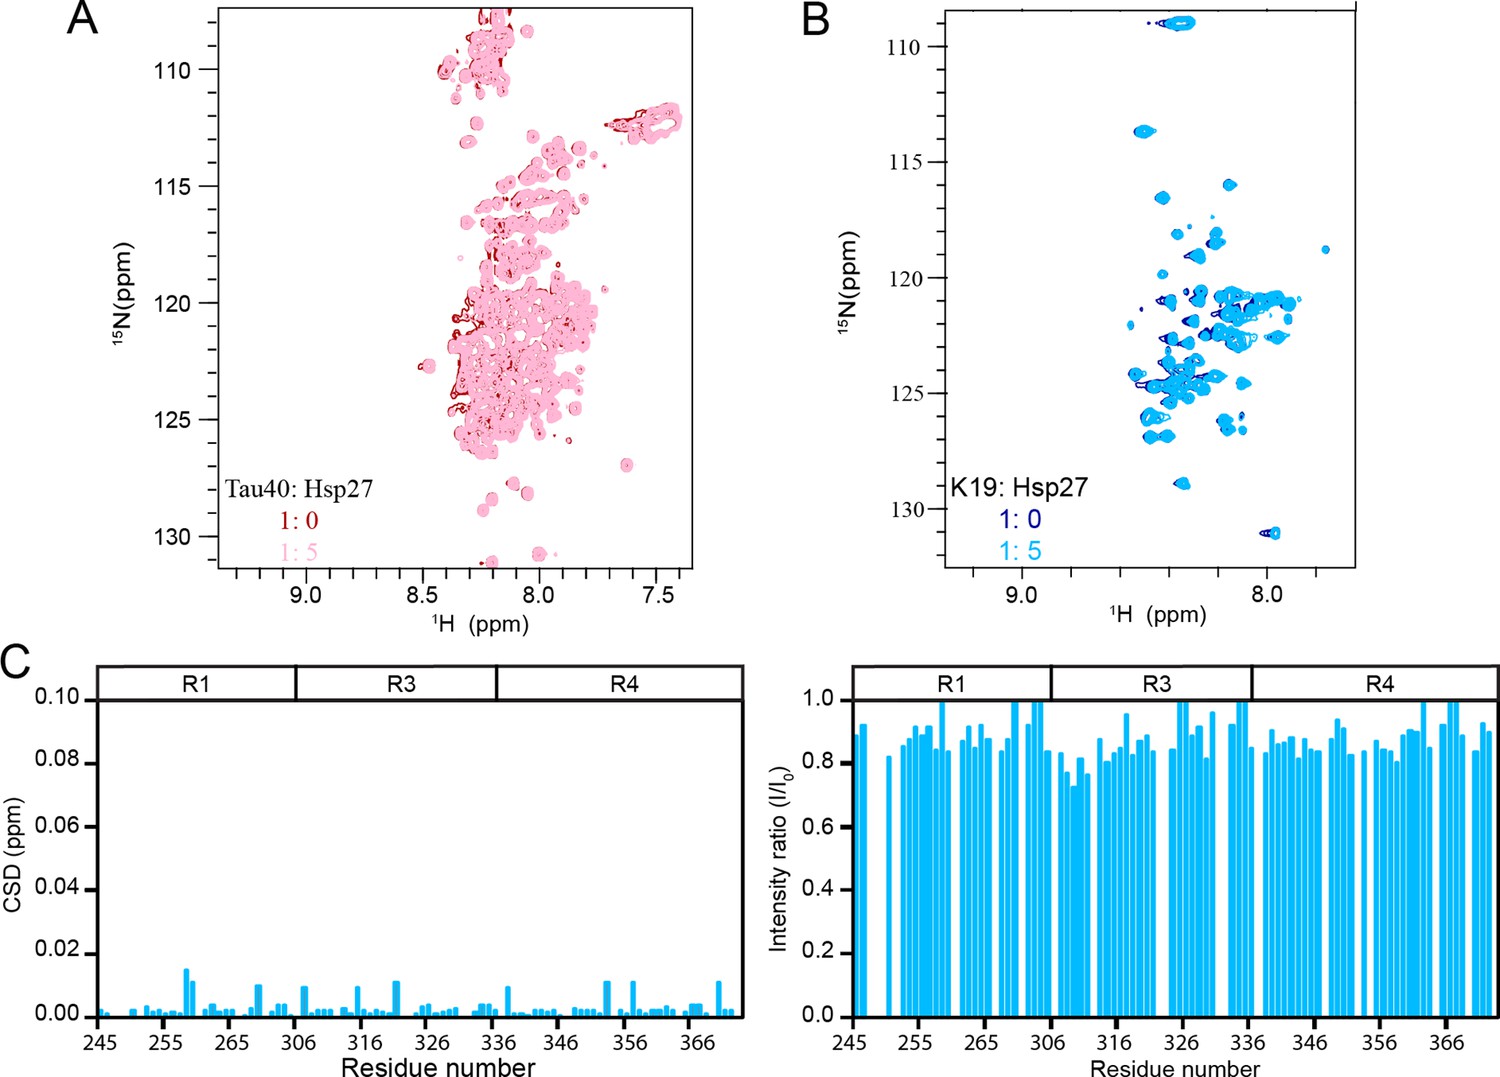
Hsp27 interacts very weakly with unphosphorylated Tau.
(A&B) Overlay of the 2D 1H-15N HSQC spectra of 50 μM Tau40 (A) and 50 μM K19 (B) in the absence and presence of 250 μM Hsp27. (C) Residue-specific chemical shift changes (left) and intensity changes (right) of k19 titrated by Hsp27 from (B). The domain organization of K19 is indicated on top.
-
Figure 4—figure supplement 1—source data 1
Residue-specific chemical shift changes and intensity changes of K19 titrated by Hsp27.
- https://cdn.elifesciences.org/articles/79898/elife-79898-fig4-figsupp1-data1-v1.xlsx
Figure 5 with 1 supplement
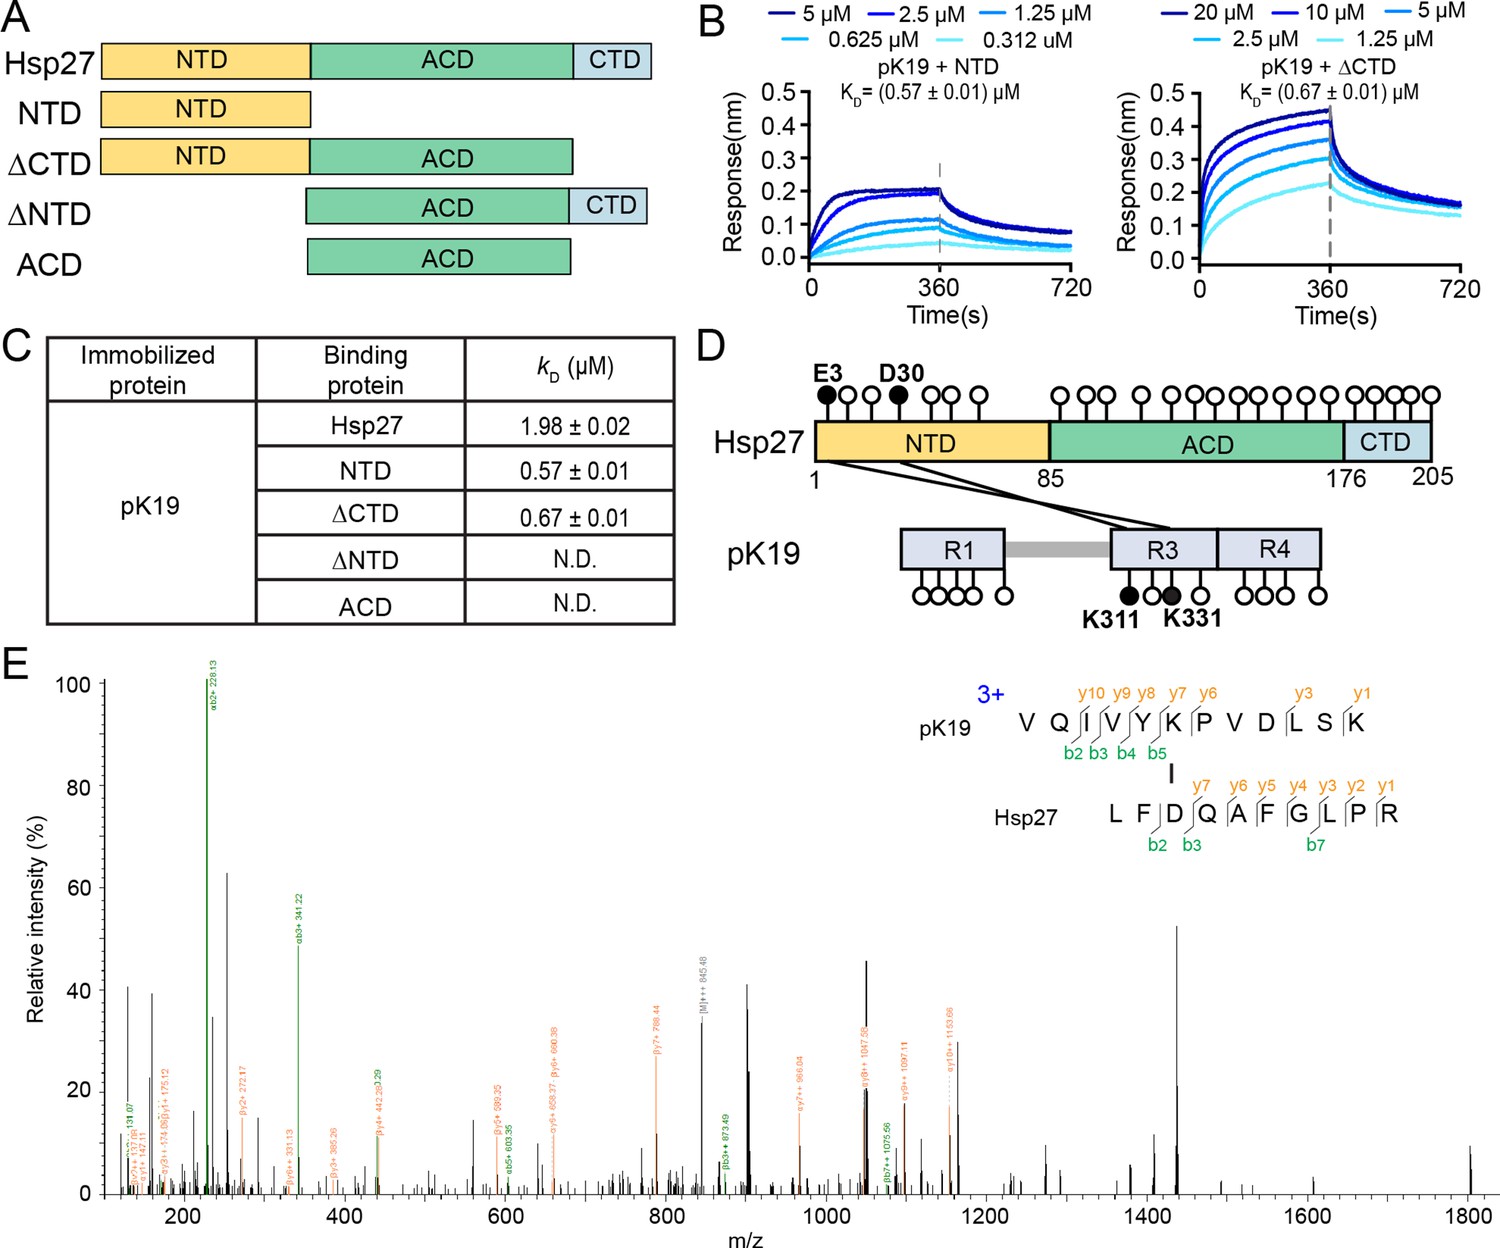
N-terminal domain of Hsp27 is essential in binding with pK19.
(A) Domain organization of Hsp27 and the four truncations. (B) Binding affinity of pK19 with NTD and ΔCTD of Hsp27 determined by BLI. The association and dissociation profiles were divided by a vertical dash line. pK19 was fixed to the sensor, and the 5 concentrations of Hsp27 truncations used are indicated. (C) Summary of the binding affinity of pK19 with Hsp27 wild type and truncations. (D) Schematic profile of the cross-linked results of Hsp27 to pK19 using cross-linkers EDC and NHS. All GLU (E) and ASP (D) residues in Hsp27, and all LYS (K) residues in pK19 are indicated by circles, respectively. The two identified cross-linked segments are indicated by two black lines and the corresponding residues are highlighted in black circles and labeled. (E) A representative MS/MS spectrum of trypsin proteinase-generated peptide. The m/z of fragment ions were matched to their theoretical values generated by in silico fragmentation.
-
Figure 5—source data 1
The association and dissociation response of pK19 with NTD and ΔCTD of Hsp27.
(Figure 5B).
- https://cdn.elifesciences.org/articles/79898/elife-79898-fig5-data1-v1.xlsx
Figure 5—figure supplement 1
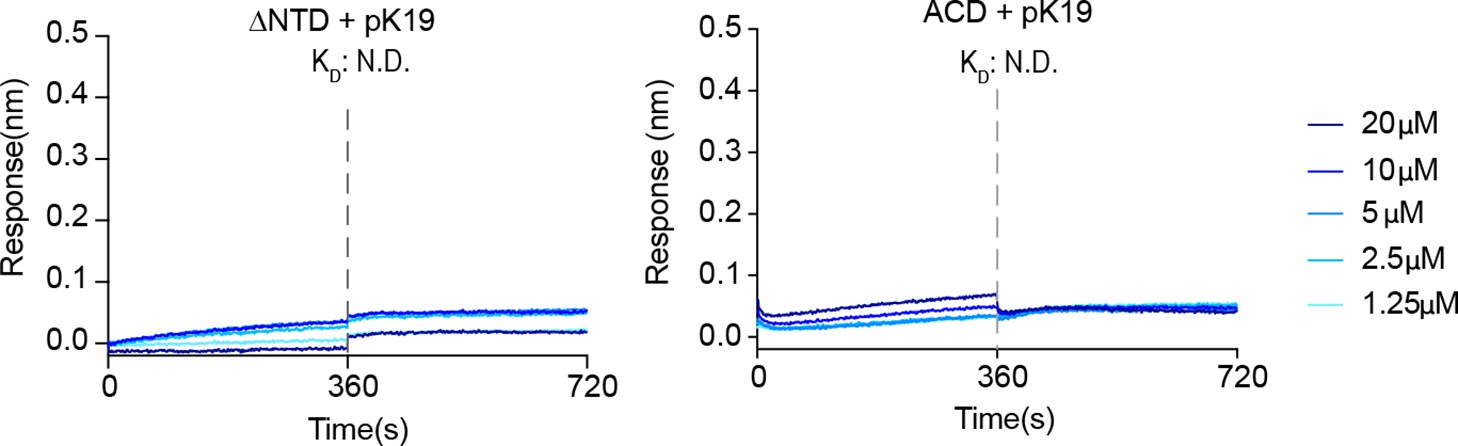
Binding affinity of pK19 with ΔNTD and ACD of Hsp27 determined by BLI.
The association and dissociation profiles were divided by a vertical dash line. pK19 was fixed to the sensor, and the 5 concentrations of Hsp27 truncations used are indicated. N.D., not detectable.
-
Figure 5—figure supplement 1—source data 1
The association and dissociation response of pK19 with ΔNTD and ACD of Hsp27.
- https://cdn.elifesciences.org/articles/79898/elife-79898-fig5-figsupp1-data1-v1.xlsx
Figure 6
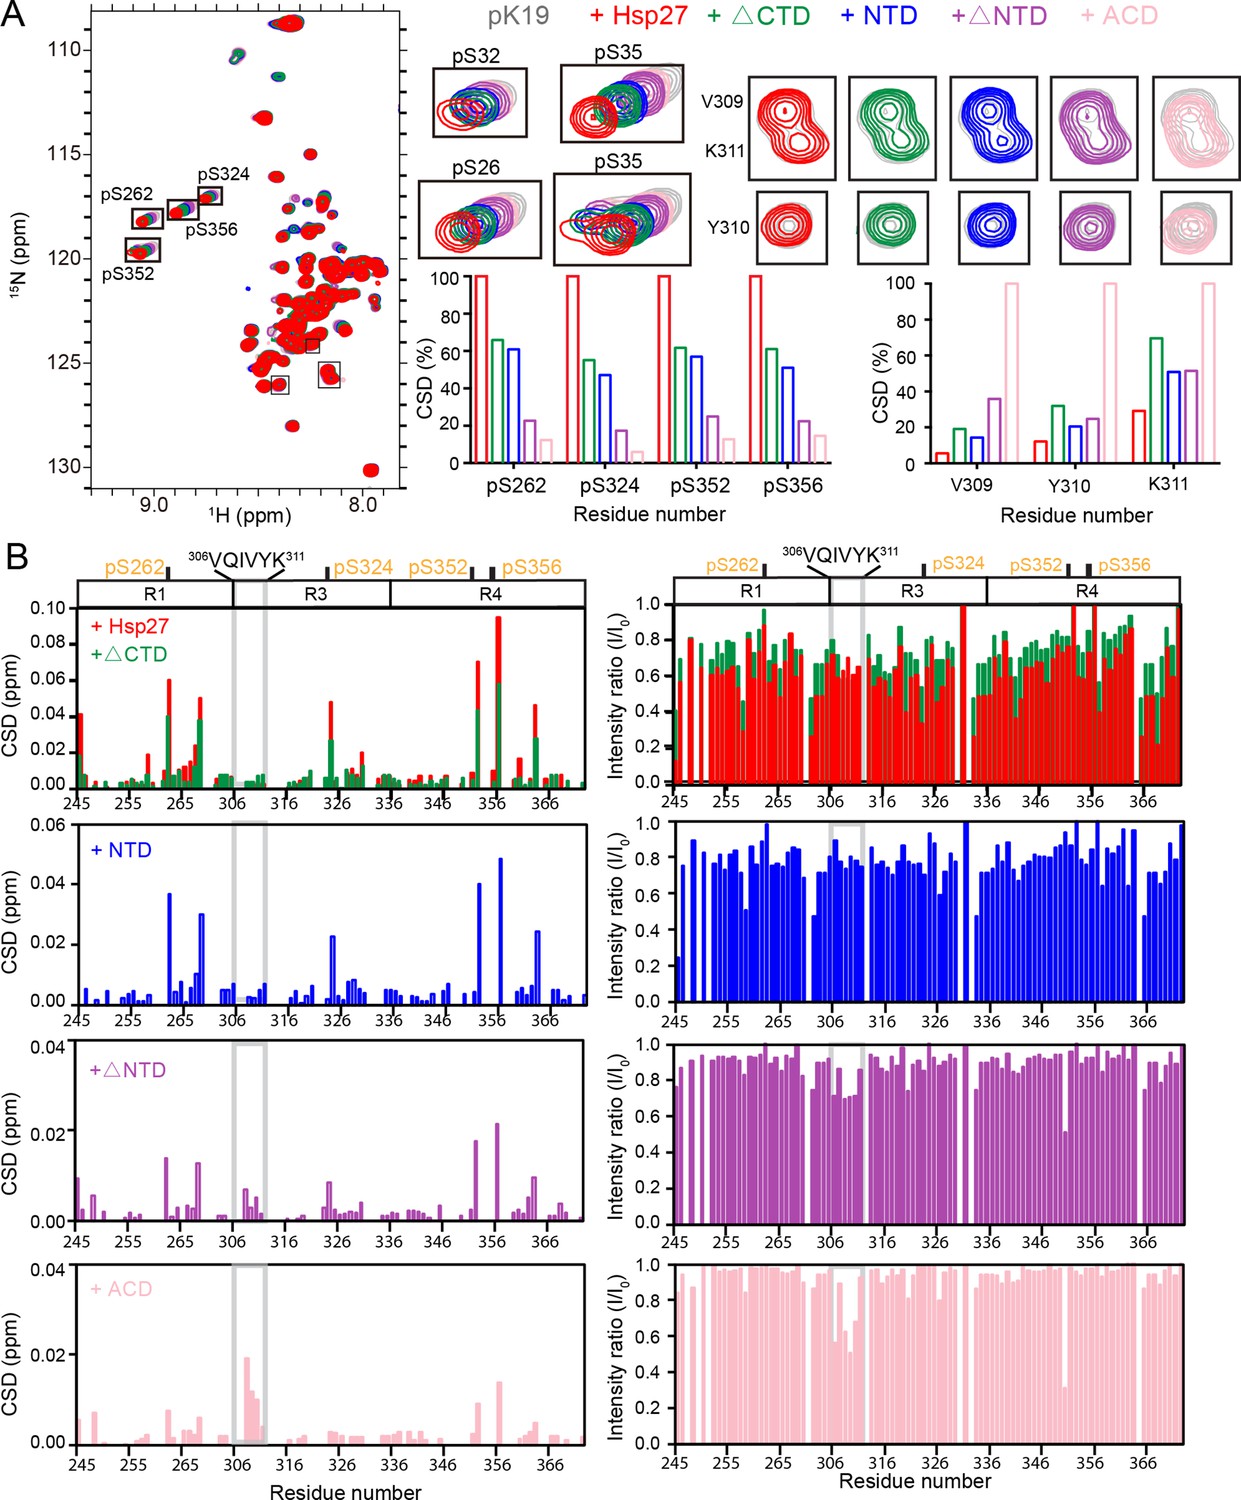
Interaction between pK19 and different domains of Hsp27.
(A) Overlay of the 2D 1H-15N HSQC spectra of 50 μM pK19 in the absence and presence of 100 μM Hsp27 variants as indicated. Signals of the four pSer residues and residues V309, Y310, and K311 are labeled and enlarged on the right. Relative CSDs of the four pSer residues and residues V309, Y310, and K311 of pK19 titrated by Hsp27 variants are shown on the right. (B) Residue-specific CSDs (left) and intensity changes (right) of pK19 titrated by Hsp27 variants from (A). Domain organization of pK19 is indicated on top and the pSer residues are indicated. The amyloidogenic 306VQIVYK311 region of pK19 was labeled and highlighted by light gray lines.
-
Figure 6—source data 1
Residue-specific chemical shift changes and intensity changes of pK19 titrated by Hsp27 variants.
(Figure 6B).
- https://cdn.elifesciences.org/articles/79898/elife-79898-fig6-data1-v1.xlsx
Figure 7
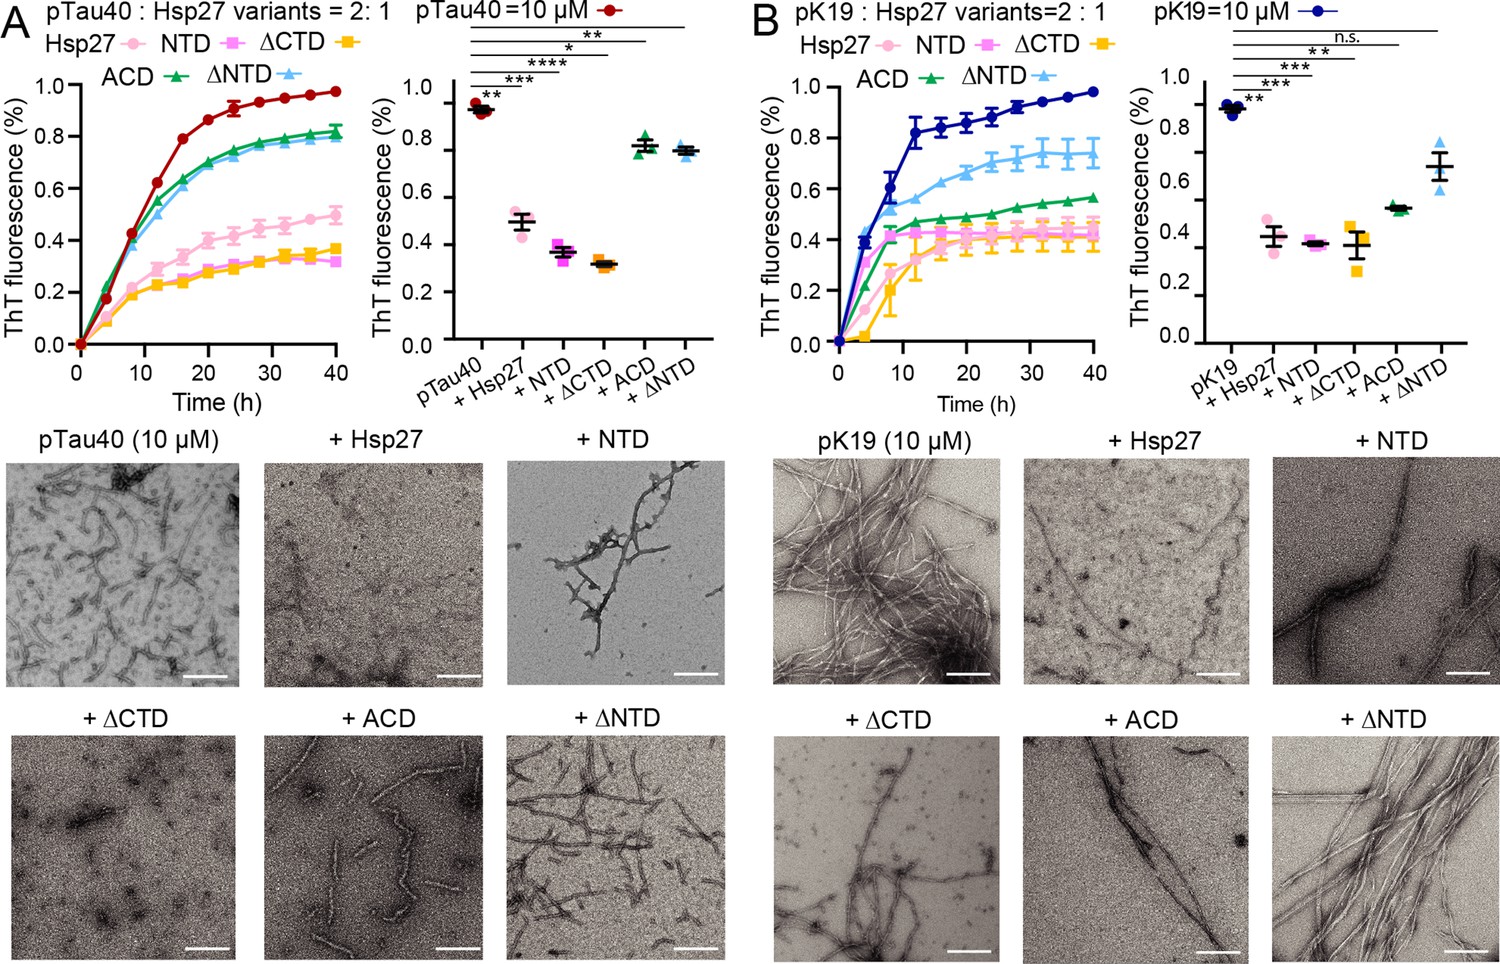
Different domains of Hsp27 play distinctive roles in preventing pTau amyloid aggregation.
(A&B) Inhibition of Hsp27 variants on the amyloid aggregation of 10 μM pTau40 (A)/pK19 (B) revealed by ThT fluorescence kinetic assay (top) and TEM microscopy (bottom). The ThT data showed correspond to mean ± s.d., with n=3 technical replicates. Comparison of the inhibitory effect of Hsp27 variants on pTau aggregation at 40 hr time point is shown on the right. p Values based on two-sided Student’s t-test. *p<0.05, **p<0.01, ***p<0.001, ****p<0.0001, n.s., not significant. Scale bar in TEM images, 200 nm.
-
Figure 7—source data 1
ThT fluorescence profiles of pTau40 (Figure 7A) and pK19 (Figure 7B) in the absence or presence of Hsp27 variants at the indicated concentrations.
- https://cdn.elifesciences.org/articles/79898/elife-79898-fig7-data1-v1.xlsx
Author response image 1
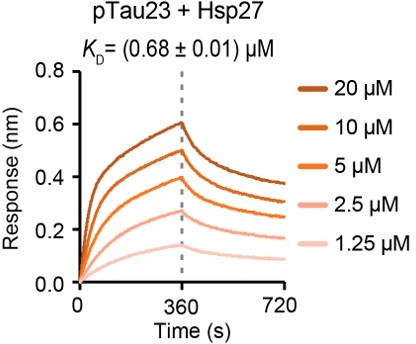
Binding affinity of pTau23 with Hsp27 determined by BLI.
The association and dissociation profiles of pTau23 to Hsp27 were divided by a vertical dash line. pTau23 was fixed to the sensor, and the 5 concentrations of Hsp27 used are indicated.
Tables
Table 1
Summary of the AD patients and age-matched healthy controls.
| Cases | Gender | Age | Brain region | Thal Phase (0–3, Aβ plaques) | Braak stage (0–6, Tau) | CERAD (0–3, neuritic plaque) |
|---|---|---|---|---|---|---|
| AD case 1 | F | 76 | Frontal cortex | 3 | 3 | 3 |
| AD case 2 | F | 74 | Frontal cortex | 3 | 3 | 3 |
| Normal case 1 | M | 77 | Frontal cortex | 0 | 0 | 0 |
| Normal case 2 | F | 75 | Frontal cortex | 0 | 0 | 0 |
Table 2
Cross-linked peptides between pK19 and Hsp27.
The cross-linked residues are bold and underlined in the sequences.
| Peptide sequence(Hsp27-pK19) | Score 1 | Score 2 | Score 3 | |
|---|---|---|---|---|
| 1 | LFDQAFGLPR -VQIVYKPVDLSK | 2.56246E-11 | 3.17803E-09 | 1.21049E-06 |
| 2 | GSEFENLYFQGMTER-CGSLGNIHHKPGGGQVEVK | 5.05514E-09 | 1.37169E-06 | 9.56423E-07 |
Additional files
Download links
A two-part list of links to download the article, or parts of the article, in various formats.
Downloads (link to download the article as PDF)
Open citations (links to open the citations from this article in various online reference manager services)
Cite this article (links to download the citations from this article in formats compatible with various reference manager tools)
Specific binding of Hsp27 and phosphorylated Tau mitigates abnormal Tau aggregation-induced pathology
eLife 11:e79898.
https://doi.org/10.7554/eLife.79898


