Dynamic allostery in substrate binding by human thymidylate synthase
- Department of Biochemistry and Biophysics, School of Medicine, University of North Carolina, United States
- Division of Chemical Biology and Medicinal Chemistry, Eshelman School of Pharmacy, University of North Carolina, United States
Figures
Figure 1 with 1 supplement

Apo hTS undergoes a slow, concerted motion which is likely exchange between active and inactive conformations.
(a) 13C CEST profile of L198 in apo hTS at 25 Hz spin lock power (Figure 1—source data 2) with curve from the global fit. The CEST experiment is essentially only sensitive to the slower, concerted process. (b) Structure of apo hTS (active conformation, PDB ID 5X5A) showing the 10 probes involved in the slow, concerted motion. Many of these probes, including L101, L121, L131, L187, L192, and L198 are within or adjacent to the regions highlighted in (c) which show large changes between the active and inactive conformations. (c) Overlay of active (PDB ID 5X5A) and inactive (PDB ID 1YPV, residues 108–129 modelled in) structures of hTS. Substrates dUMP and mTHF are included in sticks. Red and blue colors highlight the areas that are most different between the two conformations, including the active site loop (residues 181–196) which undergoes a 180° flip (box on right) and the ‘extended loop’ (residues 100–135, most of which lack electron density in the inactive structure).
-
Figure 1—source data 1
Apo hTS ILV 13C CEST 40 Hz spin lock.
- https://cdn.elifesciences.org/articles/79915/elife-79915-fig1-data1-v1.zip
-
Figure 1—source data 2
Apo hTS ILV 13C CEST 25 Hz spin lock.
- https://cdn.elifesciences.org/articles/79915/elife-79915-fig1-data2-v1.zip
Figure 1—figure supplement 1
CPMG and CEST profiles from concerted process probes.
Profiles and overlaid fit curves (kinetic model given next to residue name) are shown for CPMG (left, all 3 datasets) and CEST (right, 25 Hz spin lock only) for several probes involved in the slow, concerted process.
Figure 2
Apo and dUMP-bound hTS undergo faster motion with heterogeneous rates and populations.
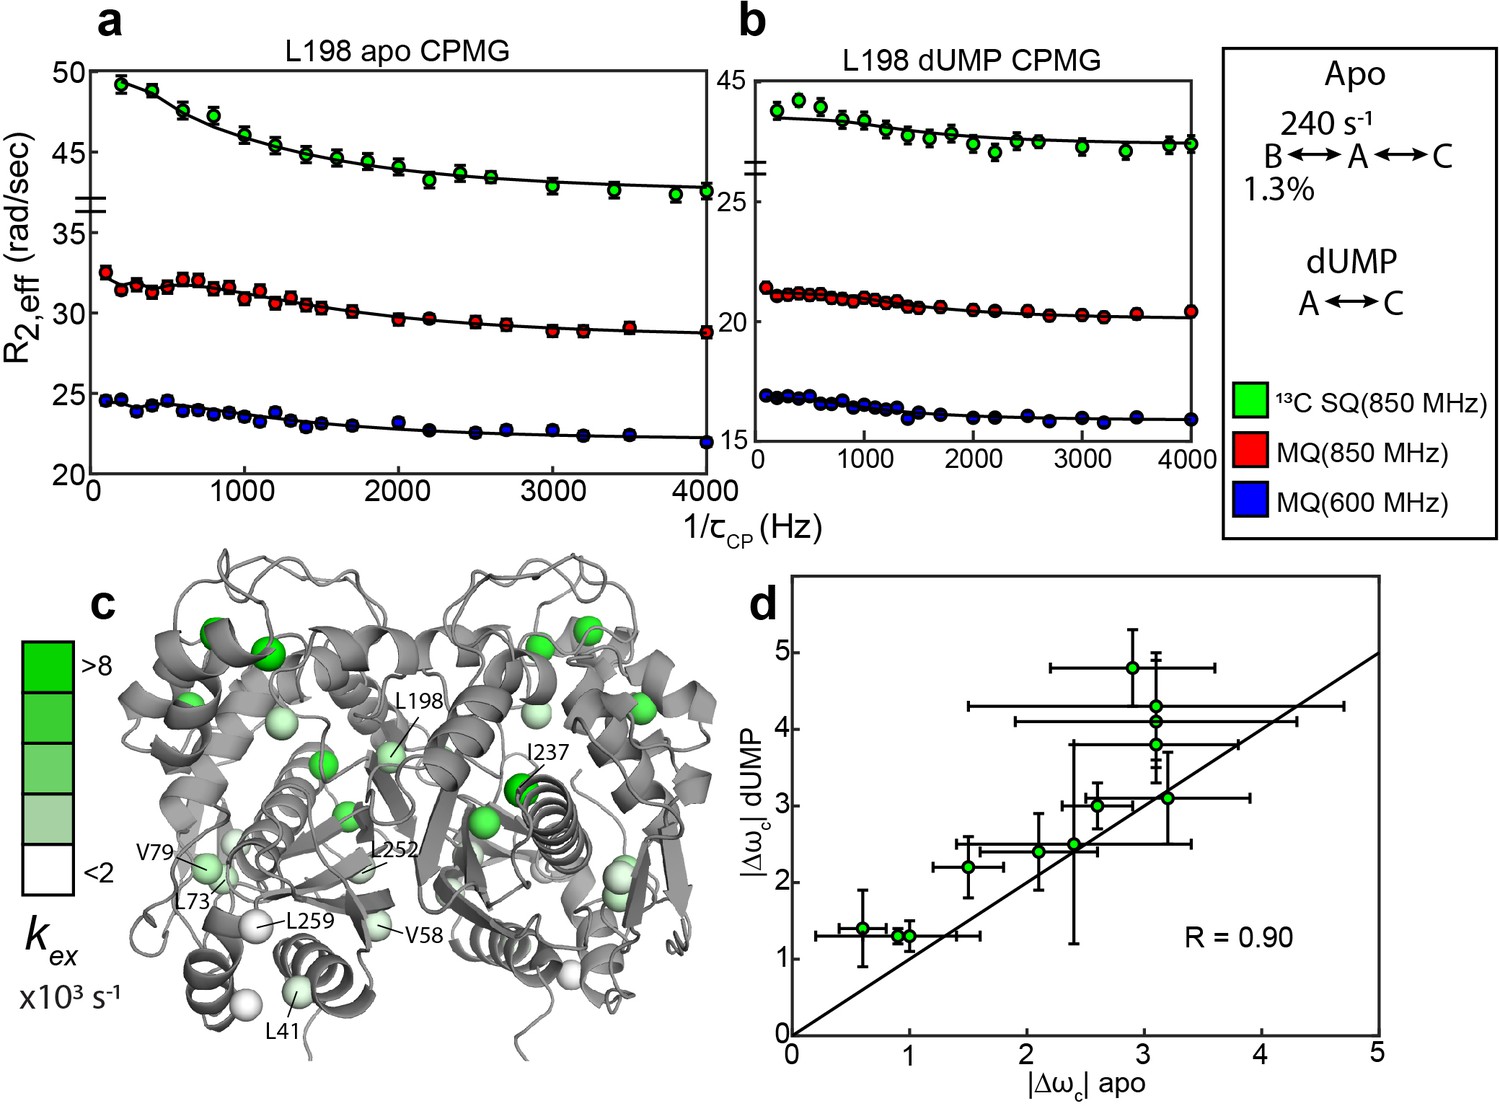
(a) CPMG profiles in the global fit, including 13C SQ at 850 MHz (green), MQ at 850 MHz (red), and MQ at 600 MHz (blue), for L198 in apo hTS using a bifurcated 3-state model (Figure 2—source data 1–4). This fit also includes CEST datasets at two spin lock powers (Figure 1—source data 1 and 2). Error bars are based on duplicate point RMSD (see Materials & Methods). (b) Global fit of three CPMG datasets for L198 in dUMP-bound hTS to a 2-state model (Figure 2—source data 5–8). The color scheme is the same as in (a). (c) Probes with reasonably well-defined exchange rates are displayed on the apo active structure of hTS (PDB ID 5X5A) with the color gradient indicating the value (for 3-state probes, the exchange rate of the faster process is used). (d) 13C |Δω| values for apo (faster process) and dUMP-bound states are shown. A strong correlation between these values is observed, suggesting that the excited state being accessed is similar in both cases. Error bars are based on fits of 200 Monte Carlo simulated datasets (see Materials & Methods).
-
Figure 2—source data 1
Apo hTS LV 13C MQ CPMG 850 MHz.
- https://cdn.elifesciences.org/articles/79915/elife-79915-fig2-data1-v1.zip
-
Figure 2—source data 2
Apo hTS LV 13C MQ CPMG 600 MHz.
- https://cdn.elifesciences.org/articles/79915/elife-79915-fig2-data2-v1.zip
-
Figure 2—source data 3
Apo hTS LV 13C SQ CPMG 850 MHz.
- https://cdn.elifesciences.org/articles/79915/elife-79915-fig2-data3-v1.zip
-
Figure 2—source data 4
Apo hTS I 13C SQ CPMG 850 MHz.
- https://cdn.elifesciences.org/articles/79915/elife-79915-fig2-data4-v1.zip
-
Figure 2—source data 5
hTS-dUMP LV 13C MQ CPMG 850 MHz.
- https://cdn.elifesciences.org/articles/79915/elife-79915-fig2-data5-v1.zip
-
Figure 2—source data 6
hTS-dUMP LV 13C MQ CPMG 600 MHz.
- https://cdn.elifesciences.org/articles/79915/elife-79915-fig2-data6-v1.zip
-
Figure 2—source data 7
hTS-dUMP LV 13C SQ CPMG 850 MHz.
- https://cdn.elifesciences.org/articles/79915/elife-79915-fig2-data7-v1.zip
-
Figure 2—source data 8
hTS-dUMP I 13C SQ CPMG 850 MHz.
- https://cdn.elifesciences.org/articles/79915/elife-79915-fig2-data8-v1.zip
Figure 3 with 1 supplement
Solvent PREs show that many buried faster-motion probes have enhanced solvent exposure.
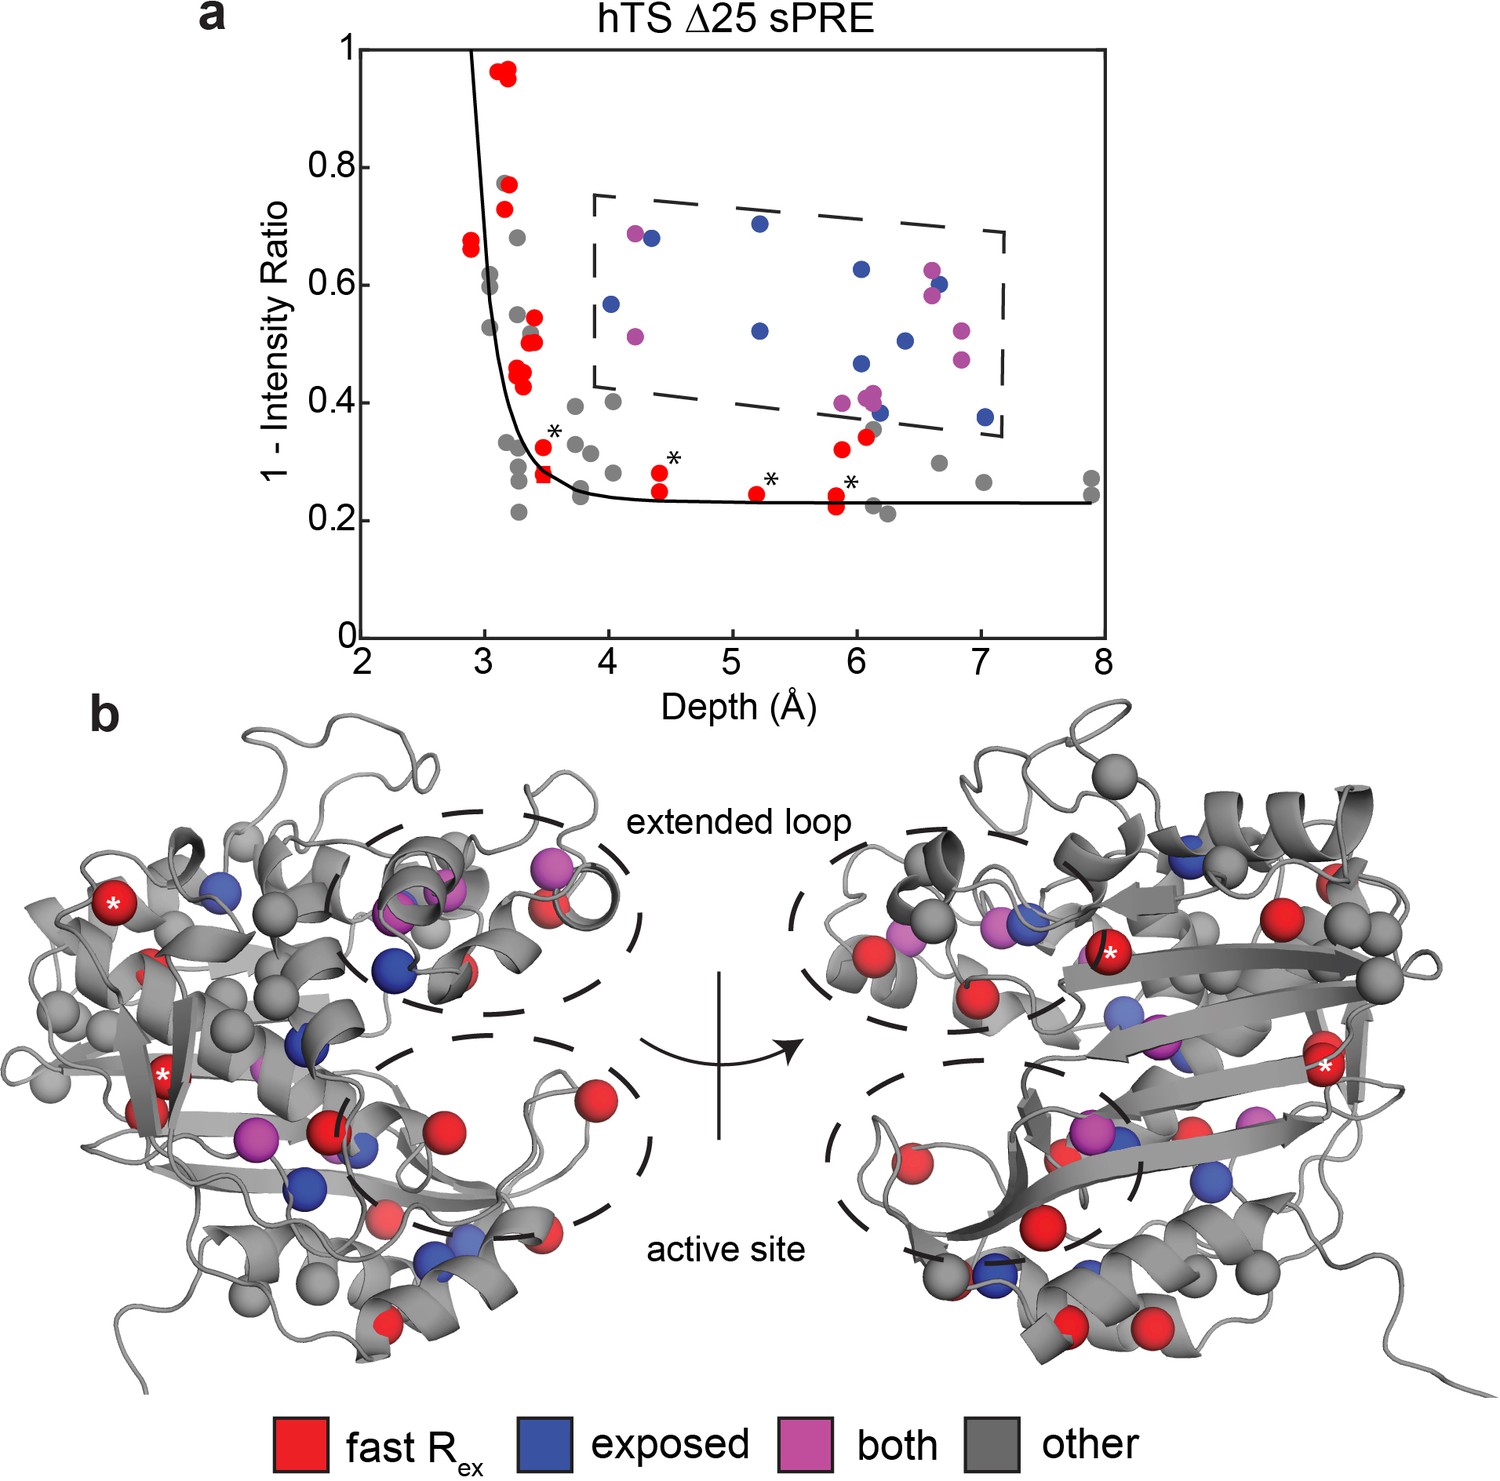
(a) Plot of 1 – [Intensity (2 mM Gd)/Intensity (0 mM Gd)] (Figure 3—source data 1) as a function of the depth of the probe in the active structure as measured in Δ25 hTS (which possesses faster motion only). Much of the data, to a reasonable approximation, follow a dependence (black curve) analogous to what is seen when the relaxation rates themselves are measured (Clore and Iwahara, 2009). However, there are also a number of probes that appear to have a 1 – Intensity Ratio value that is significantly elevated relative to their depth (dashed box, blue). Interestingly, many probes also possess the faster µs-ms motion (purple). Of the rest of the probes possessing the faster motion (red), only four have low 1-Intensity Ratio values (*). (b) All the probes from (a) are displayed on the active structure, following the same color scheme. Notably, the blue probes (enhanced solvent exposure, but no dispersion seen in our CPMG) tend to be near red/purple probes, suggesting that they may also be involved in the faster processes, or that those processes simply enable solvent to get closer to these probes. In addition, the gray probes (neither fast motion nor enhanced exposure) cluster together. Together, these results suggest that the faster motion generally involves accessing configurations in which these probes are closer to the surface of hTS, which we call ‘exposed states’.
-
Figure 3—source data 1
Apo Δ25 hTS ILV sPRE.
- https://cdn.elifesciences.org/articles/79915/elife-79915-fig3-data1-v1.zip
Figure 3—figure supplement 1
sPRE analysis using SADIC 3D atom depth index yields similar result as 1D depth.
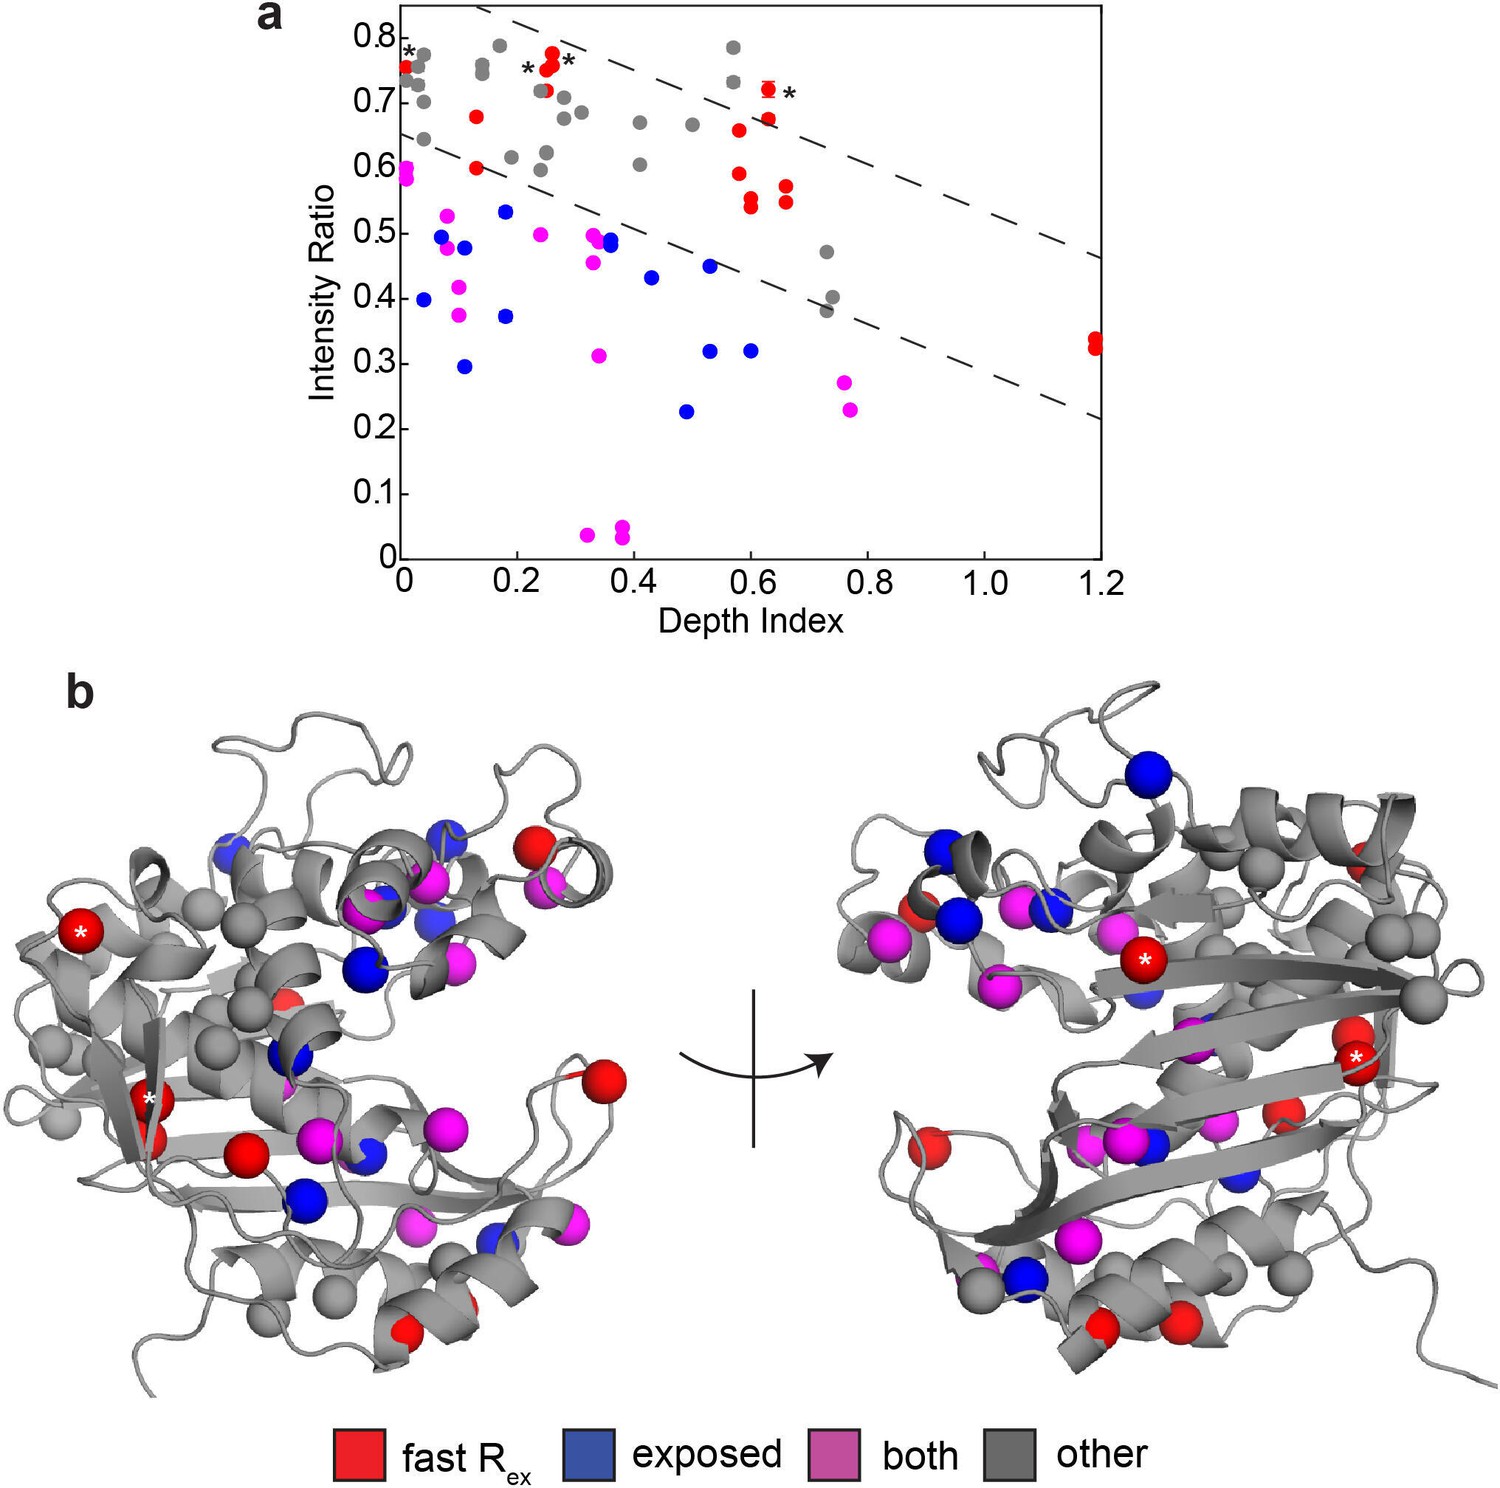
(a) Intensity (2 mM Gd)/Intensity (0 mM Gd) is plotted as a function of 3D atom depth index, where a low value of the index indicates that the residue is buried. Dashed lines (arbitrarily drawn) separate ‘normal’ intensity ratios values at a given depth index from those which are noticeably lower in intensity ratio at the same depth index. Color coding is the same as in Figure 3. Probes showing the faster motion that lacked enhanced solvent exposure based on the 1D depth analysis are again marked with asterisks here. (b) Probes are shown on the active structure of hTS using the same color scheme as in (a). As in the 1D depth analysis, we find that probes which have both the faster motion and enhanced solvent exposure (purple) are located around the substrate binding site and the extended loop. Additionally, probes which have enhanced solvent exposure but do not show the faster motion (blue) are generally close to the purple probes. Probes which have neither the faster motion nor enhanced solvent exposure generally cluster together as well. This anaylsis, like the 1D depth analysis, highlights the active site and extended loop as regions of the protein where the faster motion may involve accessing configurations in which these probes are more exposed to the solvent, which we call ‘exposed states’.
Figure 4 with 1 supplement

RDCs demonstrate that the ground state of apo hTS is the active conformation.
Plots show agreement between experimentally observed RDCs (Figure 4—source data 1–3) and RDCs calculated from a given structure using a fit alignment tensor. From left to right: Observed apo RDCs with RDCs calculated with the apo active structure (PDB ID 5X5A), observed apo RDCs with RDCs calculated with the apo inactive structure (PDB ID 1YPV), and observed dUMP-bound RDCs with RDCs calculated with the dUMP-bound structure (PDB ID 5X5D). Black lines showing are included to guide the eye. The agreement between the experimental data and the active structure is significantly better than the agreement between the data and the inactive structure; this is supported by the large difference in correlation coefficient between the two cases. In addition, the agreement between the apo RDCs and the active structure is comparable to the agreement between the dUMP-bound RDCs and the dUMP-bound structure. Error bars are based on propagation of 1.5x base plane noise in signal intensities through calculation of the coupling.
-
Figure 4—source data 1
Apo hTS 15N RDC isotropic.
- https://cdn.elifesciences.org/articles/79915/elife-79915-fig4-data1-v1.zip
-
Figure 4—source data 2
Apo hTS 15N RDC aligned.
- https://cdn.elifesciences.org/articles/79915/elife-79915-fig4-data2-v1.zip
-
Figure 4—source data 3
hTS-dUMP 15N RDC aligned.
- https://cdn.elifesciences.org/articles/79915/elife-79915-fig4-data3-v1.zip
Figure 4—figure supplement 1

1313C Δω’s for the concerted process do not agree with 13C chemical shift perturbations upon dUMP binding.
13C chemical shift perturbations (CSPs) upon dUMP binding, , and 13C Δω in the apo enzyme are shown for the 10 probes involved in the concerted process. The solid black line is drawn at to guide the eye. For these probes, as is the case for the protein as a whole, the 13C CSPs upon dUMP binding are generally small. 8 of the 10 probes involved in the concerted process have –0.1 ppm < 13C CSP <0.2 ppm, as indicated by the dashed black lines, while their 13C Δω’s are as large as 1.4 ppm. This is consistent with the idea that the apo enzyme is already in the dUMP bound-like active conformation, and that the minor state being accessed in this concerted process is the inactive conformation (structurally distinct from the dUMP bound form). The two probes with larger 13C CSPs are L192 and L221, which are the two closest residues to the dUMP binding site of the 10 shown here. Interestingly, the 13C CSP for L192 alone actually agrees very well with its 13C Δω. In addition, the 1H CSP for L192 (0.3407 ppm) agrees reasonably well with the magnitude of its 1H Δω (0.224±0.006) given its proximity to the substrate. This suggests that perhaps there is some localized change in the environment of L192 in the substrate bound form that is similar to that seen in the inactive conformation, though this is not supported by the crystal structures 5X5A (apo active) and 5X5D (dUMP bound), which show very little change in L192 and the surrounding residues between these two forms.
Figure 5
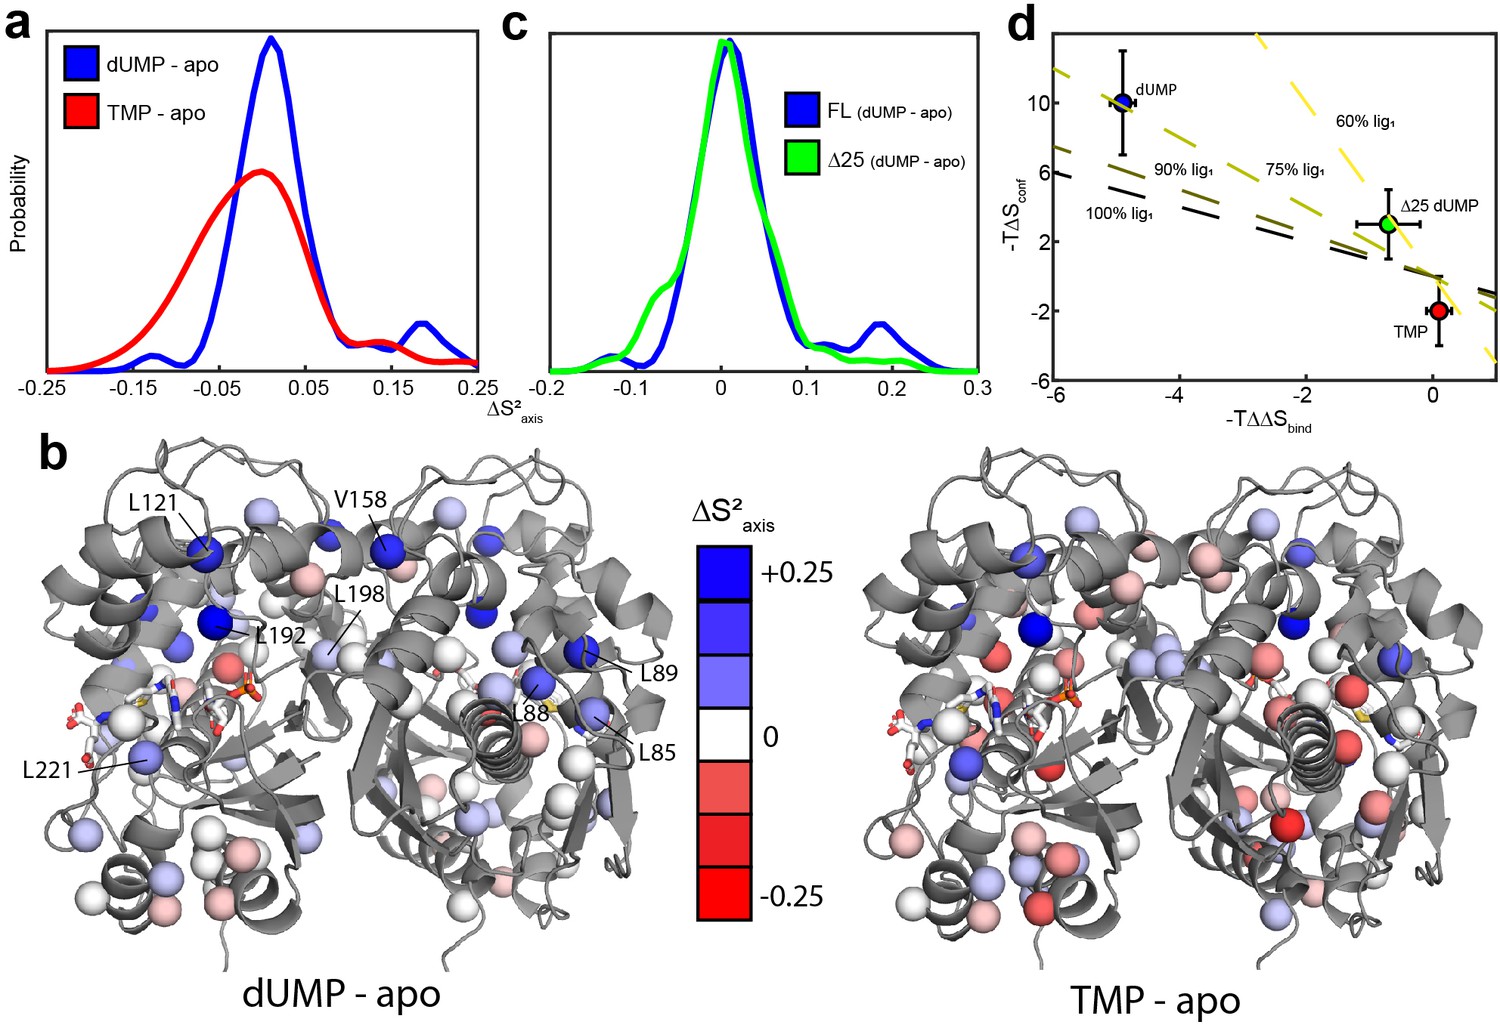
hTS is significantly rigidified on the ps-ns timescale upon binding both molecules of dUMP, but not upon binding product TMP nor Δ25 binding dUMP.
(a) Overlay of kernel distribution fits to values for dUMP-bound – apo hTS (blue, Figure 5—source data 1–2) and TMP-bound – apo hTS (red, Figure 5—source data 1 and 3). A pronounced shift in the distribution toward higher values (i.e. more rigid) is observed in the case of dUMP binding to hTS. (b) Residues included in the analysis are shown on the active structure of hTS (PDB ID 5X5 A), with the values indicated by red-white-blue gradient. Substrates dUMP and mTHF have been added to the structure in sticks. Overall, more blue (increase in , more rigid) is seen in the case of dUMP binding and more red (decrease in , more flexible) in the case of TMP binding, consistent with the overlay of distributions in (a). (c) Overlay of kernel distribution fits to values for dUMP-bound – apo full length hTS (blue) and dUMP-bound – apo Δ25 hTS (green, Figure 5—source data 4–5). Again, the distribution is shifted towards higher values in the case of dUMP binding to full length hTS, though the difference is less pronounced in this case. (d) There is a correlation between the difference in binding entropies, , and the change in conformational entropy upon binding both nucleotide molecules. The X% lig1 lines indicate what the would have to be to produce a given if all of the change in binding entropy stems from changes in conformational entropy and X% of the occurs upon the first binding event. Error bars are based on fits of Monte Carlo simulated datasets (see Materials & Methods).
-
Figure 5—source data 1
apo hTS ILV 2H transverse relaxation.
- https://cdn.elifesciences.org/articles/79915/elife-79915-fig5-data1-v1.zip
-
Figure 5—source data 2
hTS-dUMP ILV 2H transverse relaxation.
- https://cdn.elifesciences.org/articles/79915/elife-79915-fig5-data2-v1.zip
-
Figure 5—source data 3
hTS-TMP ILV 2H transverse relaxation.
- https://cdn.elifesciences.org/articles/79915/elife-79915-fig5-data3-v1.zip
-
Figure 5—source data 4
apo Δ25 hTS ILV 2H transverse relaxation.
- https://cdn.elifesciences.org/articles/79915/elife-79915-fig5-data4-v1.zip
-
Figure 5—source data 5
Δ25 hTS-dUMP ILV 2H transverse relaxation.
- https://cdn.elifesciences.org/articles/79915/elife-79915-fig5-data5-v1.zip
Figure 6 with 2 supplements

Colocalization of probes showing suppression of slow process and large order parameter change upon dUMP binding.
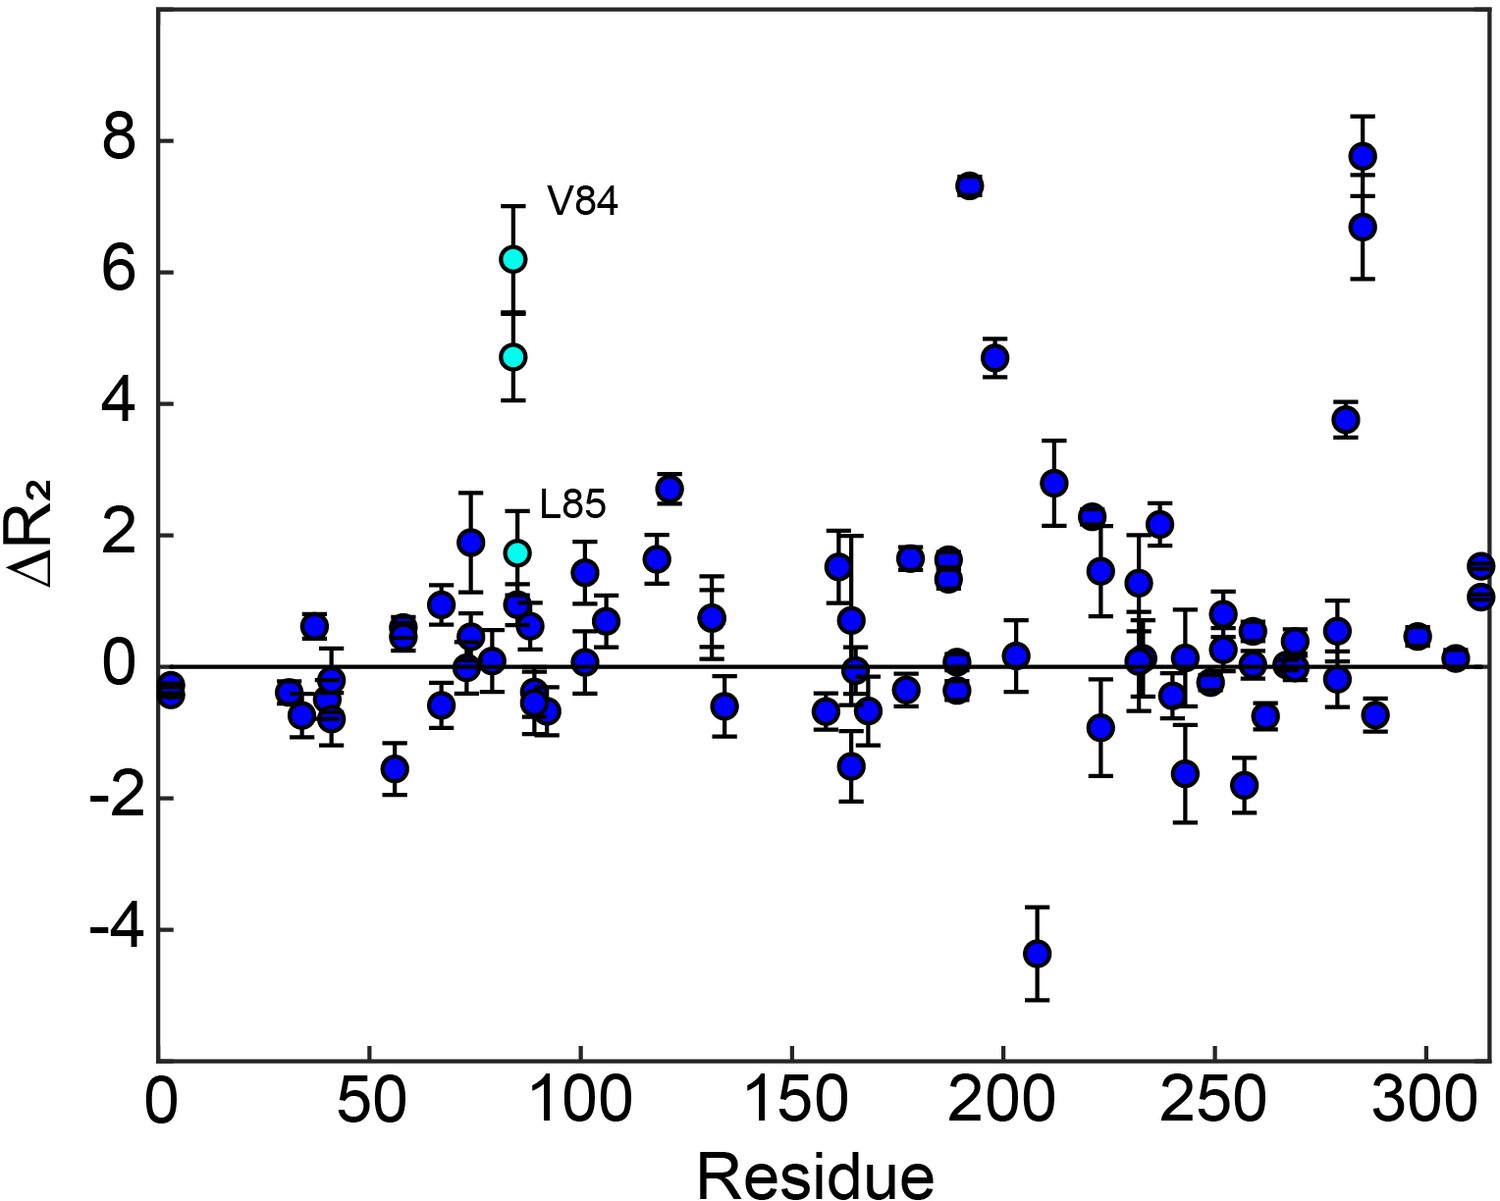
Residues having large changes in order parameter are shown in red and residues involved in the slow process on the µs-ms timescale are shown in blue. Probes which meet both of these criteria are shown in purple, while the rest are shown in gray. Of the six probes shown here that are involved in the slow process, four also have large order parameter changes. The two that do not are nearby probes which do have large order parameter changes (purple ovals). While the three remaining red probes, L85, L88, and L89 (purple *), are not near probes identified as being involved in the slow process in our dispersion analysis, the nearby residue V84 clearly shows dynamics on the µs-ms timescale in a 1H CPMG 2-plane experiment (Figure 6—figure supplement 1).
Figure 6—figure supplement 1
apo hTS 1 H CPMG 2-plane shows µs-ms motion in folate binding helix.
The two-plane CPMG experiment provides , in other words the magnitude of seen on the CPMG timescale. Notably, we see clear in V84, and to a lesser extent L85, in the folate binding helix. This suggests that this helix may be involved in the slow, concerted process as well.
Figure 6—figure supplement 2
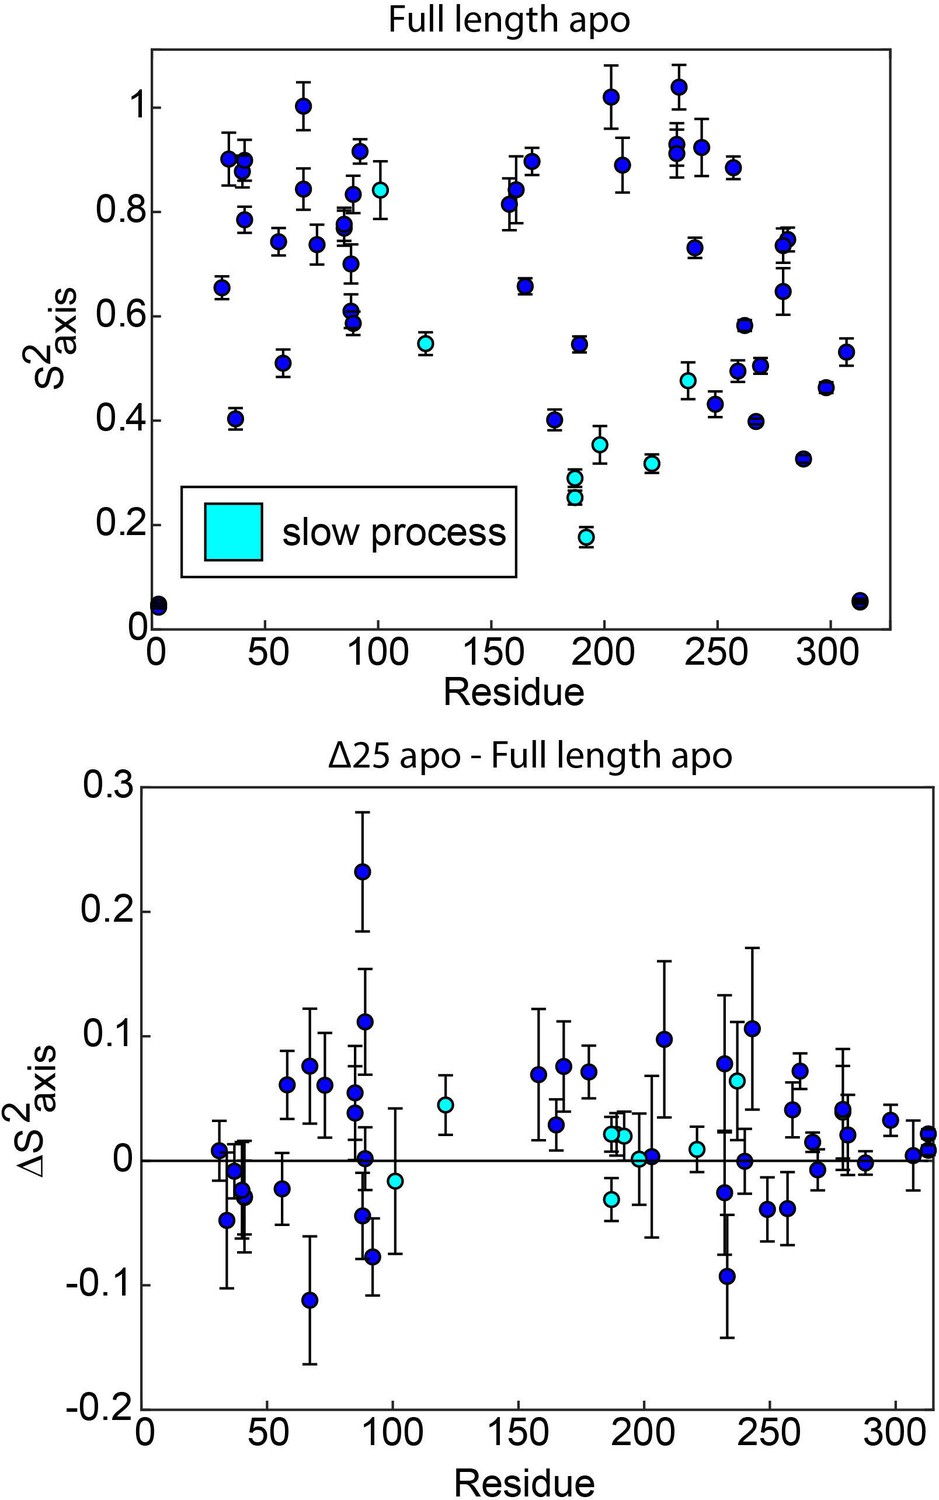
ps-ns motions may be necessary, but are not sufficient, to enable concerted µs-ms motion.
In full length apo hTS, residues involved in the slow, concerted process almost exclusively have relatively low order parameters (), indicating that they are dynamic on the ps-ns timescale (top). The one exception to this is L101. This suggests that these faster timescale dynamics may enable the slow motion occurring at these sites, as has been proposed previously. However, there is very little change in the order parameters for these probes in Δ25 hTS (bottom), which lacks the concerted µs-ms motion. This indicates that while ps-ns motion may play a significant role in enabling concerted µs-ms motion, these faster dynamics are not sufficient to produce the slower motion.
Figure 7 with 1 supplement
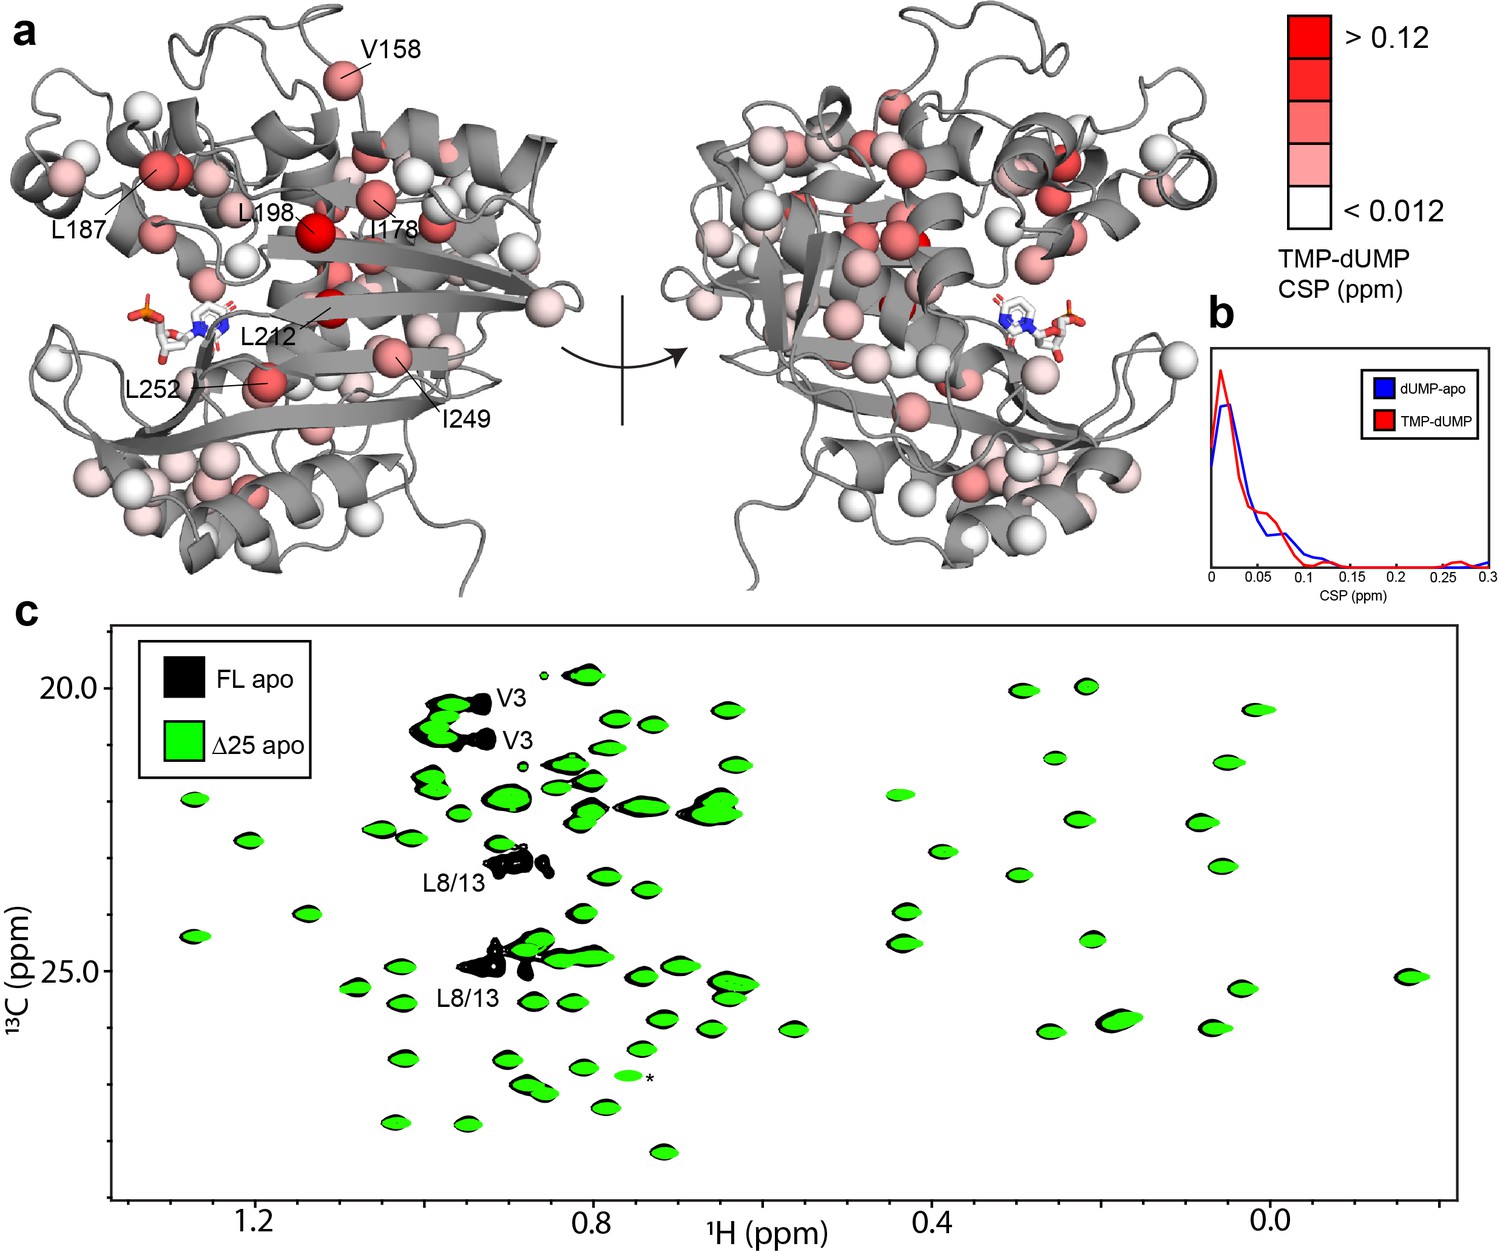
hTS-TMP and Δ25 hTS are structurally similar to hTS-dUMP and full length hTS, respectively.
CSPs between hTS-TMP and hTS-dUMP, , are shown on the apo active structure (5X5A) with the substrate dUMP added in sticks (a).The largest CSPs are often seen at the dimer interface, consistent with the idea that there is a difference in the intersubunit communication in the binding of these two nucleotides. Notably, almost all of the ILV probes on the beta sheet at the interface are in this group, including I178, L198, L212, I249, and L252. Overall, and strikingly, the magnitudes of the CSPs are very similar to that of dUMP binding to the apo enzyme, as can be seen in the distributions of these values (b). Since there is little structural change in hTS upon dUMP binding, this suggests that there is also little structural difference overall between hTS-TMP and hTS-dUMP. An overlay of HMQC spectra can be found in Figure 7—figure supplement 1. Even more strikingly, there are essentially no perturbations of the chemical shifts between apo full length and Δ25 hTS, as seen in an overlay of HMQC spectra of the Leu and Val methyls (c), suggesting that these two structures are virtually identical. The only major difference between these two spectra is the loss of resonances from N-terminal probes V3, L8, and L13 in the Δ25 spectrum, as expected. The signal marked with an asterisk is aliased in the Δ25 spectrum.
Figure 7—figure supplement 1
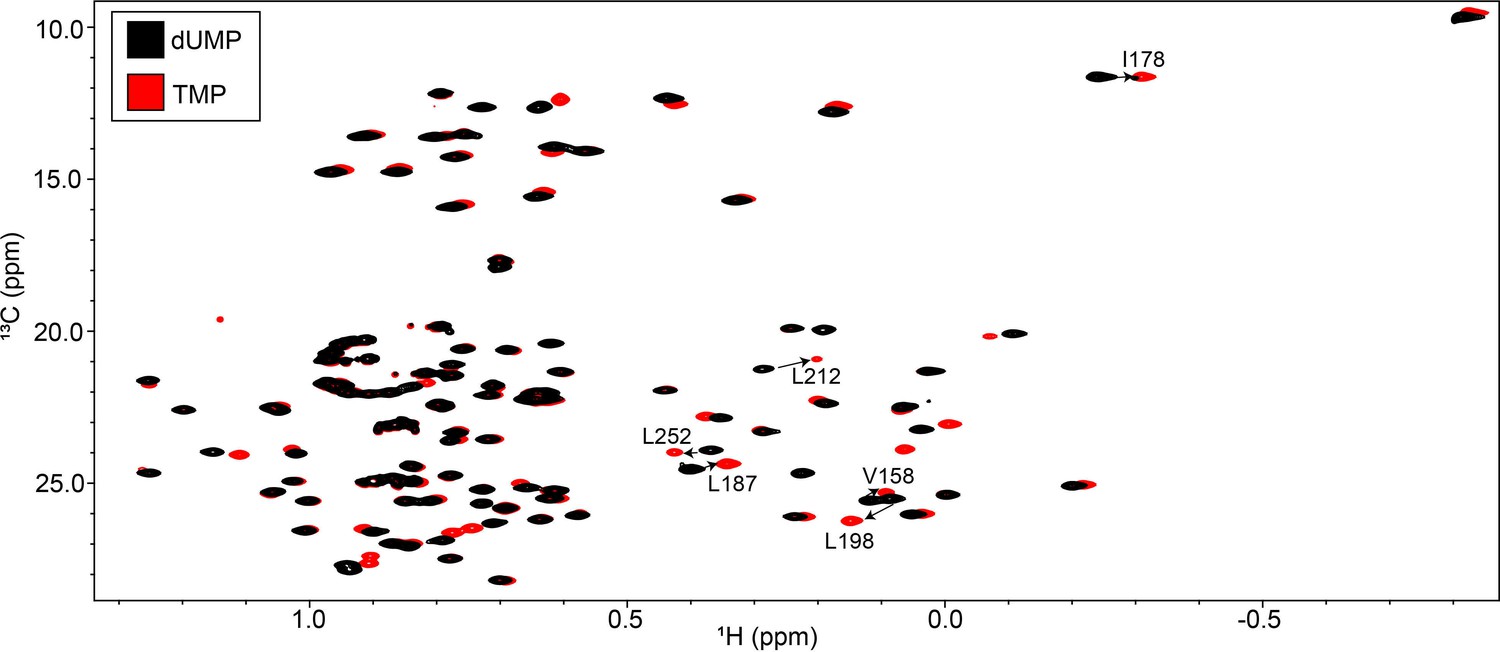
Overlay of hTS-dUMP and hTS-TMP ILV HMQC spectra.
The ILV HMQC spectrum of hTS-dUMP is shown in black, while that of hTS-TMP is shown in red. Several of the probes on the interface of hTS showing noticeable CSPs, which were highlighted in Figure 7, are annotated.
Figure 8 with 1 supplement
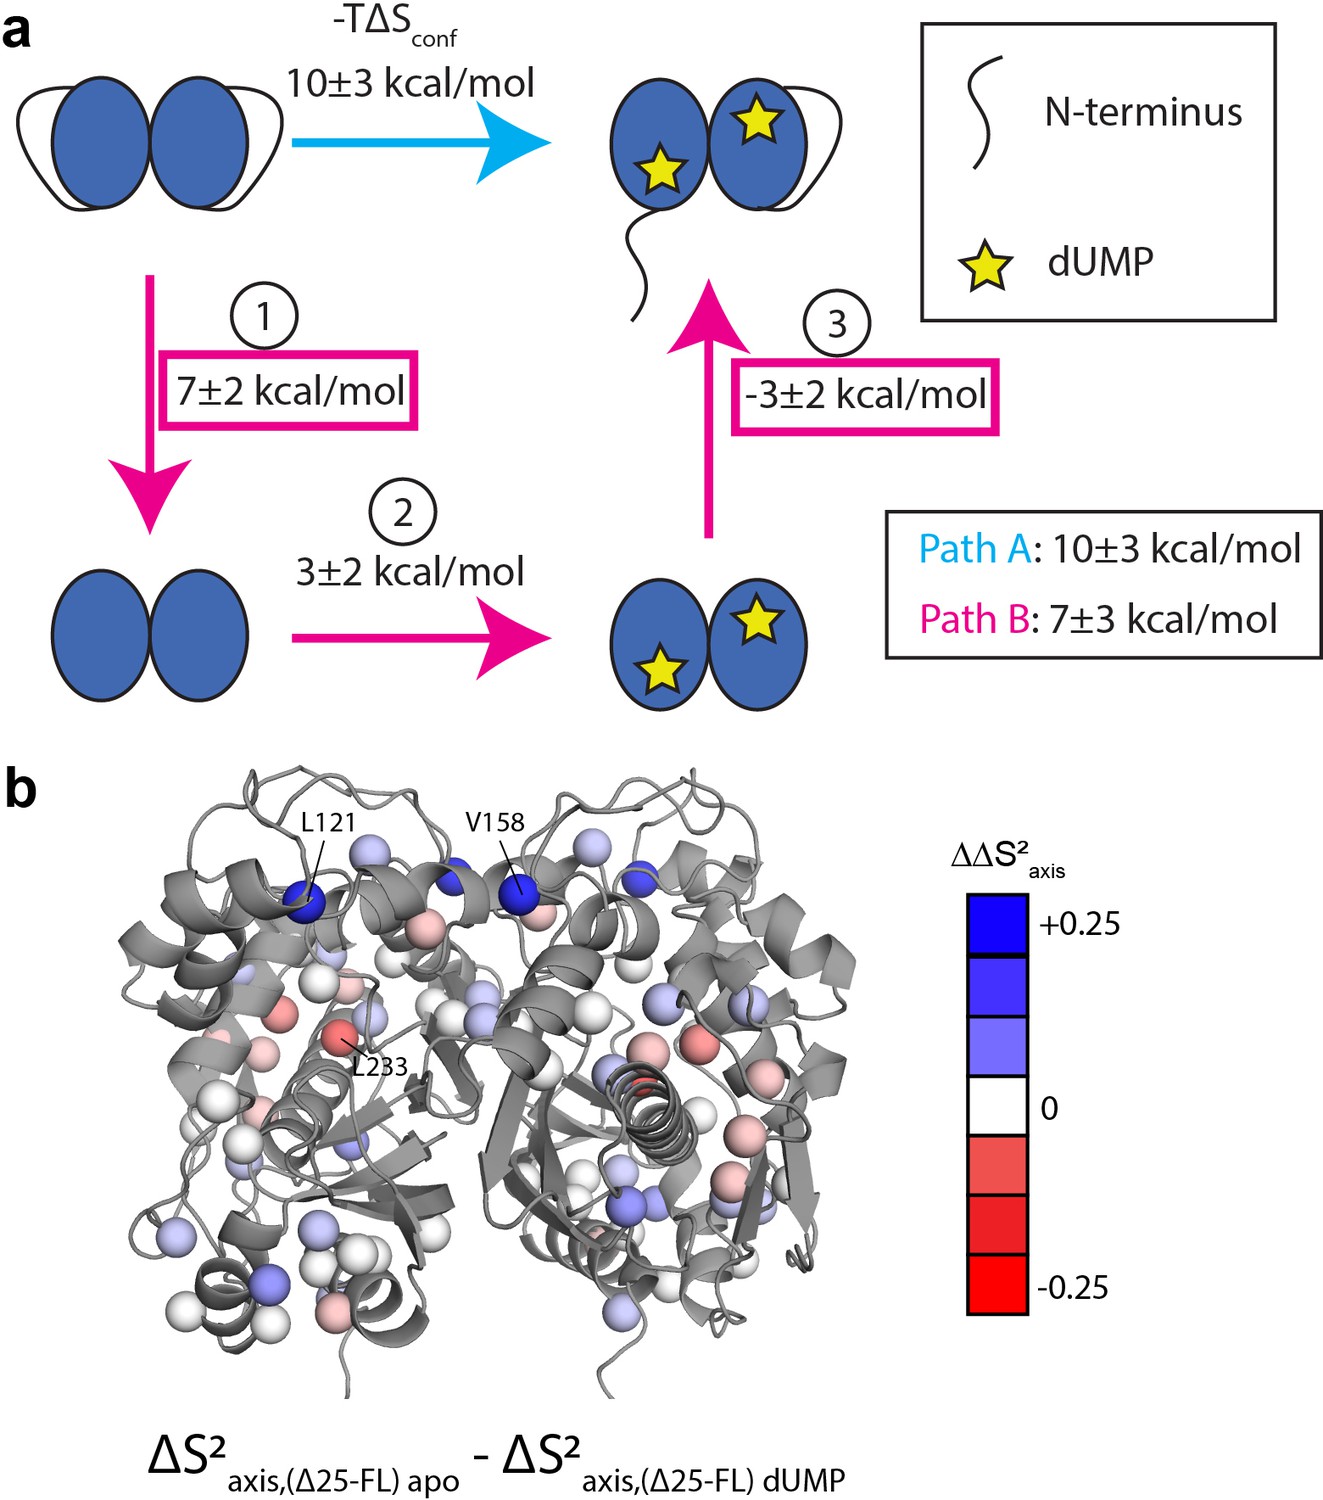
Thermodynamic cycle shows that the N-terminus contributes significantly to the rigidification on the ps-ns timescale of hTS upon dUMP binding.
(a) Thermodynamic cycle involving addition/removal of the N-terminus (full length vs. Δ25 hTS) and dUMP binding. Values are shown next to each step of paths A and B (note that nonidentical sets of probes were used to calculate the changes at each step, leading to the apparent difference between paths A and B). The sum of these values between steps 1 and 3 of path B (or equivalently, the difference between path A and step 2 of path B) represents the coupling between the N-terminus and dUMP binding, and this coupling is larger than the change in step 2 of path B; this identifies the N-terminus as being a key contributor to the overall change in conformational entropy upon dUMP binding. (b) Changes in methyl order parameter values between steps 1 and 3 of path B are shown on the active structure, with their values indicated by the red-white-blue gradient. Probes in blue are those which contribute to the rigidification upon dUMP binding that is coupled to the N-terminus (i.e. these probes are more rigidified upon dUMP binding in full length hTS than in Δ25 hTS). Probes showing the greatest rigidification are L121 and V158.
Figure 8—figure supplement 1
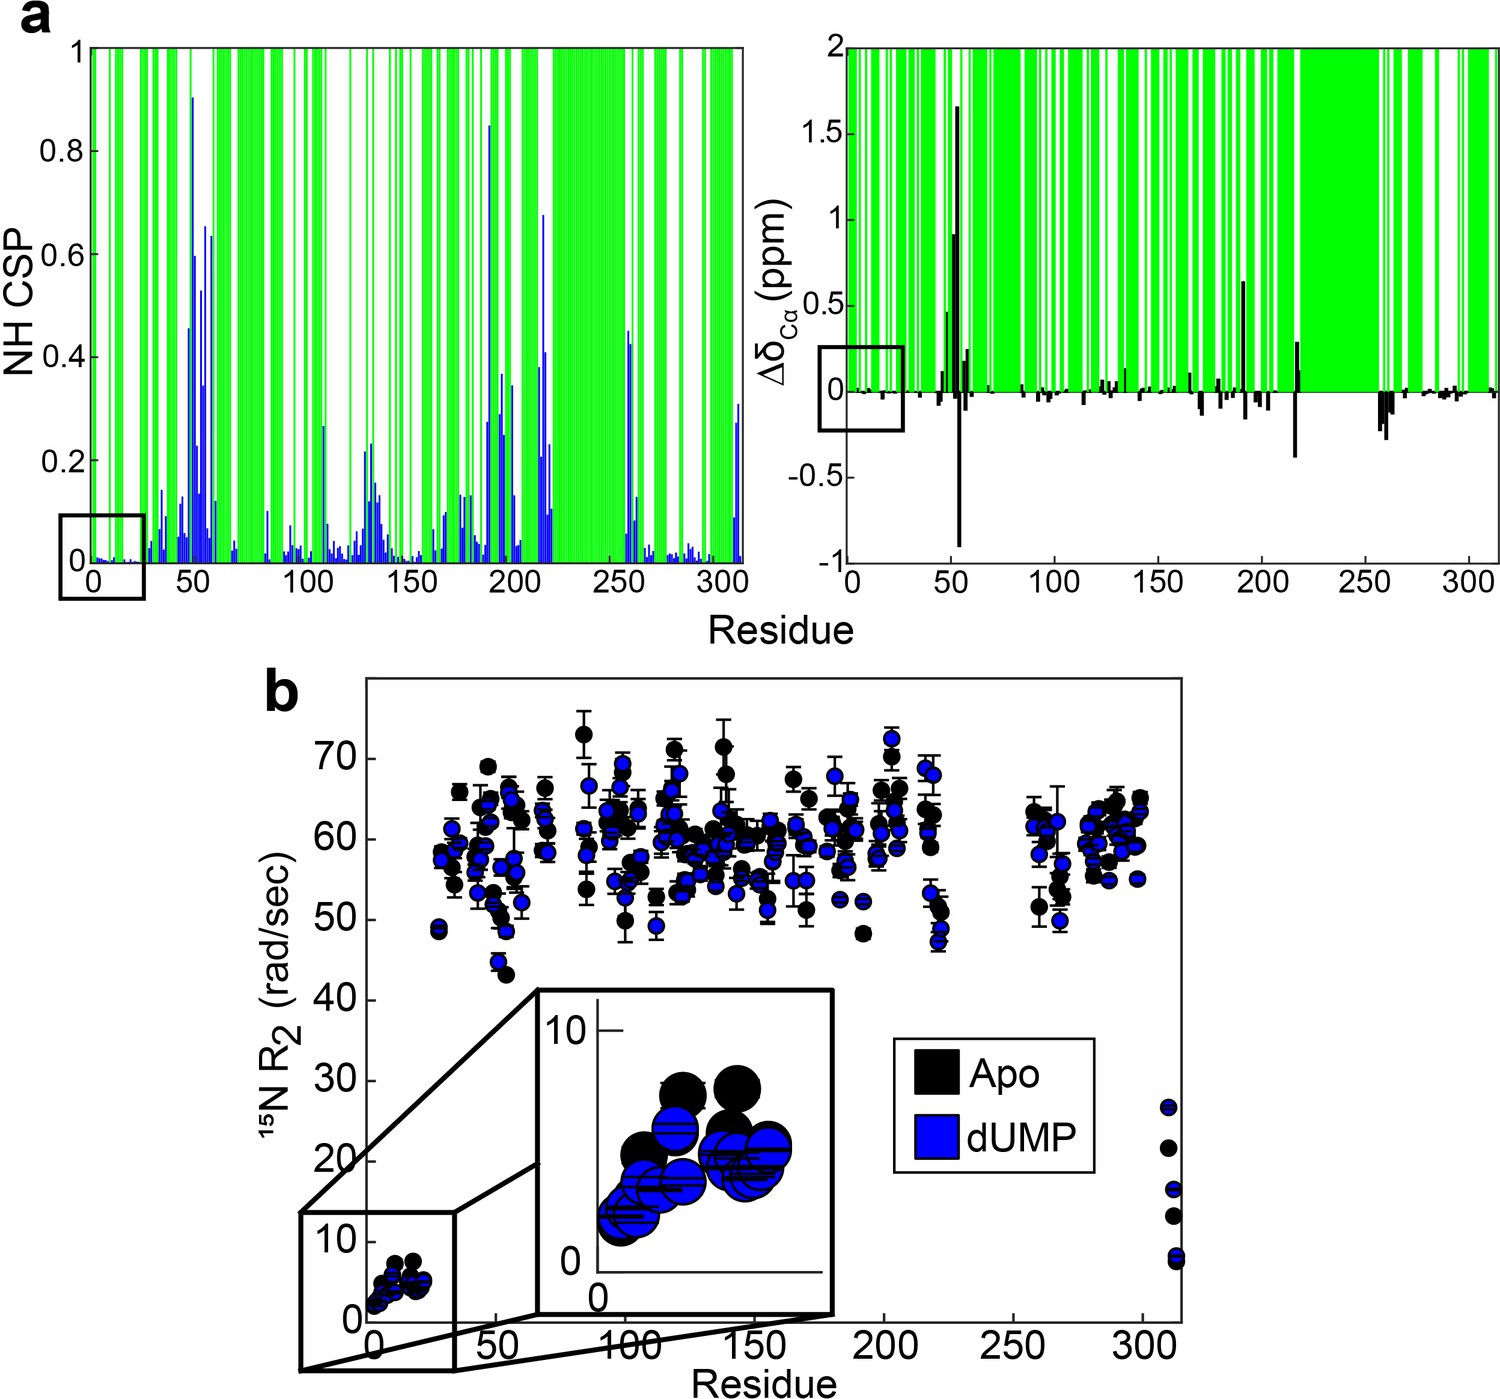
Backbone probes from N-terminus have small perturbations in chemical shift and transverse relaxation rate upon dUMP binding.
(a) CSPs between apo and dUMP bound states for backbone amides are shown by the blue bars (left). N-terminal residues are indicated by the black box. Green bars indicate unassigned residues. CSPs are calculated as where is the chemical shift of nucleus X in state y. Changes in Cα chemical shifts upon dUMP binding are shown by the black bars (right). The amide CSPs and changes in Cα shifts for the N-terminal residues are very small relative to the rest of the protein. (b) Transverse relaxation rates of backbones amides are shown for apo (black, Source data 5 and 6) and dUMP bound (blue, Source data 10 and 11) states. N-terminal residues are highlighted by the black box, where only subtle changes in the rates are seen.
Appendix 1—figure 1
B↔A↔C model is most appropriate for many probes involved in the slow, concerted process.
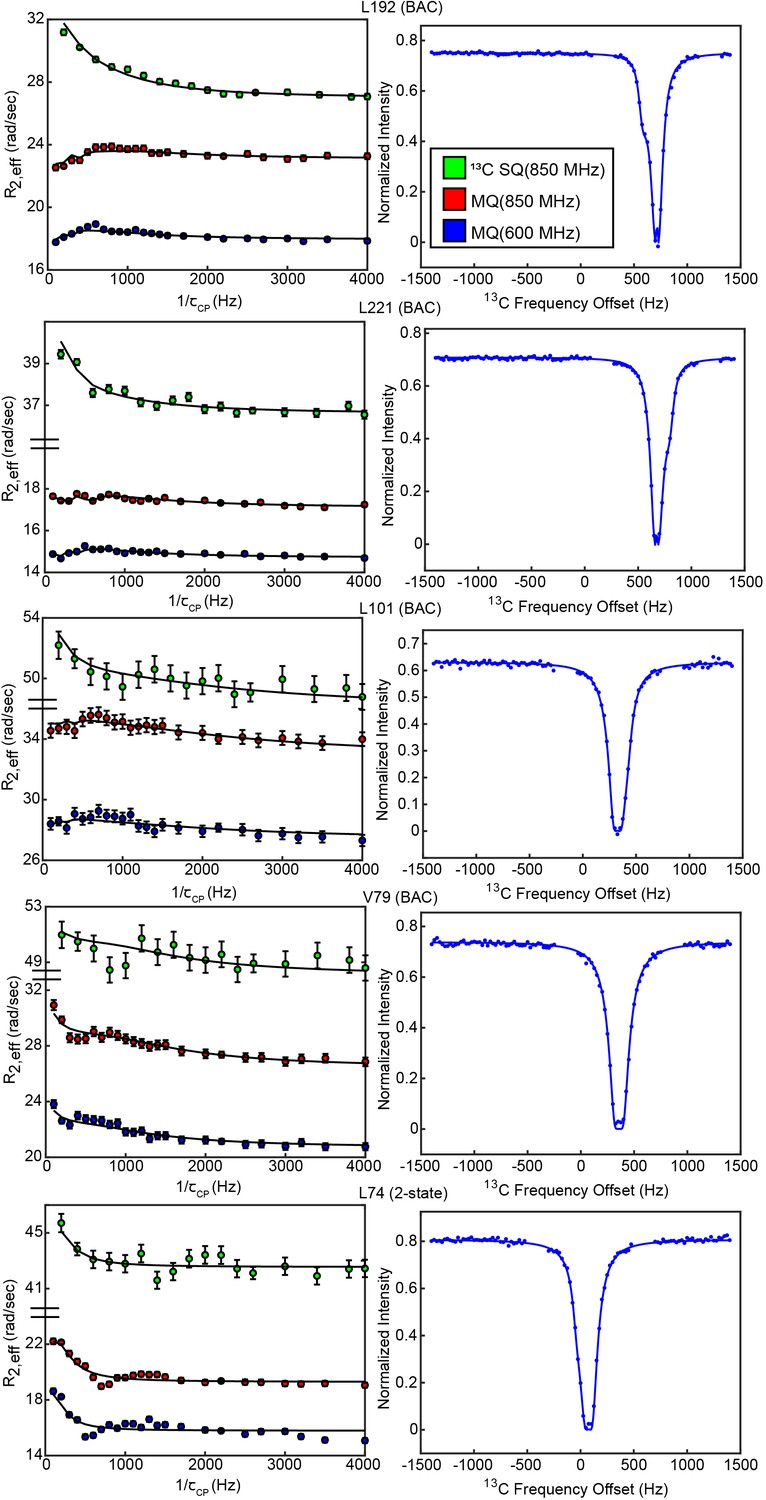
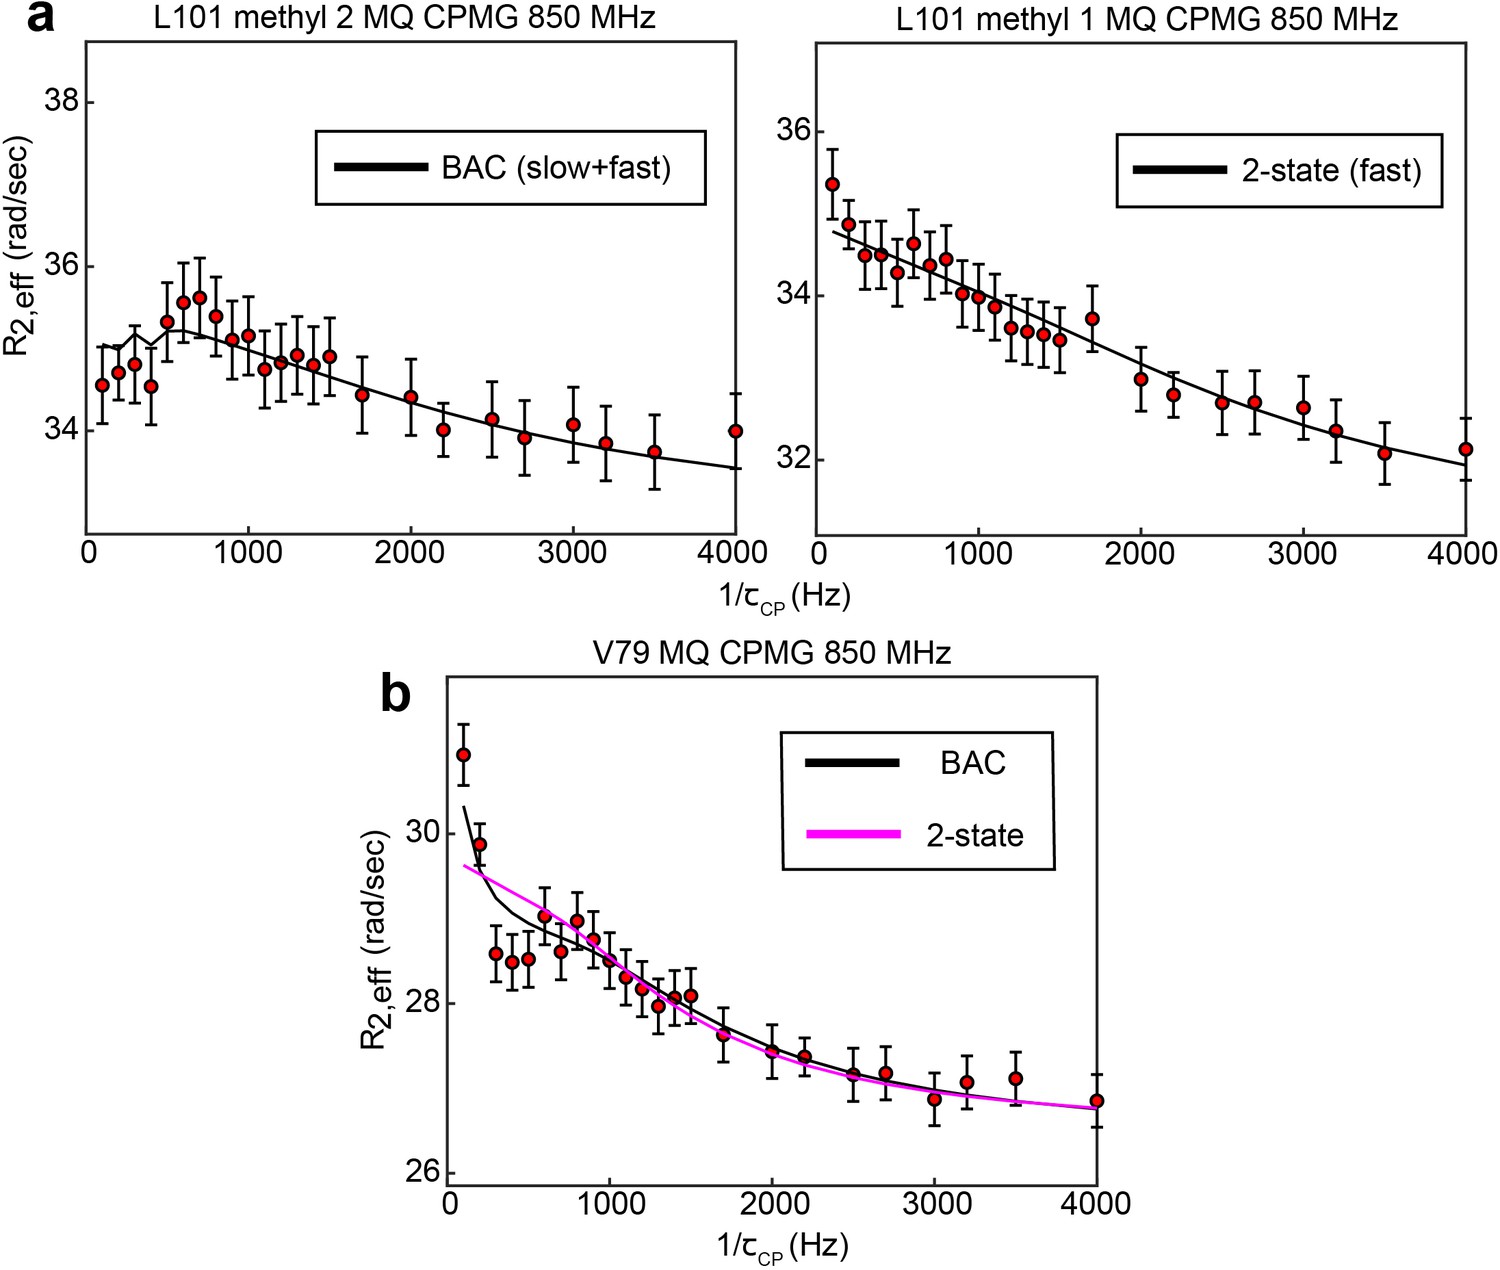
8 of 10 probes involved in the concerted process show 3-state exchange. For some probes, such as L192, L198, and I237, this can be clearly seen by comparison the goodness of fit of the 3-state and 2-state models (Supplementary file 1). In other cases, the difference in goodness of fit is much smaller, and additional justification for applying a 3-state model can be gained in other ways. In the case of L101 (methyl 2), while the slow process is clearly seen in the CEST data, the presence of the faster process is supported by the fact that this process is clearly seen in the other methyl group (methyl 1) of the same residue (a). In the case of V79, visual inspection of the MQ CPMG profile at 850 MHz shows a clear elevation of the first two points that is captured only by the 3-state fit (b). This difference is most likely not reproduced clearly in the because there are many more data points in the CEST data compared to the CPMG, giving the CEST data a larger weight than the CPMG in the norm of the residuals (i.e. the CEST data makes a larger contribution to than the CPMG). Error bars are based on duplicate point RMSD (see Materials & Methods).
Appendix 1—figure 2

Δ25 hTS lacks the slow, concerted process, but retains faster µs-ms motion.
Global fits of 3 CPMG datasets (2 fields of MQ, 1 field of 13C SQ, Appendix 1—figure 2—source data 1–3) for individual probes show that the probes undergoing 3-state exchange in full length apo hTS are well described by a 2-state model in apo Δ25 hTS (a). Error bars are based on duplicated point RMSD (see Materials & Methods). 13C Δω’s for Δ25 hTS agree reasonably well with those from the fast process for full length apo hTS (b), suggesting that similar configurations are being accessed in both cases. Error bars are based on fits to 200 Monte Carlo simulated datasets (see Materials & Methods). 1D selective CEST on L198 confirms the loss of the slow process in Δ25 hTS (c). Error bars are based on 1x base plane noise.
-
Appendix 1—figure 2—source data 1
apo Δ25 hTS LV 13C MQ CPMG 850 MHz.
- https://cdn.elifesciences.org/articles/79915/elife-79915-app1-fig2-data1-v1.zip
-
Appendix 1—figure 2—source data 2
apo Δ25 hTS LV 13C MQ CPMG 600 MHz.
- https://cdn.elifesciences.org/articles/79915/elife-79915-app1-fig2-data2-v1.zip
-
Appendix 1—figure 2—source data 3
apo Δ25 hTS LV 13C SQ CPMG 850 MHz.
- https://cdn.elifesciences.org/articles/79915/elife-79915-app1-fig2-data3-v1.zip
Appendix 1—figure 3
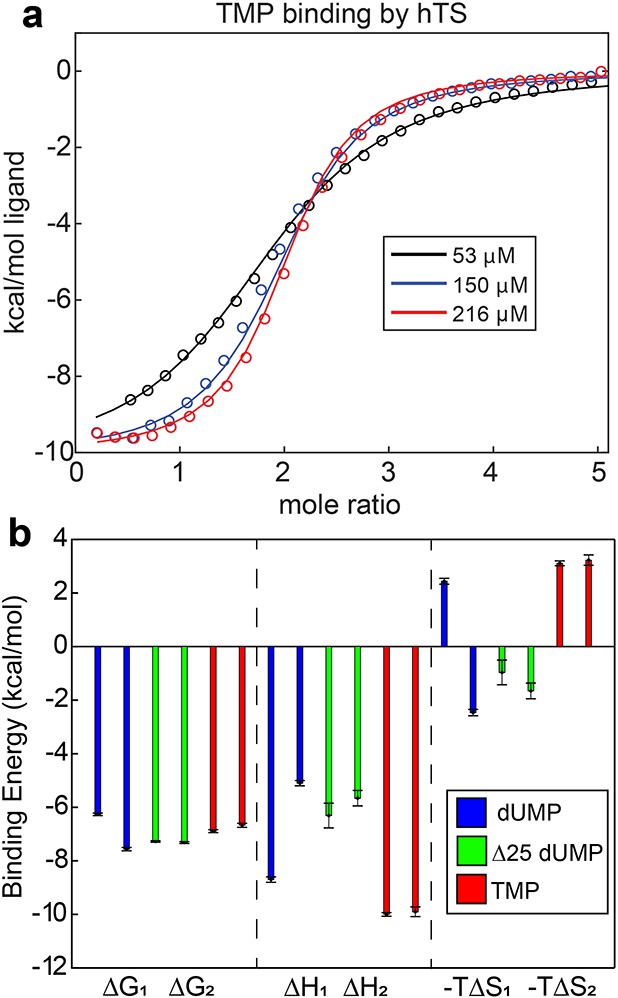
Lack of cooperativity in full length hTS binding TMP and Δ25 hTS binding dUMP.
(a) Global fit of ITC data for TMP binding to hTS with three enzyme concentrations (Appendix 1—figure 3—source data 1–3). (b) , , and for binding event from ITC fits are shown for full length hTS binding dUMP (blue), Δ25 hTS binding dUMP (green, Appendix 1—figure 3—source data 4–6), and full length hTS binding TMP (red, Appendix 1—figure 3—source data 1–3). is ~1.3 kcal/mol more negative than for full length hTS binding dUMP, indicating ~9 fold positive cooperativity (Bonin et al., 2019). For both Δ25 hTS binding dUMP and full length hTS binding TMP, , indicating that the binding is non-cooperative. Error bars are based on fits to Monte Carlo simulated datasets (see Materials & Methods).
-
Appendix 1—figure 3—source data 1
25 µM Δ25 hTS, dUMP ITC.
- https://cdn.elifesciences.org/articles/79915/elife-79915-app1-fig3-data1-v1.zip
-
Appendix 1—figure 3—source data 2
50 µM Δ25 hTS, dUMP ITC.
- https://cdn.elifesciences.org/articles/79915/elife-79915-app1-fig3-data2-v1.zip
-
Appendix 1—figure 3—source data 3
100 µM Δ25 hTS, dUMP ITC.
- https://cdn.elifesciences.org/articles/79915/elife-79915-app1-fig3-data3-v1.zip
-
Appendix 1—figure 3—source data 4
53 µM hTS, TMP ITC.
- https://cdn.elifesciences.org/articles/79915/elife-79915-app1-fig3-data4-v1.zip
-
Appendix 1—figure 3—source data 5
150 µM hTS, TMP ITC.
- https://cdn.elifesciences.org/articles/79915/elife-79915-app1-fig3-data5-v1.zip
-
Appendix 1—figure 3—source data 6
216 µM hTS, TMP ITC.
- https://cdn.elifesciences.org/articles/79915/elife-79915-app1-fig3-data6-v1.zip
Additional files
-
Source code 1
This file is a MATLAB script which reads in a table of intensities from a CPMG experiment (generated by the RateAnalysis module in NMRViewJ) and calculates the at each .
- https://cdn.elifesciences.org/articles/79915/elife-79915-code1-v1.zip
-
Source code 2
This file is a MATLAB script which performs a 3-state fit (B↔A↔C model) of a single methyl group using SQ and MQ CPMG and CEST data.
The parameters for the slow (A↔B) process are fixed based on the values obtained in a global 2-state fit of the CEST data alone. This script requires a fitting function (Source code 5), which is where the calculation of the residuals is carried out.
- https://cdn.elifesciences.org/articles/79915/elife-79915-code2-v1.zip
-
Source code 3
This file is a MATLAB script which performs a 3-state fit (B↔A↔C model) of a single methyl group using SQ CPMG and CEST data (used for I237 here).
The parameters for the slow (A↔B) process are fixed based on the values obtained in a global 2-state fit of the CEST data alone. This script requires a fitting function (Source code 6).
- https://cdn.elifesciences.org/articles/79915/elife-79915-code3-v1.zip
-
Source code 4
This file is a MATLAB script which performs a global fit of two geminal methyl groups from the same residue using SQ and MQ CPMG and CEST data (used for I101, L131 here).
For one of the methyl groups, a B↔A↔C model is used, while for the other a 2-state model is used. The faster process (A↔C) parameters are shared between the two methyl groups, while the slow process (A↔B) parameters are fixed on the values obtained in a global 2-state fit of the CEST data alone. This script requires a fitting function (Source code 7).
- https://cdn.elifesciences.org/articles/79915/elife-79915-code4-v1.zip
-
Source code 5
This file is the MATLAB fitting function used by Source code 2.
- https://cdn.elifesciences.org/articles/79915/elife-79915-code5-v1.zip
-
Source code 6
This file is the MATLAB fitting function used by Source code 3.
- https://cdn.elifesciences.org/articles/79915/elife-79915-code6-v1.zip
-
Source code 7
This file is the MATLAB fitting function used by Source code 4.
- https://cdn.elifesciences.org/articles/79915/elife-79915-code7-v1.zip
-
Source code 8
This file is a MATLAB script which performs either a 2-state or a 3-state (B↔A↔C model) fit of a single methyl group using SQ and MQ CPMG and CEST data with no fixed parameters.
This script requires a fitting function (Source code 9 and 10).
- https://cdn.elifesciences.org/articles/79915/elife-79915-code8-v1.zip
-
Source code 9
This file is the MATLAB fitting function used by Source code 8 (3-state).
- https://cdn.elifesciences.org/articles/79915/elife-79915-code9-v1.zip
-
Source code 10
This file is the MATLAB fitting function used by Source code 8 (2-state).
- https://cdn.elifesciences.org/articles/79915/elife-79915-code10-v1.zip
-
Source code 11
This file is a MATLAB script which reads in a table of intensities from a CEST experiment (generated by the RateAnalysis module in NMRViewJ) and calculates the normalized intensities at each spin lock offset.
- https://cdn.elifesciences.org/articles/79915/elife-79915-code11-v1.zip
-
Source code 12
This file is a MATLAB script which performs a 2-state global fit of multiple methyl groups using only the CEST data.
The parameters obtained by this fit are used to fix the slow process parameters in the 3-state fits of the methyl groups involved in the global motion. This script requires a fitting function (Source code 13).
- https://cdn.elifesciences.org/articles/79915/elife-79915-code12-v1.zip
-
Source code 13
This file is the MATLAB fitting function used by Source code 12.
- https://cdn.elifesciences.org/articles/79915/elife-79915-code13-v1.zip
-
Source code 14
This file is a MATLAB script which performs a global fit of ITC data collected at various protein concentrations using a general two-site binding model.
This script requires a fitting function (Source code 15).
- https://cdn.elifesciences.org/articles/79915/elife-79915-code14-v1.zip
-
Source code 15
This file is the MATLAB fitting function used by Source code 14.
- https://cdn.elifesciences.org/articles/79915/elife-79915-code15-v1.zip
-
Source data 1
Apo hTS 15N T1 600 MHz.
- https://cdn.elifesciences.org/articles/79915/elife-79915-data1-v1.txt
-
Source data 2
Apo hTS 15N T1ρ 600 MHz.
- https://cdn.elifesciences.org/articles/79915/elife-79915-data2-v1.txt
-
Source data 3
Apo hTS 15N-1H Heteronuclear NOE 600 MHz.
- https://cdn.elifesciences.org/articles/79915/elife-79915-data3-v1.txt
-
Source data 4
Apo hTS 15N T1 500 MHz.
- https://cdn.elifesciences.org/articles/79915/elife-79915-data4-v1.txt
-
Source data 5
Apo hTS 15N T1ρ 500 MHz.
- https://cdn.elifesciences.org/articles/79915/elife-79915-data5-v1.txt
-
Source data 6
Apo hTS 15N-1H Heteronuclear NOE 500 MHz.
- https://cdn.elifesciences.org/articles/79915/elife-79915-data6-v1.txt
-
Source data 7
hTS-dUMP 15N T1 600 MHz.
- https://cdn.elifesciences.org/articles/79915/elife-79915-data7-v1.txt
-
Source data 8
hTS-dUMP 15N T1ρ 600 MHz.
- https://cdn.elifesciences.org/articles/79915/elife-79915-data8-v1.txt
-
Source data 9
hTS-dUMP 15N-1H Heteronuclear NOE 600 MHz.
- https://cdn.elifesciences.org/articles/79915/elife-79915-data9-v1.txt
-
Source data 10
hTS-dUMP 15N T1 500 MHz.
- https://cdn.elifesciences.org/articles/79915/elife-79915-data10-v1.txt
-
Source data 11
hTS-dUMP 15N T1ρ 500 MHz.
- https://cdn.elifesciences.org/articles/79915/elife-79915-data11-v1.txt
-
Source data 12
hTS-TMP 15N T1 600 MHz.
- https://cdn.elifesciences.org/articles/79915/elife-79915-data12-v1.txt
-
Source data 13
hTS-TMP 15N T1ρ 600 MHz.
- https://cdn.elifesciences.org/articles/79915/elife-79915-data13-v1.txt
-
Source data 14
hTS-TMP 15N-1H Heteronuclear NOE 600 MHz.
- https://cdn.elifesciences.org/articles/79915/elife-79915-data14-v1.txt
-
Source data 15
Apo Δ25 hTS 15N T1 600 MHz.
- https://cdn.elifesciences.org/articles/79915/elife-79915-data15-v1.txt
-
Source data 16
Apo Δ25 hTS 15N T1ρ 600 MHz.
- https://cdn.elifesciences.org/articles/79915/elife-79915-data16-v1.txt
-
Source data 17
Apo Δ25 hTS 15N-1H Heteronuclear NOE 600 MHz.
- https://cdn.elifesciences.org/articles/79915/elife-79915-data17-v1.txt
-
Source data 18
Δ25 hTS-dUMP 15N T1 600 MHz.
- https://cdn.elifesciences.org/articles/79915/elife-79915-data18-v1.txt
-
Source data 19
Δ25 hTS-dUMP 15N T1ρ 600 MHz.
- https://cdn.elifesciences.org/articles/79915/elife-79915-data19-v1.txt
-
Supplementary file 1
Goodness of fit and parameter values for 3-state probes.
(a) values from global fit with ,
(b) population and exchange rate shown for slower of two processes. Unlike the B↔A↔C model, which gives very similar and for individual fits of these probes, the A↔B↔C model yields heterogeneous values, primarily for the exchange rate (c) is calculated as
- https://cdn.elifesciences.org/articles/79915/elife-79915-supp1-v1.docx
-
Supplementary file 2
apo hTS µs-ms motion fit parameter values.
Probes involved in the concerted process are given the purple background. If a probe is fit to a 2-state model (), the parameters for the process are left blank. Cases where a 1H is fixed at 0 are indicated by the ‘-‘. Parameter values are reported as median ±standard deviation of fit values from 200 Monte Carlo simulations of the data. For probes involved in the concerted process, the error in is the sum of the errors from the 2-state fit of the CEST data alone and from the global fit of the CPMG and CEST data with the slow process parameters fixed. Only the 13C ’s for the slow, concerted process have sign information from the CEST data; all other ’s should be interpreted only as the magnitude of the chemical shift difference. The background of each parameter value is color-coded based on the magnitude of the error relative to the parameter value, where blue indicates low error, yellow indicates medium error, and red indicates large error. In some cases, particularly for the populations, physical constraints on the parameter value (i.e. population cannot be less than 0) lead to highly skewed distributions of the parameter values in our Monte Carlo simulations. This can lead to nonsensical values when reported in our typical manner, for example the given for L279 despite the fact that the population cannot be less than 0. In these cases, we have also listed (5% quantile, mode, 95% quantile) to provide greater insight into the distribution of values seen in the Monte Carlo simulations. For L269, marked with the asterisk, the CEST data was not included in the fit. Probes possessing which weren’t analyzed include L67, V164, and V313. Refer to the legend of Supplementary file 7 for a description of the ‘met 1’ and ‘met 2’ labels.
- https://cdn.elifesciences.org/articles/79915/elife-79915-supp2-v1.docx
-
Supplementary file 3
hTS-dUMP µs-ms motion fit parameter values.
All probes are fit to a 2-state model. Color-coding and values in parenthesis are as described in Supplementary file 2. L192 met 2, marked by the asterisk, is presumably the same methyl group analyzed in apo hTS given the similarity in the ’s, but assignment of this signal is complicated by a large chemical shift perturbation between apo and dUMP bound states.
- https://cdn.elifesciences.org/articles/79915/elife-79915-supp3-v1.docx
-
Supplementary file 4
apo Δ25 hTS µs-ms motion fit parameter values.
All probes are fit to a 2-state model. Color-coding and values in parenthesis are as described in Supplementary file 2.
- https://cdn.elifesciences.org/articles/79915/elife-79915-supp4-v1.docx
-
Supplementary file 5
Acquisition parameters for NMR experiments.
- https://cdn.elifesciences.org/articles/79915/elife-79915-supp5-v1.docx
-
Supplementary file 6
Rotational correlation times for hTS-bound states.
Rotational correlation times for various hTS-bound states determined by 15N relaxation (Source data 1–19).
- https://cdn.elifesciences.org/articles/79915/elife-79915-supp6-v1.docx
-
Supplementary file 7
apo hTS methyl rotation axis order parameters.
For LV methyls, the labels ‘met1’ and ‘met2’ are given, where ‘met1’ has the larger 13C chemical shift, as stereospecific assignments have not been made. For all other states, the ‘met1’ and ‘met2’ labels are given based on chemical shift similarity to the apo state. The only exception is L192, where ’s obtained from our dispersion fits guided the assignment.
- https://cdn.elifesciences.org/articles/79915/elife-79915-supp7-v1.docx
-
Supplementary file 8
hTS-dUMP methyl rotation axis order parameters.
- https://cdn.elifesciences.org/articles/79915/elife-79915-supp8-v1.docx
-
Supplementary file 9
hTS-TMP methyl rotation axis order parameters.
- https://cdn.elifesciences.org/articles/79915/elife-79915-supp9-v1.docx
-
Supplementary file 10
Δ25 hTS apo methyl rotation axis order parameters.
- https://cdn.elifesciences.org/articles/79915/elife-79915-supp10-v1.docx
-
Supplementary file 11
Δ25 hTS-dUMP methyl rotation axis order parameters.
- https://cdn.elifesciences.org/articles/79915/elife-79915-supp11-v1.docx
-
Transparent reporting form
- https://cdn.elifesciences.org/articles/79915/elife-79915-transrepform1-v1.pdf
-
Appendix 1—figure 2—source data 1
apo Δ25 hTS LV 13C MQ CPMG 850 MHz.
- https://cdn.elifesciences.org/articles/79915/elife-79915-app1-fig2-data1-v1.zip
-
Appendix 1—figure 2—source data 2
apo Δ25 hTS LV 13C MQ CPMG 600 MHz.
- https://cdn.elifesciences.org/articles/79915/elife-79915-app1-fig2-data2-v1.zip
-
Appendix 1—figure 2—source data 3
apo Δ25 hTS LV 13C SQ CPMG 850 MHz.
- https://cdn.elifesciences.org/articles/79915/elife-79915-app1-fig2-data3-v1.zip
-
Appendix 1—figure 3—source data 1
25 µM Δ25 hTS, dUMP ITC.
- https://cdn.elifesciences.org/articles/79915/elife-79915-app1-fig3-data1-v1.zip
-
Appendix 1—figure 3—source data 2
50 µM Δ25 hTS, dUMP ITC.
- https://cdn.elifesciences.org/articles/79915/elife-79915-app1-fig3-data2-v1.zip
-
Appendix 1—figure 3—source data 3
100 µM Δ25 hTS, dUMP ITC.
- https://cdn.elifesciences.org/articles/79915/elife-79915-app1-fig3-data3-v1.zip
-
Appendix 1—figure 3—source data 4
53 µM hTS, TMP ITC.
- https://cdn.elifesciences.org/articles/79915/elife-79915-app1-fig3-data4-v1.zip
-
Appendix 1—figure 3—source data 5
150 µM hTS, TMP ITC.
- https://cdn.elifesciences.org/articles/79915/elife-79915-app1-fig3-data5-v1.zip
-
Appendix 1—figure 3—source data 6
216 µM hTS, TMP ITC.
- https://cdn.elifesciences.org/articles/79915/elife-79915-app1-fig3-data6-v1.zip
Download links
A two-part list of links to download the article, or parts of the article, in various formats.
Downloads (link to download the article as PDF)
Open citations (links to open the citations from this article in various online reference manager services)
Cite this article (links to download the citations from this article in formats compatible with various reference manager tools)
Dynamic allostery in substrate binding by human thymidylate synthase
eLife 11:e79915.
https://doi.org/10.7554/eLife.79915


