Therapeutic resistance in acute myeloid leukemia cells is mediated by a novel ATM/mTOR pathway regulating oxidative phosphorylation
- Department of Biochemistry and Molecular Genetics, School of Medicine, University of Colorado Anschutz Medical Campus, United States
- Medical Scientist Training Program, University of Colorado Anschutz Medical Campus, United States
- Department of Pharmacology, University of Colorado Anschutz Medical Campus, United States
- University of Colorado Comprehensive Cancer Center, University of Colorado Anschutz Medical Campus, United States
- Department of Medicine, Section of Hematology, University of Colorado Anschutz Medical Campus, United States
Figures
Figure 1 with 4 supplements
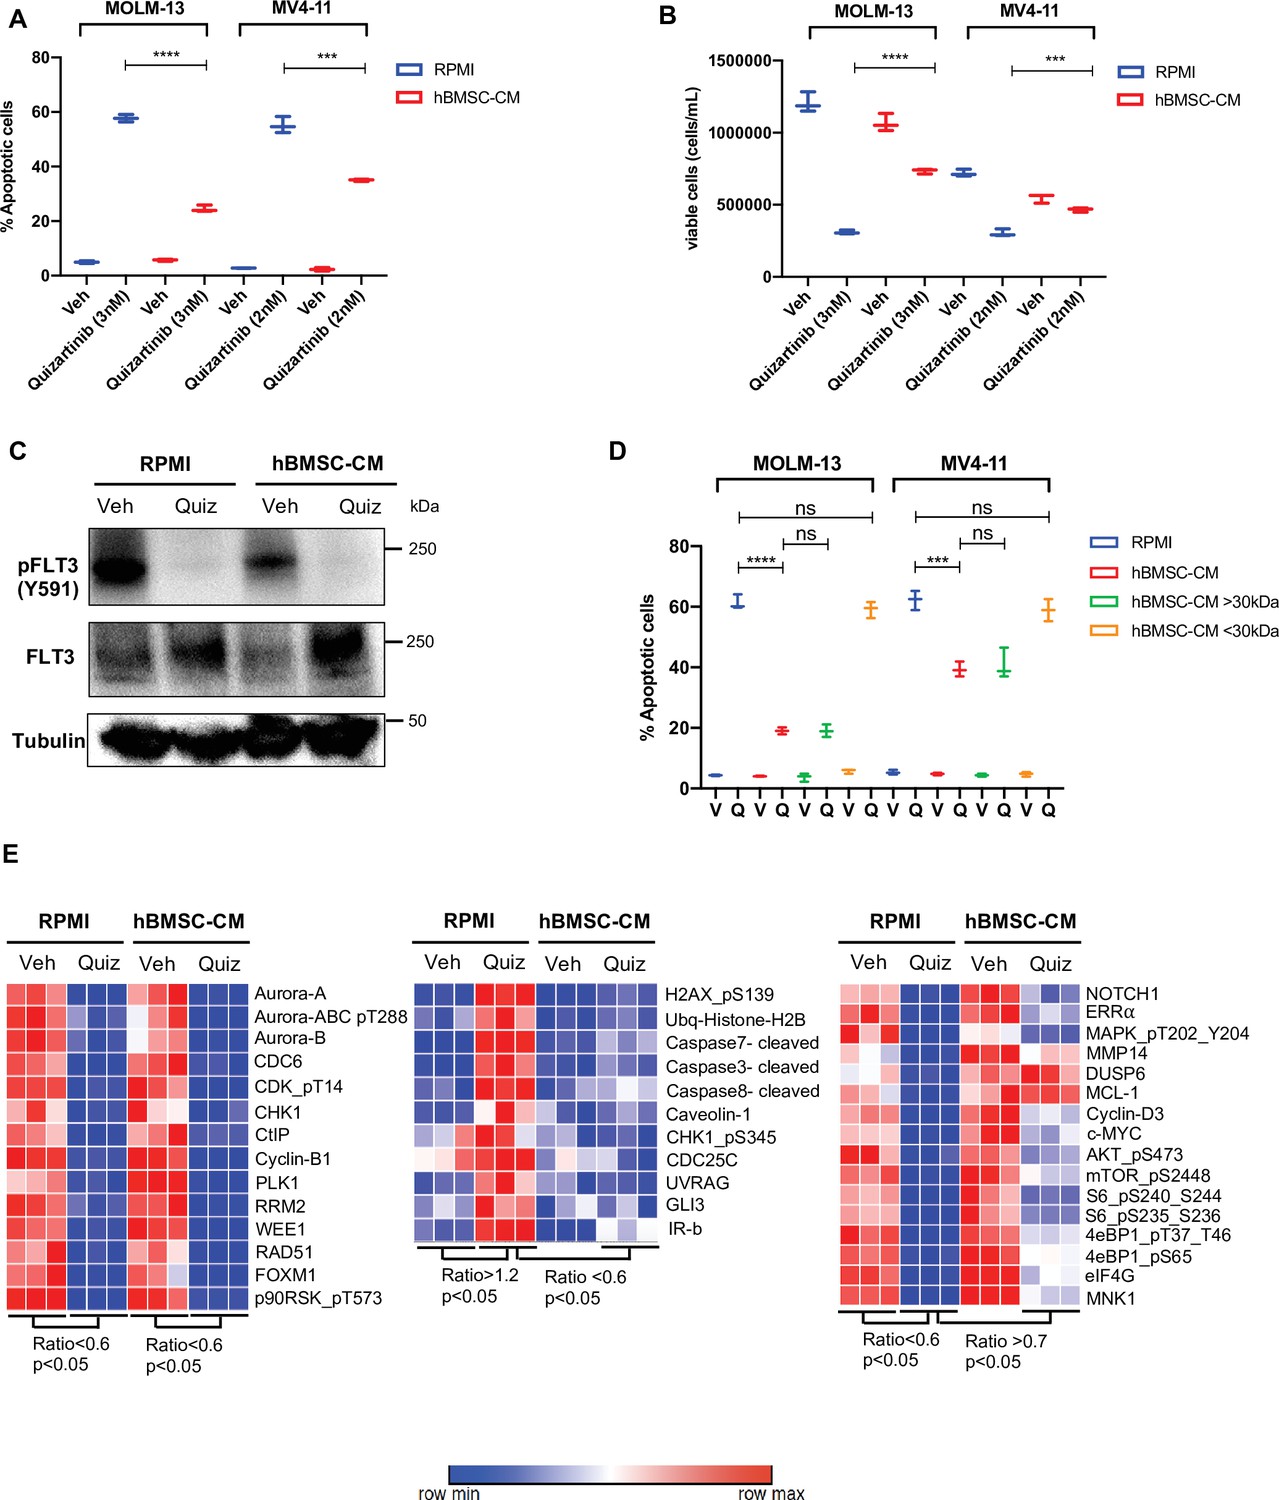
Conditioned media of human bone marrow stromal cells (hBMSCs) prevents apoptosis in FLT3-ITD acute myeloid leukemia (AML) cells upon FLT3 inhibition.
(A, B), FLT3-ITD AML cell lines, MOLM-13 and MV4-11, were treated with either DMSO (veh) or quizartinib with indicated doses for 48 hr in regular media (RPMI) or 50% conditioned media of human BM stromal cells in RPMI (hBMSC-CM). (A) Apoptotic cells were detected by 7-AAD/Annexin V staining post-treatment. (B) Cell viability was measured based on propidium iodide (PI) exclusion after 5 days of rebound growth post-treatment (n = 3). (C), MOLM-13 cells were harvested after 15 hr of indicated treatments (Quiz: 3 nM quizartinib) to determine FLT3 activation by Western blotting. (D), MOLM-13 and MV4-11 cells were treated with either vehicle (V) or quizartinib (Q) for 48 hr in RPMI, hBMSC-CM, RPMI supplemented with heavy fraction (>30 kDa) of hBMSC-CM or light fraction (<30 kDa) of hBMSC-CM, followed by detection of apoptotic cells. (E), MOLM-13 cells were harvested after 16 hr of treatments as indicated and subjected to reverse-phase protein array analysis to explore the expression/activation levels of a wide range of proteins.
-
Figure 1—source data 1
Unedited raw blots for Figure 1C are shown.
- https://cdn.elifesciences.org/articles/79940/elife-79940-fig1-data1-v2.zip
-
Figure 1—source data 2
Unedited blots with labels for Figure 1C are shown.
- https://cdn.elifesciences.org/articles/79940/elife-79940-fig1-data2-v2.zip
Figure 1—figure supplement 1

Human bone marrow stromal cells (hBMSC-CM) provide protection against apoptosis in FLT3-ITD acute myeloid leukemia (AML) cells following FLT3 inhibition by gilteritinib.
(A, B) MOLM-13 cells were treated with either DMSO (veh) or 50 nM gilteritinib for 48 hr in RPMI or hBMSC-CM, followed by measurement of (A) apoptosis and (B) cell viability (n = 3).
Figure 1—figure supplement 2

Human bone marrow stromal cell (hBMSC-CM)-mediated protection does not coincide with alterations of the cell cycle.
MOLM-13 cells were treated with the indicated conditions (Veh: DMSO; Quiz: 3 nM quizartinib) for 12 hr, followed by propidium iodide (PI) staining and cell cycle analysis via flow cytometry.
Figure 1—figure supplement 3
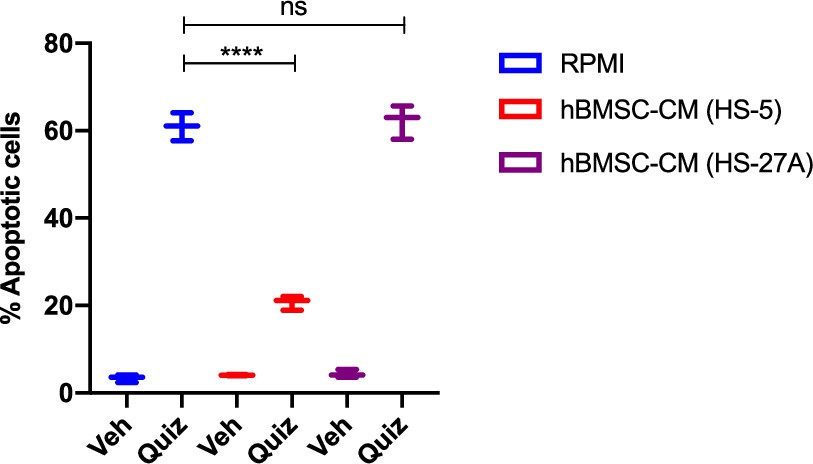
Human bone marrow stromal cell (hBMSC-CM) from HS-27A does not provide protection against apoptosis in FLT3-ITD acute myeloid leukemia (AML) cells following FLT3 inhibition.
MOLM-13 cells were treated with the indicated conditions using conditioned media from HS-5 cells or HS-27A cells for 48 hr, followed by measurement of apoptosis.
Figure 1—figure supplement 4

Human bone marrow stromal cell (hBMSC-CM)-mediated protection is partially mimicked by BM-enriched cytokines.
MOLM-13 cells were treated with either veh (V) or 3 nM quizartinib (Q) in the presence of RPMI, hBMSC-CM, and RPMI supplemented with 10 ng/mL IL-3 and/or 10 ng/mL GM-CSF, or 10 ng/mL FGF2 for 48 hr, followed by measurement of apoptosis.
Figure 2 with 3 supplements
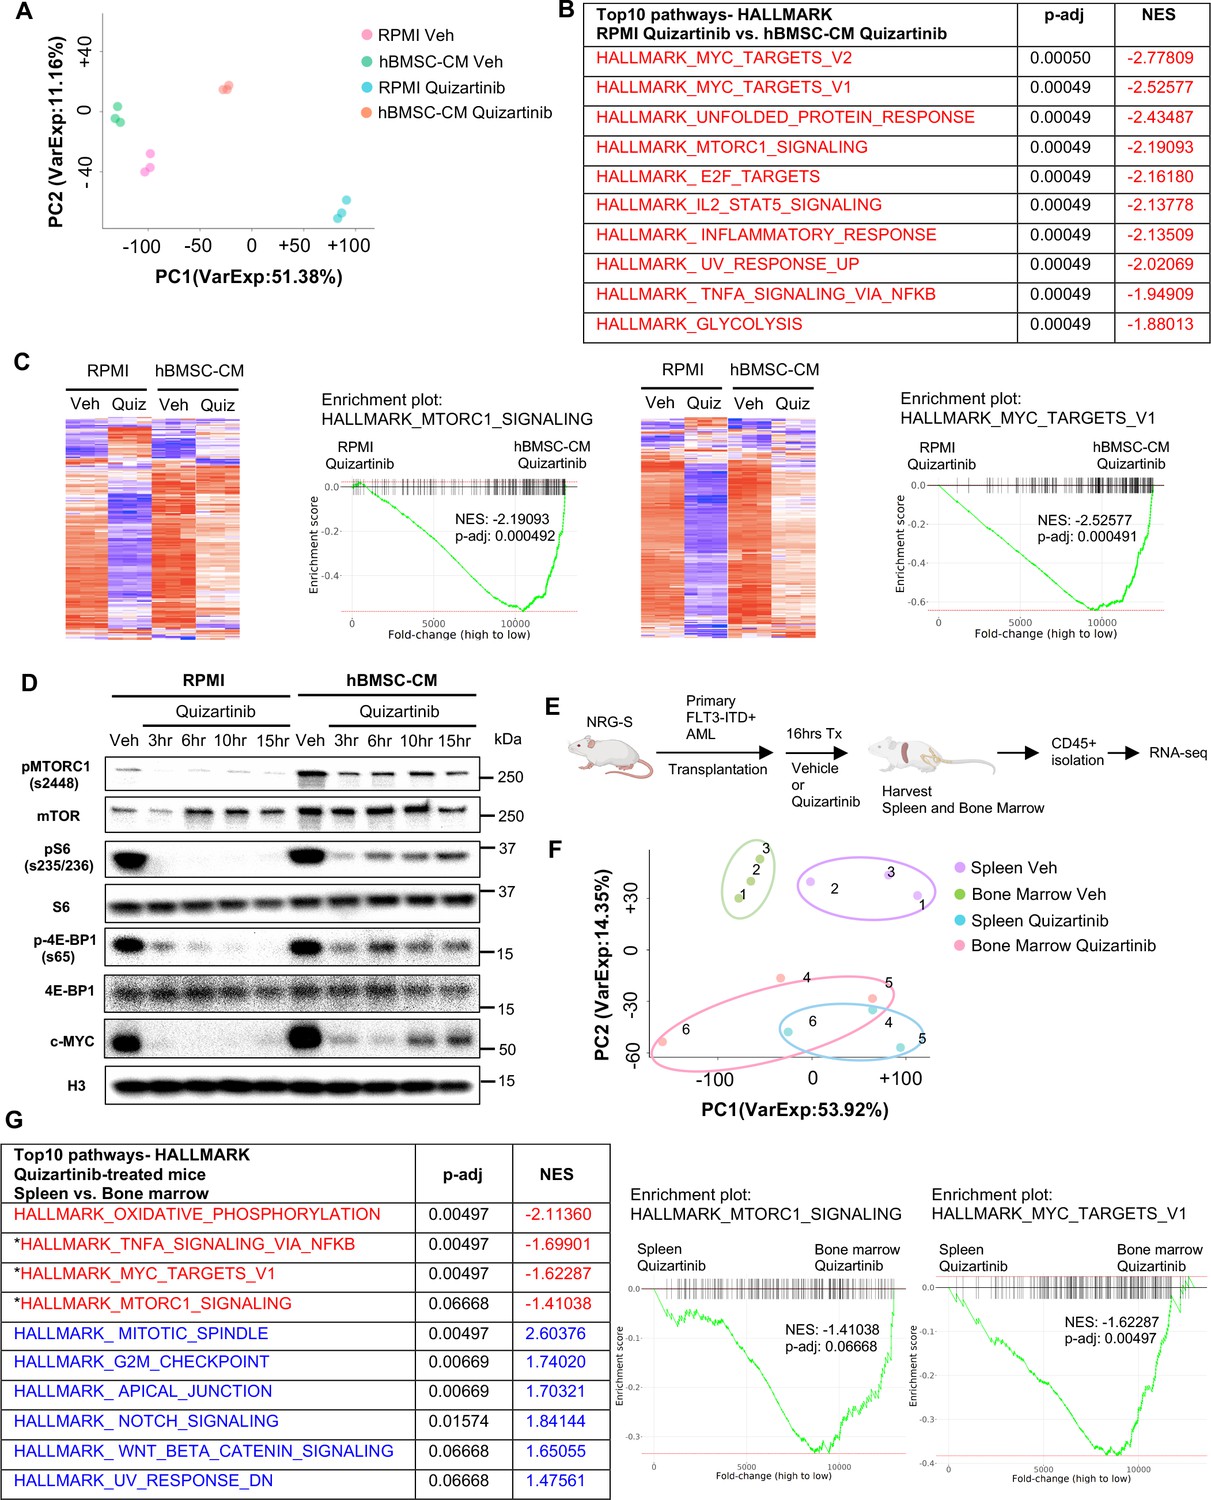
Bone marrow (BM) microenvironment substantially limits downregulation of mTOR and MYC pathway in FLT3-ITD acute myeloid leukemia (AML) cells upon FLT3 inhibition in vitro and in vivo.
(A–C) RNA from MOLM-13 cells was harvested after 15 hr of treatment with vehicle or 3 nM quizartinib in either RPMI or human bone marrow stromal cell (hBMSC-CM) and subjected to RNA-seq (n = 3). (A) Principal component analysis (PCA) plot of each group. (B) Top 10 enriched signaling pathways (by p-adj) from gene set enrichment analyses (GSEA) of Hallmark gene sets applied on RNA-seq data from quizartinib-treated cells in hBMSC-CM compared with quizartinib-treated cells in RPMI. Pathways with significant alteration (p-adj<0.1) and negative normalized enrichment score (NES) are represented with red. (C) Enrichment plots and heatmaps showing comparisons of transcriptomes of mTORC1 signaling or MYC targets between quizartinib (Quiz)-treated cells in hBMSC-CM and quizartinib-treated cells in RPMI. (D) MOLM-13 cells were treated as indicated and harvested at different time points (3, 6, 10, and 15 hr) to measure mTORC1 signaling and c-MYC protein levels by Western blotting. (E) Design of in vivo study using human AML xenograft mouse model. NRG-S mice were transplanted with primary FLT3-ITD+ AML cells (AML #1: from a 69-year-old female patient with newly diagnosed AML with FLT3-ITD and NPM1 mutations). One cohort of mice was treated with vehicle, while the other cohort was treated with 2.5 mg/kg quizartinib for 16 hr (n = 3). After spleen and BM were harvested, human AML cells were isolated by CD45 isolation kit and RNA from each sample were collected for RNA-seq. (F) PCA plot of RNA-seq data from human AML samples isolated from spleen and BM. Samples from the same mouse are denoted by the same number. (G) Top 10 enriched signaling pathways (by p-adj) from GSEA of Hallmark gene sets applied on RNA-seq data from human AML cells. Samples from the BM of quizartinib-treated mice were compared with the samples from the spleen of the same paired mouse, and top 10 pathways are shown on the left. Pathways with significant alteration (p-adj<0.1) are represented with colors (red: negative NES; blue: positive NES). Asterisks denote pathways that exhibited similarly significant enrichment patterns from in vitro study (B). Enrichment plots of mTORC1 signaling or MYC target genes are shown on the right.
-
Figure 2—source data 1
Unedited raw blots for Figure 2D are shown.
- https://cdn.elifesciences.org/articles/79940/elife-79940-fig2-data1-v2.zip
-
Figure 2—source data 2
Unedited blots with labels for Figure 2D are shown.
- https://cdn.elifesciences.org/articles/79940/elife-79940-fig2-data2-v2.zip
-
Figure 2—source data 3
Oxidative phosphorylation and G2/M checkpoint exhibited a higher enrichment in the bone marrow (BM) compared to spleen for both vehicle- and quizatinib-treated mice.
Top 10 enrichment pathways (by p-adj) from gene set enrichment analyses (GSEA) of Hallmark gene sets applied on RNA-seq data from human acute myeloid leukemia (AML) cells. Samples from the spleen of vehicle-treated mice were compared with the samples from the BM of the same paired mouse. Pathways with significant alteration (p-adj<0.1) are represented with colors (red: negative normalized enrichment score [NES]; blue: positive NES). Asterisks represent matched pathways with same enrichment patterns observed from GSEA of Hallmark gene sets comparing the spleen from quizartinib-treated mice with BM of the same paired mouse (Figure 2G).
- https://cdn.elifesciences.org/articles/79940/elife-79940-fig2-data3-v2.pdf
Figure 2—figure supplement 1
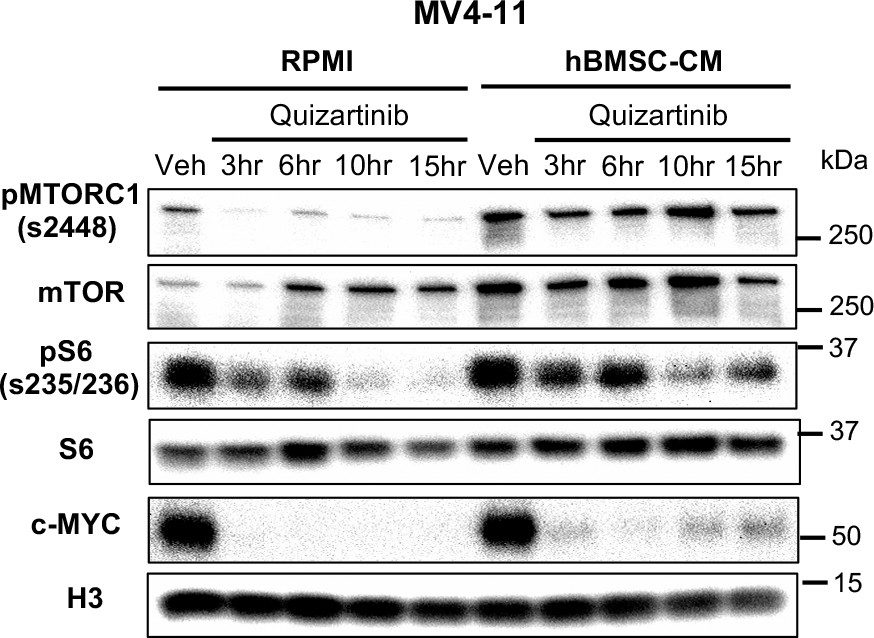
Human bone marrow stromal cell (hBMSC-CM) substantially limits downregulation of mTOR and MYC pathway in MV4-11 cells upon FLT3 inhibition.
MV4-11 cells were treated as indicated and harvested at different time points (3, 6, 10, and 15 hr) to measure mTORC1 signaling and c-MYC protein levels by Western blotting.
Figure 2—figure supplement 2
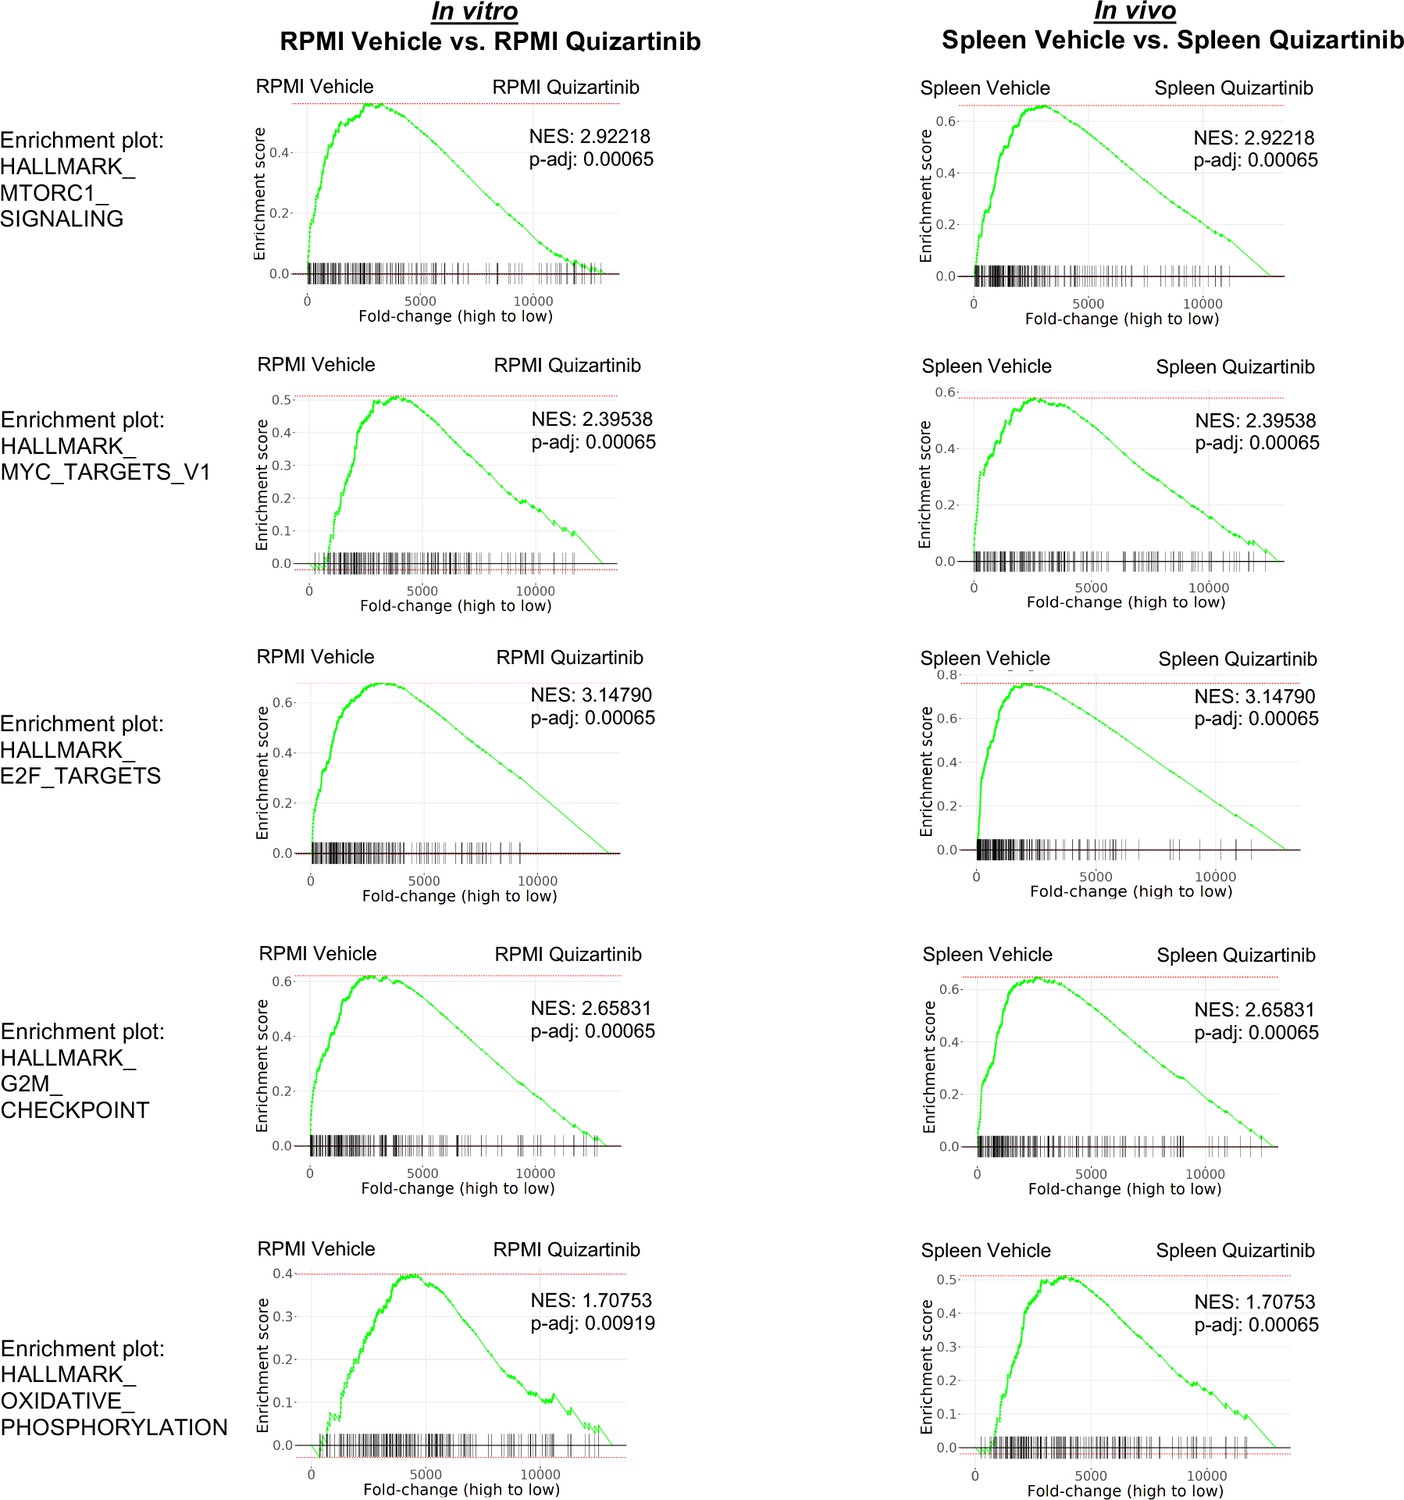
Similar pathways are altered in FLT3-ITD acute myeloid leukemia (AML) cells following FLT3 inhibition in vitro and in vivo in the absence of bone marrow (BM) microenvironment.
Gene set enrichment analyses (GSEA) of Hallmark gene sets was performed to determine the effect of FLT3 inhibition in the absence of BM microenvironment. In vitro: RNA-seq data from vehicle-treated MOLM-13 cells in RPMI was compared with those from quizartinib-treated MOLM-13 cells in RPMI. In vivo: RNA-seq data from samples from the spleen of vehicle-treated mice was compared with those from the spleen of quizartinib-treated mice. Enrichment plots of five most significant pathways from each type of study are shown.
-
Figure 2—figure supplement 2—source data 1
Unedited raw blots for Figure 2—figure supplement 2 are shown.
- https://cdn.elifesciences.org/articles/79940/elife-79940-fig2-figsupp2-data1-v2.zip
-
Figure 2—figure supplement 2—source data 2
Unedited blots with labels for Figure 2—figure supplement 2 are shown.
- https://cdn.elifesciences.org/articles/79940/elife-79940-fig2-figsupp2-data2-v2.zip
Figure 2—figure supplement 3
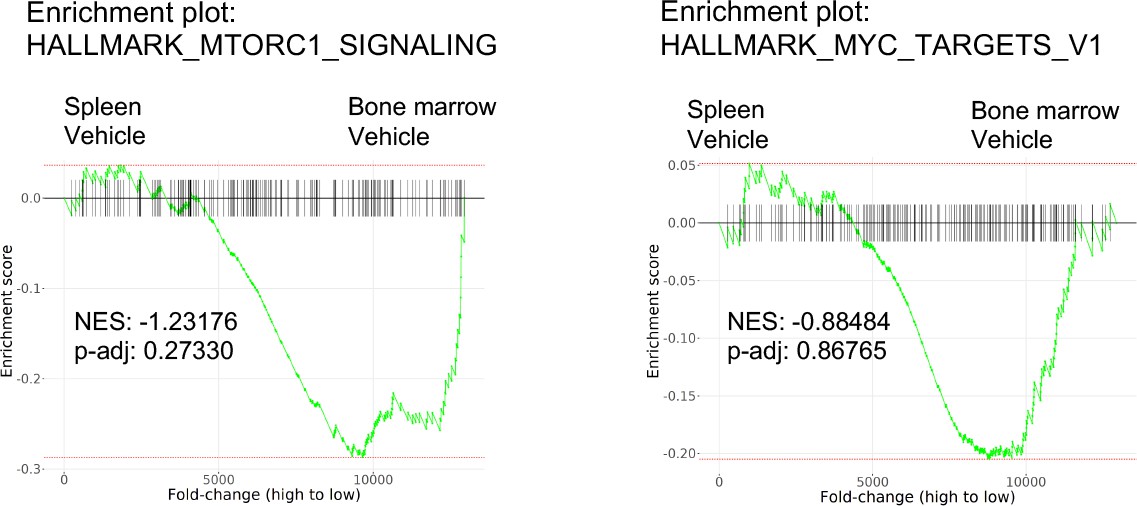
Higher expression of mTORC1 signaling and MYC target genes in the bone marrow (BM) is specific to the context of FLT3 inhibition.
Enrichment plots showing mTORC1 signaling or MYC targets in acute myeloid leukemia (AML) cells isolated from the spleen compared to those from the BM of vehicle-treated mice.
Figure 3 with 4 supplements
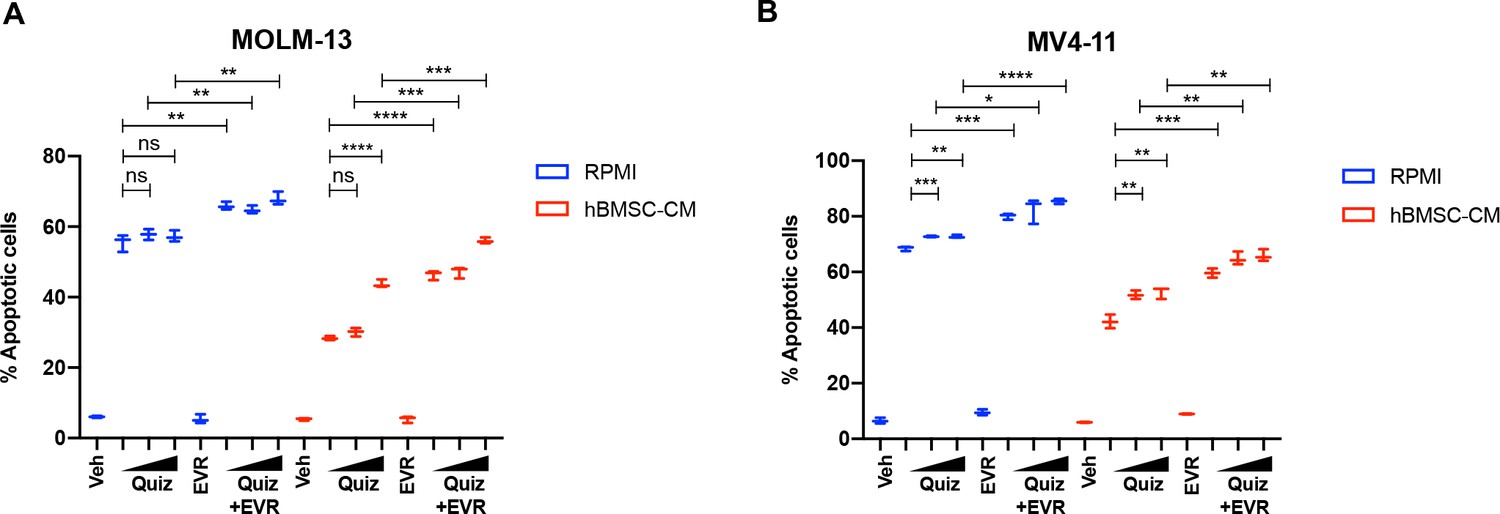
Targeting the mTOR pathway reverses the bone marrow (BM)-mediated protection of FLT3-ITD acute myeloid leukemia (AML) cells from FLT3 inhibition.
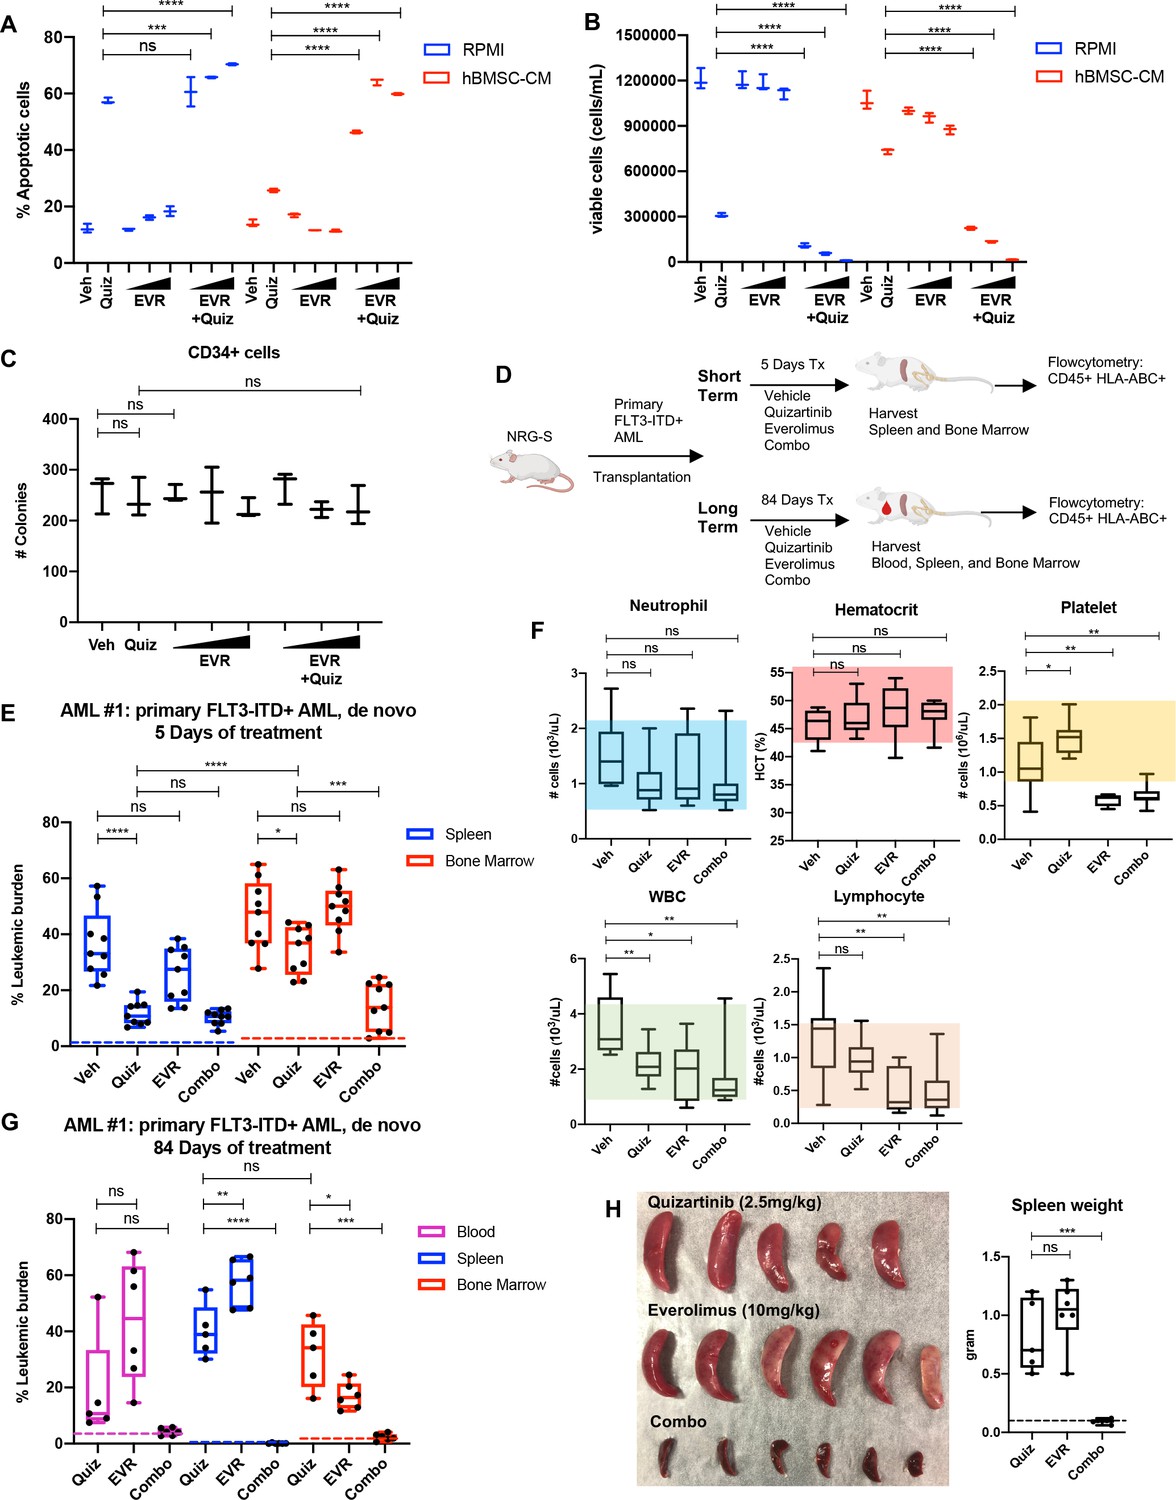
(A, B) MOLM-13 cells were treated with 3 nM quizartinib (Quiz) and everolimus (EVR) alone or together as indicated (increasing concentrations of everolimus of 5, 10, and 50 nM indicated by triangles) for 48 hr in RPMI or human bone marrow stromal cell (hBMSC-CM) (n = 3). (A) Apoptosis was measured post-treatment, and (B) cell viability was measured after 5 days of rebound growth post-treatment. (C) CD34+ cord blood cells from a healthy newborn were treated with 10 nM quizartinib and everolimus alone or together as indicated (increasing concentrations of everolimus of 10, 50, and 100 nM indicated by triangles) for 48 hr. 25,000 cells from each group were seeded in methylcellulose post-drug treatments. After 11 days, the number of colonies was counted (n = 3). (D) Schematic diagram of experimental design. NRG-S mice were transplanted with human primary FLT3-ITD+ AML (AML #1: a 69-year-old female patient who was newly diagnosed with AML with FLT3-ITD and NPM1 mutations). When leukemic burden reached 2–5% (~21–28 days after transplantation, determined by measuring CD45+ HLA-ABC+ cells in the blood), mice were divided into two groups. For short-term treatment, mice were treated with (1) vehicle, (2) 2.5 mg/kg quizartinib, (3) 10 mg/kg everolimus, and (4) combo for 5 days, daily p.o. (n = 9). For long-term treatment, mice were treated with the same regimen for 84 days, daily p.o. (n = 7–10). After treatment, leukemic burden was measured by quantifying HLA-ABC+ CD45+ cells via flow cytometry in spleen, BM, and blood (for long-term treatment only). (E) Plot showing leukemic burden of short-term treatment group; dotted line represents negative controls from non-transplanted mice. (F) Complete blood count (CBC) from blood samples of mice from long-term treatment group at day 5 of treatment is plotted. Colored boxes represent reference values (neutrophil: 0.54–2.15 × 10³ cells/µL, hematocrit: 44.1–57.2%, platelet: 0.914–2.055 × 10³ cells/µL, WBC: 0.94–4.12 × 10³ cells/µL, lymphocyte: 0.26–1.56 × 10³ cells/µL). (G) Plot showing leukemic burden of long-term treatment group, dotted line represents negative controls from nontransplanted mice. (H) Photograph of spleens from long-term treatment group on the day of harvest. Spleen weight from each group (dotted line represents average spleen weight from healthy untreated mice) is shown plotted on the right.
Figure 3—figure supplement 1
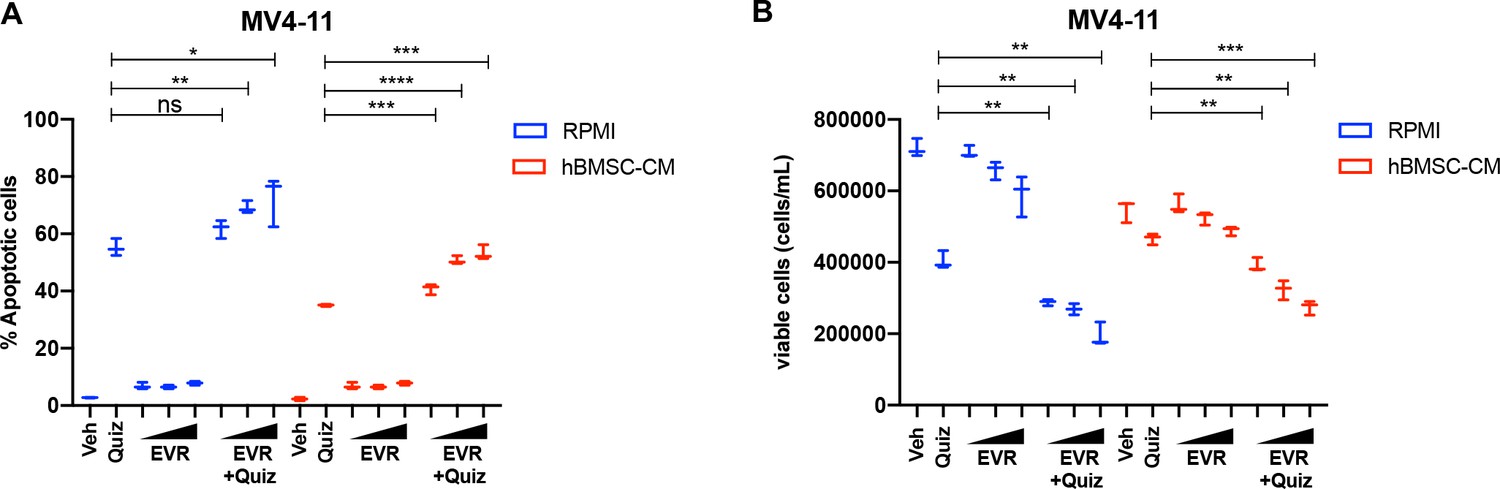
Combinatorial treatment of quizartinib with everolimus demonstrates significantly better cell-killing effects in MV4-11 cells.
(A, B) MV4-11 cells were treated with 2 nM quizartinib (Quiz) and everolimus (EVR) alone or together as indicated (increasing concentrations of everolimus of 5, 10, and 50 nM indicated by triangles) for 48 hr in RPMI or human bone marrow stromal cell (hBMSC-CM) (n = 3), followed by measurement apoptosis (A) and cell viability (B) as previously described.
Figure 3—figure supplement 2
Combinatorial treatment of everolimus with a range of quizartinib concentrations demonstrated significantly greater elimination than quizartinib alone in both regular media RPMI and human bone marrow stromal cell (hBMSC-CM).
(A) MOLM-13 cells were treated with quizartinib (Quiz) and 10 nM everolimus (EVR) alone or together as indicated (increasing concentrations of quizartinib of 3, 10, and 50 nM indicated by triangles) for 48 hr in RPMI or hBMSC-CM (n = 3), followed by measurement apoptosis. (B) MV4-11 cells were treated with quizartinib (Quiz) and 10 nM everolimus (EVR) alone or together as indicated (increasing concentrations of quizartinib of 2, 10, and 50 nM indicated by triangles) for 48 hr in RPMI or hBMSC-CM (n = 3), followed by measurement apoptosis.
Figure 3—figure supplement 3
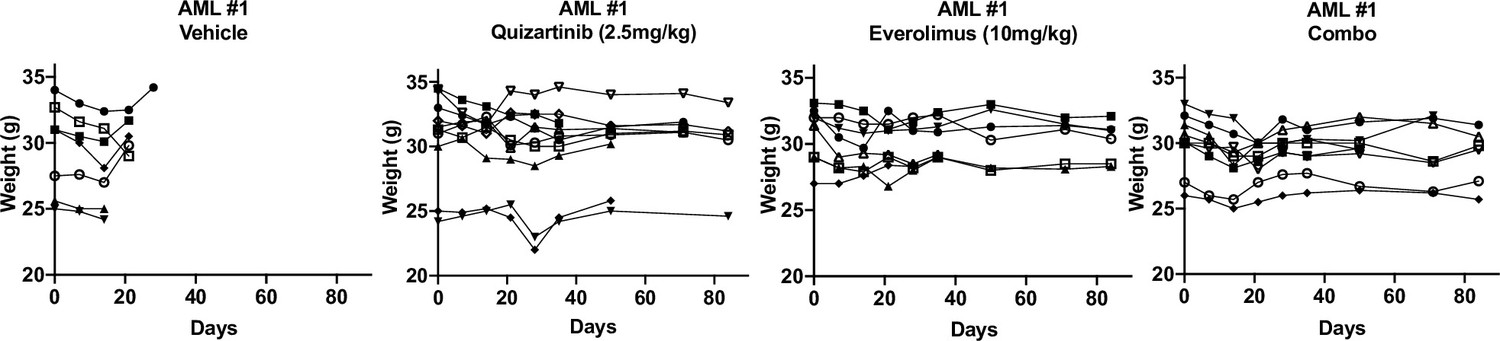
Combinatorial treatment of quizartinib with everolimus does not exhibit reductions in weight.
Mice weight from each group of long-term treatment of primary acute myeloid leukemia (AML) #1 was measured weekly.
Figure 3—figure supplement 4

Combinatorial treatment of quizartinib with everolimus demonstrates significantly better cell-killing effects in xenograft mouse model utilizing the primary acute myeloid leukemia (AML) from a relapse patient.
(A, B) NRG-S mice were transplanted with human primary FLT3-ITD+ AML (AML #2: a 37-year-old female patient who developed relapse after chemotherapy). When leukemic burden reached 2–5% (~4 months after transplantation, determined by measuring CD45+ HLA-ABC+ cells in the blood), mice were treated with (1) vehicle (Veh), (2) 5 mg/kg quizartinib (Quiz), (3) 10 mg/kg everolimus (EVR), (4) combo for 21 days, daily p.o. (Veh: n = 4; Quiz: n = 6; EVR: n = 5; Combo: n = 6). After treatment, leukemic burden was measured by quantifying HLA-ABC+ CD45+ cells via flow cytometry in spleen, bone marrow (BM), and blood. Dotted line represents negative controls from non-transplanted mice. (A) Plot showing leukemic burden of each treatment group; dotted line represents negative controls from nontransplanted mice. (B) Mice weight from each group of treatment of primary AML #2 was measured weekly.
Figure 4 with 3 supplements
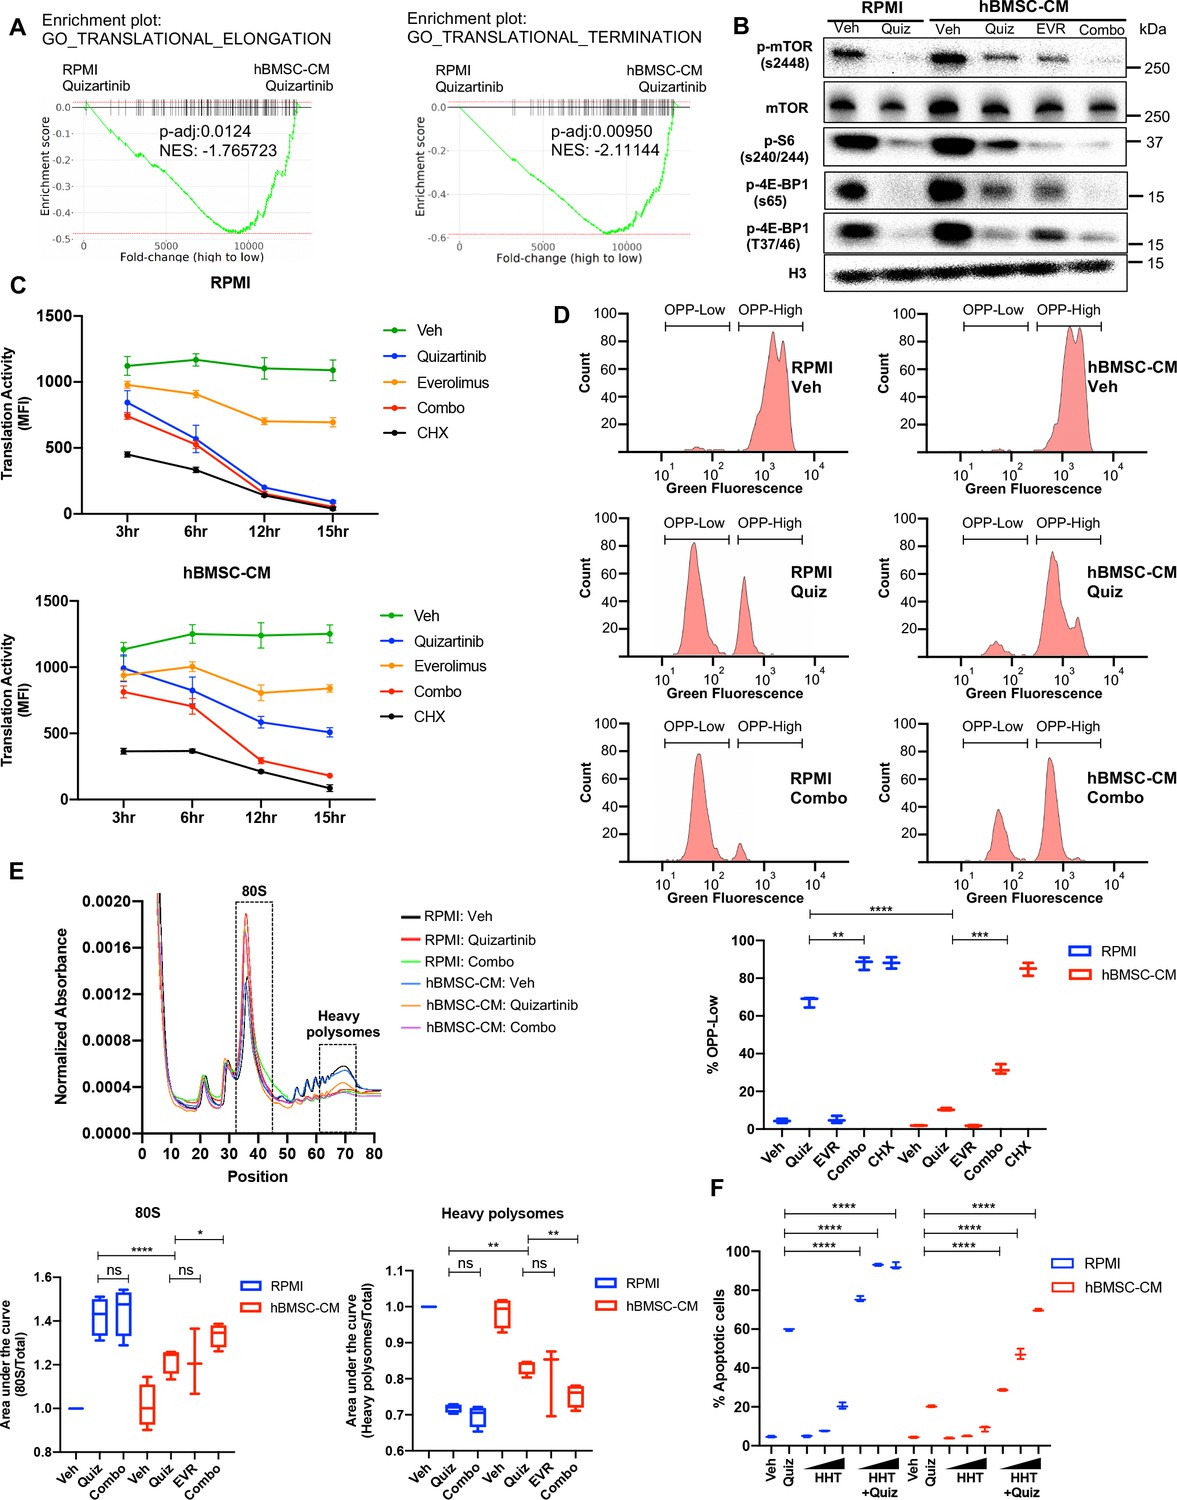
Suppression of protein translation upon FLT3 inhibition is significantly alleviated by human bone marrow stromal cell (hBMSC-CM) via an mTOR-dependent mechanism.
(A) Gene set enrichment analyses (GSEA) of Gene Ontology gene sets from in vitro study (Figure 2A–C) showing enrichment of translational control in acute myeloid leukemia (AML) cells treated with quizartinib in hBMSC-CM, compared with quizartinib-treated cells in RPMI. (B) MOLM-13 cells were treated with vehicle, 3 nM quizartinib, 10 nM everolimus, or quizartinib + everolimus (combo) in RPMI or hBMSC-CM for 15 hr and harvested for Western blotting to measure mTOR signaling and its downstream mediators involved in translational control. (C) MOLM-13 cells were treated with the indicated drugs at different time points (3, 6, 12, and 15 hr), followed by labeling with O-propargyl-puromycin (OPP), to measure translation activity using flow cytometry (MFI: mean fluorescence intensity for OPP incorporation). Cells were treated with 10 ug/mL cycloheximide (CHX) as a control for inhibition of translation (n = 3). (D) Representative flow cytometry histograms of OPP assay from cells treated with vehicle, quizartinib, and combo in RPMI or hBMSC-CM for 15 hr, showing binary peaks (OPP-High and OPP-Low). Percent of OPP-Low population from all treatment groups is shown at the bottom. (E) MOLM-13 cells were treated with the indicated drugs for 12 hr and harvested for polysome profiling. Area under the curve for each treatment was normalized to the vehicle-treated group in RPMI and is shown for 80S peak fraction (position 33–44) and heavy polysome fraction (position 62–73) at the bottom (n = 3 for everolimus-treated cells in hBMSC-CM, n = 4 for all other groups). (F) MOLM-13 cells were treated with 3 nM quizartinib and homoharringtonine (HHT) alone or together as indicated (increasing concentrations of HHT of 1, 5, and 10 nM indicated by triangles) for 48 hr in RPMI or hBMSC-CM, followed by measurement of apoptosis (n = 3).
-
Figure 4—source data 1
Unedited raw blots for Figure 4B are shown.
- https://cdn.elifesciences.org/articles/79940/elife-79940-fig4-data1-v2.zip
-
Figure 4—source data 2
Unedited blots with labels for Figure 4B are shown.
- https://cdn.elifesciences.org/articles/79940/elife-79940-fig4-data2-v2.zip
Figure 4—figure supplement 1
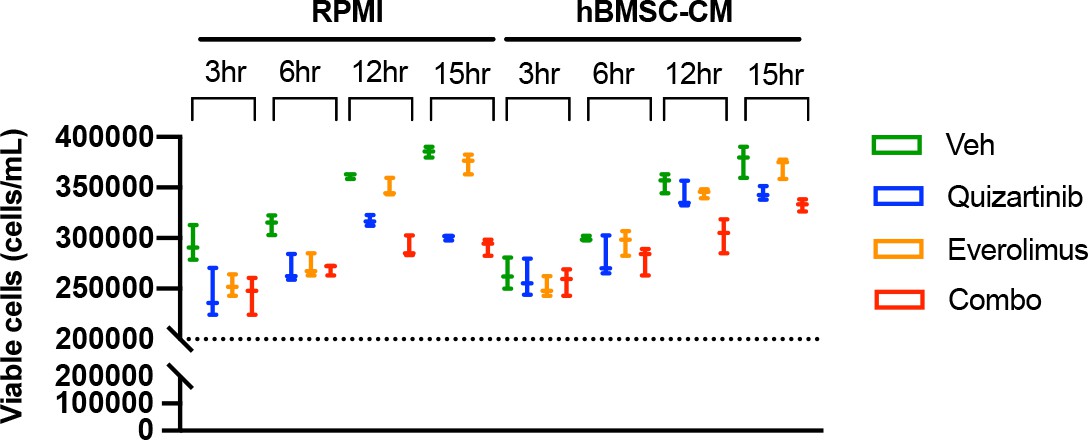
FLT3-ITD acute myeloid leukemia (AML) cells demonstrate shift of O-propargyl-puromycin (OPP)-labeled peaks over the course of drug treatments without showing signs of cell death.
Cell viability was measured at each time condition prior to OPP assay of MOLM-13 cells. Cell density at the start of treatment (2 × 10⁵ cells/mL) is represented as a dotted line.
Figure 4—figure supplement 2
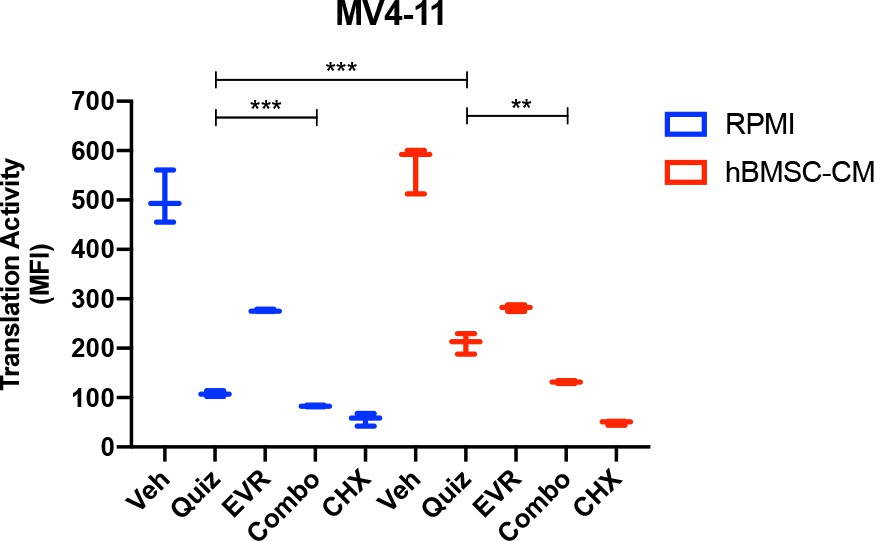
Suppression of protein translation upon FLT3 inhibition is significantly alleviated by human bone marrow stromal cell (hBMSC-CM) via an mTOR-dependent mechanism in MV4-11 cells.
MV4-11 cells were treated with 2 nM quizartinib (Quiz) and/or 10 nM everolimus (EVR) for 15 hr in fractionated RPMI or hBMSC-CM, followed by labeling with O-propargyl-puromycin (OPP), to measure translation activity using flow cytometry. Cells were treated with 10 ug/mL cycloheximide (CHX) as a control for inhibition of translation (n = 3).
Figure 4—figure supplement 3
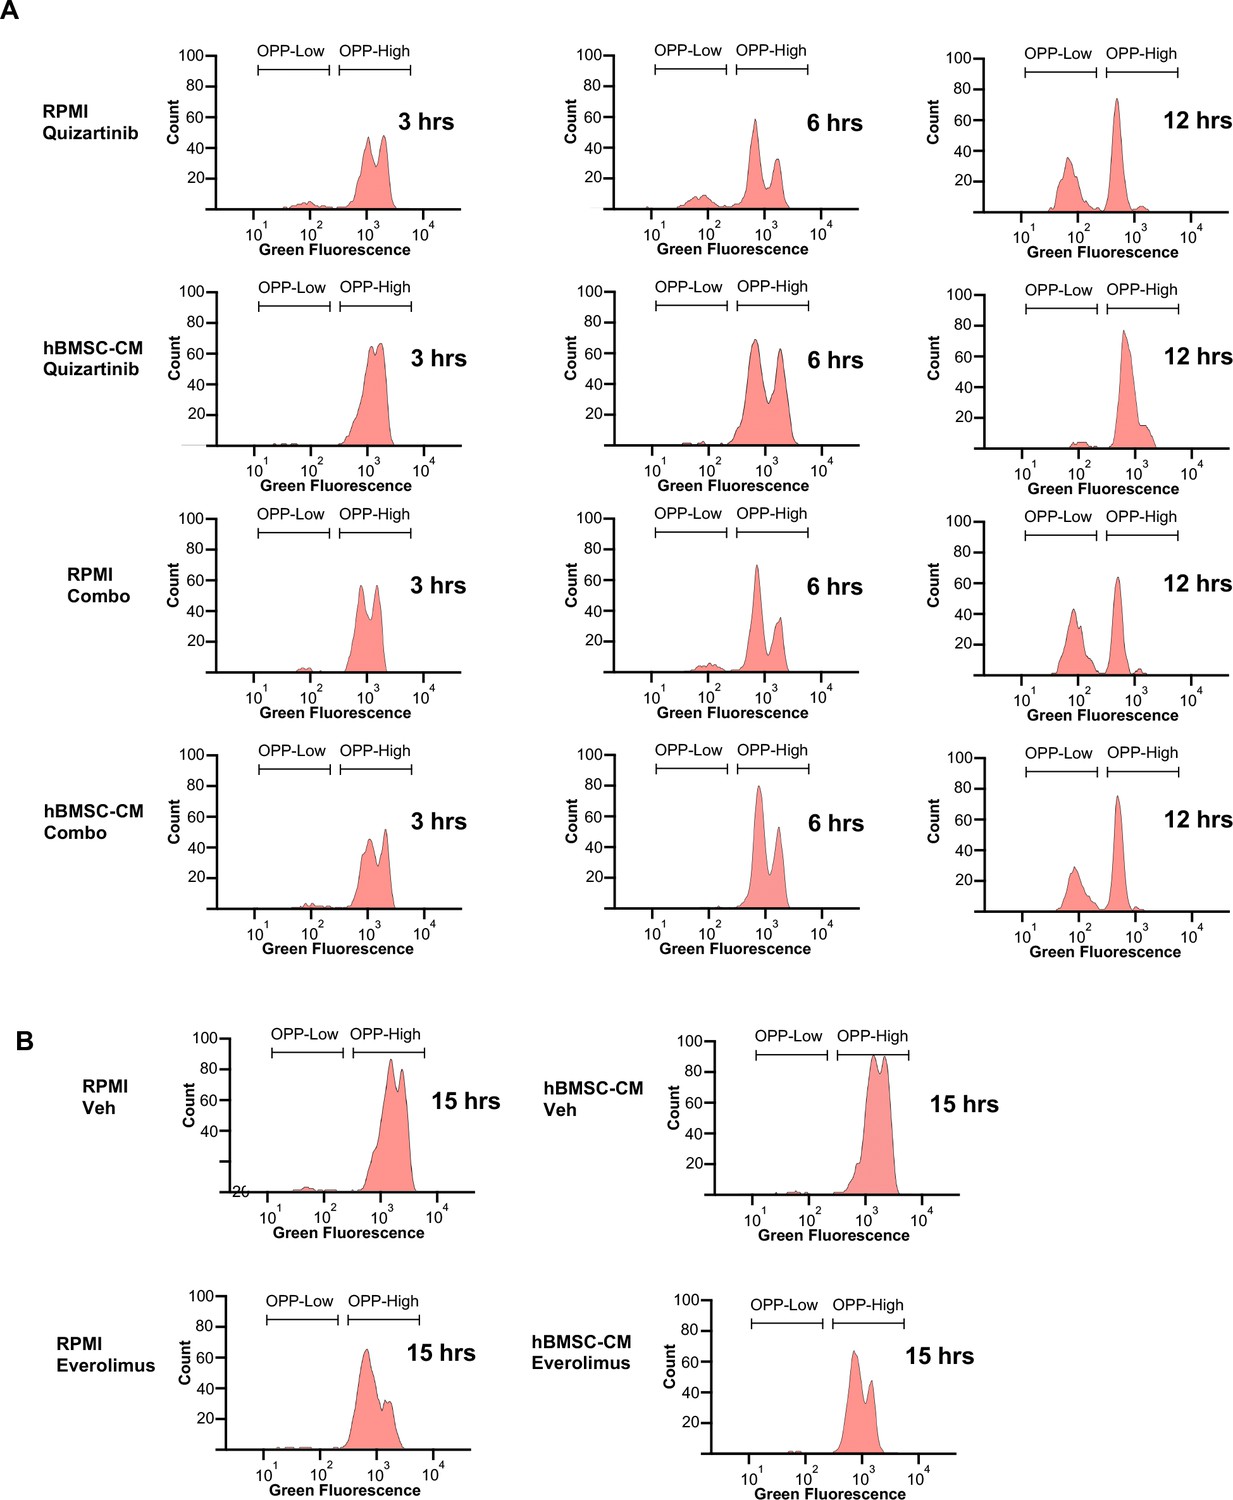
Leftward peak shift in OPPhigh cells and accumulation of OPPlow cells occur over the course of drug treatment.
(A, B) Representative flow cytometry histograms of the O-propargyl-puromycin (OPP) assay from (A) cells treated with quizartinib or quizartinib/everolimus combo for shorter time points (3, 6, and 12 hr) either in RPMI or human bone marrow stromal cell (hBMSC-CM) and (B) cells treated with vehicle or everolimus only for 15 hr either in RPMI or hBMSC-CM.
Figure 5 with 1 supplement
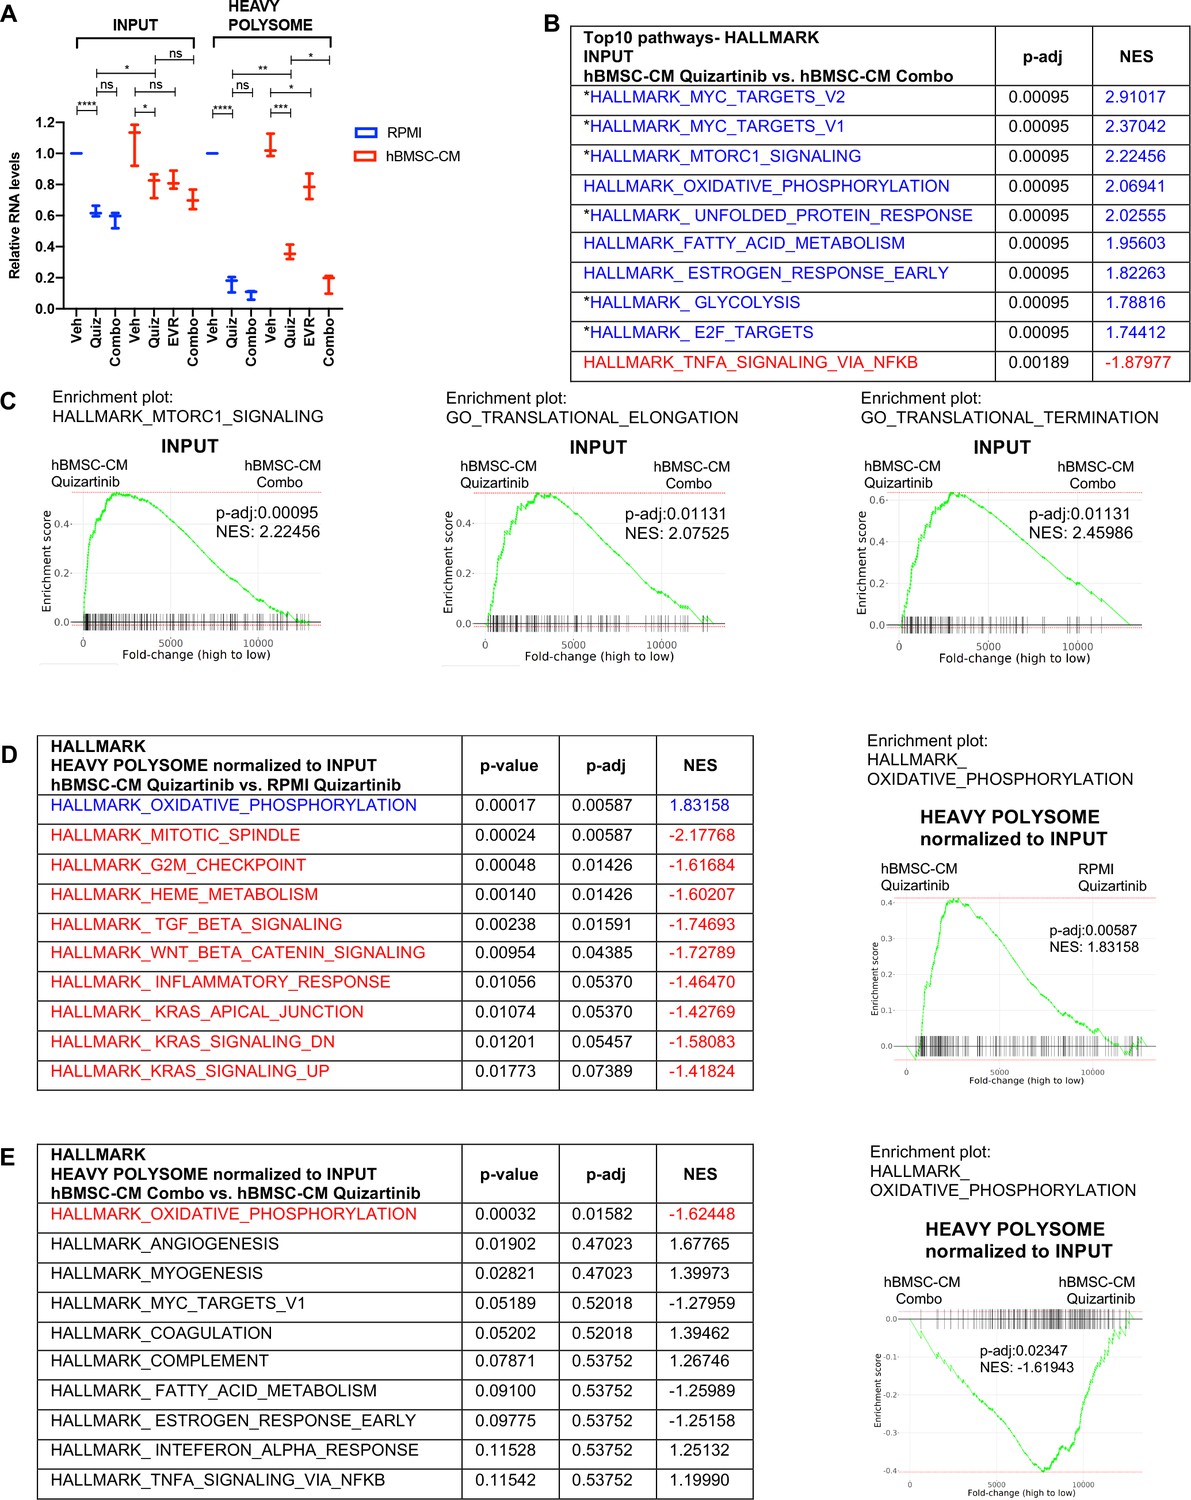
Polysome enrichment of transcripts by human bone marrow stromal cell (hBMSC-CM) following FLT3 inhibition is highly selective for oxidative phosphorylation mRNAs and is mTOR-dependent.
(A) RNA yields from whole-cell lysates (input) and heavy polysome fractions (Figure 4E) were measured and normalized to vehicle-treated group in RPMI for each biological replicate. (B, C) Gene set enrichment analyses (GSEA) of Hallmark and Gene Ontology gene sets was performed on RNA-seq data from input samples. Quizartinib-treated cells in hBMSC-CM were compared with combo-treated cells in hBMSC-CM. (B) Top 10 enriched signaling pathways from GSEA of Hallmark gene sets with significant alterations (p-adj<0.1) represented with colors (red: negative normalized enrichment score [NES]; blue: positive NES). Asterisks denote pathways that exhibited partial restoration following quizartinib treatment in hBMSC-CM compared to those in RPMI (Figure 2B). (C) Enrichment plots of mTOR signaling, translational elongation, and translational termination are shown. (D, E) Top 10 enriched signaling pathways (by p-adj) from GSEA of Hallmark gene sets for RNA-seq data from human acute myeloid leukemia (AML) cells from heavy polysome-associated mRNAs normalized to input. Pathways with significant alteration (p-adj<0.1) are represented with colors (red: negative NES; blue: positive NES). Analyses were done by comparing (D) cells treated with quizartinib in hBMSC-CM with those in RPMI or (E) cells treated with combo in hBMSC-CM with those treated with quizartinib alone in hBMSC-CM. Enrichment plots of oxidative phosphorylation pathway for each comparison are shown on the right.
Figure 5—figure supplement 1
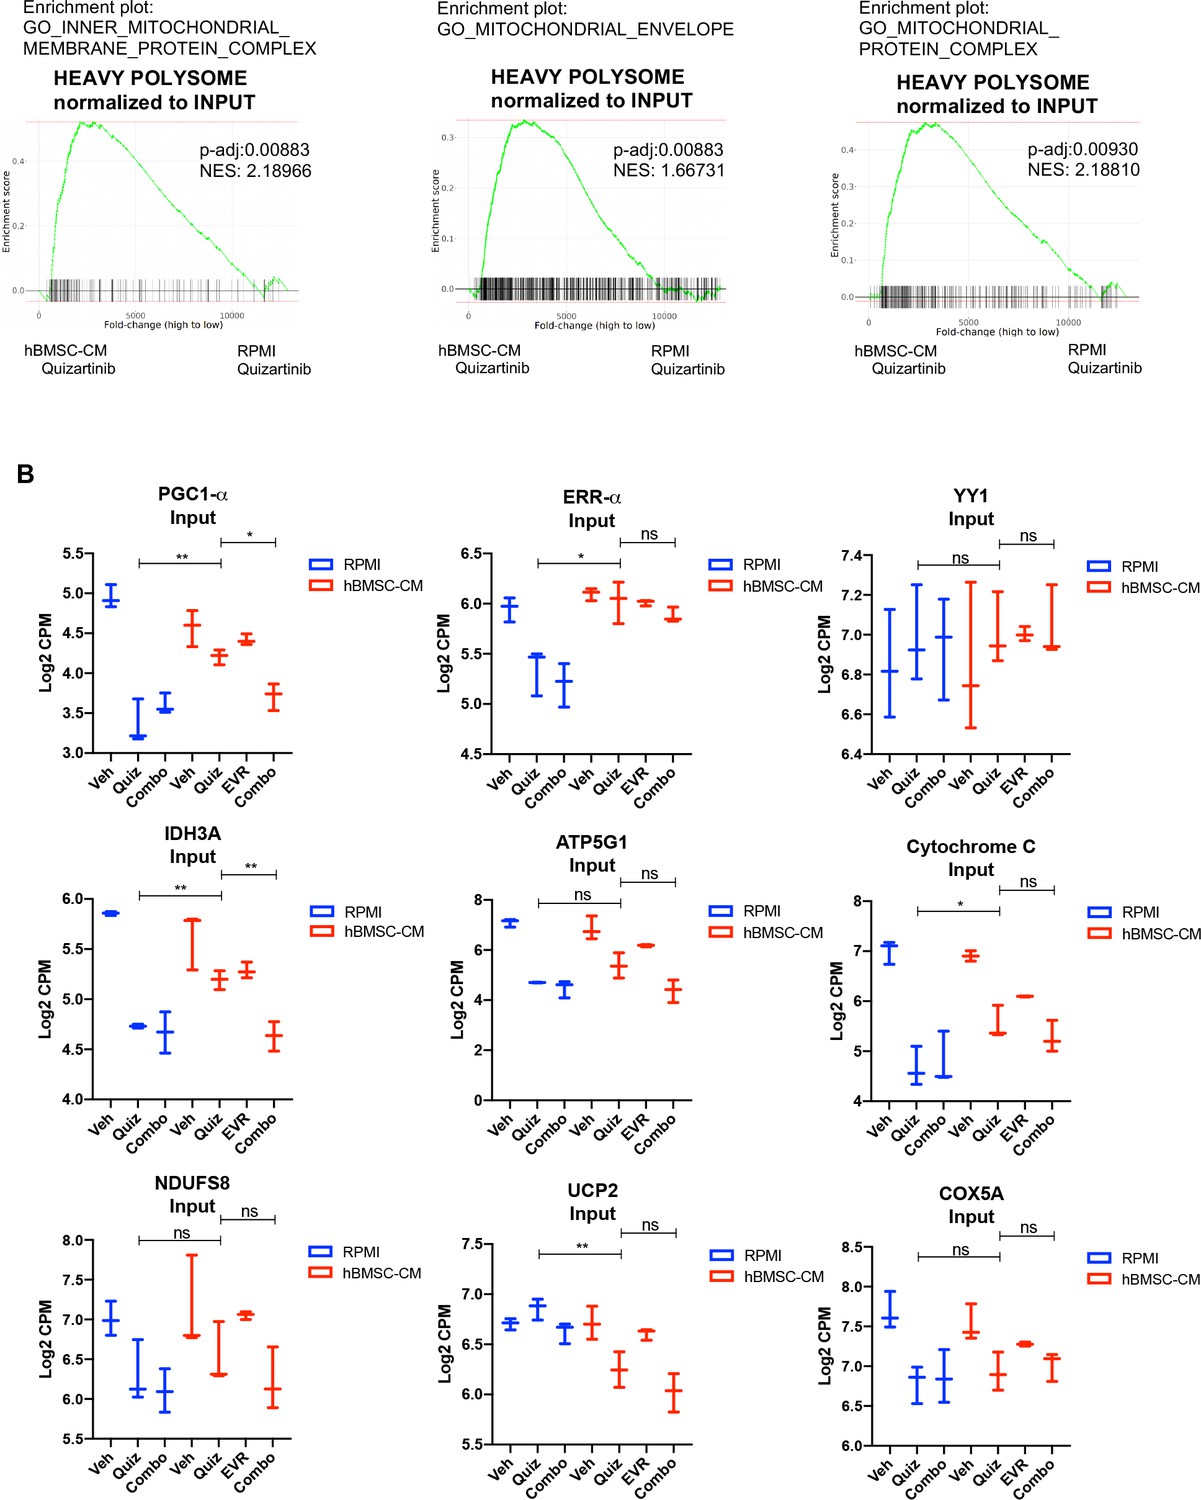
Transcripts associated with mitochondrial integrity are enriched in polysomes of FLT3-ITD acute myeloid leukemia (AML) cells in human bone marrow stromal cell (hBMSC-CM) upon FLT3 inhibition.
Gene set enrichment analyses (GSEA) of Gene Ontology gene sets applied on RNA-seq data from human AML cells from heavy polysome-associated mRNAs normalized to input. Pathways associated with mitochondrial integrity are shown.
Figure 6 with 1 supplement
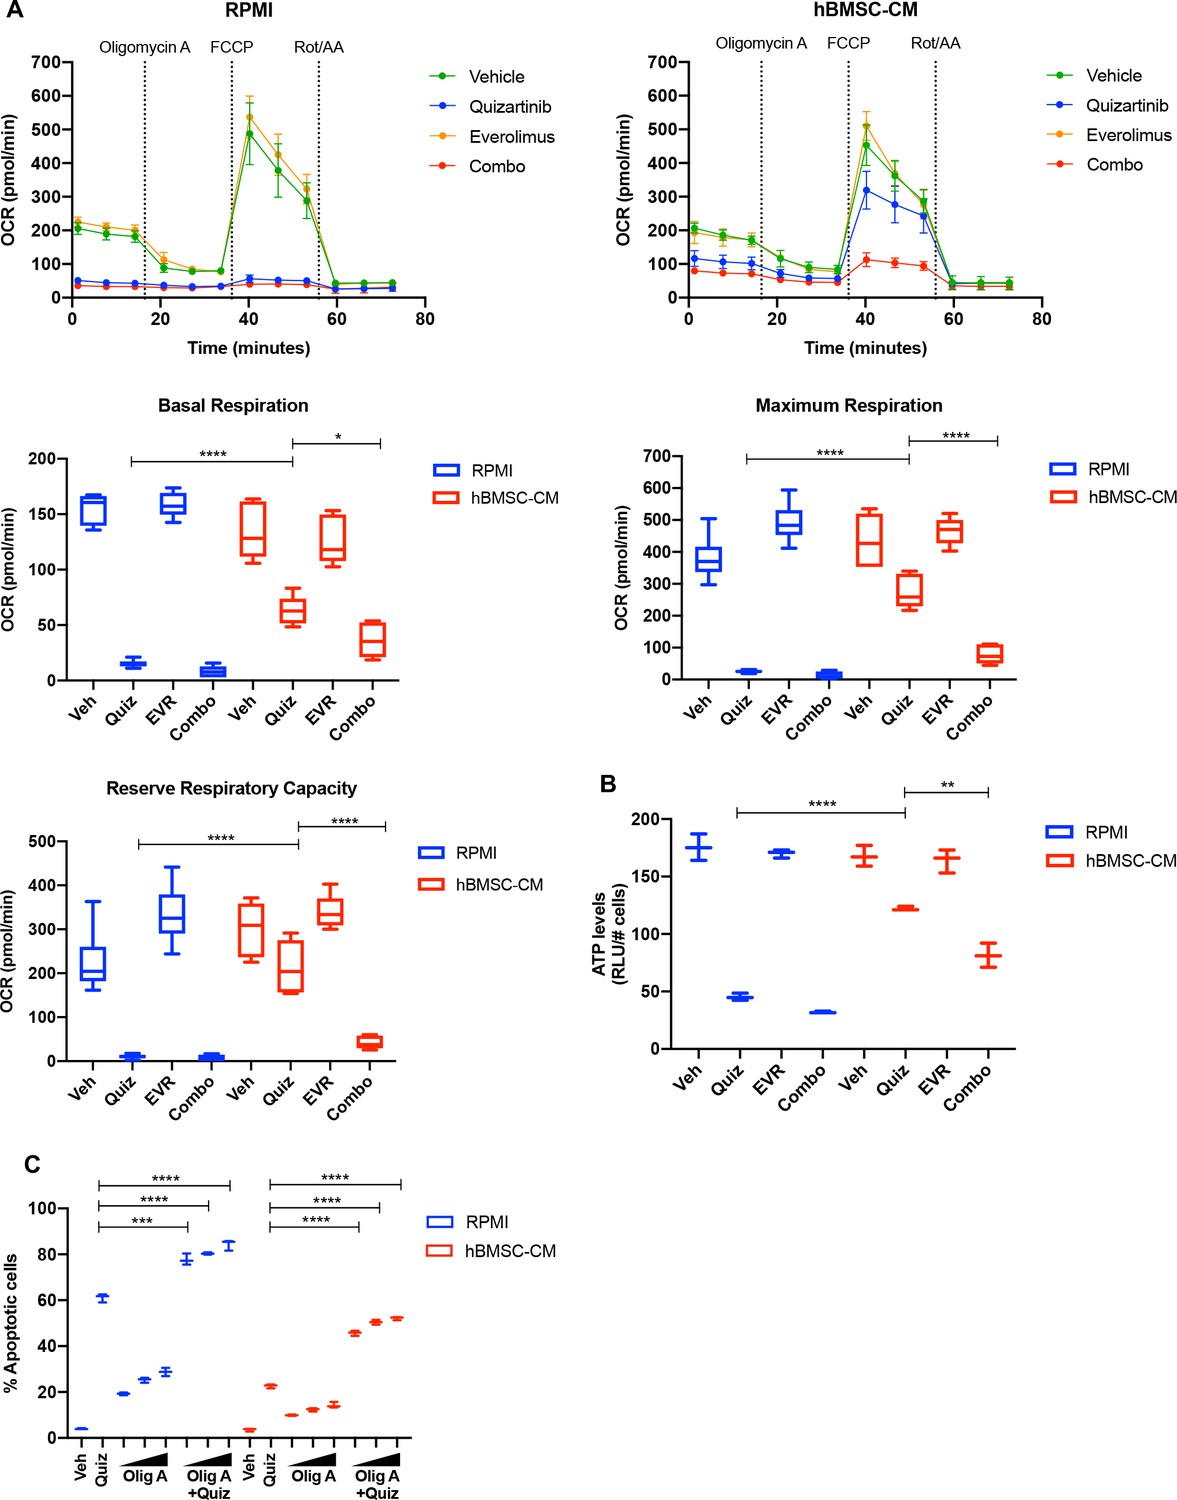
mTOR-dependent oxidative phosphorylation is a key survival mechanism of human bone marrow stromal cell (hBMSC-CM)-mediated protection from FLT3 inhibition.
(A) MOLM-13 cells were treated with indicated drugs for 15 hr, followed by measurement of oxygen consumption rate (OCR) by Seahorse XF Cell Mito Stress Test (n = 5). Basal respiration, maximum respiration, and reserve respiratory capacity are shown at the bottom. (B) MOLM-13 cells were treated with indicated drugs for 15 hr, followed by luminescence-based ATP assays (normalizing relative light units [RLU] to cell number). (C) MOLM-13 cells were treated with 3 nM quizartinib and oligomycin A (Olig A) alone or together as indicated (increasing concentrations of Olig A of 1, 2, and 4 nM indicated by triangles) for 48 hr in RPMI or hBMSC-CM, followed by measurement of apoptosis (n = 3).
Figure 6—figure supplement 1
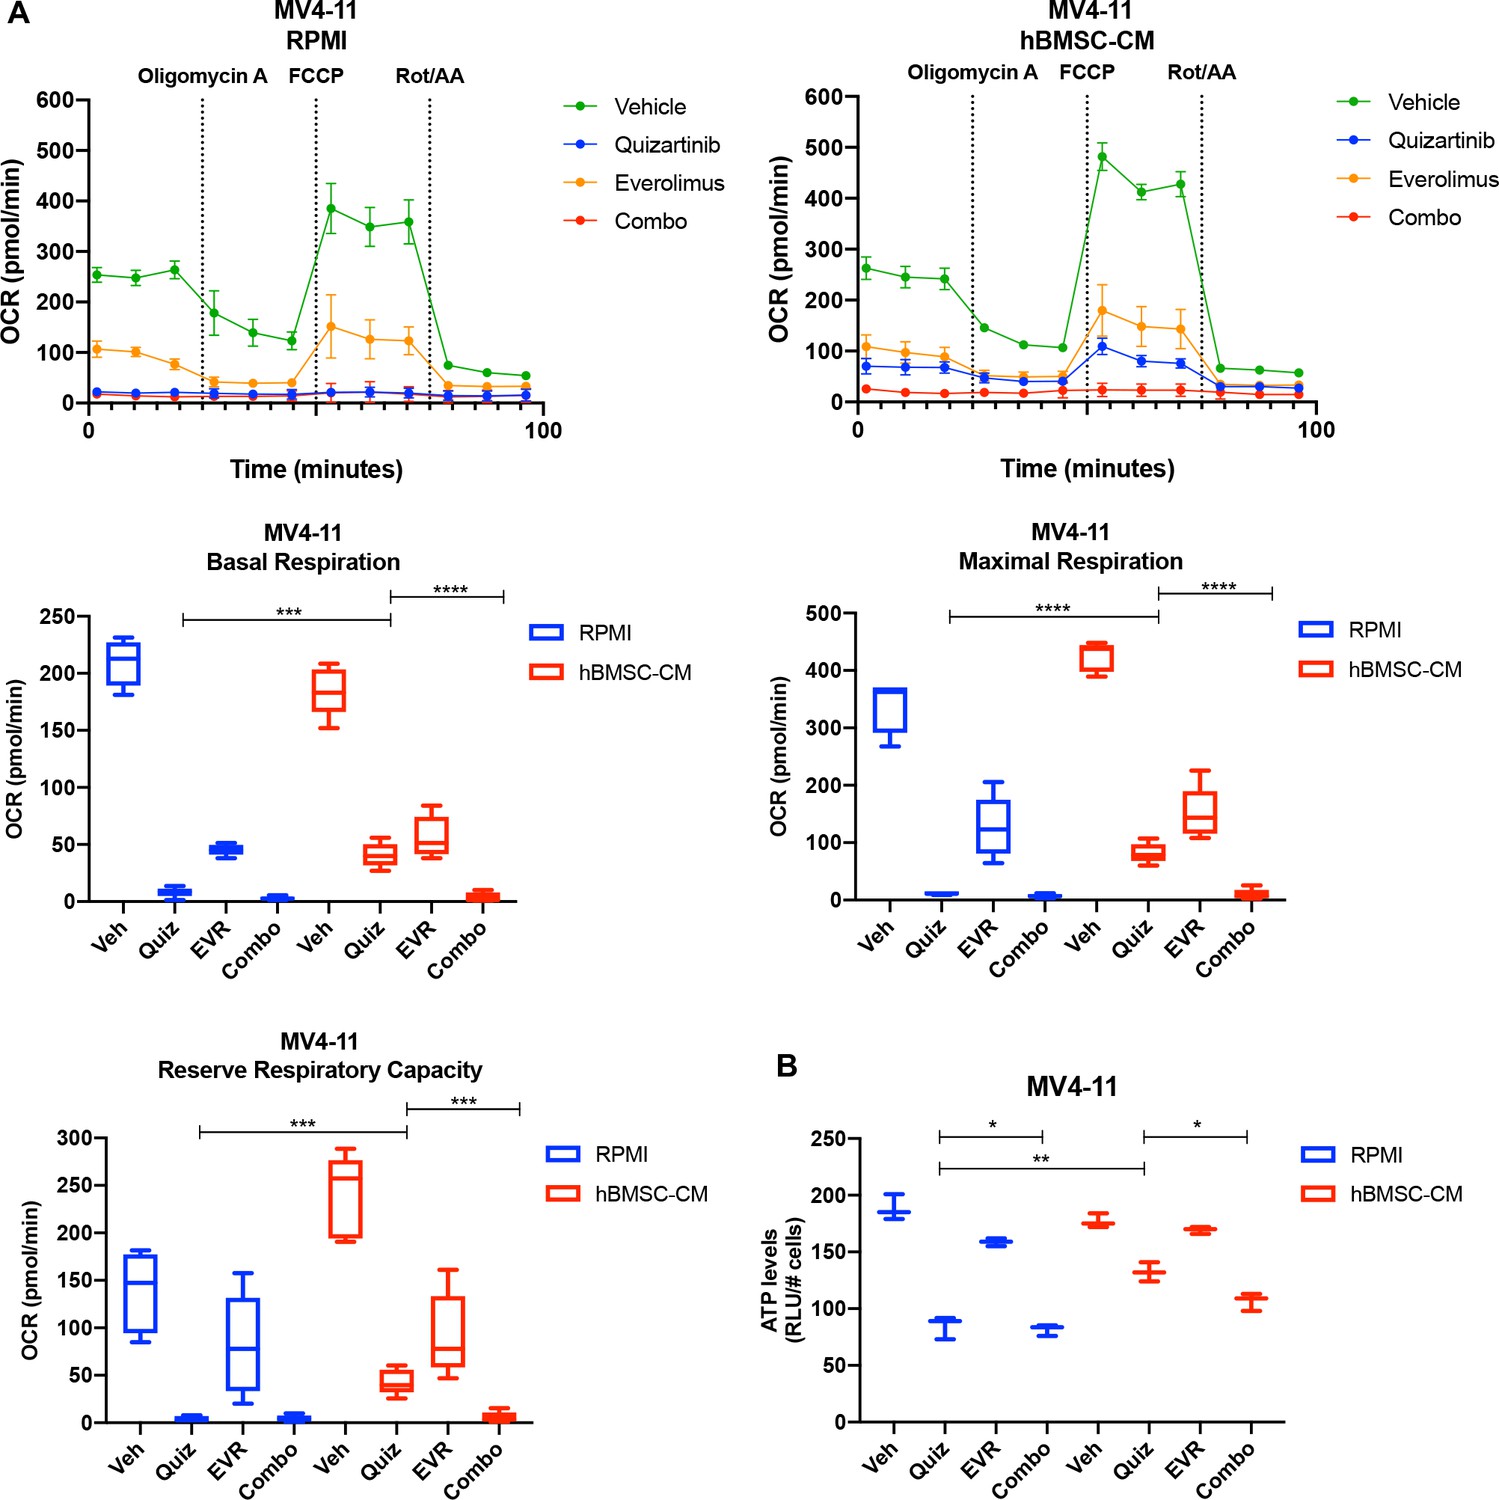
Human bone marrow stromal cell (hBMSC-CM)-mediated partial restoration of oxidative phosphorylation is mTOR-dependent in MV4-11 cells.
MV4-11 cells were treated with the indicated conditions for 15 hr, followed by measurement of oxygen consumption rate (OCR) by Seahorse XF Cell Mito Stress Test (n = 5). Basal respiration, maximum respiration, and reserve respiratory capacity are graphed. (B) MV4-11 cells were treated with the indicated conditions for 15 hr, followed by luminescence-based ATP assays (normalizing relative light units [RLU] to cell number) (n = 3).
Figure 7 with 8 supplements

ATM mediates the protection from FLT3 inhibition by human bone marrow stromal cell (hBMSC-CM) upstream of mTOR signaling and oxidative phosphorylation.
(A) MOLM-13 cells were treated with vehicle, 3 nM quizartinib, 10 nM everolimus, and combo in RPMI or hBMSC-CM for 15 hr and harvested to determine the levels of total and phosphorylated ATM by Western blotting. (B) MOLM-13 cells were transduced with lentiviruses-expressing shRNAs (shNT: nontargeting shRNA; or shATM: ATM-targeting shRNA). Cells were treated with either vehicle or 3 nM quizartinib (Quiz) for 48 hr in RPMI or hBMSC-CM, followed by measurement of apoptosis (n = 3). (C) MOLM-13 cells expressing shNT or shATM were treated with the indicated conditions for 15 hr and harvested for Western blot analyses. (D) MOLM-13 cells expressing shNT or shATM were treated with the indicated conditions for 15 hr, followed by measurement of oxygen consumption rate (OCR) by Seahorse XF Cell Mito Stress Test (n = 4). (E) Model of ATM and mTOR-dependent survival of FLT3-ITD acute myeloid leukemia (AML) cells following FLT3 inhibition in BM microenvironment. In the absence of BM stroma, FLT3-ITD AML cells undergo apoptosis upon FLT3 inhibition as a result of downregulation of ATM and mTOR complex 1 (mTORC1) activity (left). In the presence of BM stroma, on the other hand, FLT3-ITD AML cells are protected from cell-killing effects by FLT3 inhibition (right). As indicated by orange arrows, the BM stroma-mediated protection is driven by ATM through regulation of mTOR protein levels, as well as mTORC1 activity via AKT, subsequently leading to partial restoration of translation. Restored mTORC1 activity selectively drives translation of oxidative phosphorylation mRNAs that promote cell survival even in the presence of FLT3 inhibition. The BM stroma-mediated protection against apoptosis upon FLT3 inhibition is reversed with combinatorial treatment with everolimus, which inhibits mTOR signaling and downstream processes including polysome enrichment and selective translation of oxidative phosphorylation mRNAs, and oxidative phosphorylation. Effects of drugs that target FLT3 (quizartinib) or mTOR (everolimus) are represented with red or blue, respectively, arrows and Xs.
-
Figure 7—source data 1
Unedited raw blots for Figure 7A are shown.
- https://cdn.elifesciences.org/articles/79940/elife-79940-fig7-data1-v2.zip
-
Figure 7—source data 2
Unedited blots with labels for Figure 7A are shown.
- https://cdn.elifesciences.org/articles/79940/elife-79940-fig7-data2-v2.zip
-
Figure 7—source data 3
Unedited raw blots for Figure 7C are shown.
- https://cdn.elifesciences.org/articles/79940/elife-79940-fig7-data3-v2.zip
-
Figure 7—source data 4
Unedited blots with labels for Figure 7C are shown.
- https://cdn.elifesciences.org/articles/79940/elife-79940-fig7-data4-v2.zip
Figure 7—figure supplement 1

Cleavage of full-length ATM is mediated by caspase activity upon FLT3 inhibition.
(A, B) MOLM-13 cells were treated with vehicle, 3 nM quizartinib (Quiz), and 3 nM quizartinib + 60 uM Z-VAD-FMK (Z-VAD) in RPMI or human bone marrow stromal cell (hBMSC-CM) for (A) 15 hr and harvested to determine levels of the indicated proteins by Western blotting and (B) 48 hr, followed by measurement of cell death by propidium iodide (PI) staining (n = 3).
-
Figure 7—figure supplement 1—source data 1
Unedited raw blots for Figure 7—figure supplement 1 are shown.
- https://cdn.elifesciences.org/articles/79940/elife-79940-fig7-figsupp1-data1-v2.zip
-
Figure 7—figure supplement 1—source data 2
Unedited blots with labels for Figure 7—figure supplement 1 are shown.
- https://cdn.elifesciences.org/articles/79940/elife-79940-fig7-figsupp1-data2-v2.zip
Figure 7—figure supplement 2
shATM further impairs recovery of cell growth after removal of quizartinib.
MOLM-13 cells were transduced with lentiviruses expressing shRNAs (shNT: nontargeting shRNA; or shATM: ATM-targeting shRNA). Cells were treated with either vehicle or 3 nM quizartinib (Quiz) for 48 hr in RPMI or human bone marrow stromal cell (hBMSC-CM), followed by measurement of cell viability (n = 3).
Figure 7—figure supplement 3
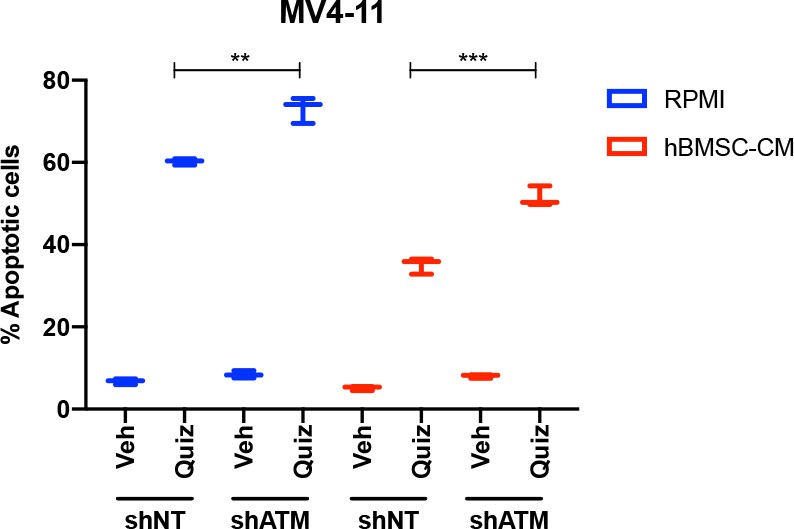
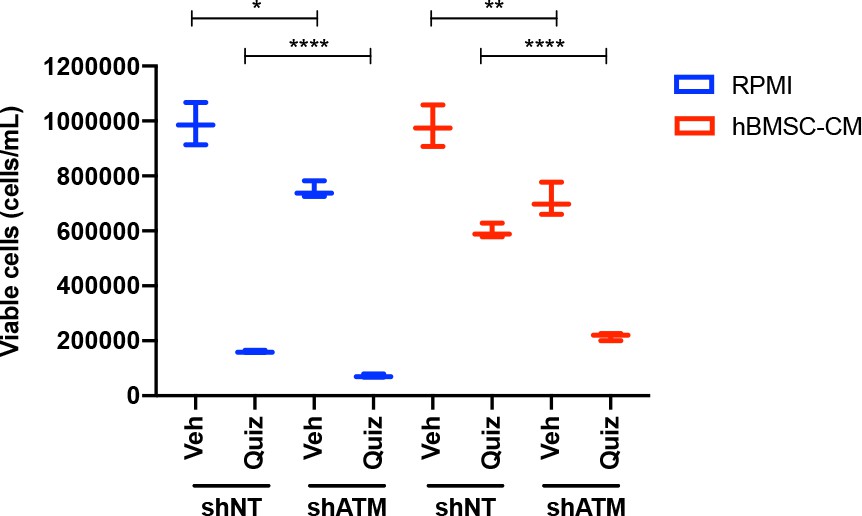
ATM mediates the protection from FLT3 inhibition by human bone marrow stromal cell (hBMSC-CM) in MV4-11 cells.
MV4-11 cells were transduced with lentiviruses expressing shRNAs (shNT: nontargeting shRNA; or shATM: ATM-targeting shRNA). Cells were treated with either vehicle or 2 nM quizartinib (Quiz) for 48 hr in RPMI or hBMSC-CM, followed by measurement of apoptosis (n = 3).
Figure 7—figure supplement 4

shATM does not prevent the G1 arrest upon FLT3 inhibition.
MOLM-13 cells expressing shNT or shATM were treated with the indicated conditions for 15 hr and labeled with 5-ethynyl-2′-deoxyuridine (EdU). Cells were stained with propidium iodide (PI) to measure DNA content, followed by cell cycle analysis using flow cytometry (S-phase: EdU+; G1/G0-phase: EdU-/low PI,;G2/M-phase: EdU-/high PI) (n = 3). Statistical analysis was performed for S phase.
Figure 7—figure supplement 5
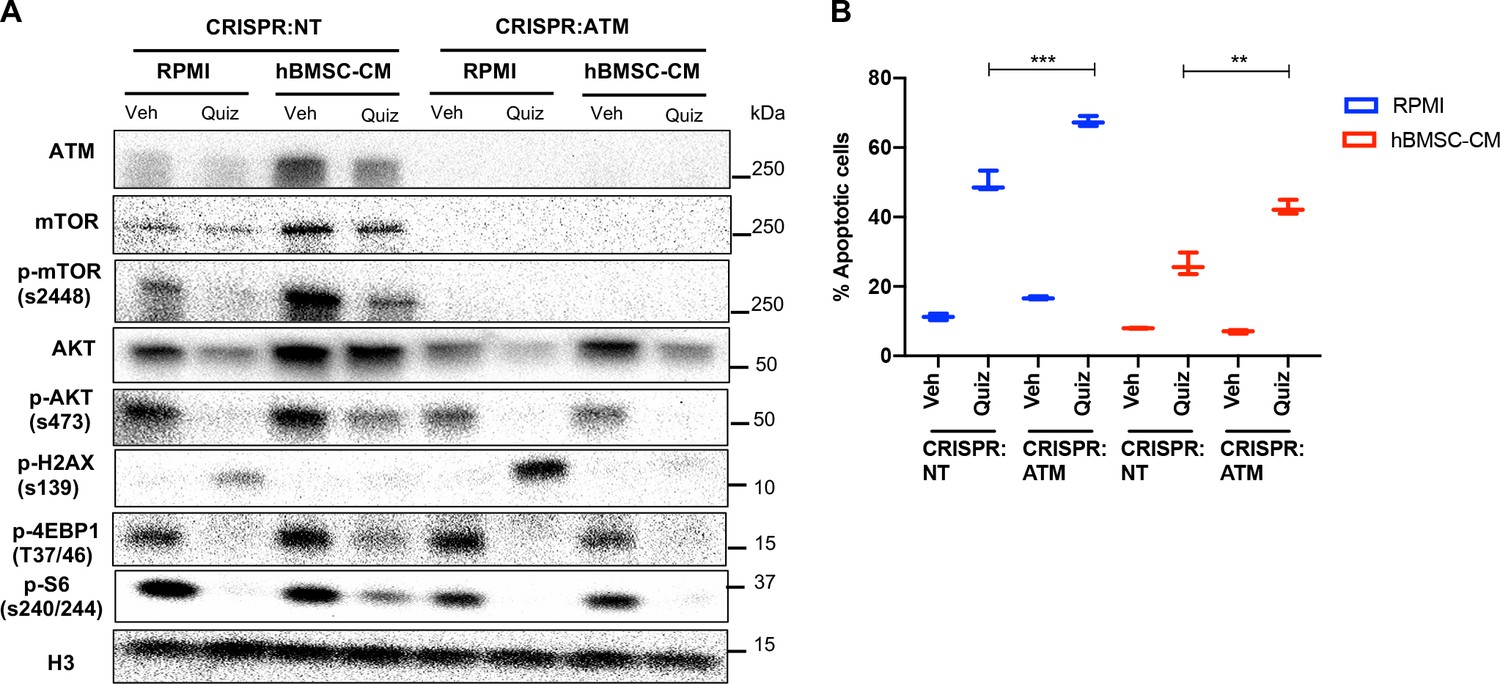
ATM knockout by CRISPR/Cas9 phenocopies shATM.
(A, B) MOLM-13 cells were transduced with lentiviruses expressing CRISPR/Cas9 with sgRNA (CRISPR:NT; nontargeting and CRISPR:ATM; ATM-targeting sgRNA), followed by plating on methylcellulose for single cell-derived clone isolation. After expansion of single cells, the cells were treated with either vehicle or 3 nM quizartinib (Quiz) for (A) 15 hr and harvested to determine levels of the indicated proteins or (B) 48 hr, followed by measurement of apoptosis (n = 3).
-
Figure 7—figure supplement 5—source data 1
Unedited raw blots for Figure 7—figure supplement 5 are shown.
- https://cdn.elifesciences.org/articles/79940/elife-79940-fig7-figsupp5-data1-v2.zip
-
Figure 7—figure supplement 5—source data 2
Unedited blots with labels for Figure 7—figure supplement 5 are shown.
- https://cdn.elifesciences.org/articles/79940/elife-79940-fig7-figsupp5-data2-v2.zip
Figure 7—figure supplement 6
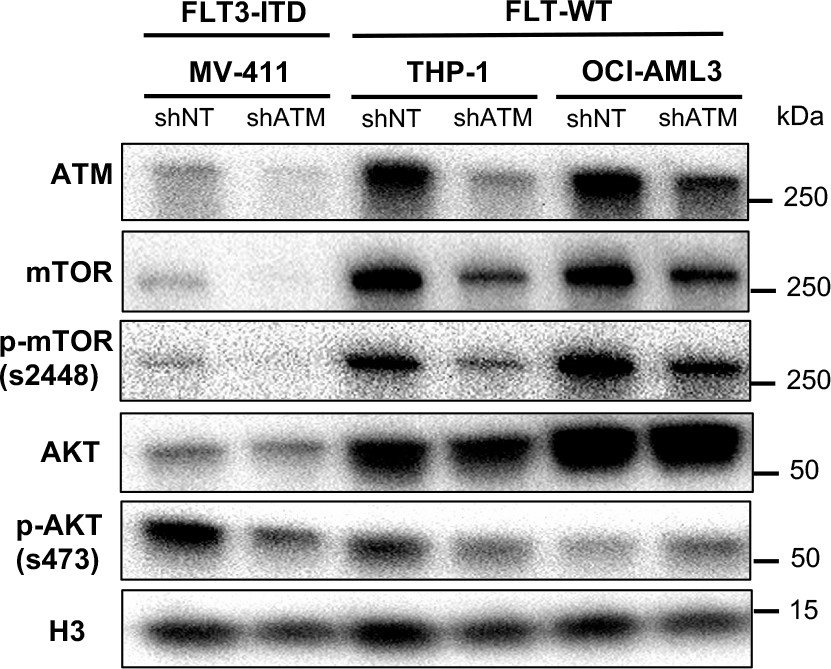
ATM-dependent mTOR expression and AKT phosphorylation are not unique to FLT3-dependent acute myeloid leukemia (AML).
(A) MV4-11, THP-1, and OCI-AML3 cells expressing shNT or shATM were harvested to determine levels of the indicated proteins by Western blot analysis.
-
Figure 7—figure supplement 6—source data 1
Unedited raw blots for Figure 7—figure supplement 6 are shown.
- https://cdn.elifesciences.org/articles/79940/elife-79940-fig7-figsupp6-data1-v2.zip
-
Figure 7—figure supplement 6—source data 2
Unedited blots with labels for Figure 7—figure supplement 6 are shown.
- https://cdn.elifesciences.org/articles/79940/elife-79940-fig7-figsupp6-data2-v2.zip
Figure 7—figure supplement 7
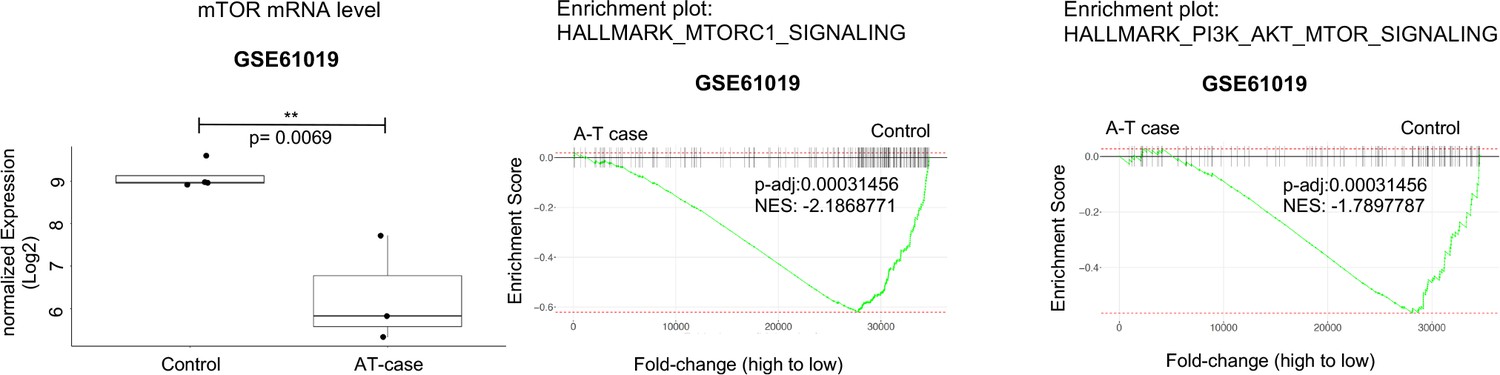
ATM-dependent expression of mTOR and AKT signaling is not unique to leukemic cells.
Analysis of RNA-seq data obtained from Gene Expression Omnibus (GEO) database (GSE61019). Level of MTOR mRNAs from human brain tissues of A-T cases were compared with those from control samples (left) and gene set enrichment analyses (GSEA) enrichment plots of mTORC1 signaling and PI3K-AKT-mTOR signaling are shown.
Figure 7—figure supplement 8
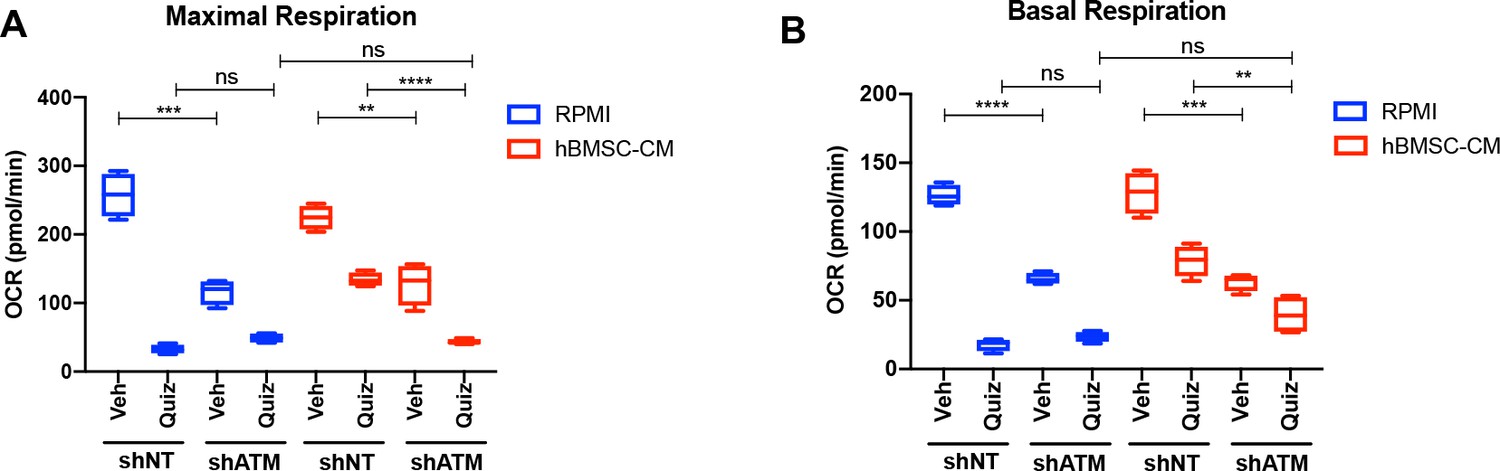
Basal and maximal respiration are significantly downregulated with shATM.
MOLM-13 cells expressing shNT or shATM were treated with the indicated conditions for 15 hr, followed by measurement of oxygen consumption rate (OCR) by Seahorse XF Cell Mito Stress Test (n = 4). Basal respiration and maximal respiration are shown.
Additional files
-
Supplementary file 1
Each western blot was quantified via densitometry by using Image Lab Software (Bio-Rad).
Quantification data with statistical analyses including mean and standard deviation from each experiment (n = 2–3) is shown.
- https://cdn.elifesciences.org/articles/79940/elife-79940-supp1-v2.xlsx
-
MDAR checklist
- https://cdn.elifesciences.org/articles/79940/elife-79940-mdarchecklist1-v2.docx
Download links
A two-part list of links to download the article, or parts of the article, in various formats.
Downloads (link to download the article as PDF)
Open citations (links to open the citations from this article in various online reference manager services)
Cite this article (links to download the citations from this article in formats compatible with various reference manager tools)
Therapeutic resistance in acute myeloid leukemia cells is mediated by a novel ATM/mTOR pathway regulating oxidative phosphorylation
eLife 11:e79940.
https://doi.org/10.7554/eLife.79940


