m6A epitranscriptomic modification regulates neural progenitor-to-glial cell transition in the retina
- State Key Laboratory of Ophthalmology, Zhongshan Ophthalmic Center, Sun Yat-sen University, Guangdong Provincial Key Laboratory of Ophthalmology and Visual Science, China
Figures
Figure 1 with 2 supplements
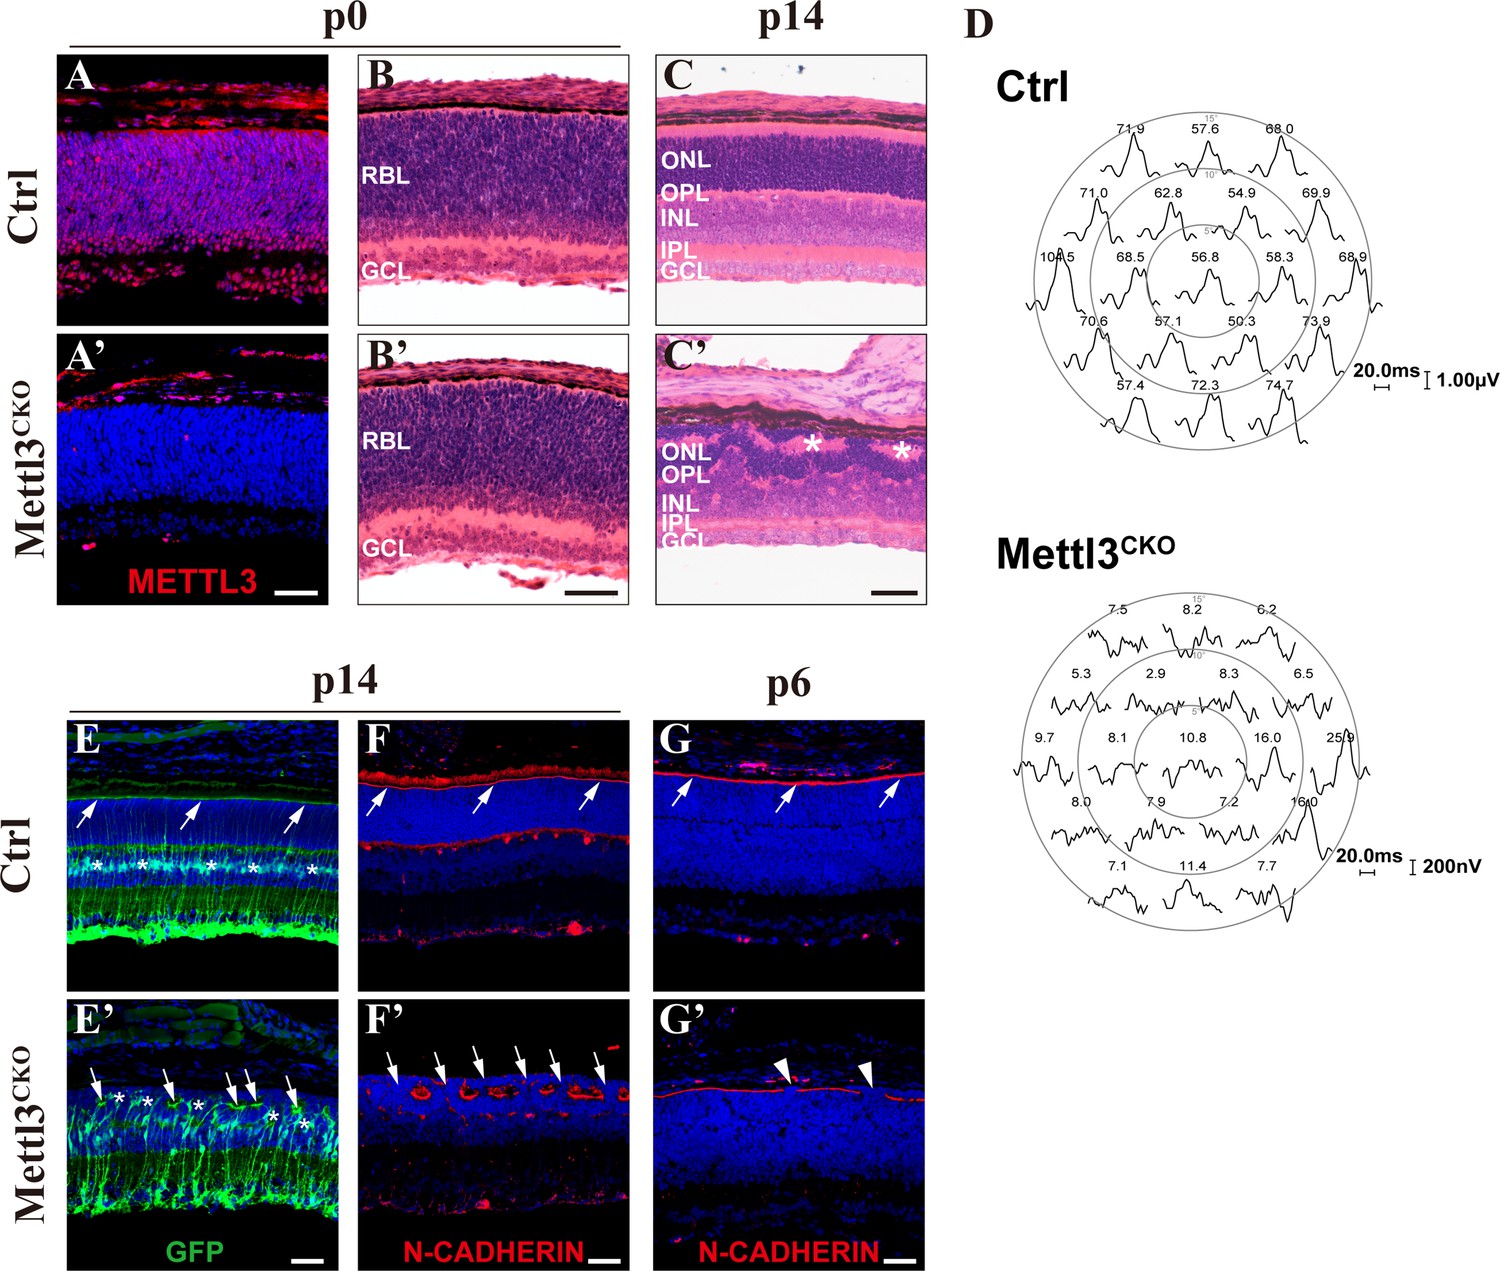
Mettl3 deficiency leads to structural and physiological abnormalities in the retina.
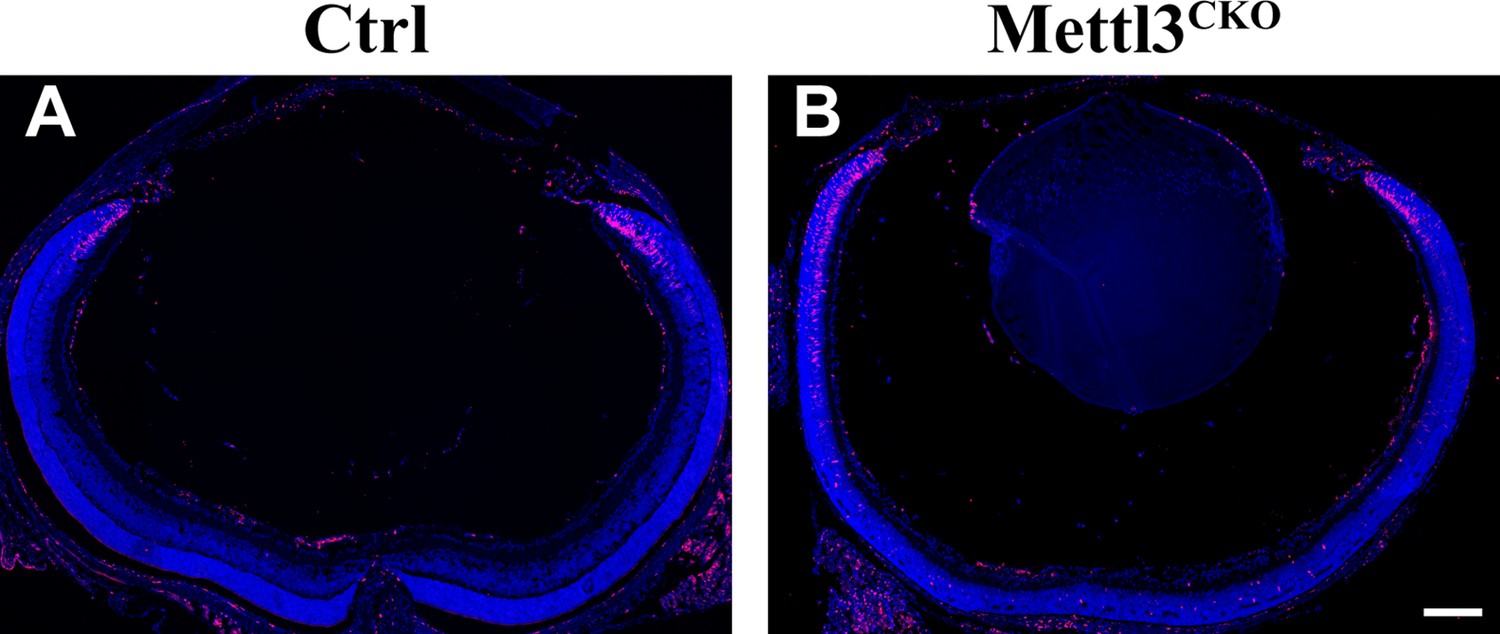
(A, A’) Confocal images of METTL3 expression in p0 control (Ctrl) and Mettl3-CKO retinas showing that Mettl3 was efficiently deleted in the mutant retinas. (B, B’) H&E staining of p0 control and Mettl3-CKO retinas showing that the mutant retinas had a grossly normal histological structure. (C, C’) H&E staining of p14 control and Mettl3-CKO retinas showing that the mutant retinal structure was severely disrupted. * indicates rosette structures. (D) Multifocal electroretinogram (ERG) response recordings in each hexagonal region of the retinas stimulated with 19 hexagonal light signals showing that the visual function of Mettl3-CKO retinas was severely disrupted. The numbers on the top of each waveform plot indicate the averaged ERG response in the respective hexagonal area in nV/deg2. (E, E’) Confocal images of p14 retinas labeled with GFP to highlight Müller cells (mice on the Rlbp1-GFP background). The white arrows indicate the outer limiting membrane (OLM). * in (E’) indicates mislocalized somata of Müller cells. (F, F’) Confocal images of p14 retinas stained for N-CADHERIN to highlight the OLM. The white arrows in (F) indicate the OLM, and those in (F’) indicate breaks between the OLM. (G, G’) Confocal images of p6 retinas stained for N-CADHERIN showing that breaks in the OLM (white arrowheads) in Mettl3-CKO retinas started to appear at p6. RBL: retinoblast layer; GCL: ganglion cell layer; ONL: outer nuclear layer; OPL: outer plexiform layer; INL: inner nuclear layer; IPL: inner plexiform layer. Scale bars are 50 μm.
Figure 1—figure supplement 1
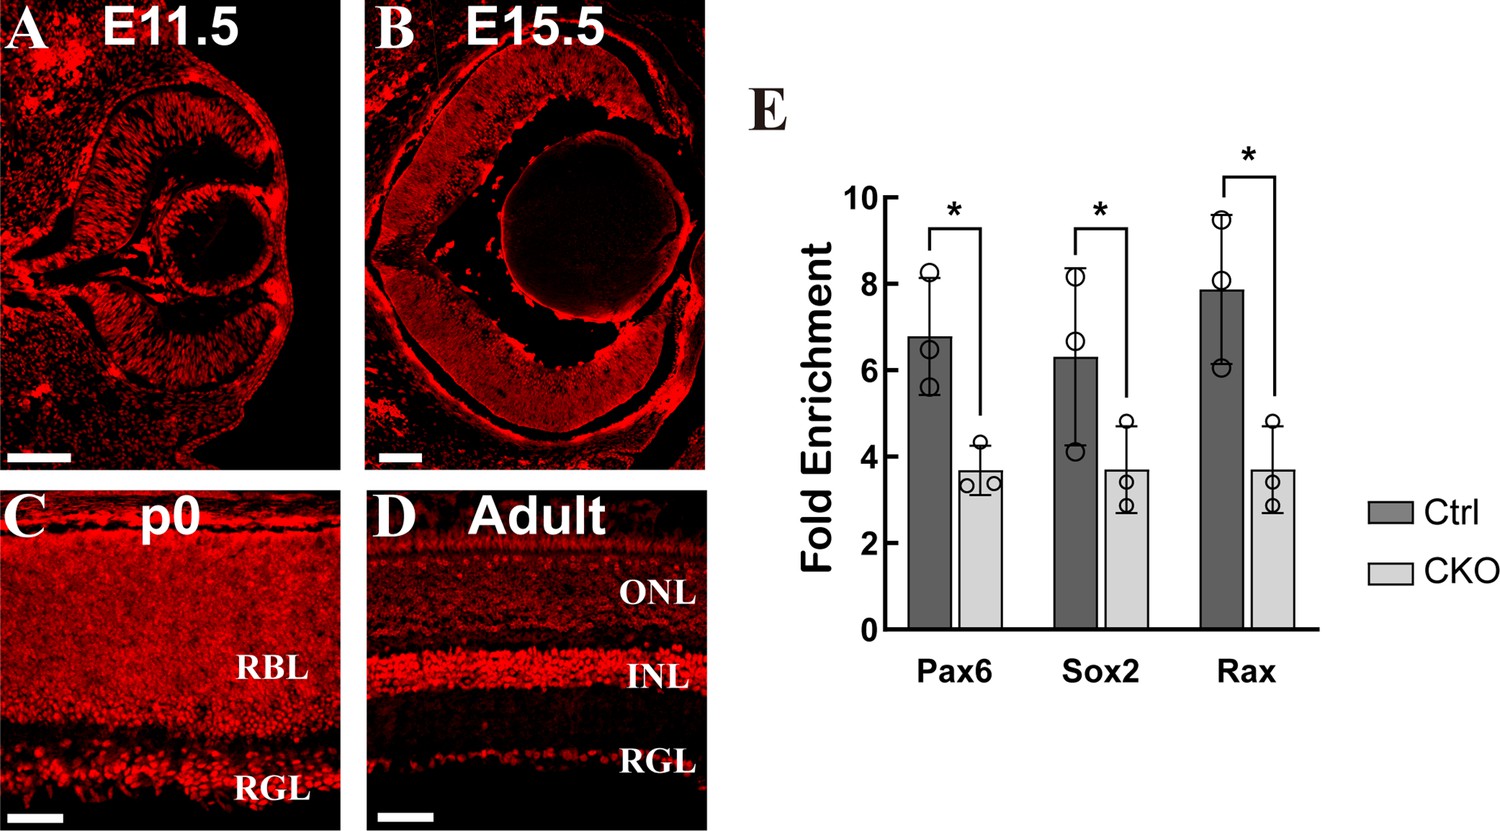
The expression of Mettl3 in the mouse retina.
(A–D) Confocal images of METTL3 expression in mouse retinas at different developmental stages. The scale bars are 100 μm. (E) MeRIP-qPCR results showing that the m6A levels of several candidate genes were significantly reduced in Mettl3-CKO retinas. The data are presented as the means ± standard deviations, corresponding to three independent biological replicates. *p<0.05.
Figure 1—figure supplement 2
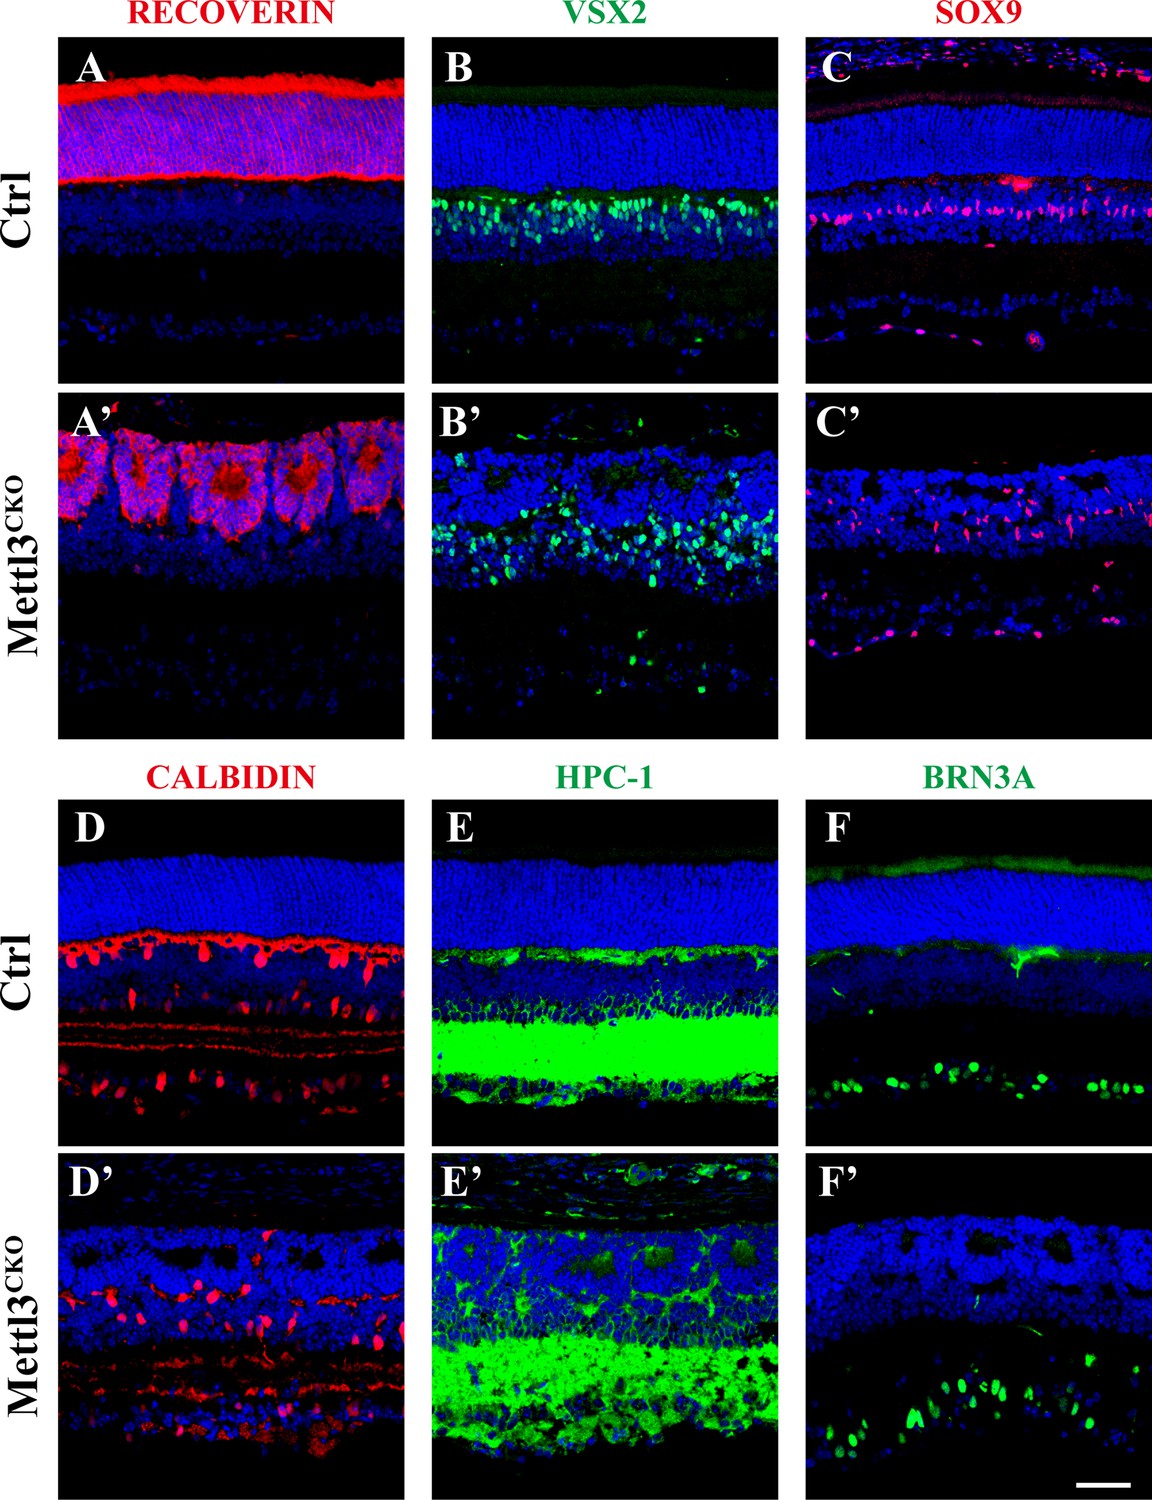
All types of retinal cells are generated in Mettl3-CKO retinas.
Confocal images of p14 retinas stained for RECOVERIN to illustrate photoreceptor cells (A, A’), VSX2 to illustrate bipolar cells (B, B’), SOX9 to illustrate Müller cells (C, C’), CALBINDIN to illustrate horizontal cells and subtype amacrine cells (D, D’), HPC-1 to illustrate amacrine cells (E, E’), and BRN3A to illustrate RGCs (F, F’). The scale bar in (F’) is 50 μm and applies to all images in the figure.
Figure 2 with 4 supplements
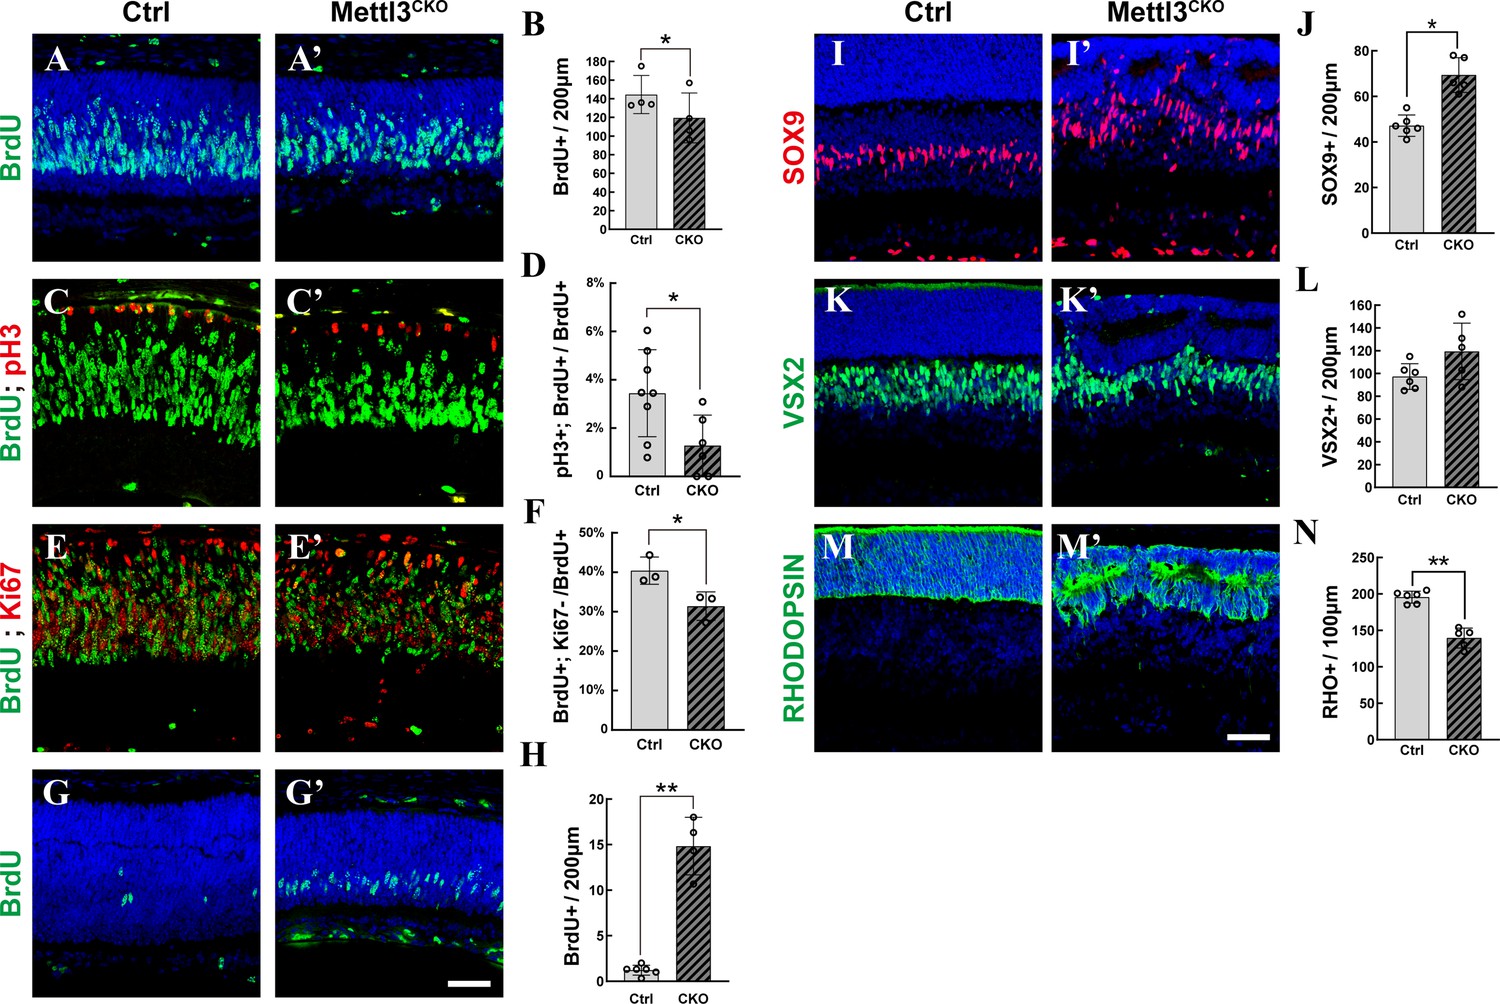
Mettl3 deficiency distorts late-stage retinogenesis.
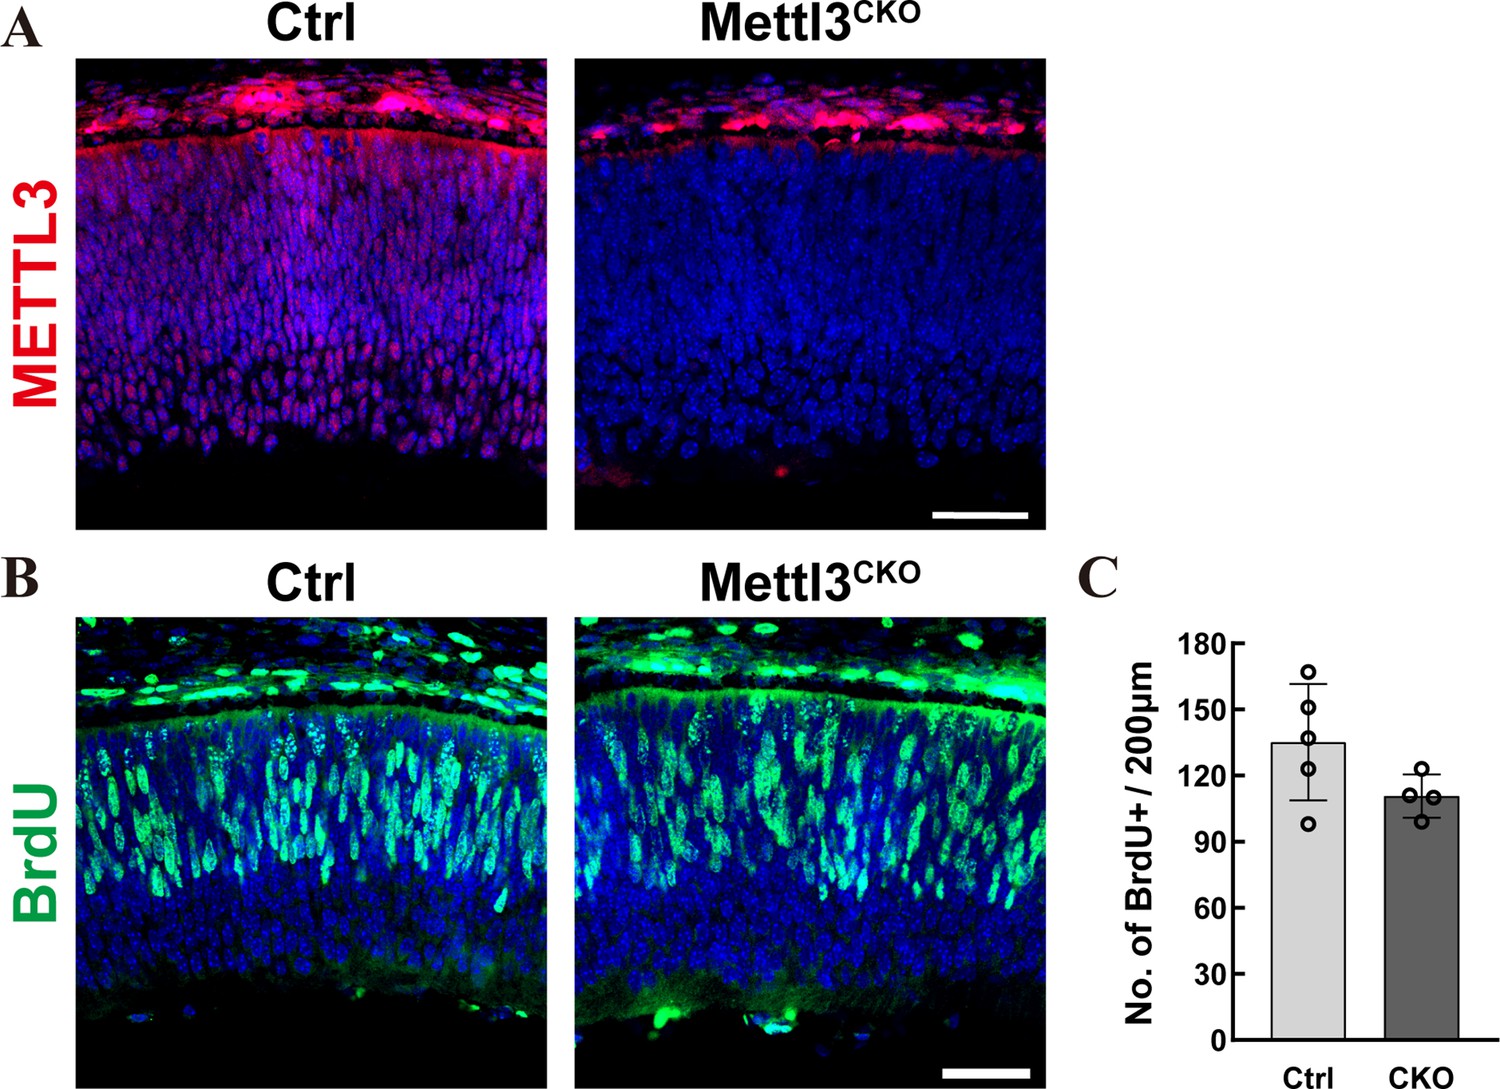
(A, A’) Confocal images of p1 retinas stained for BrdU. The pups were injected with BrdU, and their retinas were collected 2 hr later. (B) Quantification of the BrdU+ cells in (A) and (A’). (C, C’) Confocal images of p1 retinas stained for BrdU and pH3. The pups were injected with BrdU, and their retinas were collected 6 hr later. (D) Quantification of the BrdU+ and pH3+ cells in (C) and (C’). (E, E’) Confocal images of p3 retinas stained for BrdU and KI67. The pups were injected with BrdU at p1, and their retinas were collected 48 hr later. (F) Quantification of the BrdU+ and Ki67- cells in (E) and (E’). (G, G’) Confocal images of p5 retinas stained for BrdU. The pups were injected with BrdU, and their retinas were collected 2 hr later. (H) Quantification of the BrdU+ cells in (G) and (G’). (I, I’) Confocal images of p7 retinas stained for SOX9 to illustrate Müller cells. (J) Quantification of the SOX9+ cells in (I) and (I’). SOX9+ cells in the retinal ganglion cell layer and inner plexiform layer were excluded to avoid miscounting of SOX9+ astrocytes. (K, K’) Confocal images of p7 retinas stained for VSX2 to illustrate bipolar cells. (L) Quantification of the VSX2+ cells in (K) and (K’). (M, M’) Confocal images of p7 retinas stained for RHODOPSIN to illustrate rods. (N) Quantification of the RHODOPSIN+ cells in (M) and (M’). The data in (B, D, F, H, J, L, N) are presented as the means ± standard deviations, corresponding to at least three independent biological replicates. * p<0.05, **p<0.01. The scale bars in (G’) and (M’) are 50 μm and apply to (A–G’) and (I–M’), respectively.
Figure 2—figure supplement 1
Mettl3 deficiency does not affect the proliferation of early retinal progenitor cells (RPCs).
(A) Confocal images of control and Mettl3-CKO retinas at E15.5 stained for METTL3. (B) Confocal images of control and Mettl3-CKO retinas at E15.5 stained for BrdU. The mothers were injected with BrdU, and the embryos were collected 2 hr later. (C) Quantification of the BrdU+ cells in (B) . The data are represented as the means ± standard deviation, corresponding to at least three independent biological replicates. The scale bars are 50 μm.
Figure 2—figure supplement 2
Mettl3 is required in late retinal progenitor cells (RPCs) for the proper cell cycle progression.
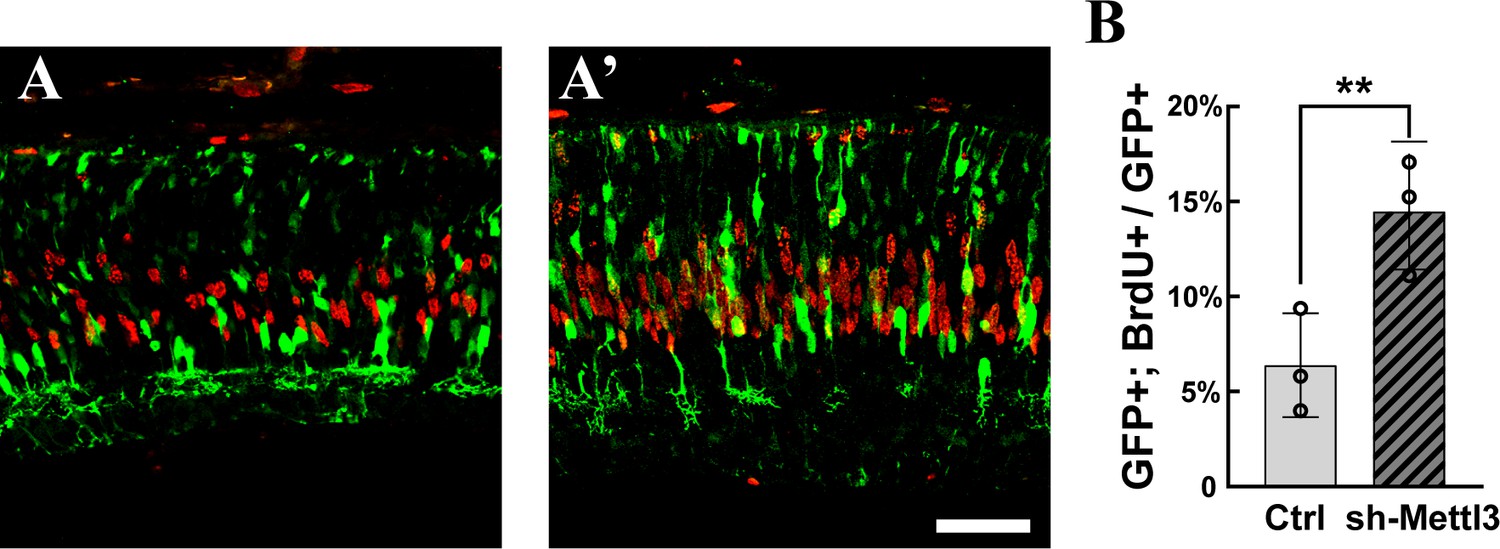
(A, A’) Confocal images of p3 retinas stained for GFP and BrdU. The retinas were transfected with plasmids expressing shRNAs targeting Mettl3 via in vivo electroporation at p1 and treated with BrdU by subcutaneous injection 2 hr before sacrifice. The scale bar is 50 μm. (B) Quantification of the percentage of GFP-labeled electroporated RPCs that were positive for BrdU. The data are presented as the mean ± standard deviation, corresponding to three independent biological replicates. **p<0.01.
Figure 2—figure supplement 3
Different types of retinal cells at p7.
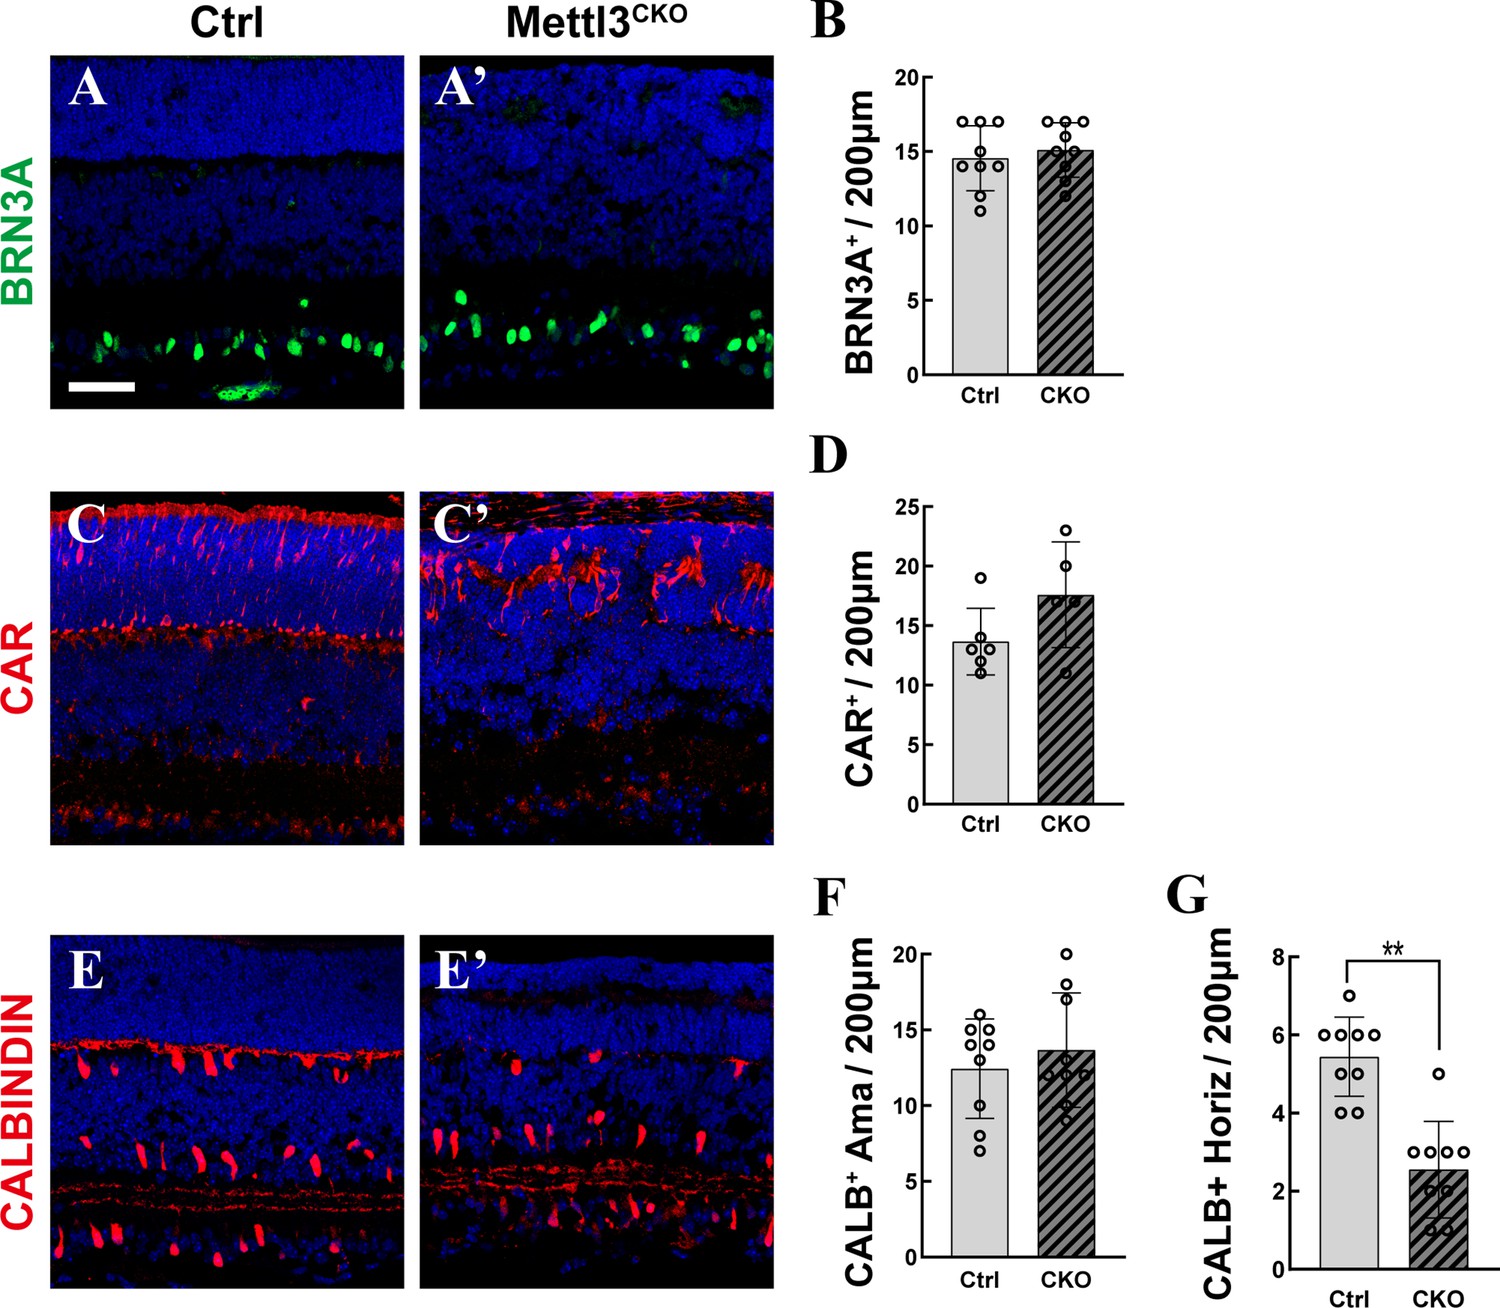
(A, A’) Confocal images of p7 retinas stained for BRN3A to illustrate retinal progenitor cells (RGCs). (B) Quantification of the BRN3A+ cells in (A) and (A’). (C, C’) Confocal images of p7 retinas stained for CAR to illustrate cones. (D) Quantification of the CAR+ cells in (C) and (C’). (E, E’) Confocal images of p7 retinas stained for CALBINDIN to illustrate amacrine cells and horizontal cells. (F) Quantification of the CALBINDIN+ amacrine cells (cells close to the inner plexiform layer [IPL]) in (E) and (E’). (G) Quantification of the CALBINDIN+ horizontal cells (cells close to the outer plexiform layer [OPL]) in (E) and (E’). The data in (B, D, F, G) are represented as the means ± standard deviation, corresponding to at least three independent biological replicates. **p<0.01. The scale bar in (A) is 50 μm and applies to all images in the figure.
Figure 2—figure supplement 4
Retinas deficient for Mettl3 gradually degenerate due to apoptosis.
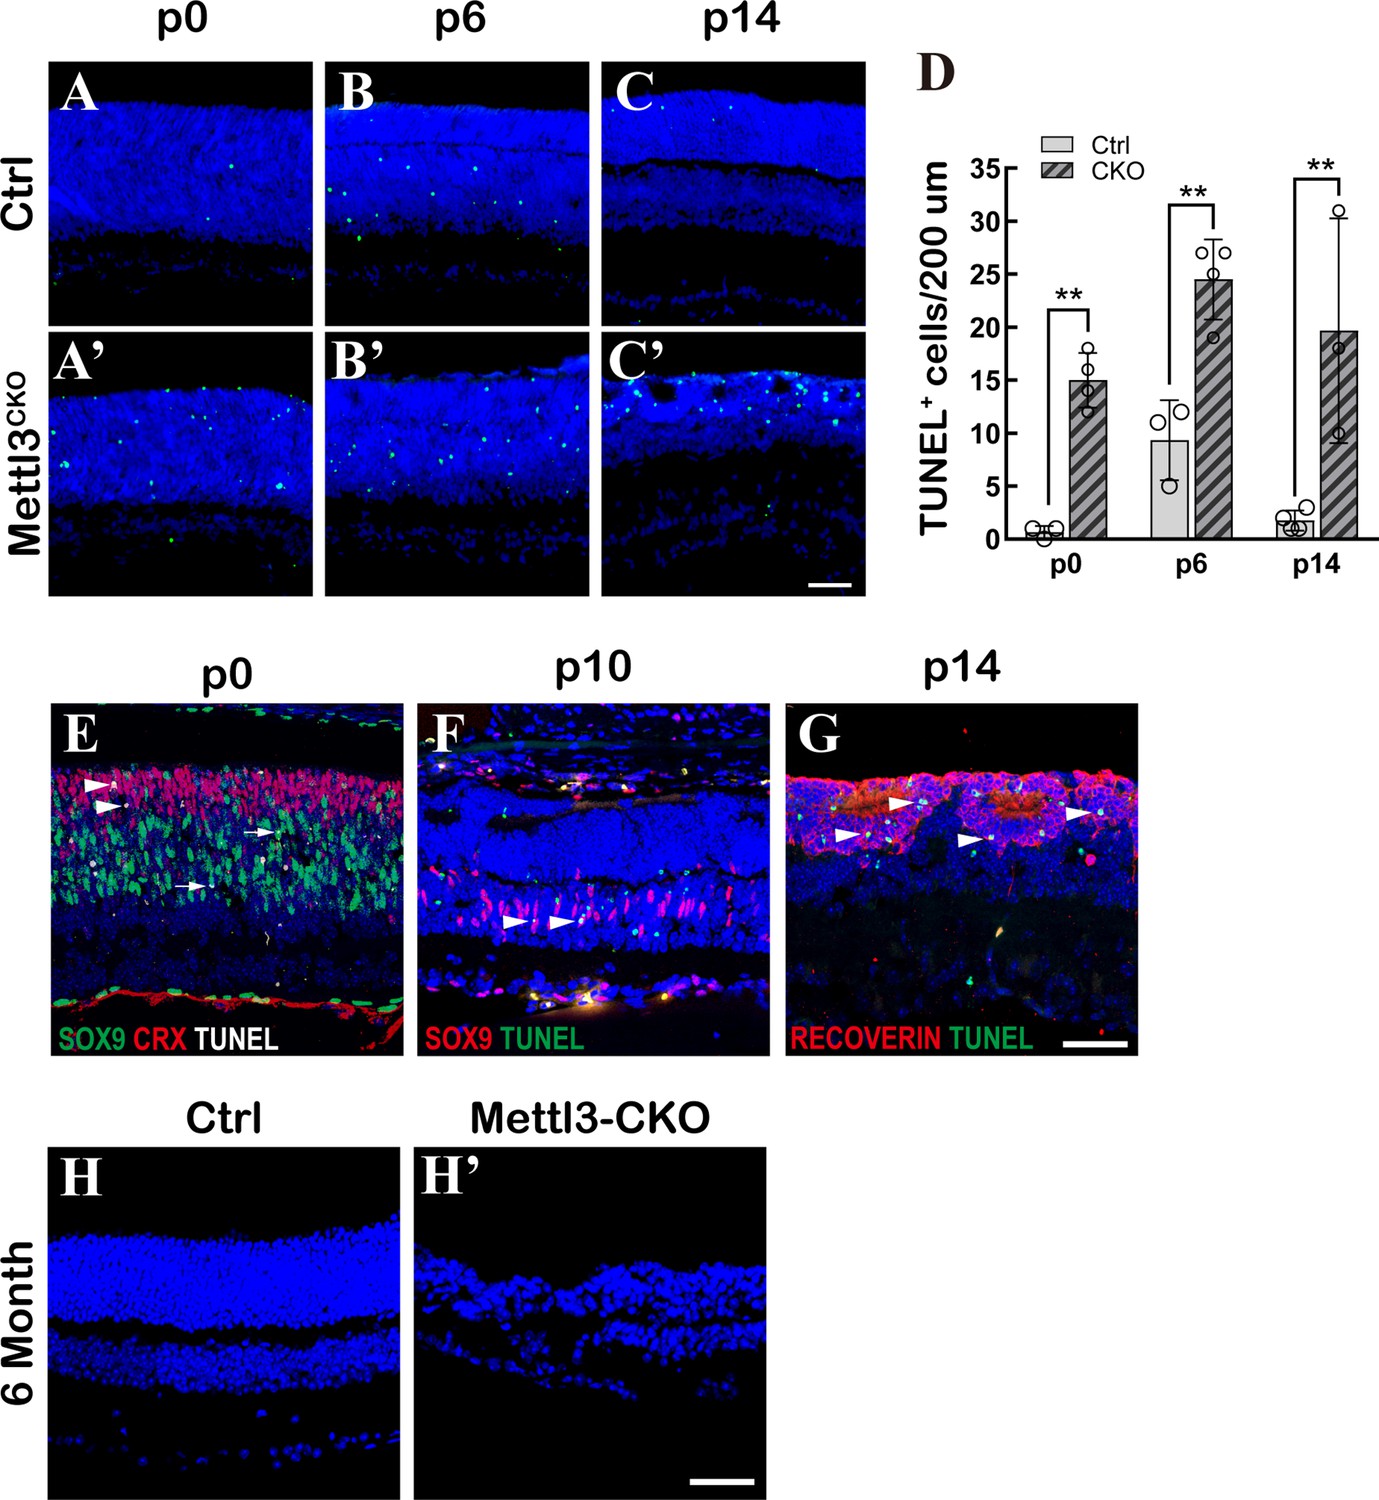
(A–C’) Confocal images of control and Mettl3-CKO retinas at different postnatal ages stained for TUNEL. (D) Quantification of TUNEL+ cells in control and Mettl3-CKO retinas. The data are represented as the means ± standard deviation, corresponding to at least three independent biological replicates. **p<0.01. (E) A confocal image of a p0 Mettl3-CKO retina stained for TUNEL (white), CRX (red), and SOX9 (green). Arrows point to the SOX9+ dying RPCs, and arrowheads point to the CRX+ dying photoreceptors/photoreceptor precursors. (F) A confocal image of a p10 Mettl3-CKO retina stained for TUNEL (green) and SOX9 (red). Arrowheads point to the SOX9+ dying Müller glial cells. (G) A confocal image of a p14 Mettl3-CKO retina stained for TUNEL (green) and RECOVERIN (red). Arrowheads point to the RECOVERIN+ dying photoreceptors. (H–H’) Confocal images of 6-month control and Mettl3-CKO retinas stained with DAPI to show the degeneration of the mutant retina. The scale bars in (C’, G, H’) are 50 μm.
Figure 3 with 4 supplements

Single-cell RNA sequencing (scRNA-seq) analyses reveal distorted transcriptomes of late retinal progenitor cells (RPCs) and Müller glial cells in Mettl3-CKO retinas.
(A) UMAP presenting the cell clusters of all sequenced cells. (B) Heatmap illustrating the expression patterns of key markers of each retinal cell type. (C) UMAP presenting the distribution of control and Mettl3-CKO retinal cells. (D) Bar column presenting the cell compositions in control and Mettl3-CKO retinas. (E) Left: pseudotime presentation illustrating the developmental progression from RPCs to Müller glia; right: cell density distributions of RPCs and Müller glia over the pseudotime period. (F) Left: separate pseudotime presentations of control and Mettl3-CKO RPCs and Müller glia; right: cell density distributions of control and Mettl3-CKO cells over the pseudotime period. (G) UMAP of reclustered RPCs. The red dotted line encircles a distinct cell cluster composed solely of Mettl3-CKO RPCs. (H) Volcano plot showing gene expression differences between mutant RPCs (encircled by the red dotted line in A) and the remaining RPCs. (I) Bubble plot showing the biological processes enriched in genes that were upregulated in the Mettl3-mutant RPC cluster. (J) Bubble plot showing the biological processes enriched in genes that were downregulated in the Mettl3-mutant RPC cluster. (K) UMAP of reclustered Müller glia. The red dotted line encircles a distinct cell cluster composed solely of Mettl3-CKO Müller glia. (L) Volcano plot showing gene expression differences between mutant Müller glia (encircled by the red dotted line in E) and the remaining Müller glia. (M) Bubble plot showing the biological processes enriched in genes that were upregulated in the Mettl3-mutant Müller glial cluster. (N) Bubble plot showing the biological processes enriched in genes that were downregulated in the Mettl3-mutant Müller glial cluster.
Figure 3—figure supplement 1
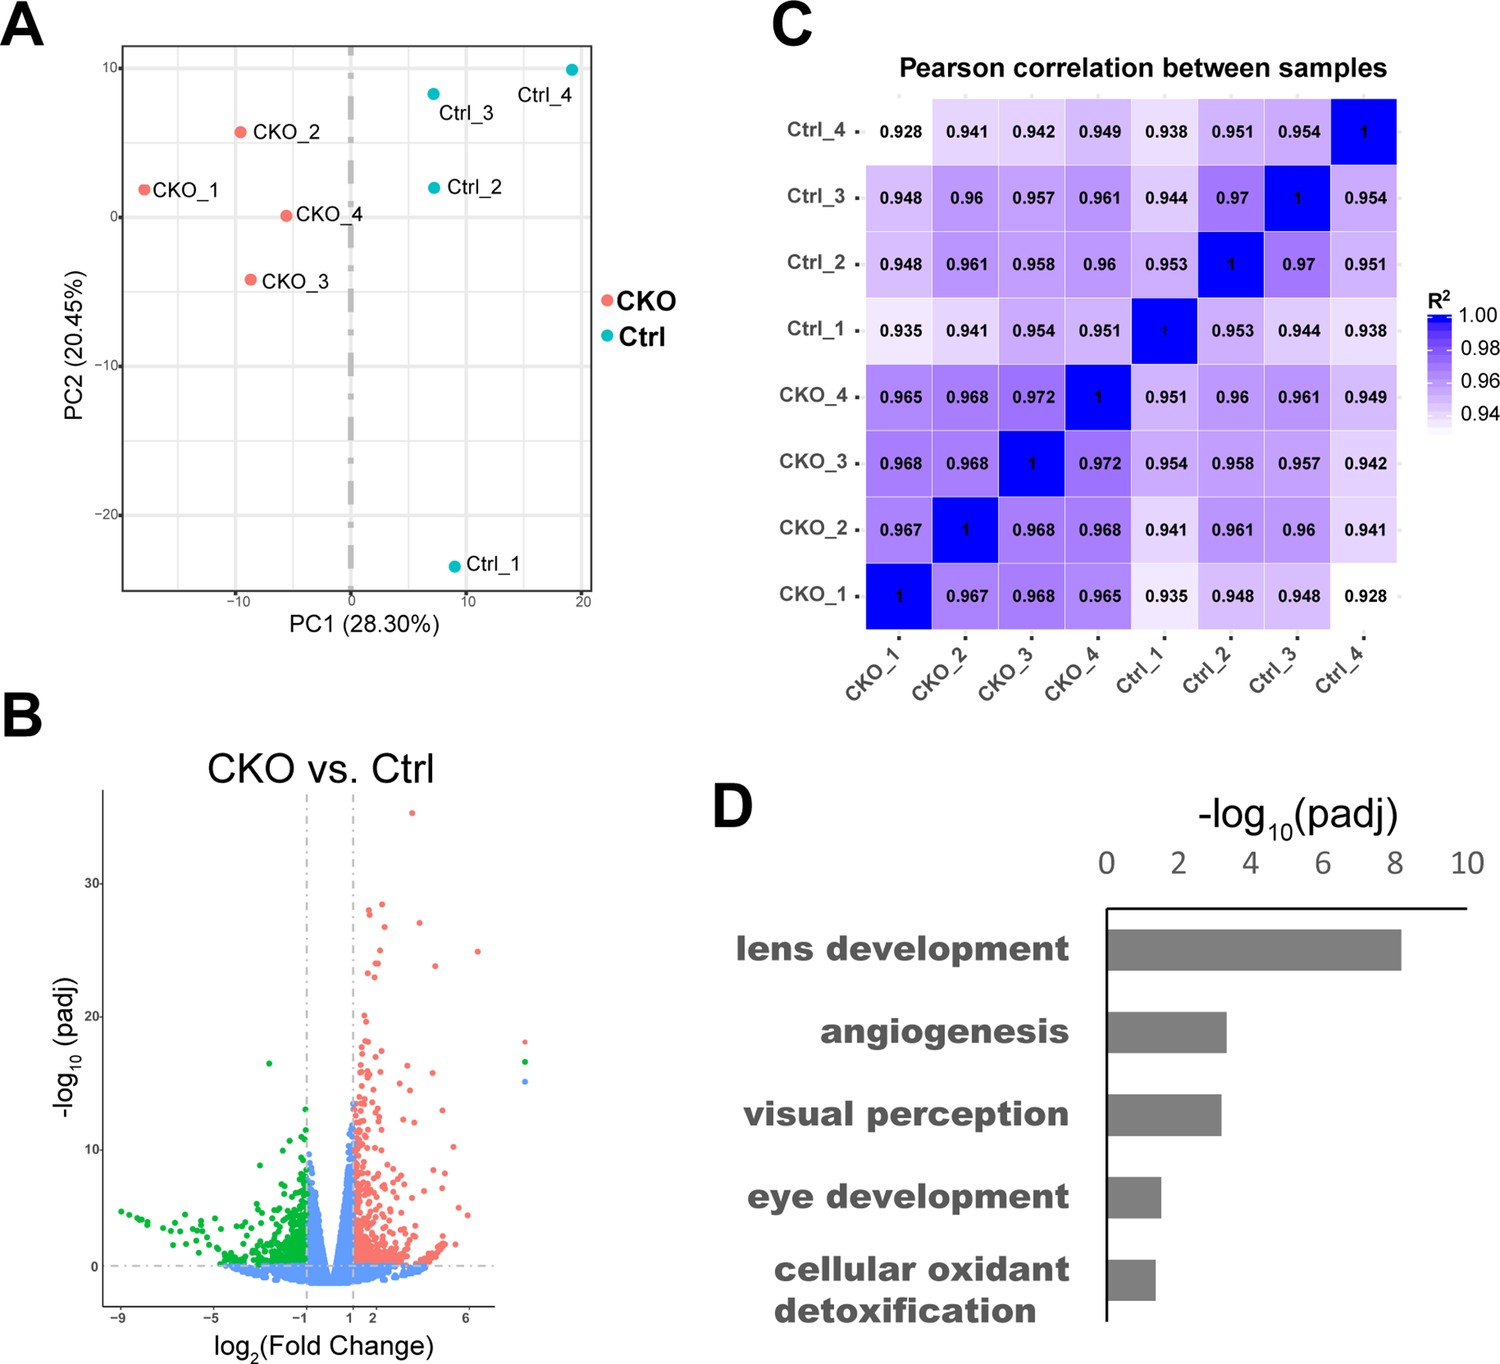
RNA-seq analyses of the transcriptomes of control and Mettl3-CKO retinas.
(A) Principal component analysis (PCA) map illustrating separation of the control and Mettl3-CKO retinal transcriptomes. (B) Volcano plot illustrating the gene expression differences between control and Mettl3-CKO retinas. (C) Pearson scores of the transcriptomes of different samples. (D) Bar graph showing the biological processes enriched in the gene group that were downregulated in Mettl3-CKO retinas.
Figure 3—figure supplement 2
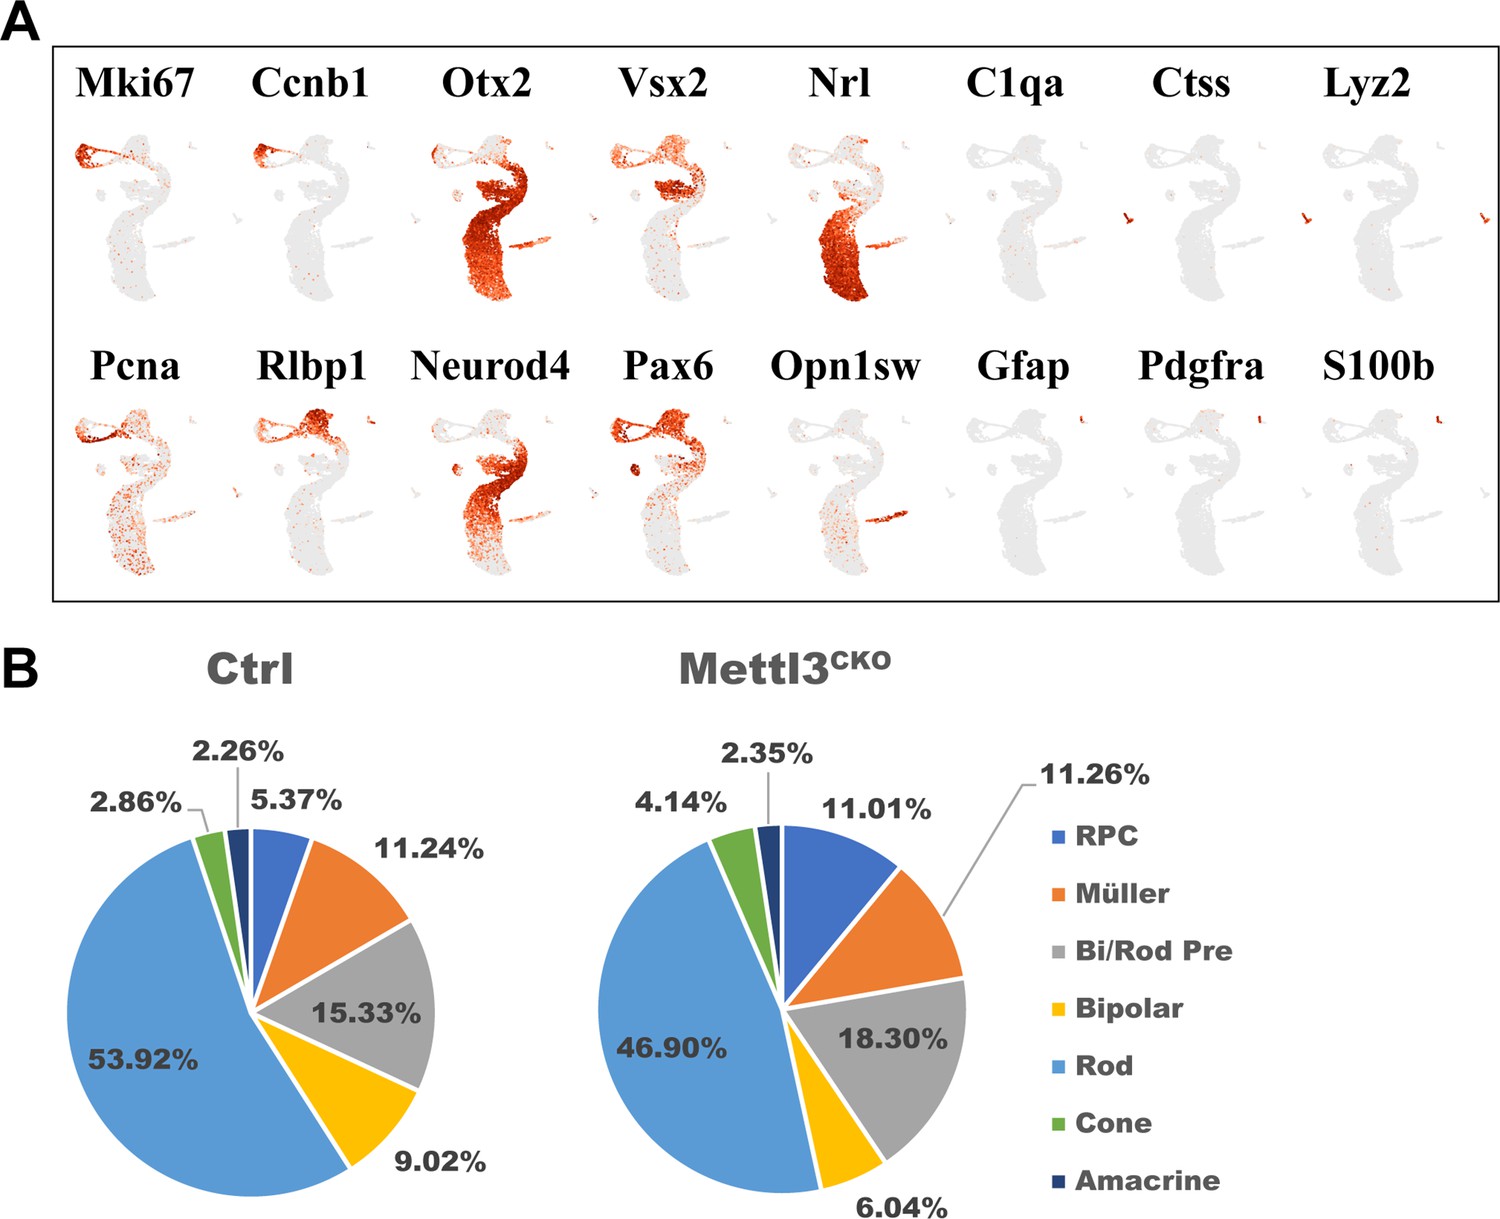
Single-cell RNA sequencing (scRNA-seq) analysis of Mettl3-CKO retinal cells.
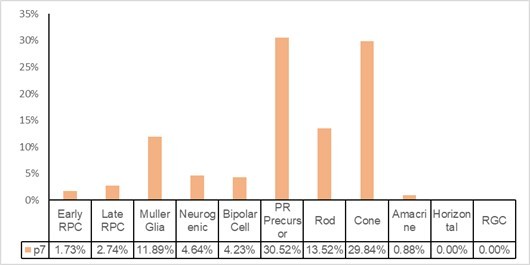
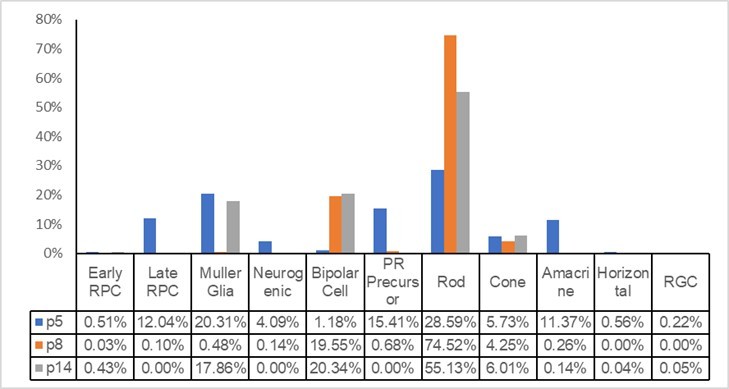
(A) Expression patterns of marker genes of various types of retinal cells in UMAP. (B) Pie charts illustrating the cell type compositions in control and Mettl3-CKO retinas.
Figure 3—figure supplement 3
Proliferating retinal progenitor cells (RPCs) in the retinas at p7.
Confocal images of p7 control and Mettl3-CKO retinas stained for KI67 to illustrate proliferating RPCs. The scale bar is 200 μm.
Figure 3—figure supplement 4
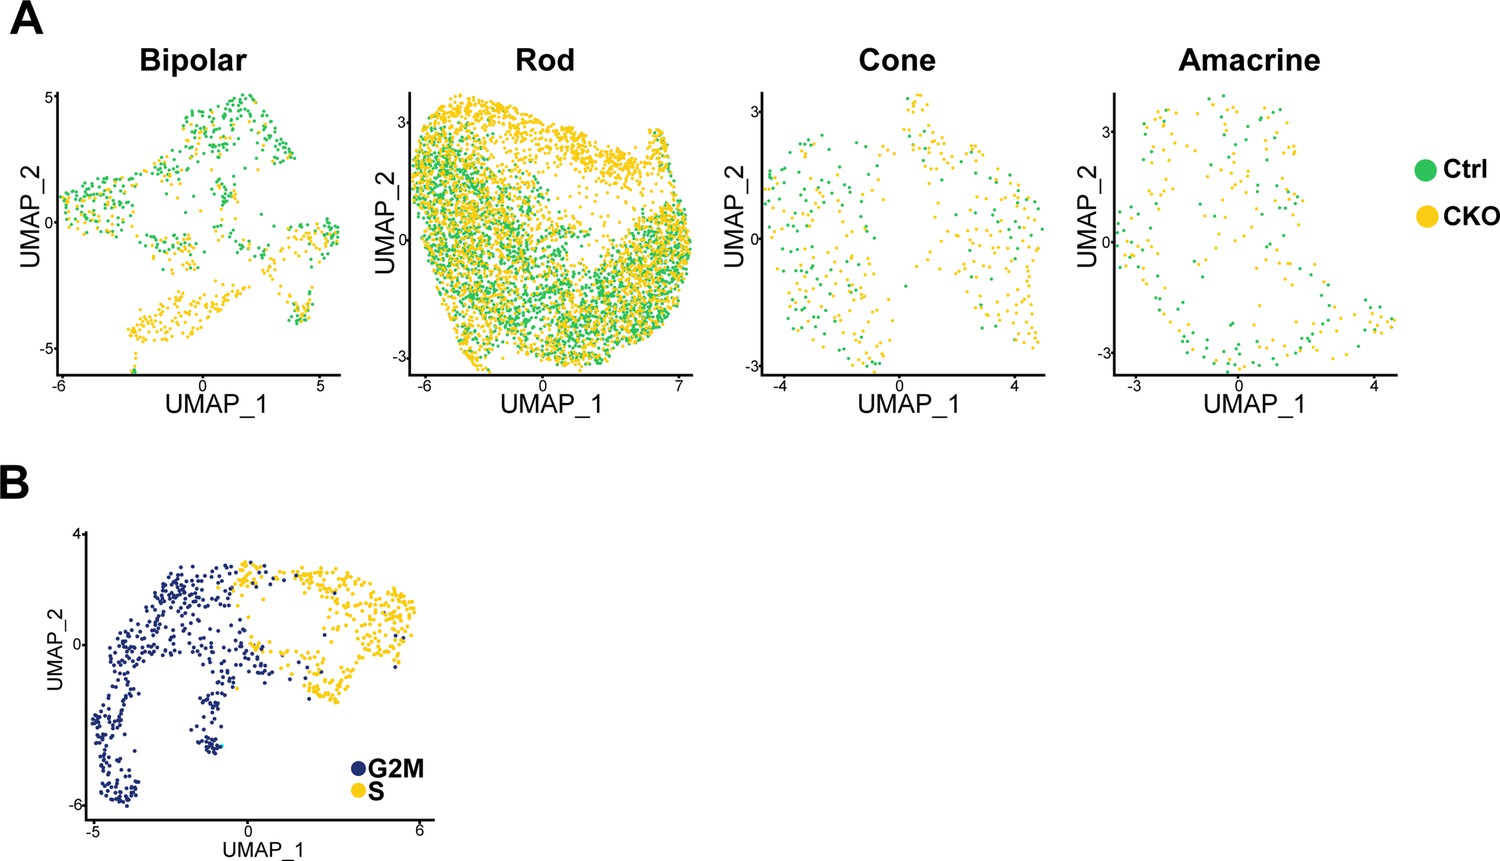
Reclustering of different types of retinal cells.
(A) UMAPs of the reclustered bipolar cell, rod, cone, and amacrine cell populations. (B) Cell cycle phase distribution pattern in reclustered retinal progenitor cells (RPCs).
Figure 4 with 1 supplement
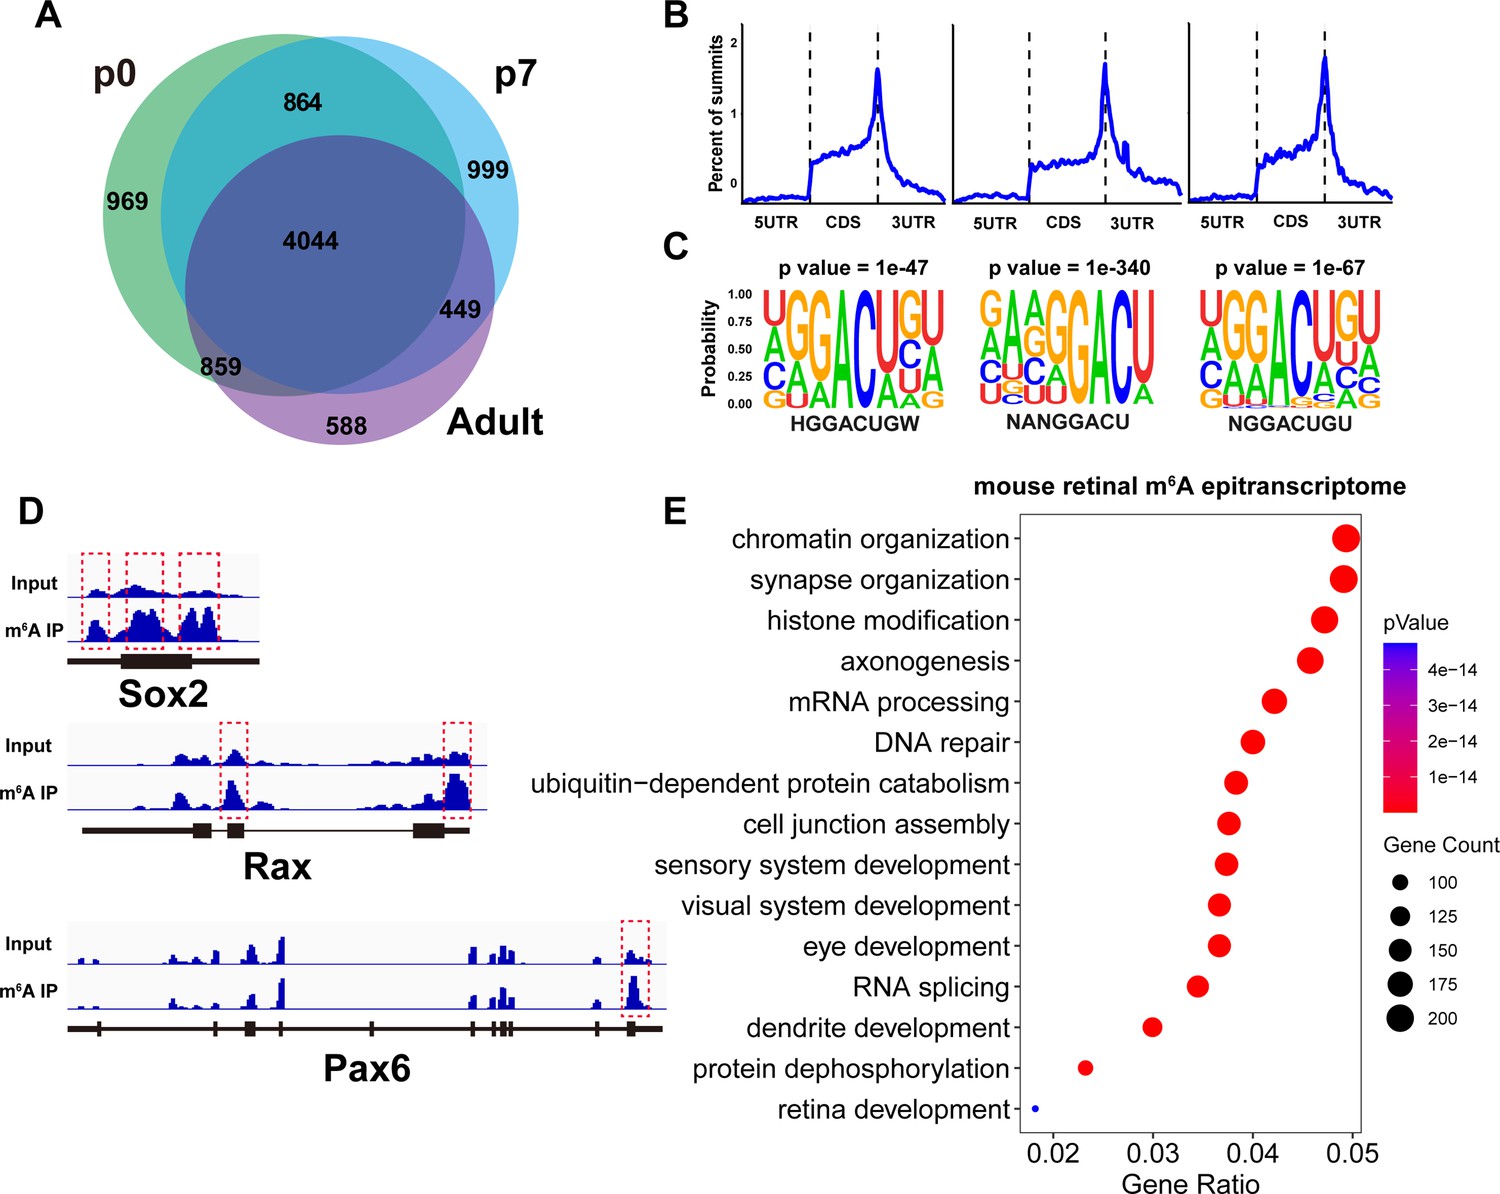
Mouse retinal m6A epitranscriptome.
(A) Pie graph illustrating the number of genes carrying m6A modification detected by MeRIP-seq in the mouse retina at different ages. The numbers represent the number of genes in the respective pie region. (B) Plots illustrating the distribution of m6A peaks along mouse retinal transcripts. (C) The most enriched motif among m6A peak sequences in the mouse retina transcriptome. (D) IGV views illustrating the m6A peak distribution along transcripts of important retinal regulatory genes revealed by MeRIP-seq. (E) Bubble plot showing the biological processes enriched in genes carrying m6A modification detected in the retinas of mice at all ages.
Figure 4—figure supplement 1
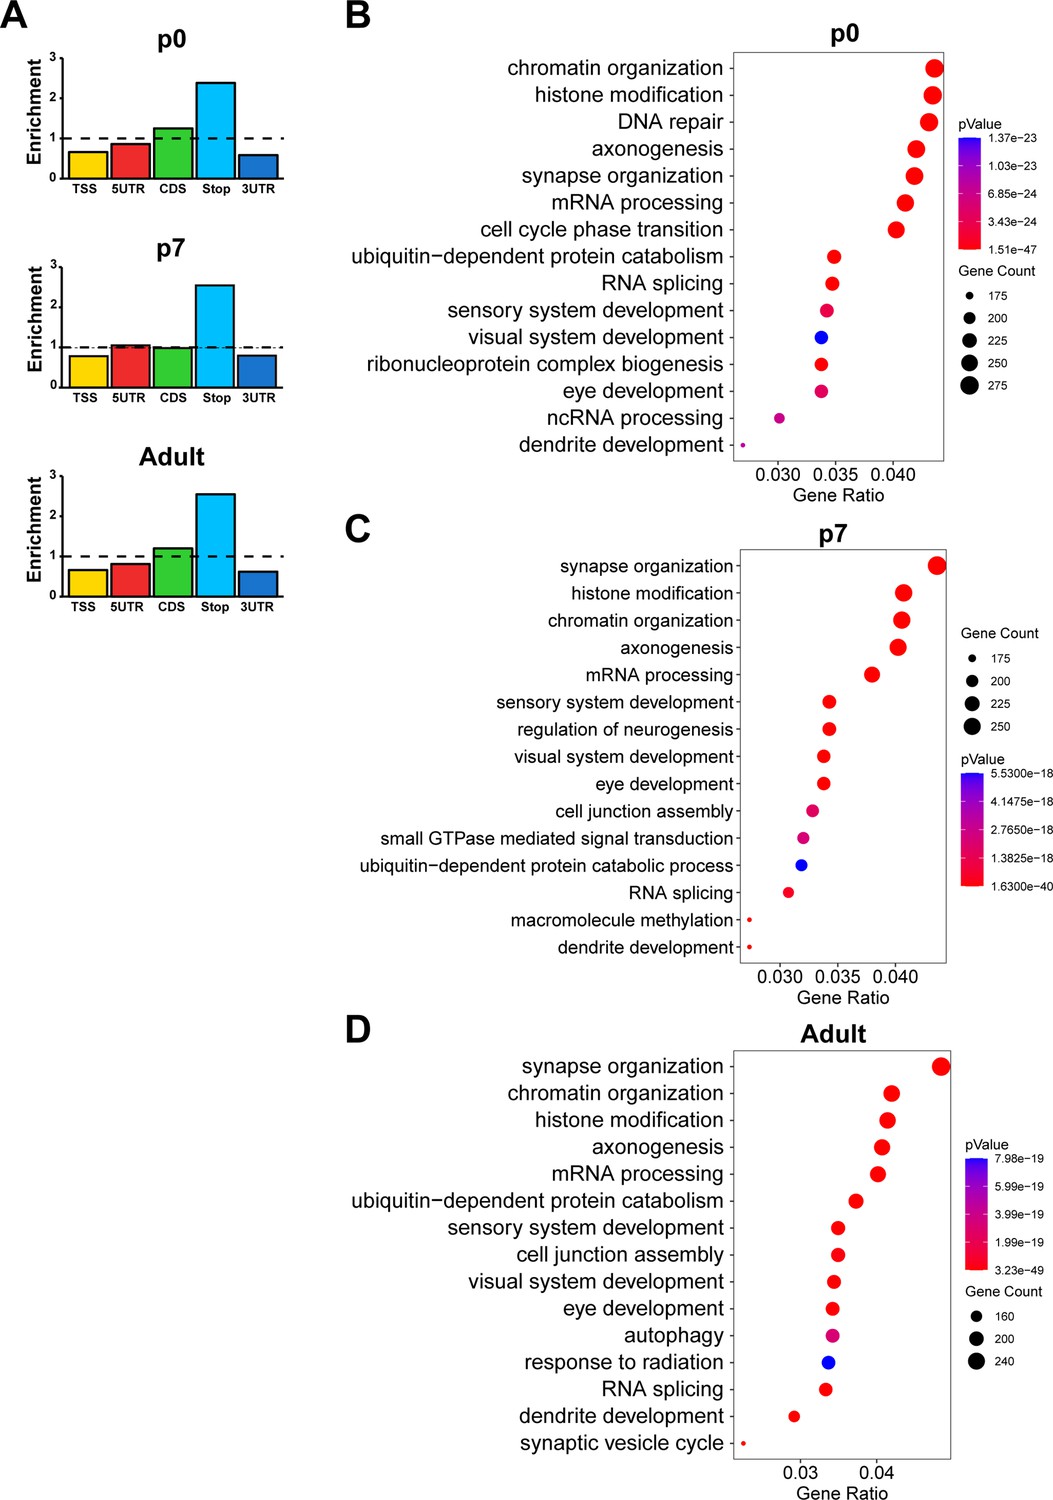
m6A epitranscriptomes of the mouse retina at different ages.
(A) Bar graphs illustrating the enrichment status of m6A peaks in different regions of mouse retinal transcripts. (B–D) Bubble plots showing the biological processes enriched in genes carrying m6A modification detected in the retinas at p0 (B), p7 (C), and in adults (D).
Figure 5 with 1 supplement
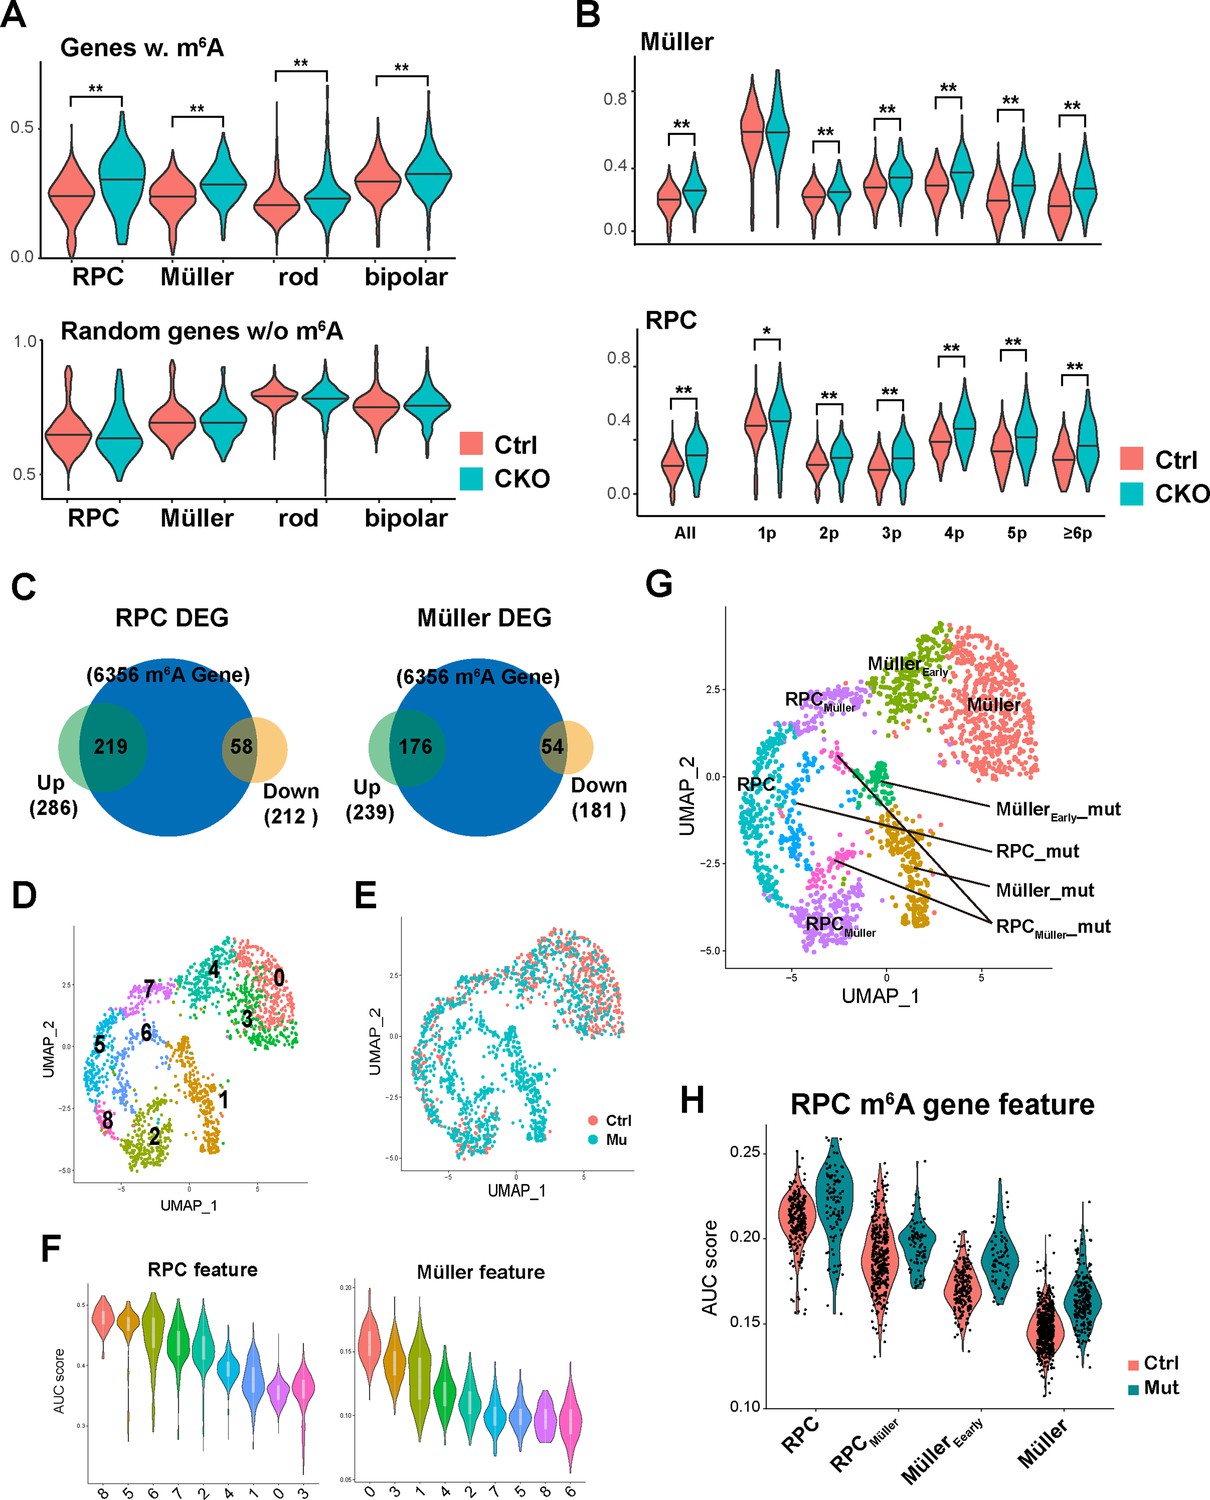
m6A modification promotes the degradation of retinal progenitor cell (RPC) transcripts.
(A) Top: violin plot of single-sample gene set enrichment analysis (ssGSEA) scores illustrating the expression levels of m6A-modified genes in control and Mettl3-CKO retinal cells. Bottom: violin graph of ssGSEA scores of randomly selected genes that do not carry m6A to serve as controls. (B) Violin plots of ssGSEA scores illustrating the expression levels of different groups of m6A-modified genes in control and Mettl3-CKO Müller glia (top) and RPCs (bottom). The genes are grouped based on the number of m6A peaks along their transcript. (C) Pie graphs showing the number of m6A-modified genes that were upregulated (green pies) or downregulated (yellow pie) in Mettl3-mutant RPC or Müller glia clusters. The numbers inside the parentheses indicate the number of genes, and the numbers inside the figure indicate the number of overlapping genes between the two pies. (D) UMAP of reclustered RPCs and Müller glial cells. (E) UMAP of reclustered RPCs and Müller glial cells with colors indicating the sample origin of the cells. (F) Violin plots of area under the curve (AUC) scores of the collective gene expression levels of RPC feature gene set (left) and Müller feature gene set (right) in different clusters of reclustered RPCs and Müller glial cells. Clusters were ordered based on the scores. (G) UMAP graph illustrating the distribution of cell clusters of RPCs, RPCs committed to Müller glial fate (RPCMüller), Müller glial cells just differentiated (MüllerEarly), and Müller glial cells, as well as their corresponding mutant cell clusters (_mut). (H) Violin plot of AUC scores illustrating the activity of m6A-modified RPC genes in the control and mutant cell clusters along the course of RPC-to-Müller transition.
Figure 5—figure supplement 1
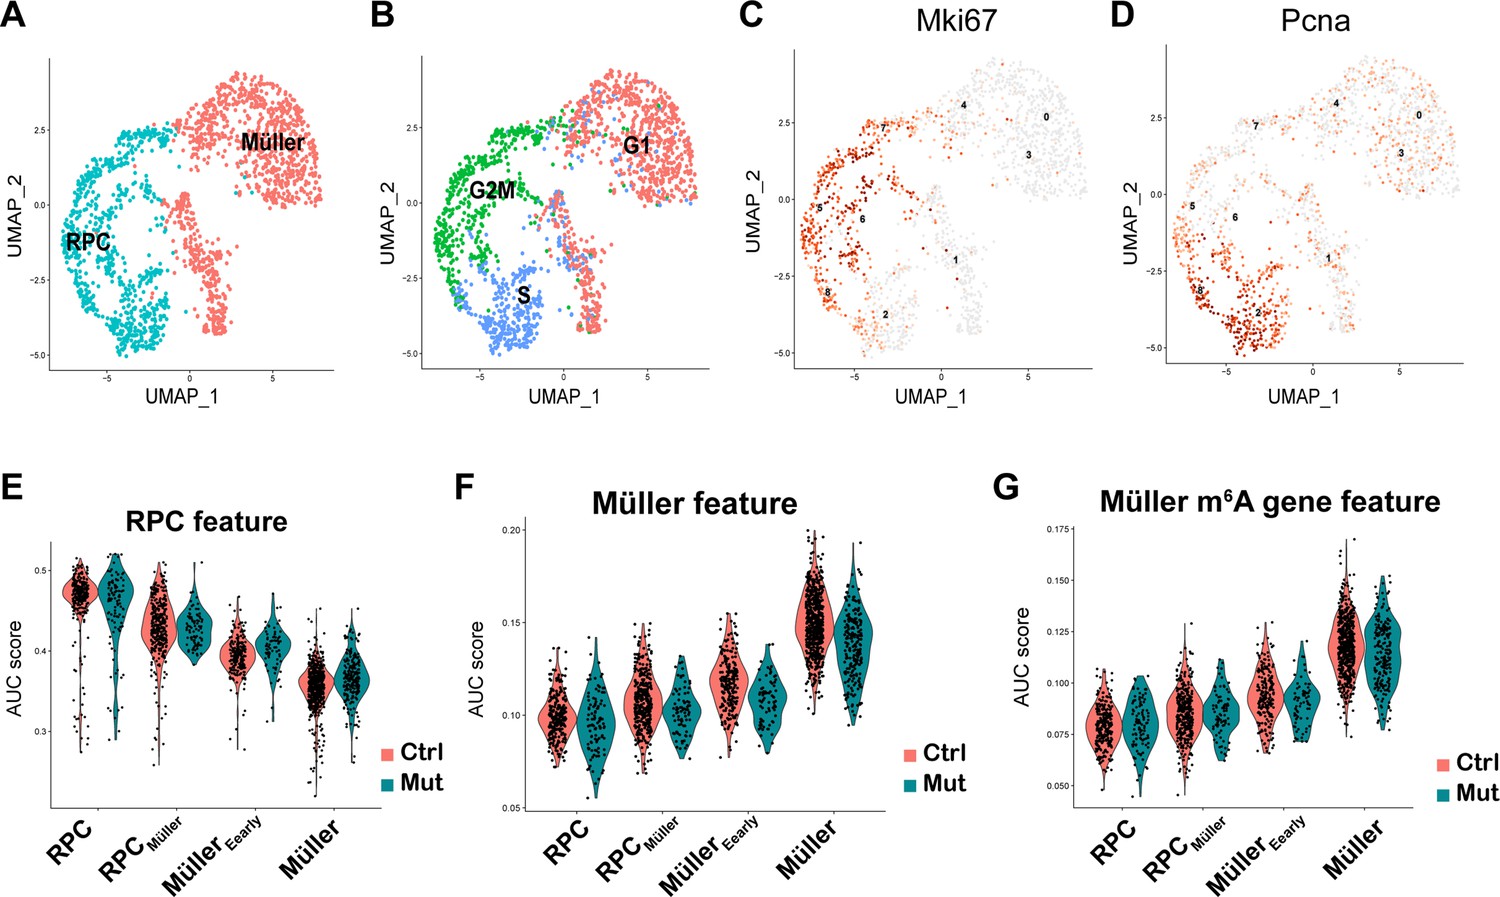
p7 retinal progenitor cells (RPCs) and Müller glial cells.
(A) UMAP of reclustered RPCs and Müller glial cells with colors indicating the cell type. (B) UMAP of reclustered RPCs and Müller glial cells with colors indicating the cell cycle phases. (C, D) UMAP illustrating the expression pattern of Mki67 and Pcna across RPCs and Müller glial cells. (E) Violin plot of area under the curve (AUC) scores illustrating the activity of the RPC feature in the control and mutant cell clusters along the course of the RPC-to-Müller transition. (F) Violin plot of AUC scores illustrating the activity of the Müller feature in the control and mutant cell clusters along the course of the RPC-to-Müller transition. (G) Violin plot of AUC scores illustrating the activity of m6A-modified Müller genes in the control and mutant cell clusters along the course of RPC-to-Müller transition.
Figure 6 with 2 supplements

Overexpression of m6A-regulated genes disturbs late-stage retinogenesis.
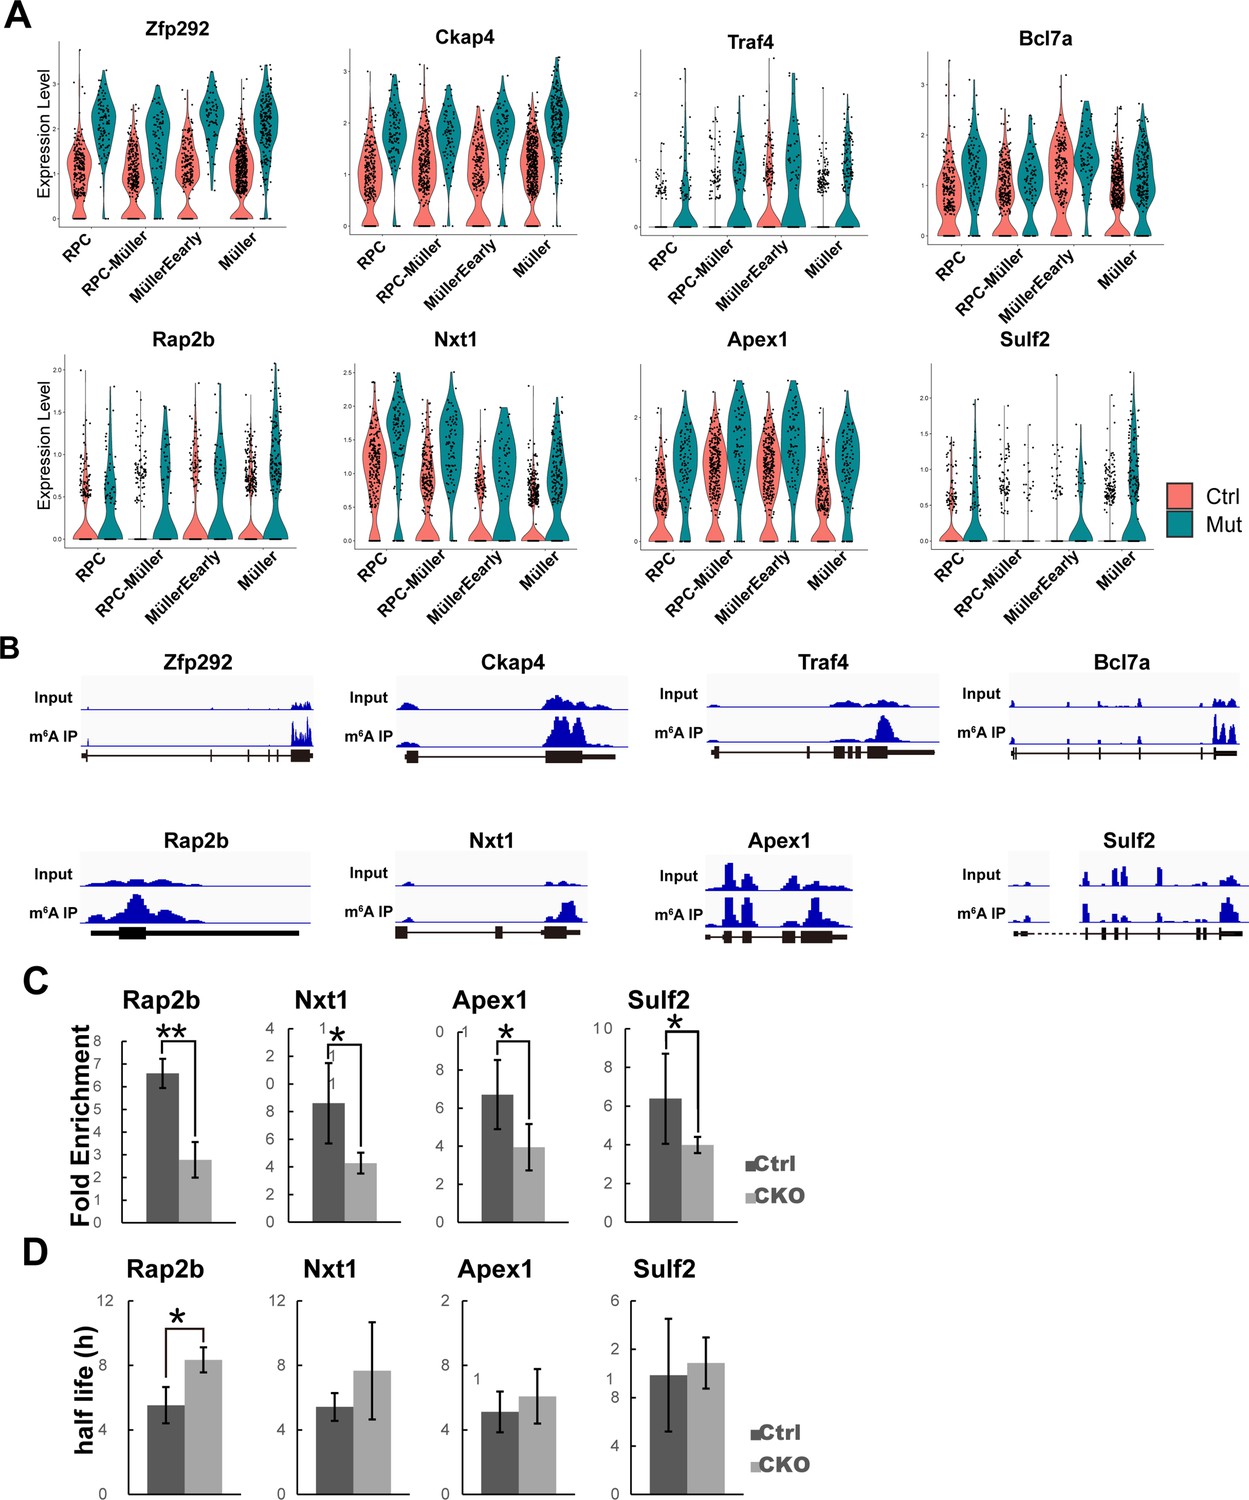
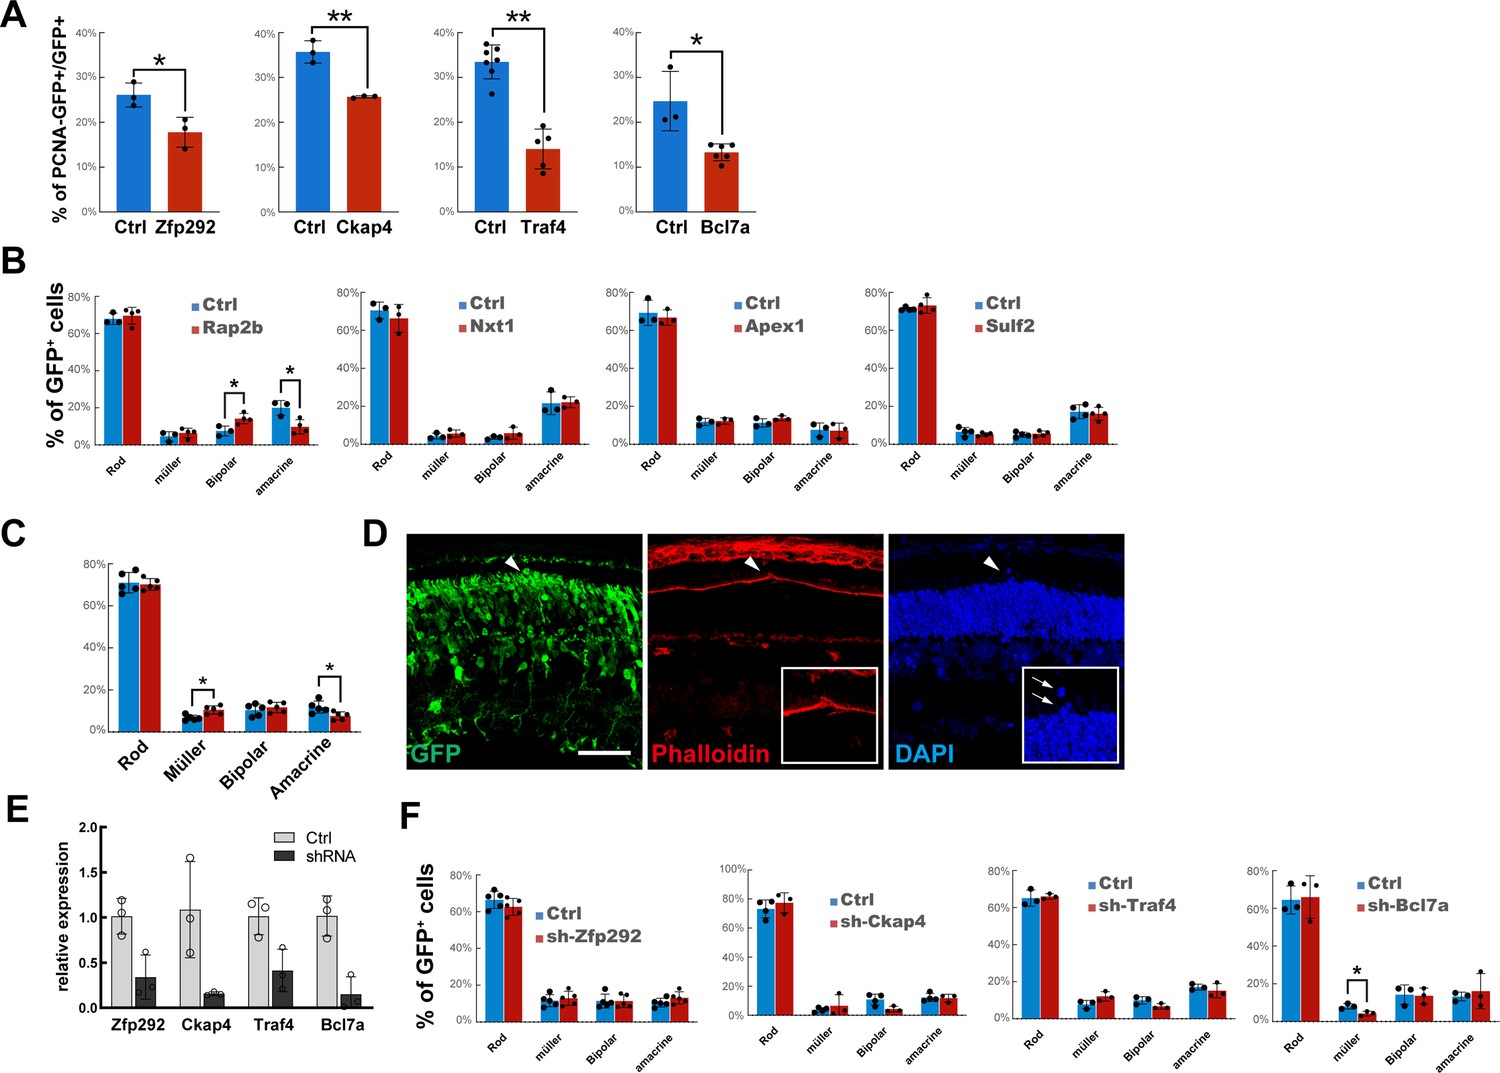
(A) MeRIP-qPCR results revealed downregulation of m6A modification of the transcripts in Mettl3-CKO retinas. (B) Transcript half-life measurements revealed prolonged half-lives of the transcripts in Mettl3-CKO retinas. (C) Confocal images of p3 retinas stained for GFP and KI67. The retinas were transfected with plasmids overexpressing cDNAs of candidate genes via in vivo electroporation at p1. (D) Quantification of the percentage of GFP-labeled electroporated RPCs that were KI67- 48 hr after electroporation. (E) Confocal images of p14 retinas stained for GFP and SOX9. The retinas were transfected with plasmids overexpressing cDNAs of candidate genes via in vivo electroporation at p1. (F) Quantification of the cell compositions of GFP-labeled electroporated cells. The data in (A, B, D, F) are presented as the means ± standard deviation, corresponding to at least three independent biological replicates. *p<0.05, **p<0.01. The scale bars in (C) and (E) are 50 μm.
Figure 6—figure supplement 1
m6A-regulated genes.
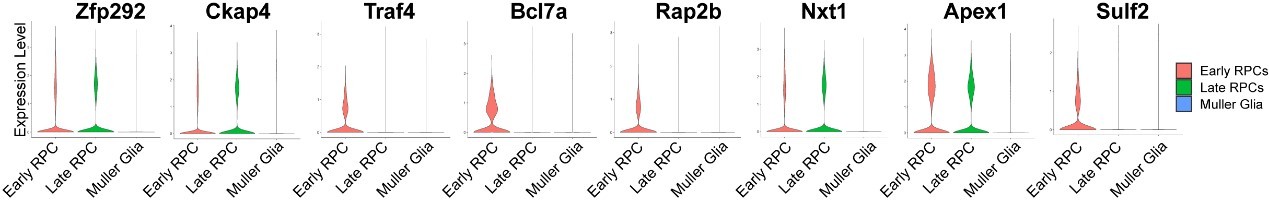
(A) Violin plots of AUC scores illustrating the expression of the individual genes in the control and mutant cell clusters along the course of the retinal progenitor cell (RPC)-to-Müller transition. (B) IGV views illustrating the m6A peak distribution along transcripts of RPC-enriched genes as revealed by MeRIP-seq. (C) MeRIP-qPCR results revealing downregulation of m6A modification of the transcripts in Mettl3-CKO retinas. (D) Transcript half-life measurements of the RPC-enriched genes carrying m6A modification. The data are presented as the means ± standard deviation, corresponding to three independent biological replicates. *p<0.05, **p<0.01.
Figure 6—figure supplement 2
m6A-regulated genes control late-stage retinogenesis.
(A) Quantification of the percentage of GFP-labeled electroporated retinal progenitor cells (RPCs) that were negative for PCNA 48 hr after electroporation. (B) Quantification of the cell composition of GFP-labeled cells overexpressing Rap2b, Nxt1, Apex1, or Sulf2. (C) Quantification of the cell composition of GFP-labeled cells co-overexpressing Zfp292, Ckap4, Traf4, and Bcl7a. (D) Confocal images of a retina stained for GFP and phalloidin. The retinas were transfected with a plasmid mix overexpressing cDNAs of Zfp292, Ckap4, Traf4, and Bcl7a via in vivo electroporation at p1 and were collected at p14. The arrowheads indicate a broken outer limiting membrane (OLM) region, which is further shown at higher magnification in the inserts. The arrows in the insert indicate escaped rods. (E) RT-qPCR results revealing gene knockdown efficiencies of shRNAs targeting individual genes in mouse embryonic fibroblasts (MEFs). MEFs were infected with viruses expressing shRNAs targeting individual genes and harvested 2 days after infection. downregulation of m6A modification of the transcripts in Mettl3-CKO retinas (F) Quantification of the cell composition of GFP-labeled cells expressing shRNAs targeting Zfp292, Ckap4, Traf4, or Bcl7a. The data are presented as the means ± standard deviation, corresponding to at least three independent biological replicates. *p<0.05, **p<0.01. The scale bar in (D) is 50 μm.
Author response image 1
Author response image 2
Author response image 3
Tables
Key resources table
| Reagent type (species) or resource | Designation | Source or reference | Identifiers | Additional information |
|---|---|---|---|---|
| Gene (Mus musculus) | Mettl3 | GenBank | ID: 56335 | |
| Genetic reagent (M. musculus) | Mettl3floxed | Lin et al., 2017 | ||
| Genetic reagent (M. musculus) | Six3-Cre | Furuta et al., 2000 | ||
| Genetic reagent (M. musculus) | Rlbp1-GFP | Vázquez-Chona et al., 2009 | ||
| Antibody | Anti-METTL3 (rabbit monoclonal) | Abcam | Cat# ab195352; RRID:AB_2721254 | 1:500 |
| Antibody | Anti-RECOVERIN (rabbit polyclonal) | Millipore | Cat# AB5585; RRID:AB_2253622 | 1:1000 |
| Antibody | Anti-VSX2 (sheep polyclonal) | Millipore | Cat# AB9014; RRID:AB_262173 | 1:500 |
| Antibody | Anti-SOX9 (rabbit polyclonal) | Millipore | Cat# ABS571; RRID:AB_2783876 | 1:500 |
| Antibody | Anti-CALBINDIN (rabbit polyclonal) | Swant | Cat# CB38; RRID:AB_10000340 | 1:500 |
| Antibody | Anti-SYNTAXIN (mouse monoclonal) | Sigma | Cat# S0664; RRID:AB_477483 | 1:200 |
| Antibody | Anti-BRN3A (mouse monoclonal) | Millipore | Cat# MAB1585; RRID:AB_94166 | 1:100 |
| Antibody | Anti-GFP (chicken polyclonal) | Abcam | Cat# ab13970; RRID:AB_300798 | 1:2000 |
| Antibody | Anti-N-CADHERIN (rabbit polyclonal) | Santa Cruz | Cat# sc-7939; RRID:AB_647794 | 1:1000 |
| Antibody | Anti-GS (mouse monoclonal) | BD Biosciences | Cat# 610518; RRID:AB_397880 | 1:2000 |
| Antibody | Anti-GFAP (mouse monoclonal) | Sigma | Cat# G3893; RRID:AB_477010 | 1:2000 |
| Antibody | Anti-BrdU (mouse monoclonal) | GE Healthcare | Cat# RPN202 | 1:50 |
| Antibody | Anti-pH3 (mouse monoclonal) | Cell Signaling | Cat# 9706; RRID:AB_331748 | 1:2000 |
| Antibody | Anti-KI67 (rabbit polyclonal) | Abcam | Cat# ab15580; RRID:AB_443209 | 1:500 |
| Antibody | Alexa Fluor 488 donkey anti-mouse (donkey polyclonal) | Thermo Fisher | Cat# A21202 | 1:1000 |
| Antibody | Alexa Fluor 568 donkey anti-mouse (donkey polyclonal) | Thermo Fisher | Cat# A10037 | 1:1000 |
| Antibody | Alexa Fluor 488 donkey anti-rabbit (donkey polyclonal) | Thermo Fisher | Cat# A21206 | 1:1000 |
| Antibody | Alexa Fluor 568 donkey anti-rabbit (donkey polyclonal) | Thermo Fisher | Cat# A10042 | 1:1000 |
| Antibody | Alexa Fluor 488 donkey anti-chicken (donkey polyclonal) | Jackson ImmunoResearch | Cat# 703-296-155 | 1:1000 |
| Recombinant DNA reagent | pCAGIG (plasmid) | Addgene | Cat# 11159 | CDS overexpression |
| Recombinant DNA reagent | pSicoR (plasmid) | Addgene | Cat# 11579 | shRNA expression |
| Sequence-based reagent | Rsp14 forward | This paper | MeRIP-qPCR primers | acctggagcccagtcagccc |
| Sequence-based reagent | Rsp14 reverse | This paper | MeRIP-qPCR primers | cacagacggcgaccacgacg |
| Sequence-based reagent | Pax6 forward | This paper | MeRIP-qPCR primers | actctgccaatgactatgtg |
| Sequence-based reagent | Pax6 reverse | This paper | MeRIP-qPCR primers | ctccagttcaggacagttac |
| Sequence-based reagent | Sox2 forward | This paper | MeRIP-qPCR primers | ctggactgcgaactggagaa |
| Sequence-based reagent | Sox2 reverse | This paper | MeRIP-qPCR primers | actctcctctttttgcaccc |
| Sequence-based reagent | Rax forward | This paper | MeRIP-qPCR primers | ggaaattcagcctcgctgtc |
| Sequence-based reagent | Rax reverse | This paper | MeRIP-qPCR primers | ccaggtcaagatccttggtc |
| Sequence-based reagent | Zfp292 forward | This paper | MeRIP-qPCR primers | gggaaataacgaatttcagg |
| Sequence-based reagent | Zfp292 reverse | This paper | MeRIP-qPCR primers | ctctcttcaaattaccaggc |
| Sequence-based reagent | Ckap4 forward | This paper | MeRIP-qPCR primers | ggaacgacctggataggttg |
| Sequence-based reagent | Ckap4 reverse | This paper | MeRIP-qPCR primers | cgtaagaaactgtgcccacac |
| Sequence-based reagent | Traf4 forward | This paper | MeRIP-qPCR primers | ggatgatgcggttttcatccg |
| Sequence-based reagent | Traf4 reverse | This paper | MeRIP-qPCR primers | ccagtttcagatccagtcccg |
| Sequence-based reagent | Bcl7a forward | This paper | MeRIP-qPCR primers | ccaagaagaacctagagcgg |
| Sequence-based reagent | Bcl7a reverse | This paper | MeRIP-qPCR primers | ggcagtcacttgaaggttcg |
| Sequence-based reagent | Rap2b forward | This paper | MeRIP-qPCR primers | ggacttggagggtgaacgtga |
| Sequence-based reagent | Rap2b reverse | This paper | MeRIP-qPCR primers | gatgtctccatgaaggggcag |
| Sequence-based reagent | Nxt1 forward | This paper | MeRIP-qPCR primers | ccagtaacacggtgtggaag |
| Sequence-based reagent | Nxt1 reverse | This paper | MeRIP-qPCR primers | gagactggcatttctctgcag |
| Sequence-based reagent | Apex1 forward | This paper | MeRIP-qPCR primers | gttgggatgaagccttcc |
| Sequence-based reagent | Apex1 reverse | This paper | MeRIP-qPCR primers | catgagccacattgagatcc |
| Sequence-based reagent | Sulf2 forward | This paper | MeRIP-qPCR primers | ctttggagaaagcacggac |
| Sequence-based reagent | Sulf2 reverse | This paper | MeRIP-qPCR primers | cttctgagccagccaggtc |
| Other | Mettl3 | GenBank | CGTCAGTATCTTGGGCAAATT | shRNA targeting site |
| Other | Zfp292 | GenBank | TGTGGCAGTAAGCCATATATA | shRNA targeting site |
| Other | Ckap4 | GenBank | ACGACCTGGATAGGTTGTTTC | shRNA targeting site |
| Other | Traf4 | GenBank | GCGTATAGTTCCCACTAATTT | shRNA targeting site |
| Other | Bcl7a | GenBank | CGGAGCCAAAGGTTGATGATA | shRNA targeting site |
Additional files
-
MDAR checklist
- https://cdn.elifesciences.org/articles/79994/elife-79994-mdarchecklist1-v1.docx
-
Source data 1
List of differentially expressed genes (DEGs) between control and mutant retinal progenitor cell (RPC) clusters.
- https://cdn.elifesciences.org/articles/79994/elife-79994-data1-v1.xlsx
-
Source data 2
List of differentially expressed genes (DEGs) between control and mutant Müller glial clusters.
- https://cdn.elifesciences.org/articles/79994/elife-79994-data2-v1.xlsx
-
Source data 3
List of m6A peaks detected by MeRIP-seq in the retina.
- https://cdn.elifesciences.org/articles/79994/elife-79994-data3-v1.xlsx
-
Source data 4
List of GO terms enriched in retinal m6A epitranscriptomes.
- https://cdn.elifesciences.org/articles/79994/elife-79994-data4-v1.xlsx
Download links
A two-part list of links to download the article, or parts of the article, in various formats.
Downloads (link to download the article as PDF)
Open citations (links to open the citations from this article in various online reference manager services)
Cite this article (links to download the citations from this article in formats compatible with various reference manager tools)
m6A epitranscriptomic modification regulates neural progenitor-to-glial cell transition in the retina
eLife 11:e79994.
https://doi.org/10.7554/eLife.79994


