Specific deletion of Axin1 leads to activation of β-catenin/BMP signaling resulting in fibular hemimelia phenotype in mice
- Department of Orthopedic Surgery, Rush University Medical Center, United States
- Research Center for Computer-aided Drug Discovery, Shenzhen Institutes of Advanced Technology, Chinese Academy of Sciences, China
- Faculty of Pharmaceutical Sciences, Shenzhen Institutes of Advanced Technology, Chinese Academy of Sciences, China
- Department of Orthopedic Surgery, Honghui Hospital, Xi’an JiaoTong University, College of Medicine, China
- Department of Orthopedic Surgery, Shanghai Jiaotong University Affiliated Sixth People’s Hospital, China
- Department of Osteoporosis and Bone Diseases, Shanghai Jiaotong University Affiliated Sixth People’s Hospital, China
- School of Medicine, Southern University of Science and Technology, China
- Department of Wound Repair and Rehabilitation, State Key Laboratory of Trauma, Burns and Combined Injury, Daping Hospital, Army Medical University, China
Figures
Figure 1

Deletion of Axin1 in limb mesenchymal cells leads to alterations in expression of Axin1 and β-catenin proteins in long bones of Axin1 conditional knockout (cKO) mice.
We have collected long bones of 3-week-old Axin1 cKO mice and Cre-negative littermates and examined changes in Axin1 and β-catenin protein levels by immunohistochemistry (IHC). The results demonstrated that Axin1 expression in joint tissues, such as articular cartilage (blue arrowhead), was reduced by 61% (n=3, means ± SD) (A, B, Figure 1—source data 1–2). In contrast, β-catenin expression levels in articular cartilage (red arrowheads) were increased 2.8-fold in Axin1 cKO mice (n=3, means ± SD)(C, D, Figure 1—source data 1 and 3).
-
Figure 1—source data 1
Expression of Axin1 and β-catenin proteins in lower limbs of Cre-negative control and Axin1 conditional knockout (cKO) mice.
- https://cdn.elifesciences.org/articles/80013/elife-80013-fig1-data1-v2.zip
-
Figure 1—source data 2
Original numbers used for quantification of percentage of Axin1-positive cells in lower limbs in Cre-negative control and Axin1 conditional knockout (cKO) mice.
- https://cdn.elifesciences.org/articles/80013/elife-80013-fig1-data2-v2.zip
-
Figure 1—source data 3
Original numbers used for quantification of percentage of β-catenin-positive cells in lower limbs in Cre-negative control and Axin1 conditional knockout (cKO) mice.
- https://cdn.elifesciences.org/articles/80013/elife-80013-fig1-data3-v2.zip
Figure 2
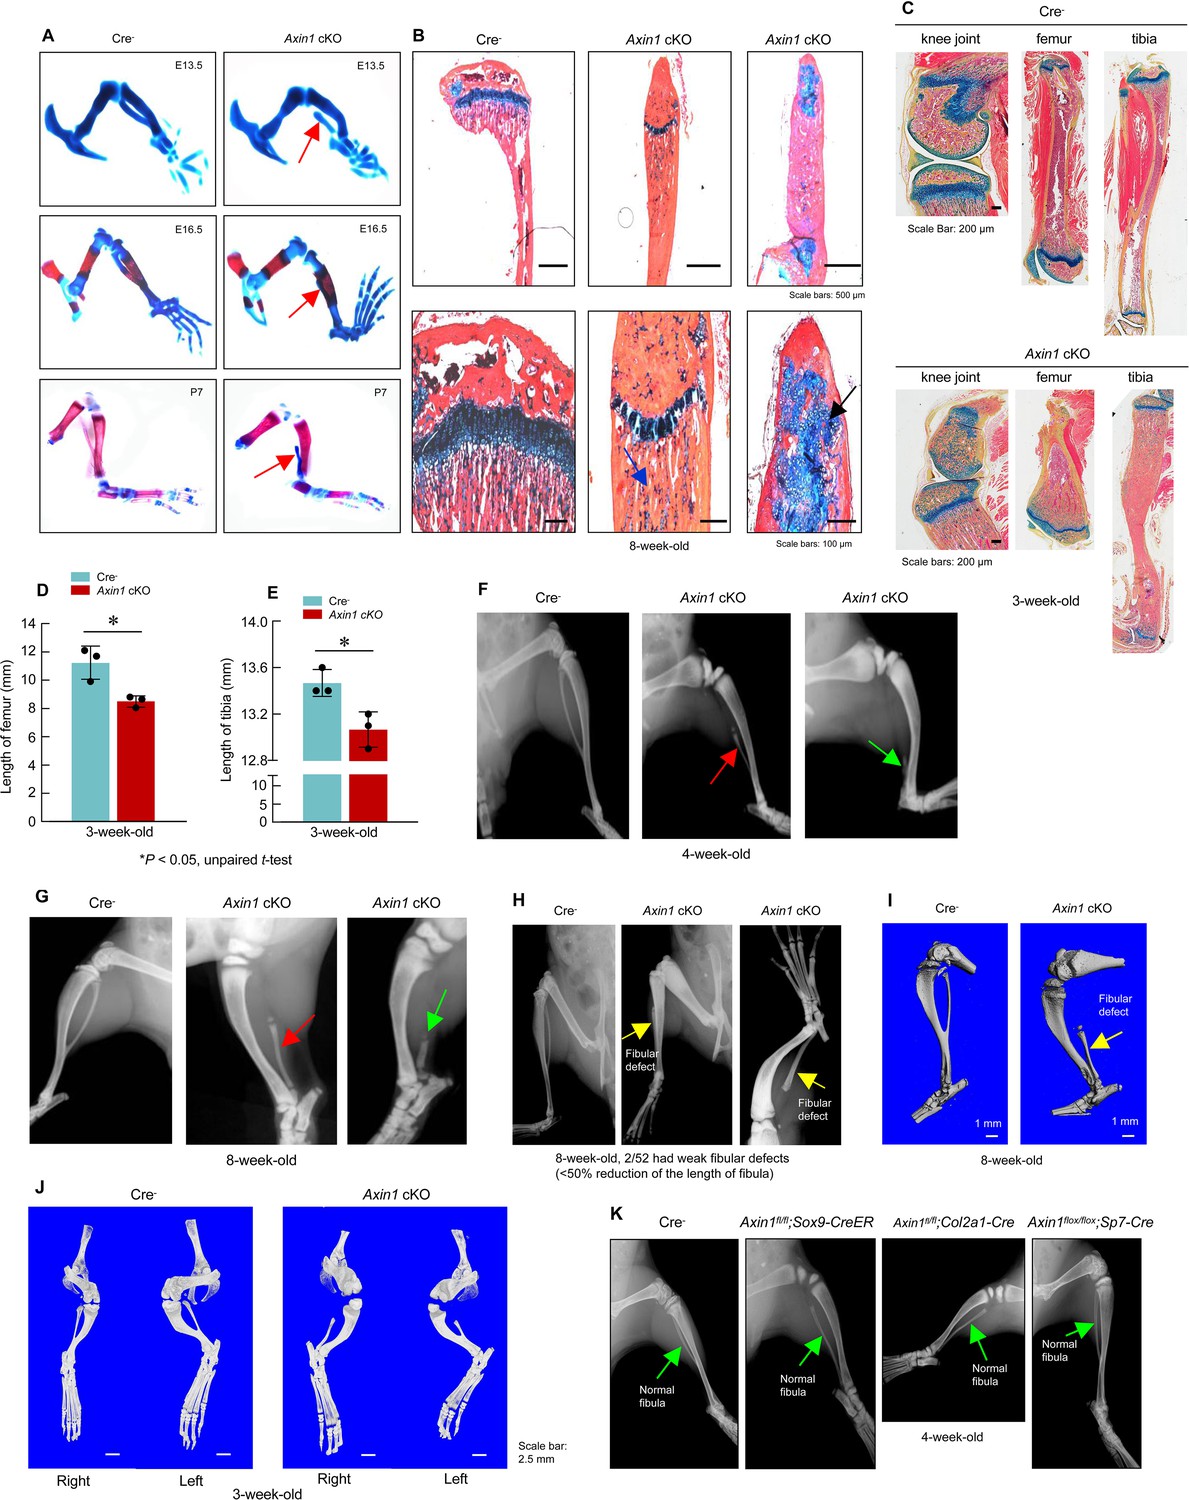
Deletion of Axin1 in limb mesenchymal cells leads to defects resembling to fibular hemimelia (FH) disease.
(A) Axin1 conditional knockout (cKO) embryos and postnatal mice showed partial development of fibula, which did not mineralize even at day 7 of postnatal stage (red arrows, Figure 2—source data 1). (B) Histological analysis showed that disorganized fibular structure (black arrow) and abnormal cartilage development were observed in 8-week-old Axin1 cKO mice (Figure 2—source data 1). (C–E) In addition, the lengths of tibiae and femorae were significantly decreased in 3-week-old Axin1 cKO mice (n=3, means ± SD) (Figure 2—source data 1–3). (F, G) We have generated and analyzed 52 Axin1 cKO mice (Figure 2—source data 1). Defects in fibular development were observed in all 52 Axin1 cKO mice that we have analyzed. Radiographic analysis showed that the fibula in some of Axin1 cKO mice was almost completely absent (>50% loss, 27/52) where only a distal, vestigial fragment was present (green arrow, right panel). The other Axin1 cKO mice had partial absence of the fibula (30–50% loss, 23/52) (red arrow, middle panel) in which the proximal portion of the fibula was absent while the distal portion was present in 4-week-old Axin1 cKO mice. (H) Radiographic and microcomputed tomography (μCT) analyses showed that fibulae were developed over 50% of their length in few Axin1 cKO mice (2/52) (Figure 2—source data 1). (I) Results of μCT analysis also showed fibular defects in 8-week-old Axin1 cKO mice (Figure 2—source data 1). (J) μCT analysis also showed that fibular defects were observed in hindlimbs at both right and left sides (Figure 2—source data 1). (K) To determine the role of Axin1 in other cell populations, we generated Axin1 cKO mice in other cell types, such as Sox9-expressing cells (Axin1flox/flox;Sox9-CreER), Col2a1-expressing cells (Axin1flox/flox;Col2a1-Cre), and Sp7-expressing cells (Axin1flox/flox;Sp7-Cre). X-ray radiographic analysis showed that deletion of Axin1 in Sox9-, Col2a1-, and Sp7-expressing cells did not affect lower limb development (Figure 2—source data 1).
-
Figure 2—source data 1
Histology, X-ray, and microcomputed tomography (μCT) analysis in Cre-negative control and Axin1 conditional knockout (cKO) mice.
- https://cdn.elifesciences.org/articles/80013/elife-80013-fig2-data1-v2.zip
-
Figure 2—source data 2
Original lengths for quantification of femorae of Cre-negative control and Axin1 conditional knockout (cKO) mice.
- https://cdn.elifesciences.org/articles/80013/elife-80013-fig2-data2-v2.zip
-
Figure 2—source data 3
Original lengths for quantification of tibiae of Cre-negative control and Axin1 conditional knockout (cKO) mice.
- https://cdn.elifesciences.org/articles/80013/elife-80013-fig2-data3-v2.zip
Figure 3
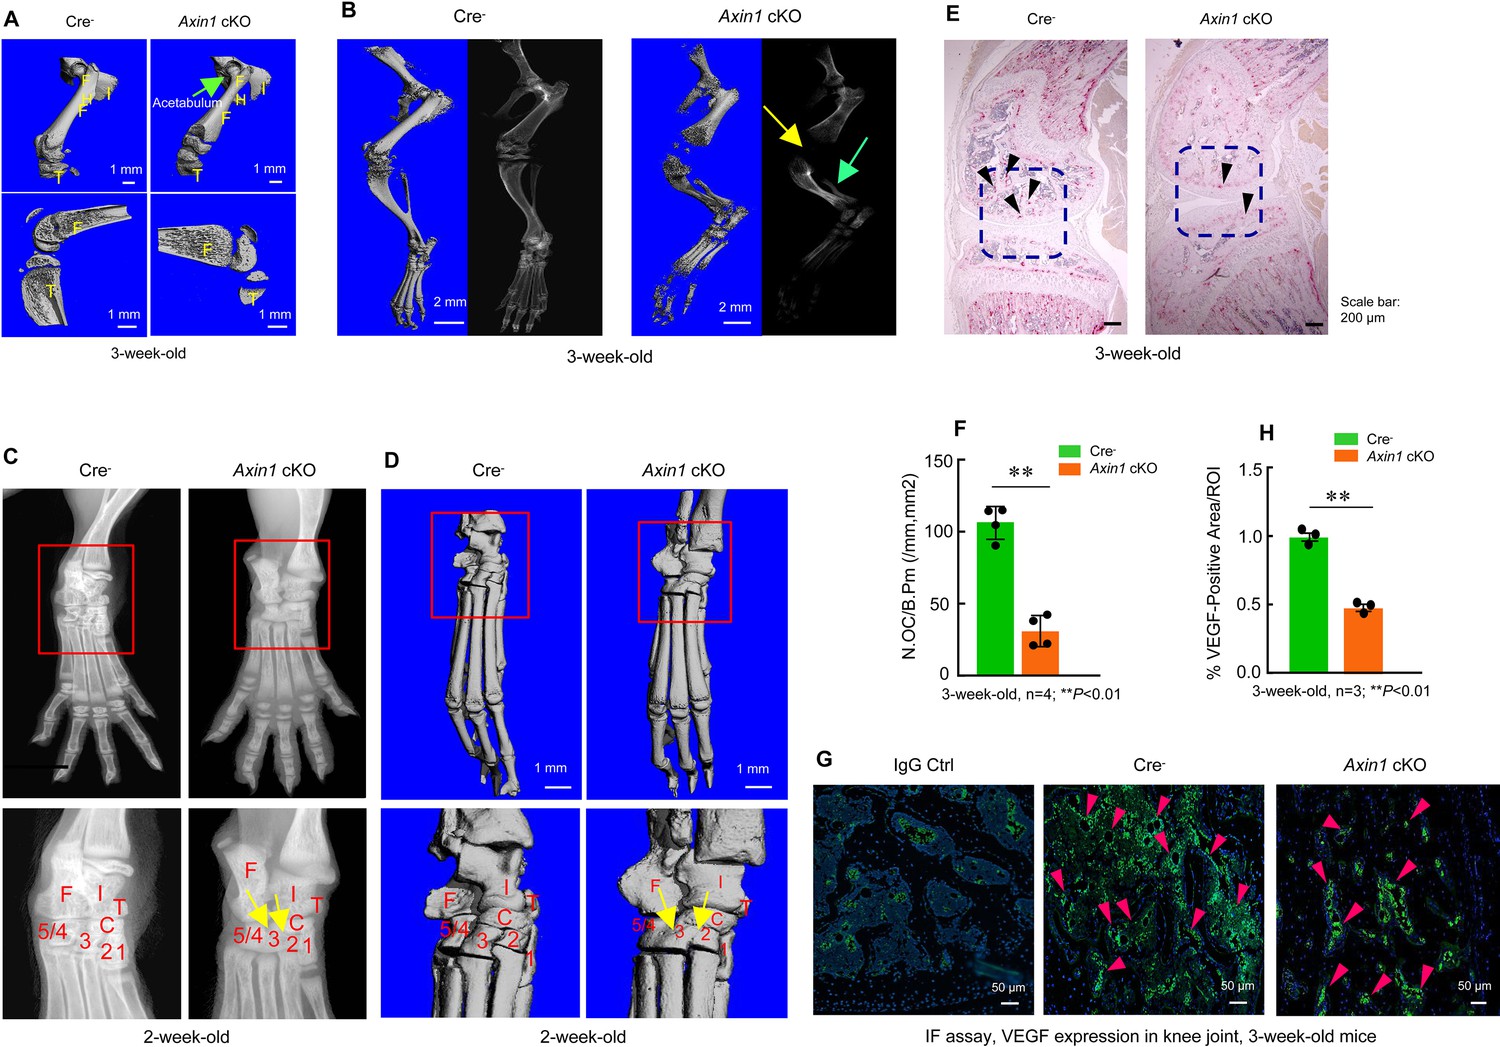
Axin1 conditional knockout (cKO) mice had multiple defects in lower limb.
(A) Microcomputed tomography (μCT) analysis showed that Axin1 KO mice (3-week-old) had defects in femerae including increased width of femorae and the dysplasia of acetabulum was found in 3-week-old Axin1 cKO mice (Figure 3—source data 1). (B) μCT and X-ray analyses showed that defects in fibular and joint development in 3-week-old Axin1 cKO mice (Figure 3—source data 1). (C, D) X-ray and μCT analyses showed that the tarsal elements 2, 3, and 4 of ankle joint were fused in 2-week-old Axin1 cKO mice (Figure 3—source data 1). (E, F) We performed TRAP staining and found that reduction in osteoclast numbers in 3-week-old Axin1 cKO mice (Figure 3—source data 1–2). (G, H) Expression of VEGF was analyzed by immunofluorescent (IF) staining and significant decrease in VEGF expression was found in 3-week-old Axin1 cKO mice (Figure 3—source data 1 and 3).
-
Figure 3—source data 1
Microcomputed tomography (μCT), X-ray, TRAP staining, and immunofluorescence (IF) analysis of Cre-negative control and Axin1 conditional knockout (cKO) mice.
- https://cdn.elifesciences.org/articles/80013/elife-80013-fig3-data1-v2.zip
-
Figure 3—source data 2
Original numbers used for quantification of osteoclast numbers in Cre-negative control and Axin1 conditional knockout (cKO) mice.
- https://cdn.elifesciences.org/articles/80013/elife-80013-fig3-data2-v2.zip
-
Figure 3—source data 3
Original numbers used for quantification of percentage of VEGF-positive cells in Cre-negative control and Axin1 conditional knockout (cKO) mice.
- https://cdn.elifesciences.org/articles/80013/elife-80013-fig3-data3-v2.zip
Figure 4
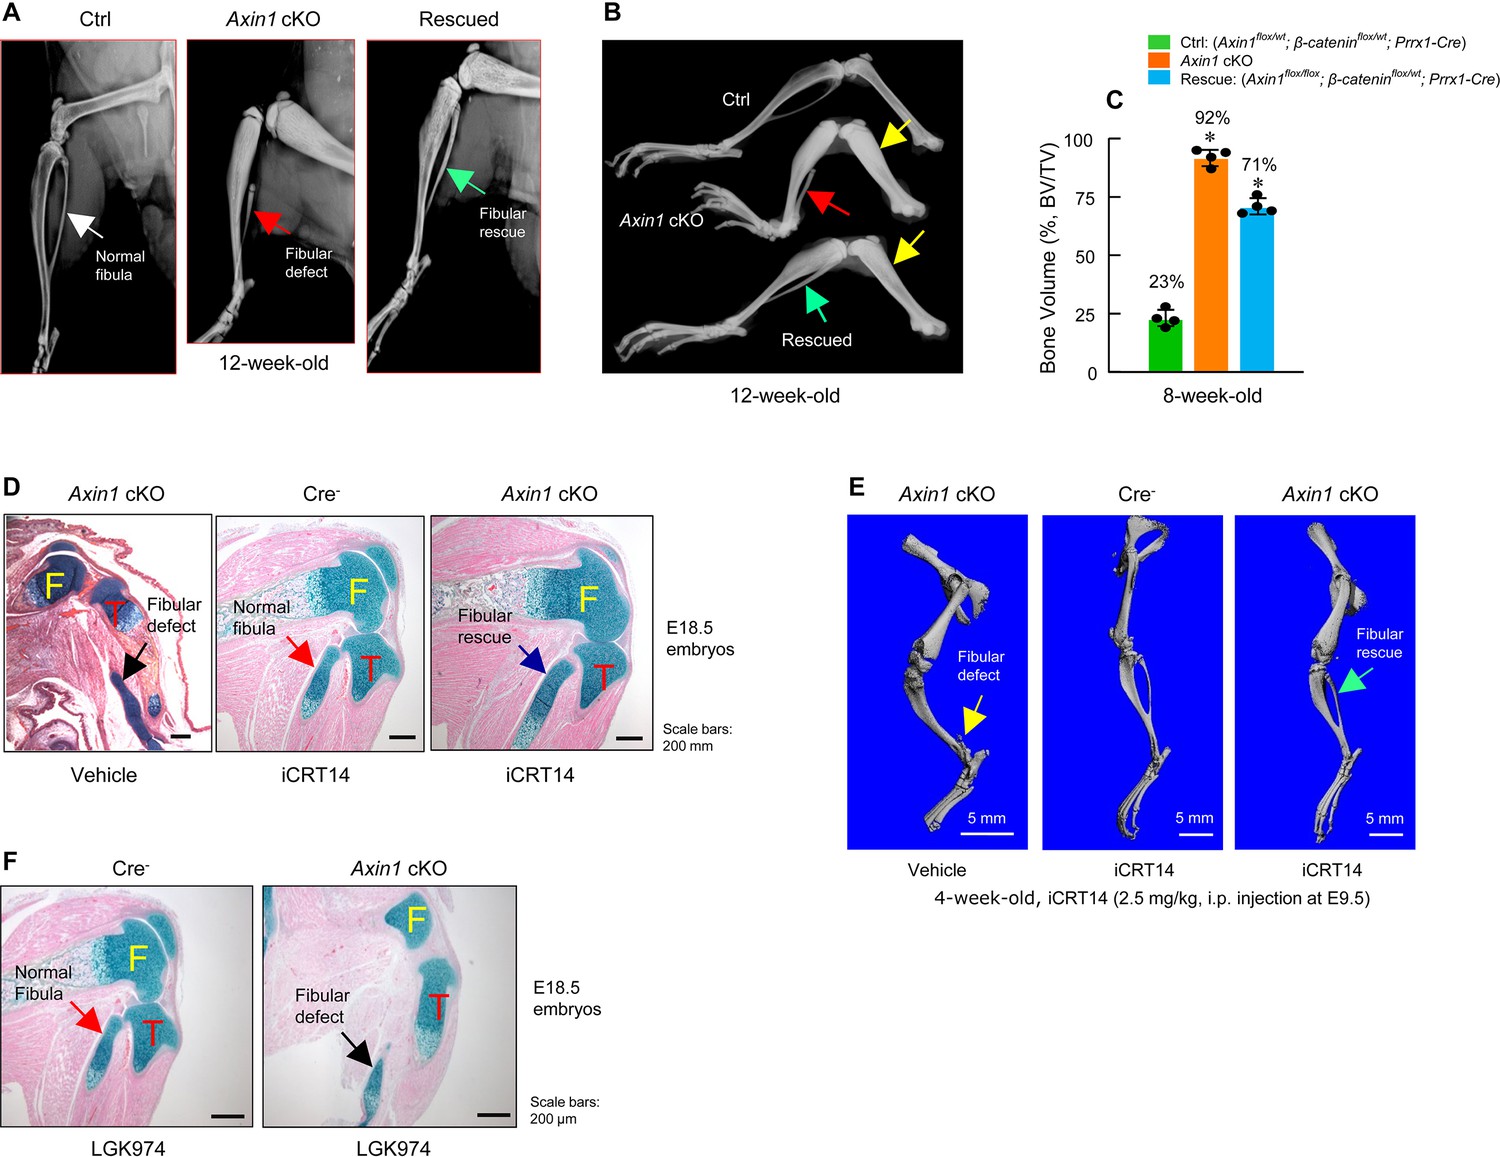
Inhibition of β-catenin signaling reverses defects in skeletal development observed in Axin1 conditional knockout (cKO) mice.
(A, B) X-ray radiographic analysis showed that defects in fibular development observed in Axin1 cKO mice (red arrows) were significantly reversed (green arrows) by deletion of one allele of β-catenin gene (rescued) (12-week-old mice) (Figure 4—source data 1). Yellow arrows showed bone mass was increased in Axin1 cKO mice and was partially reversed in rescued mice. Radiographic analysis showed that deletion of one allele of β-catenin gene significantly reversed defects in fibular development in 12-week-old Axin1 cKO mice. (C) Microcomputed tomography (μCT) analysis of hindlimbs of 8-week-old mice, including Ctrl: (Axin1flox/wt;β-cateninflox/wt;Prrx1-Cre), Axin1 cKO, and rescued: (Axin1flox/flox;β-cateninflox/wt;Prrx1-Cre) mice, showed that bone volume was reduced from 92% in Axin1 cKO mice to 71% in rescued mice (n=4) (Figure 4—source data 2). (D) Results of histological analysis of E18.5 embryos showed that treatment with β-catenin inhibitor, iCRT14 (2.5 mg/kg, i.p. injection to the pregnant mothers at E9.5 stage), almost completely reversed defects in fibular development in Axin1 cKO embryos (Figure 4—source data 1). (E) μCT analysis confirmed that the treatment with iCRT14 reversed defects in lower limb development in Axin1 cKO mice, such as lack of fibula and bowed tibia (Figure 4—source data 1). (F) In contrast, the treatment with LGK974 (inhibitor of Wnt secretion) failed to reverse fibular hemimelia (FH) phenotype observed in Axin1 cKO mice. Data presented in (C) were analyzed by one-way ANOVA followed by the Tukey’s post hoc test (n=4, means ± SD, *p<0.05) (Figure 4—source data 1).
-
Figure 4—source data 1
X-ray, histology, and microcomputed tomography (μCT) analysis of Axin1 conditional knockout (cKO) mice with or without iCRT14 treatment.
- https://cdn.elifesciences.org/articles/80013/elife-80013-fig4-data1-v2.zip
-
Figure 4—source data 2
Original data used to quantify the percentage of bone volume in Axin1 conditional knockout (cKO) mice with or without iCRT14 treatment.
- https://cdn.elifesciences.org/articles/80013/elife-80013-fig4-data2-v2.zip
Figure 5
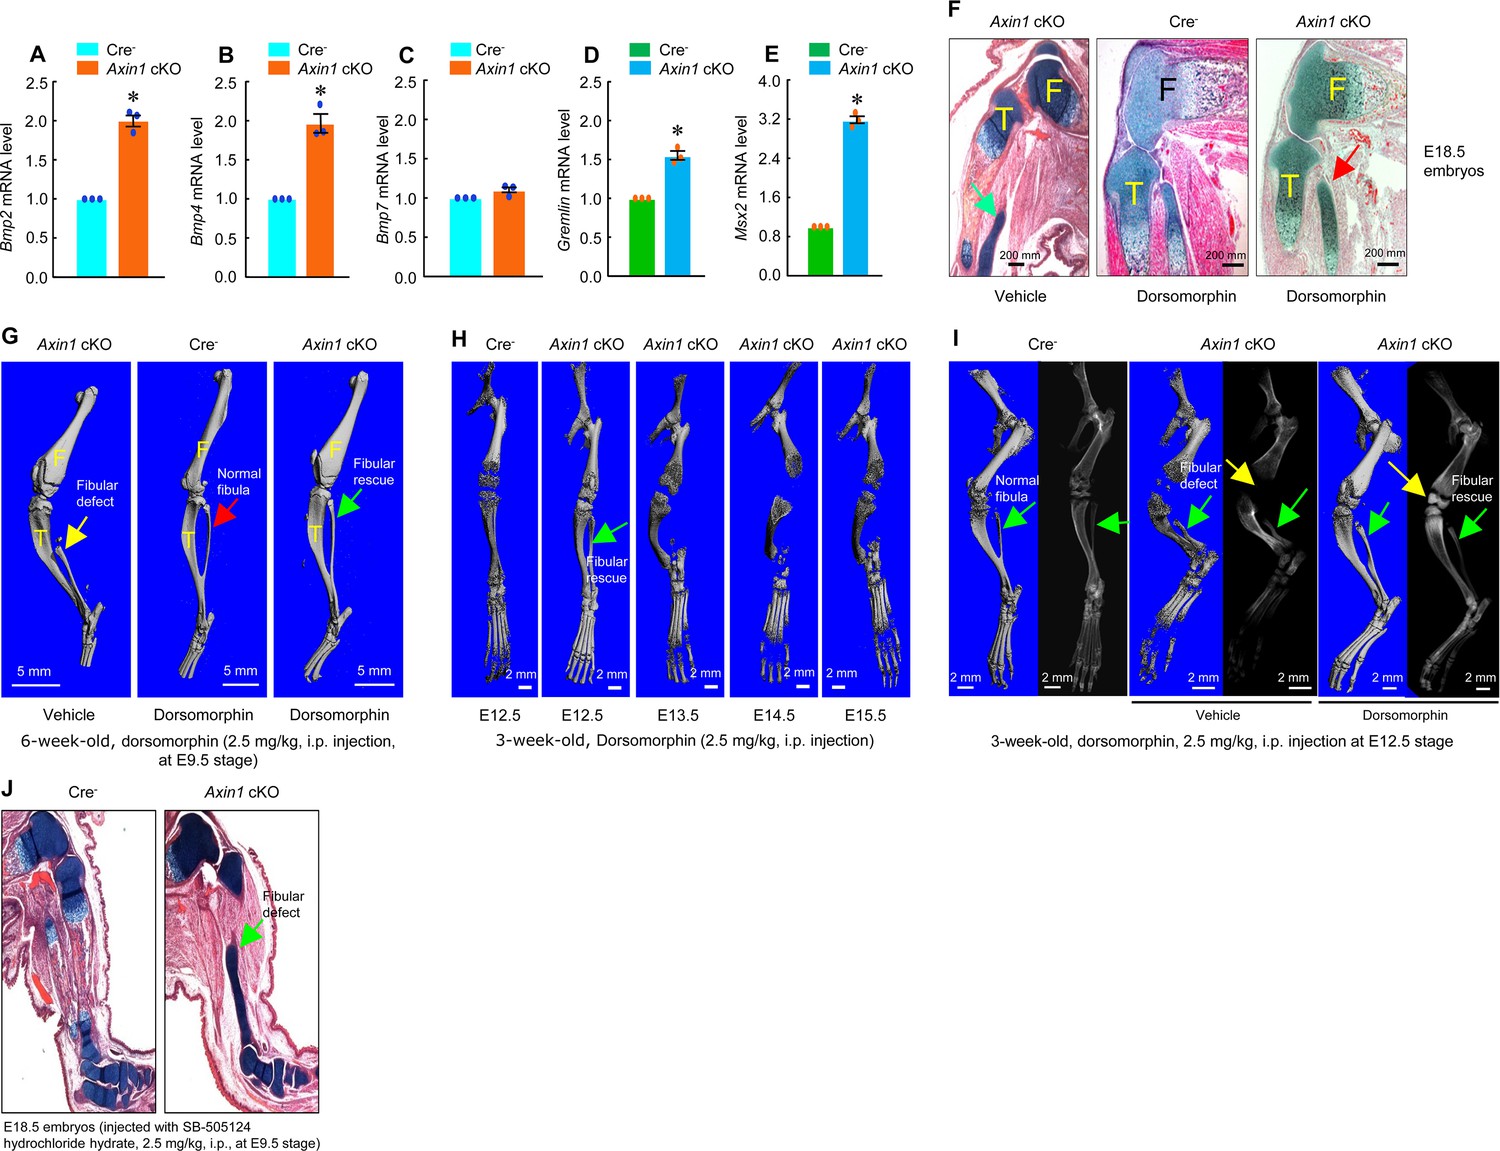
Inhibition of bone morphogenetic protein (BMP) signaling significantly reversed skeletal phenotype observed in Axin1 conditional knockout (cKO) mice.
(A–E) BMP signaling was upregulated in limb bud cells derived from E12.5 Axin1 cKO embryos. Real-time PCR analysis showed that expression of Bmp2, Bmp4, Bmp7, Gremlin, and Msx2 was significantly upregulated in limb bud cells derived from E12.5 Axin1 cKO embryos (*p<0.05, unpaired Student’s t-test, n=3, means ± SD) (Figure 5—source data 1–5). (F) Inhibition of BMP signaling by the treatment with BMP inhibitor, dorsomorphin (2.5 mg/kg, i.p. injection to E9.5 mothers), reversed fibular defects of Axin1 cKO embryos (E18.5) (Figure 5—source data 6). Green arrow (left panel): the defect in the fibular development. (G) Microcomputed tomography (μCT) analysis showed that the treatment with dorsomorphin (2.5 mg/kg, i.p. injection to E9.5 mothers) completely reversed defects in fibular development in 6-week-old Axin1 cKO mice (Figure 6—source data 6). (H) We also examined stage-specific effect of dorsomorphin treatment and found that dorsomorphin could effectively reverse defects in fibular development up to E12.5. No rescuing effect could be observed when dorsomorphin was administered at later stages, such as E13.5, E14.5, and E15.5 (Figure 5—source data 6). (I) Dorsomorphin could significantly reverse defects in fibular development when injected at E12.5 stage (Figure 5—source data 6). (J) In contrast, injection of same amount of TGF-β inhibitor SB-505124 had no significant effect on fibular development (Figure 5—source data 6).
-
Figure 5—source data 1
Original numbers used for quantification of RNA relative Bmp2 expression in Cre-negative control and Axin1 conditional knockout (cKO) mice.
- https://cdn.elifesciences.org/articles/80013/elife-80013-fig5-data1-v2.zip
-
Figure 5—source data 2
Original numbers used for quantification of RNA relative Bmp4 expression in Cre-negative control and Axin1 conditional knockout (cKO) mice.
- https://cdn.elifesciences.org/articles/80013/elife-80013-fig5-data2-v2.zip
-
Figure 5—source data 3
Original numbers used for quantification of RNA relative Bmp7 expression in Cre-negative control and Axin1 conditional knockout (cKO) mice.
- https://cdn.elifesciences.org/articles/80013/elife-80013-fig5-data3-v2.zip
-
Figure 5—source data 4
Original numbers used for quantification of RNA relative expression of Gremlin in Cre-negative control and Axin1 conditional knockout (cKO) mice.
- https://cdn.elifesciences.org/articles/80013/elife-80013-fig5-data4-v2.zip
-
Figure 5—source data 5
Original numbers used forFigure 5—source data 5 quantification of RNA relative expression of Msx2 in Cre-negative control and Axin1 conditional knockout (cKO) mice.
- https://cdn.elifesciences.org/articles/80013/elife-80013-fig5-data5-v2.zip
-
Figure 5—source data 6
Histology, microcomputed tomography (μCT), and X-ray analysis of Axin1 conditional knockout (cKO) mice treated with or without dorsomorphin or SB-505124.
- https://cdn.elifesciences.org/articles/80013/elife-80013-fig5-data6-v2.zip
Figure 6
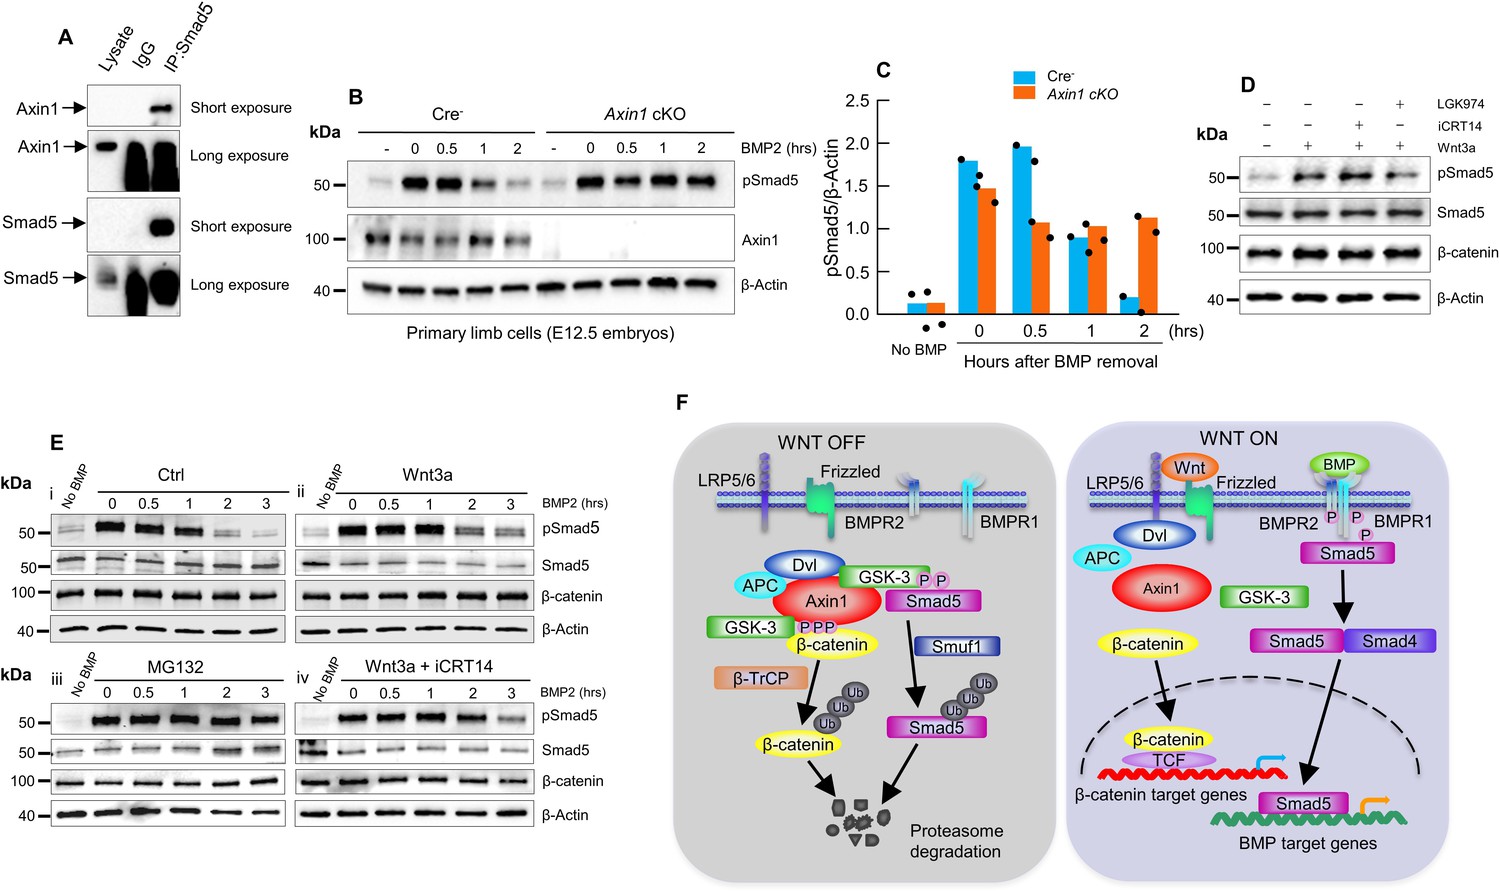
Axin1 regulates bone morphogenetic protein (BMP) signaling through increasing the degradation of pSmad5.
(A) Interaction of endogenous Axin1 with Smad5 in C3H10T1/2 cells. Co-immunoprecipitation (co-IP) assay was performed using the anti-Smad5 antibody followed by Western blot analysis using the anti-Axin1 antibody (Figure 6—source data 1). (B) Pulse-chase experiments were performed showing that the duration of endogenous pSmad5 were extended in Axin1-deficient limb cells. Primary limb cells from Cre- and Axin1 cKO embryos (E12.5) were treated with BMP2 for 0.5 hr, followed by BMP2 wash-out. Cell lysates were extracted at different time points and analyzed by Western blot analysis using indicated antibodies (Figure 6—source data 2). (C) Quantification of the pSmad5 band (Figure 6—source data 3). (D) Wnt3a regulated Smad5 phosphorylation is independent of β-catenin. C3H10T1/2 cells were treated with Wnt3a for 1 hr in the absence or presence of iCRT14 or LGK974 and then harvested for Western blot analysis using indicated antibodies (Figure 6—source data 4). (E) Wnt3a prolonged the duration of pSmad5 in a β-catenin-independent manner. C3H10T1/2 cells were stimulated by BMP2 for 0.5 hr in the absence (i) or presence (ii) of the Wnt3a, proteasome inhibitor MG132 (iii), or the combination of both Wnt3a and iCRT14 (iv). Cells were harvested at the indicated time points after BMP2 wash-out and total cell extracts were analyzed by Western blot analysis (Figure 6—source data 5–6). (F) Model of integration of Wnt and BMP signaling pathways by Axin1. In the absence of Wnt stimulation, β-catenin is degraded by the destruction complex. Smad5 is also degraded by the Axin1 destruction complex (left panel). In the presence of Wnt ligands or in the absence of Axin1, β-catenin and pSmad5 degradation are inhibited, resulting in activation of both β-catenin and BMP/pSmad5 signaling (right panel).
-
Figure 6—source data 1
Original Co-IP results showed the interaction of endogenous Axin1 with Smad5 in C3H10T1/2 cells.
- https://cdn.elifesciences.org/articles/80013/elife-80013-fig6-data1-v2.zip
-
Figure 6—source data 2
Original western blot of pSmad5 expression.
- https://cdn.elifesciences.org/articles/80013/elife-80013-fig6-data2-v2.zip
-
Figure 6—source data 3
Quantification of pSmad5 levels in WT and Axin1 conditional knockout (cKO) mice.
- https://cdn.elifesciences.org/articles/80013/elife-80013-fig6-data3-v2.zip
-
Figure 6—source data 4
Original Western blot of pSmad5 and β-catenin expressions in C3H10T1/2 cells after treated with Wnt3a in the absence or presence of iCRT14 or LGK974.
- https://cdn.elifesciences.org/articles/80013/elife-80013-fig6-data4-v2.zip
-
Figure 6—source data 5
Original Western blot of pSmad5, Smad5 and β-catenin in C3H10T1/2 cells treated by BMP2 in the absence (i) or presence (ii) of the Wnt3a.
- https://cdn.elifesciences.org/articles/80013/elife-80013-fig6-data5-v2.zip
-
Figure 6—source data 6
Original Western blot of pSmad5, Smad5 and β-catenin in C3H10T1/2 cells treated by BMP2 in the presence of proteasome inhibitor MG132 (iii) and Wnt3a+ iCRT14 (iv).
- https://cdn.elifesciences.org/articles/80013/elife-80013-fig6-data6-v2.zip
Tables
Table 1
Names of genes and the primer sequences.
| Names of Genes | Primer Sequences |
|---|---|
| Axin1 Exon2-Forward | GAGCTCAGGGTCTGGAACAG |
| Axin1 Exon2-Reverse | CTGAGCTCTCTGCCTTCGTT |
| Bmp2-Forward | TGGAAGTGGCCCATTTAGAG |
| Bmp2-Reverse | TGACGCTTTTCTCGTTTGTG |
| Bmp4-Forward | TGAGCCTTTCCAGCAAGTTT |
| Bmp4-Reverse | CTTCCCGGTCTCAGGTATCA |
| Bmp7-Forward | GAAAACAGCAGCAGTGACCA |
| Bmp7-Reverse | GGTGGCGTTCATGTAGGAGT |
| Gremlin1-Forward | TGGAGAGGAGGTGCTTGAGT |
| Gremlin1-Reverse | AACTTCTTGGGCTTGCAG |
| Msx2-Forward | AACACAAGACCAACCGGAAG |
| Msx2-Reverse | GCAGCCATTTTCAGCTTTTC |
Additional files
Download links
A two-part list of links to download the article, or parts of the article, in various formats.
Downloads (link to download the article as PDF)
Open citations (links to open the citations from this article in various online reference manager services)
Cite this article (links to download the citations from this article in formats compatible with various reference manager tools)
Specific deletion of Axin1 leads to activation of β-catenin/BMP signaling resulting in fibular hemimelia phenotype in mice
eLife 11:e80013.
https://doi.org/10.7554/eLife.80013


