Mechanism of the cadherin–catenin F-actin catch bond interaction
- Department of Chemical Engineering, Stanford University, School of Engineering, United States
- Departments of Structural Biology and Molecular & Cellular Physiology, School of Medicine, Stanford University, United States
Figures
Figure 1
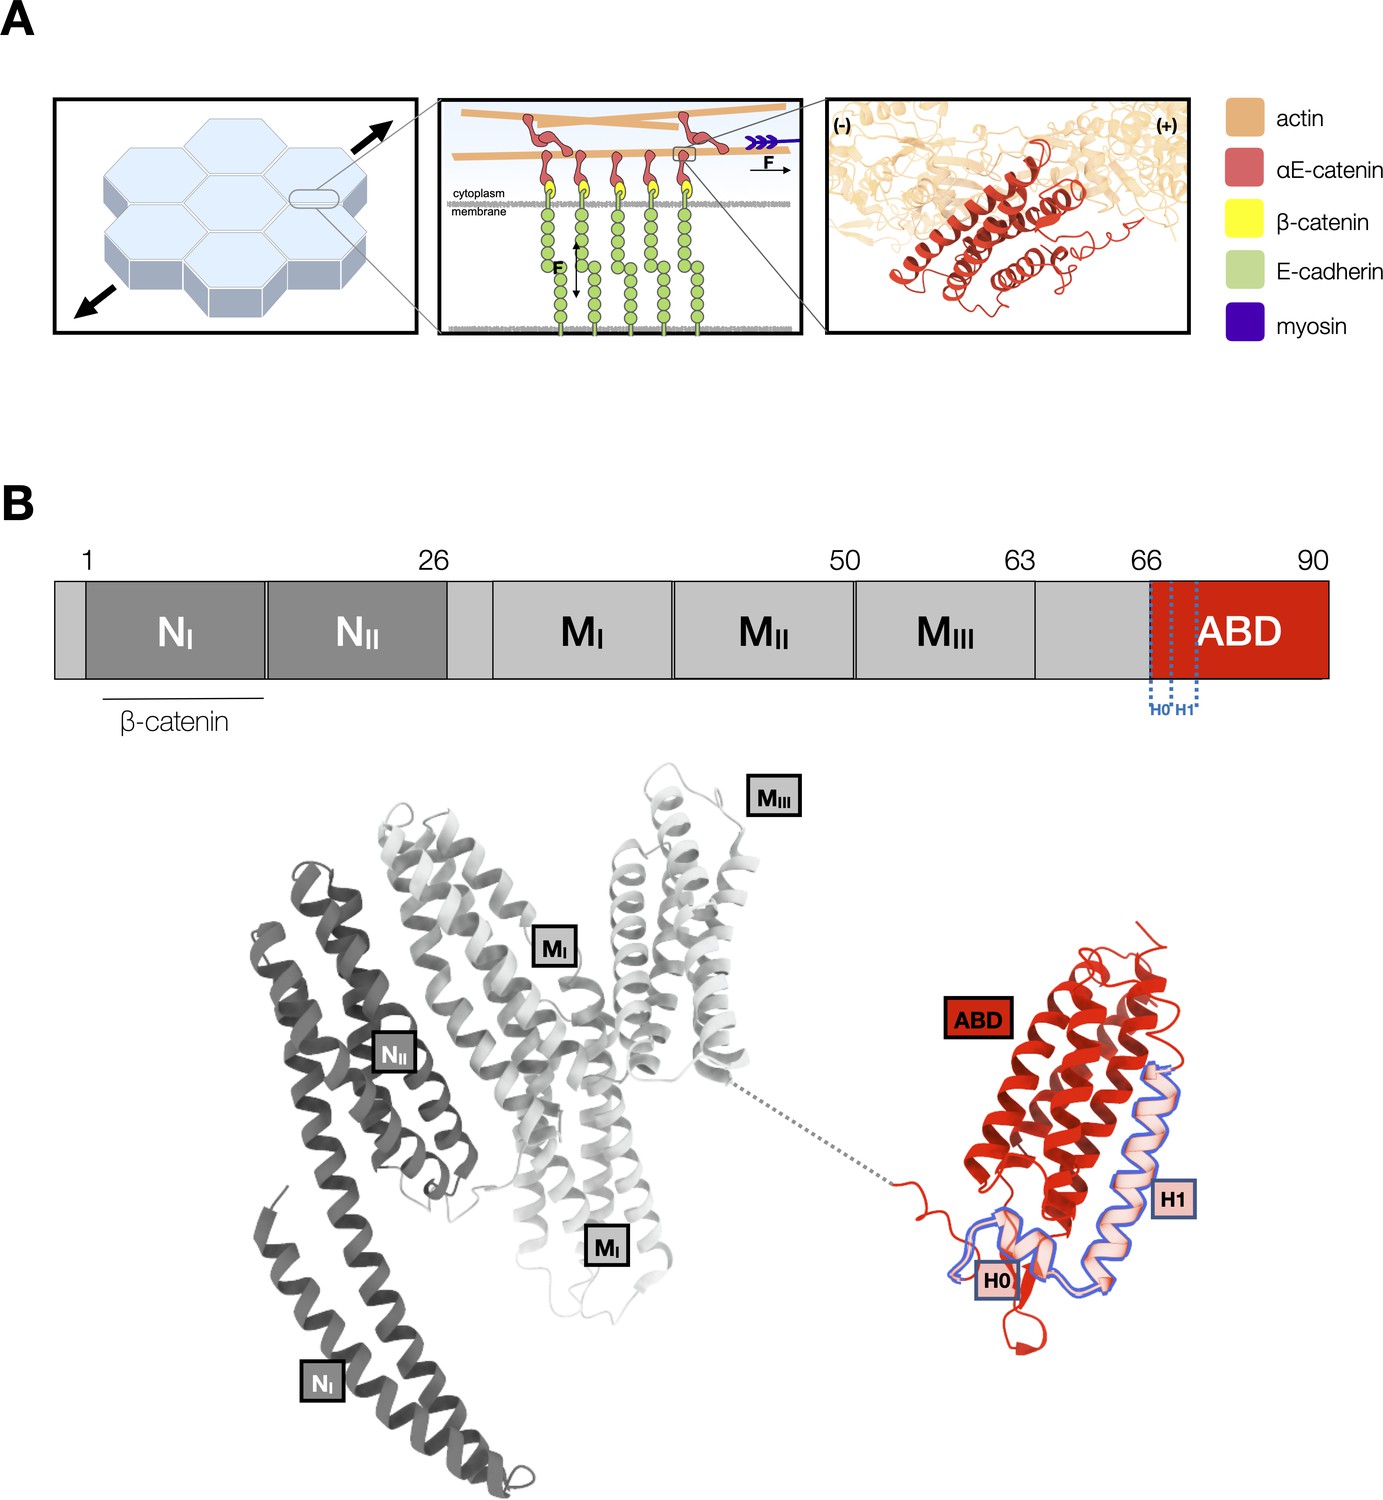
αE-catenin at adherens junctions.
(A) Cell–cell adhesions in epithelia are reinforced under tension. Mechanotransduction at adherens junctions is mediated by both homophilic extracellular E-cadherin (green) interactions that establish adhesion between cells, and intracellular interactions of the cadherin–catenin complex with actin. Intracellularly, the cytosolic tail of E-cadherin binds to β-catenin (yellow) and αE-catenin (red) which forms a catch bond with F-actin. The structure of the αE-catenin actin-binding domain (ABD) complexed with F-actin is the basis for the catch bond mechanistic model. (B) Structure of full-length αE-catenin. αE-catenin (N and M domains: pdb 4igg) has a N-terminal domain that binds β-catenin, a middle (M) domain, and a flexible linker to the C-terminal ABD (pdb 6dv1). The ABD (red) is comprised of a five-helix bundle, preceded by a short N-terminal helix designated as H0, and a C-terminal extension (CTE). Helices H0 and H1 (residues 666–696) are outlined in blue.
Figure 2
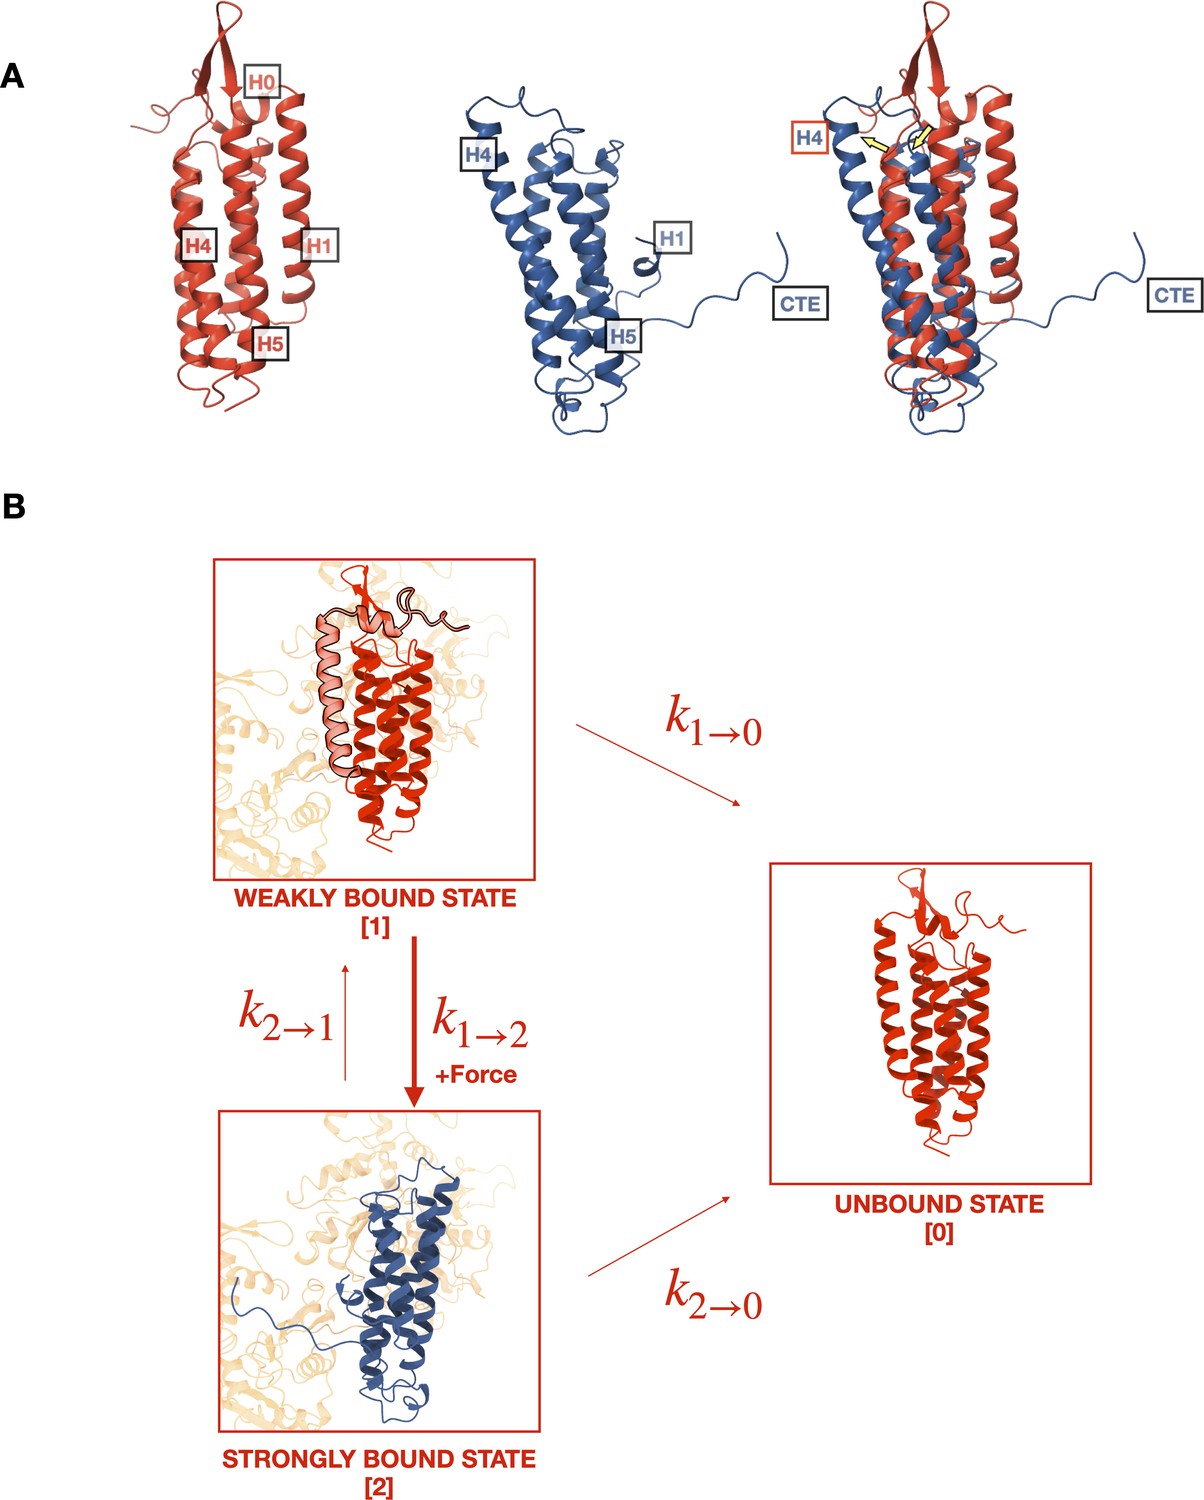
Mechanistic hypothesis of two-state catch bond from actin-binding domain (ABD) structures.
(A) Comparison of isolated (red, pdb 6dv1) and actin-bound (blue, pdb 6upv) αE-catenin ABDs. In the actin-bound structure, H0 and H1 become disordered and H2–H5 rearrange (yellow arrows). The C-terminal extension (CTE), which is disordered in the isolated structure, forms an extended peptide and interacts with actin. (B) Two-state catch bond model. αE-catenin ABD interacts with F-actin in either the weak or strong conformational state, denoted as states 1 and 2, respectively. The unbound state is represented as state 0. The association of H0 and H1 with the four-helix bundle in the weak state (1) inhibits the ABD from rearranging into the strong state (2) conformation. The transitions between states are force dependent, and dissociation rates and increase exponentially with respect to applied load. Force also increases , the transition rate from states 1 to 2, but decreases . Tension applied to state 1 promotes the dissociation of H0 and H1 and the structural rearrangement of H2–H5 into state 2.
Figure 3 with 3 supplements
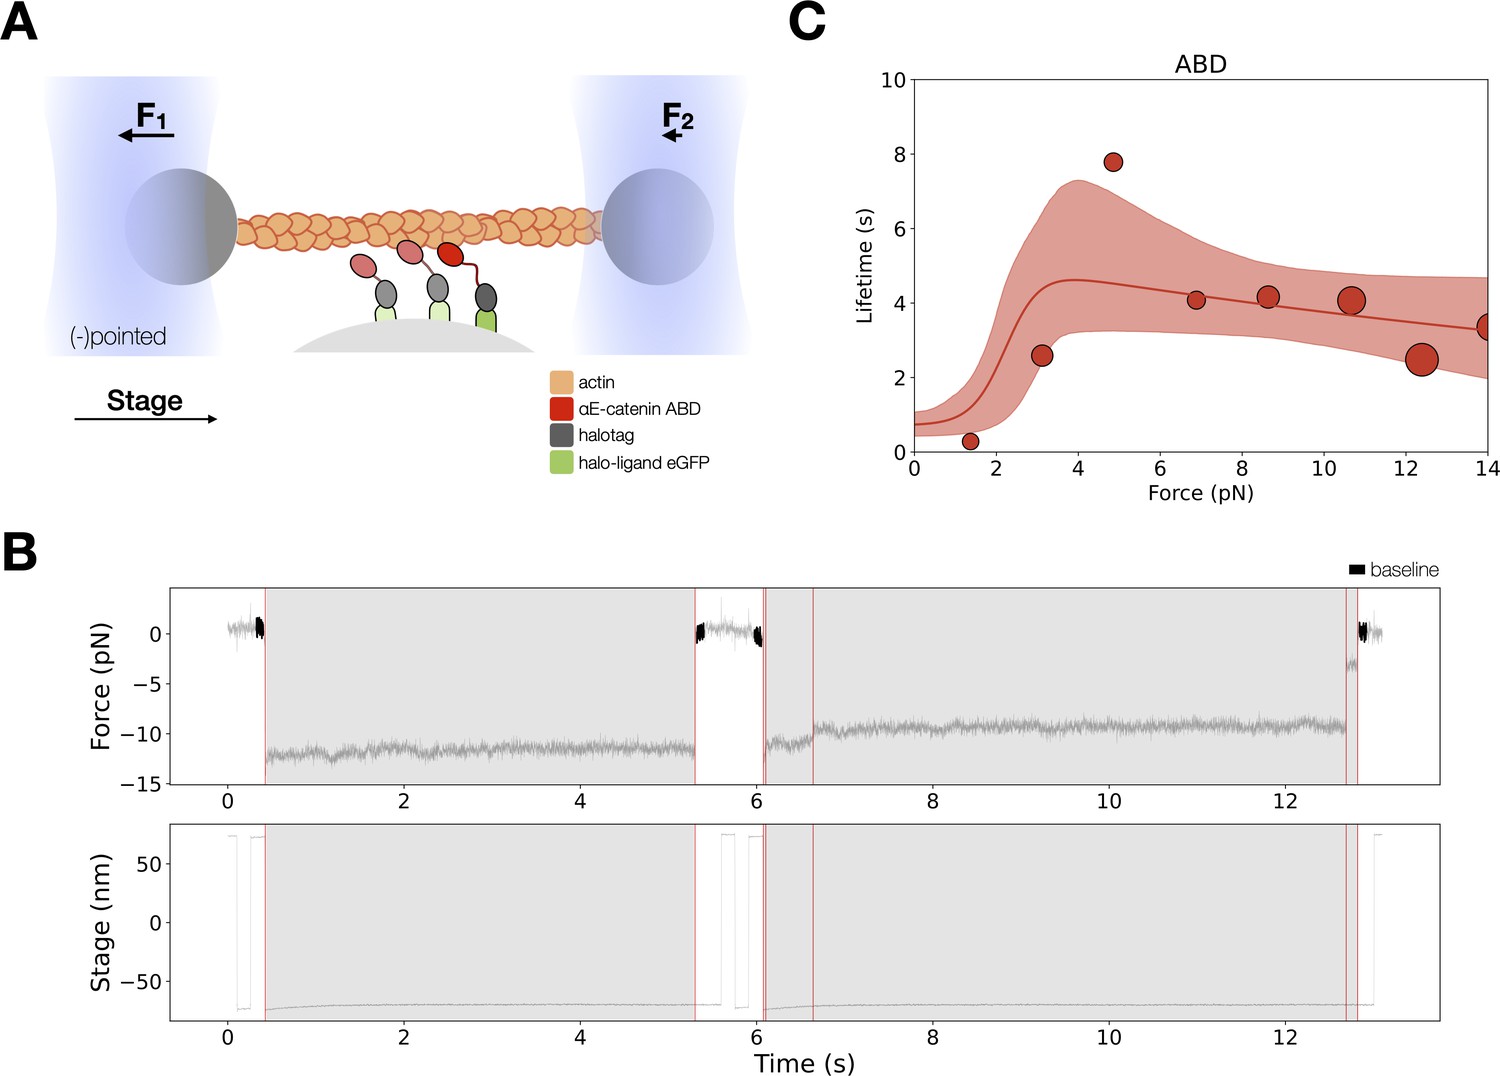
Force-dependent binding interactions between the αE-catenin actin-binding domain (ABD) and F-actin.
(A) (Top) GFP-haloligand and fusion protein Halotag-ABD (red) complexes are immobilized on silica microspheres attached to a microscope coverslip. A taut actin filament is suspended between two optically trapped beads and held over the assembled complexes. The stage is translated parallel to the actin filament, and when at least one protein complex binds to F-actin, the trapped beads are pulled out of their equilibrium position. The restoring force of the optical trap (black arrows) applies tension on a bound complex while bystander complexes (pale) bind and unbind transiently. (B) A representative force versus time series for the constant-force assay. (Top) Plotted are the forces summed from both traps versus time, decimated from 40 to 4 kHz. We observe traces characterized either by rupture of a single bound molecule (left) or by sequential rupture of multiple bound molecules (right). Traces colored in black are regions used for force baseline determination, and vertical lines indicate step boundaries. (Bottom) If summed forces surpass a threshold, stage motion halts until detachment of the final bound molecule. (C) αE-catenin ABD forms a catch bond with F-actin (N = 900). Areas of all circles are proportional to the number of events measured in each equal-width bin. These data are represented here without depicting the direction of force applied relative to the polar actin filament.
-
Figure 3—source data 1
αE-catenin actin-binding domain (ABD) optical trap constant-force assay multi-step force versus lifetimes.
- https://cdn.elifesciences.org/articles/80130/elife-80130-fig3-data1-v3.xlsx
Figure 3—figure supplement 1
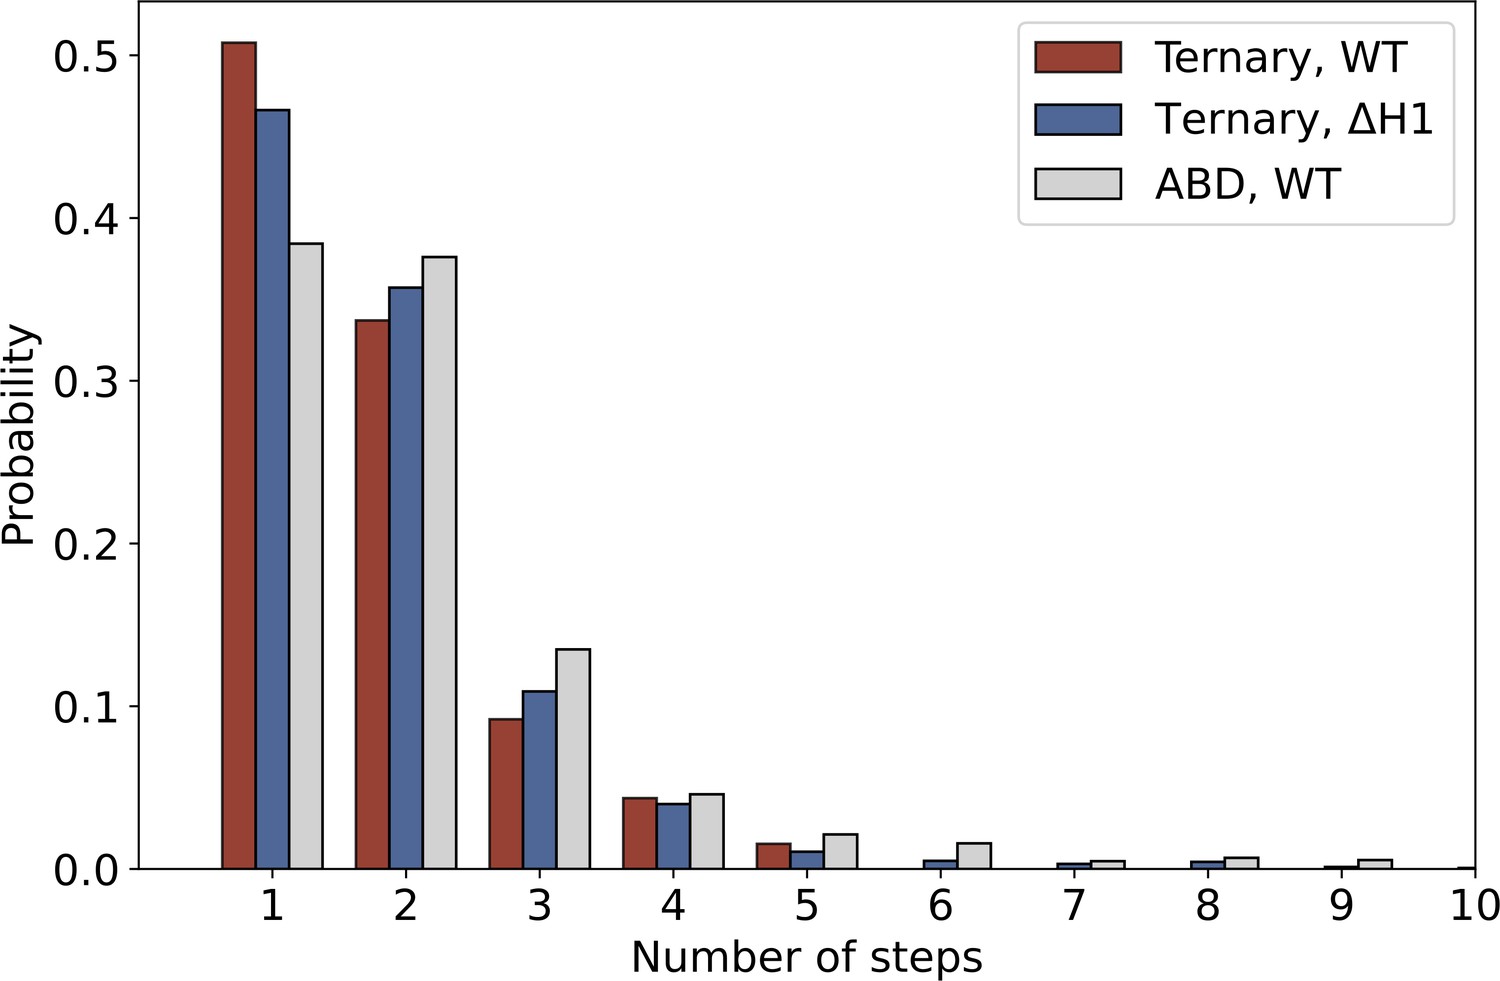
The distribution of the number of steps in constant-force assay measurements of ternary wild type (red, N = 1418), ternaryΔH1 (blue, N = 1604), and actin-binding domain (ABD) (gray, N = 1460).
The probability of observing single- versus multi-step events is comparable between ternary wild type and ternaryΔH1.
-
Figure 3—figure supplement 1—source code 1
Step number distribution analysis code for all events.
- https://cdn.elifesciences.org/articles/80130/elife-80130-fig3-figsupp1-code1-v3.zip
Figure 3—figure supplement 2

Energy-minimized actin-binding domain (ABD) structures superimposed (red) or bound (blue) with actin.
(A–C) Structures of isolated ABD (PDB entries 6dv1, 4igg chain A, 4igg chain B) were superimposed on the actin-bound ABD (PDB entry 6UPV), and minimized while docked to actin (red), or in the absence of actin (pink). Energy minimization of these ABDs bound to actin resulted in minor structural changes (RMSD <0.7 Å) and resolved clashes with overlapping atoms. (D) Structures of the actin-bound ABD (PDB entry 6UPV) minimized in the presence (navy) and absence (light blue) of actin.
Figure 3—figure supplement 3
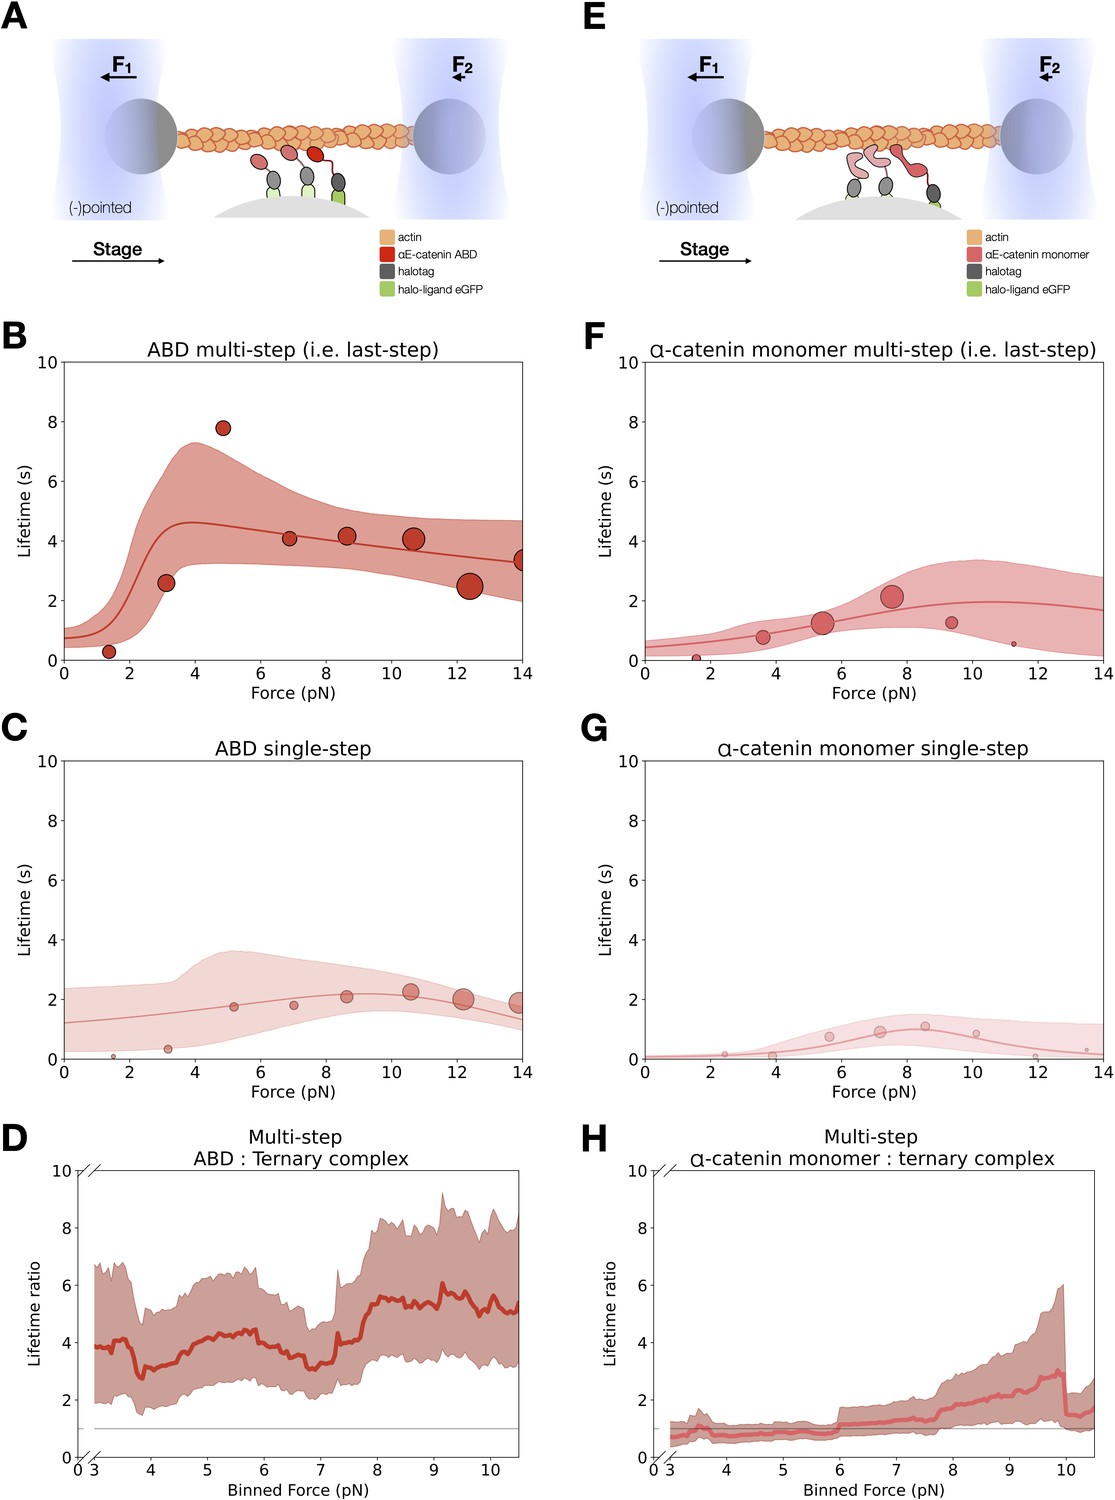
Force-dependent binding lifetimes of αE-catenin actin-binding domain (ABD) and monomer.
(A) GFP-haloligand and fusion protein Halotag-ABD (red) complexes are immobilized on silica microspheres and interact with a taut actin filament. This figure is the same as Figure 3A. (B) Force-dependent binding lifetimes of αE-catenin ABD to F-actin, for the last detachment step in multi-step events. This figure is the same Figure 3C. (C) Force-dependent binding lifetimes of αE-catenin ABD to F-actin in single-step events. (D) Computed lifetime ratios (LRs) between ABD and the ternary complex with a 4 pN sliding window across 0–13 pN. The ABD:F-actin-binding interaction is fourfold longer than that of the ternary complex (mean LR = 4.27, 90% confidence interval [CI] = 2.55–6.67). (E) GFP-haloligand and fusion protein Halotag-αE-catenin (pink) complexes are immobilized on silica microspheres and interact with a taut actin filament. (F) Force-dependent binding lifetimes of αE-catenin monomer to F-actin, for the last detachment step in multi-step events (N = 442). (G) Force-dependent binding lifetimes of αE-catenin monomer to F-actin in single-step events (N = 140). (H) Computed LRs between αE-catenin monomer and the ternary complex with a 4 pN sliding window across 0–13 pN. The αE-catenin:F-actin-binding interaction is comparable to the ternary complex (mean LR = 1.34, 90% CI = 0.77–2.20).
-
Figure 3—figure supplement 3—source data 1
αE-catenin actin-binding domain (ABD) optical trap constant-force assay single-step force versus lifetimes.
- https://cdn.elifesciences.org/articles/80130/elife-80130-fig3-figsupp3-data1-v3.xlsx
-
Figure 3—figure supplement 3—source data 2
αE-catenin monomer optical trap constant-force assay single-step force versus lifetimes.
- https://cdn.elifesciences.org/articles/80130/elife-80130-fig3-figsupp3-data2-v3.xlsx
-
Figure 3—figure supplement 3—source data 3
αE-catenin monomer optical trap constant-force assay multi-step force versus lifetimes.
- https://cdn.elifesciences.org/articles/80130/elife-80130-fig3-figsupp3-data3-v3.xlsx
-
Figure 3—figure supplement 3—source data 4
Bootstrapped lifetime ratios for actin-binding domain (ABD) versus ternary complex multi-step data.
- https://cdn.elifesciences.org/articles/80130/elife-80130-fig3-figsupp3-data4-v3.zip
-
Figure 3—figure supplement 3—source data 5
Bootstrapped lifetime ratios for αE-catenin monomer versus ternary complex multi-step data.
- https://cdn.elifesciences.org/articles/80130/elife-80130-fig3-figsupp3-data5-v3.zip
Figure 4 with 1 supplement
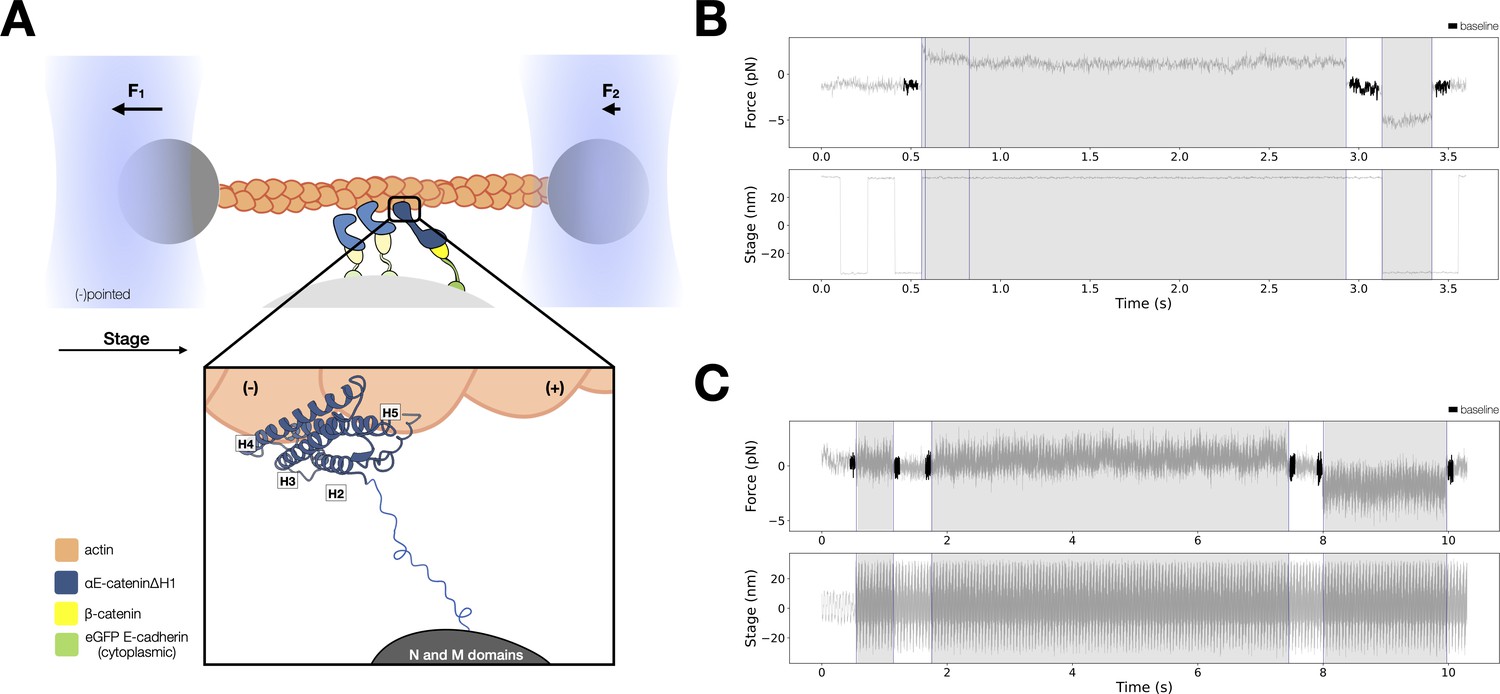
Force-dependent binding interactions between ternaryΔH1 complexes and F-actin.
(A) Optical trap setup used in constant- and low-force assays. Ternary GFP-E-cadherin cytoplasmic tail (green), β-catenin (yellow), and αE-cateninΔH1 (blue) complexes are immobilized on silica microspheres attached to a microscope coverslip. (Inset) The actin-binding domain (ABD), which confers the catch bond interaction between cadherin–catenin complexes and F-actin, is attached to the M domain of αE-catenin by a flexible linker. The four-helix H2–H5 binds to actin directly in the purported strong state conformation. (B) Representative trace from the constant-force assay. (C) Low-force assay. (Top) A representative force versus time series (gray). Plotted are the forces summed from both traps versus time, decimated from 40 to 4 kHz. Binding lifetimes at low force were defined by the duration during which the positional variance of trapped beads exceeded the baseline variance of control experiments. Traces colored in black are regions used for force baseline determination. When a binding event occurs, stage motion is translated to the trapped beads. (Bottom) The stage oscillates in a high-frequency, low-amplitude sinusoidal waveform to enable binding event detection at low forces.
-
Figure 4—source data 1
TernaryΔH1 optical trap constant-force assay multi-step data.
- https://cdn.elifesciences.org/articles/80130/elife-80130-fig4-data1-v3.xlsx
Figure 4—figure supplement 1
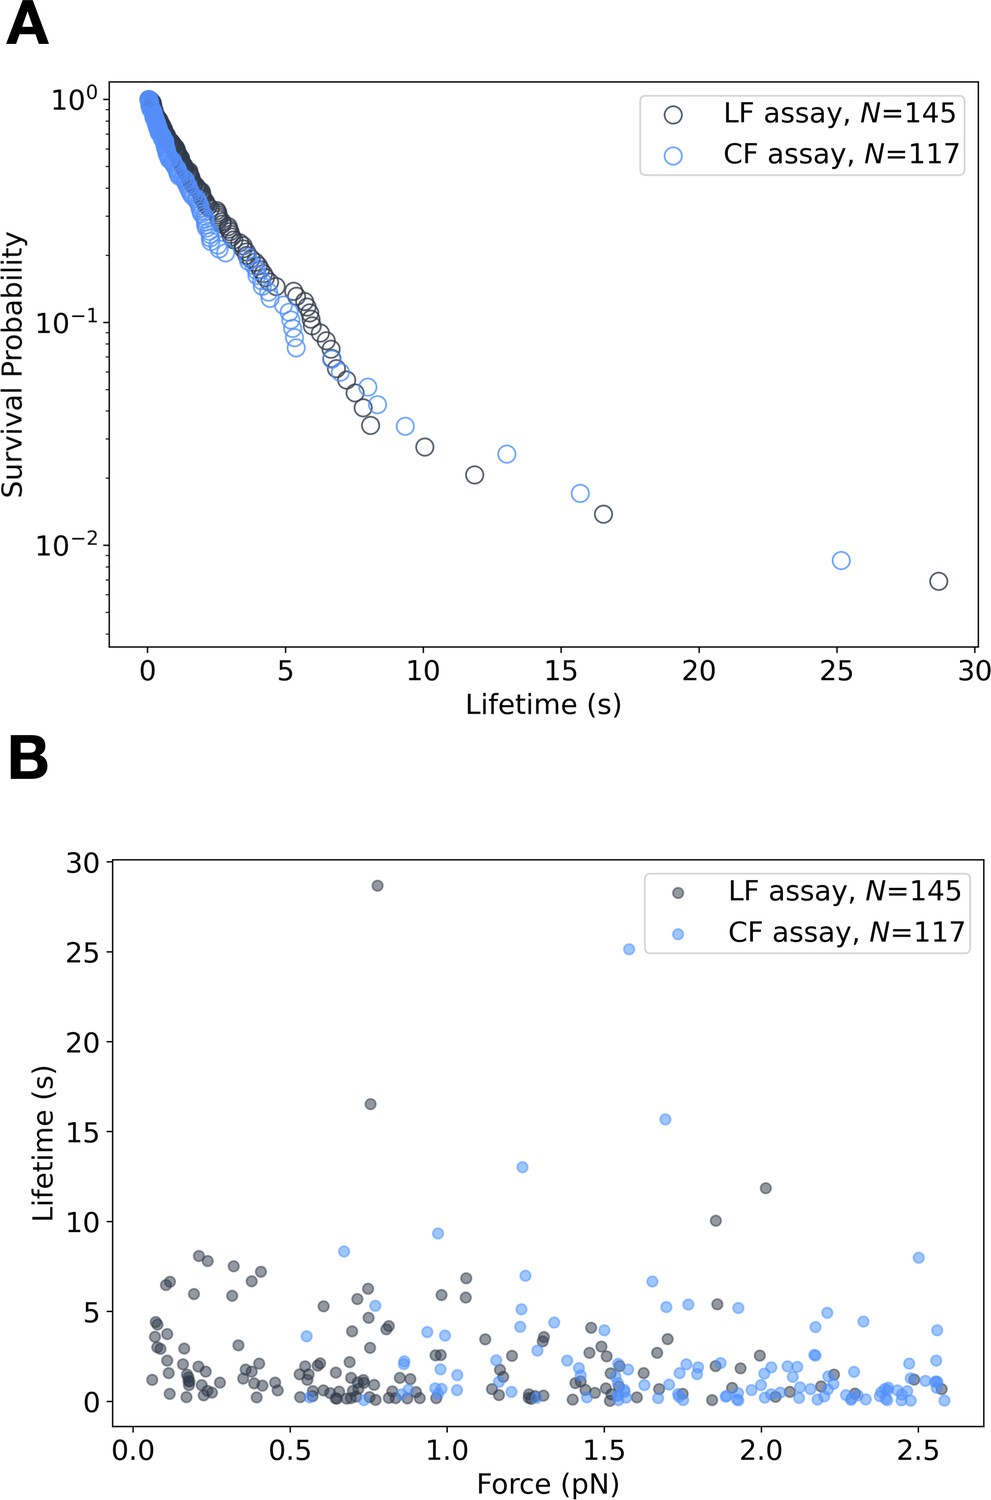
E-cadherin/β-catenin/αE-cateninΔH1 low-force bond lifetimes.
(A) Binding event lifetimes measured below ~2.5 pN from the low-force assay (gray, N = 145) and constant-force assay (blue, N = 117). (B) Survival probability versus binding lifetime for low-force (LF) (N = 145) and constant-force (CF) data (N = 117) between 0 and 2.5 pN. The distribution of binding lifetimes between the two assays is not statistically different (p = 0.30 > 0.01, in a two-sample Kolmogorov–Smirnov [KS]).
-
Figure 4—figure supplement 1—source data 1
TernaryΔH1 optical trap low-force assay data.
- https://cdn.elifesciences.org/articles/80130/elife-80130-fig4-figsupp1-data1-v3.xlsx
Figure 5 with 3 supplements
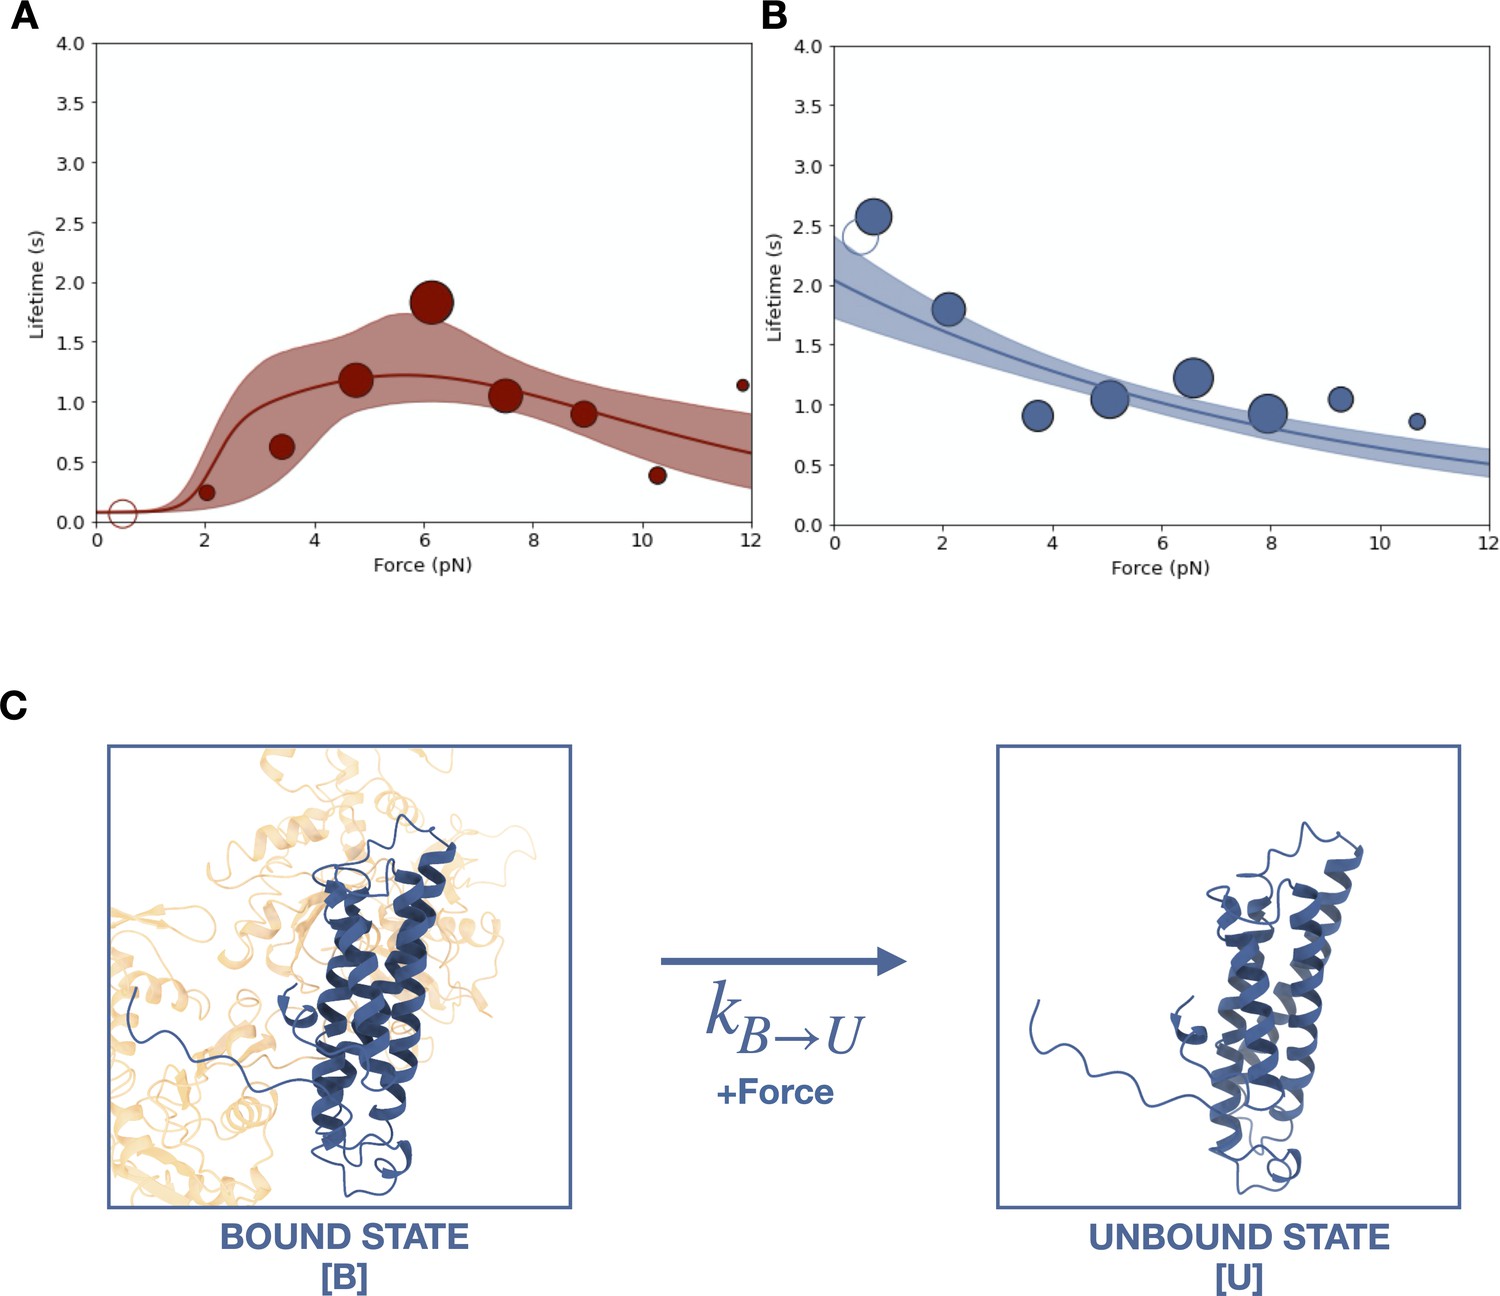
Force-dependent binding of cadherin/catenin complexes to F-actin.
(A) Mean binding lifetimes (red filled circles) from constant-force assay measurements from previously reported (Bax et al., 2022) wild-type E-cadherin/β-catenin/αE-catenin complex data (N = 700). These data are represented here without depicting the direction of force applied relative to the polar actin filament, and fit to a nondirectional two-state catch bond (red curve). Unfilled circles represent the mean lifetime of events collected in the low-force assay (N = 90). Envelopes indicate 95% confidence intervals for the fit, obtained by empirical bootstrapping. Areas of all circles are proportional to the number of events measured in each equal-width bin. (B) Mean binding lifetimes (blue filled circles) from pooled low- (N = 145) and constant-force assay (N = 856) measurements for ternaryΔH1 complexes. These data were fit to a one-state slip bond model (blue curve). (C) The one-state slip bond model. The conformation of a bound actin-binding domain (ABD) missing H1, denoted state B, is comparable to the strong state of the two-state catch bond model. Molecules transition between bound (B) and unbound (U) states, where the dissociation rate, , increases exponentially with force.
-
Figure 5—source code 1
Code for fitting and bootstrapping all slip bond models using maximum likelihood estimation.
- https://cdn.elifesciences.org/articles/80130/elife-80130-fig5-code1-v3.zip
-
Figure 5—source code 2
Code for fitting a two-state catch bond model using maximum likelihood estimation.
- https://cdn.elifesciences.org/articles/80130/elife-80130-fig5-code2-v3.zip
-
Figure 5—source code 3
Code for bootstrapping a two-state catch bond model using maximum likelihood estimation.
- https://cdn.elifesciences.org/articles/80130/elife-80130-fig5-code3-v3.zip
Figure 5—figure supplement 1
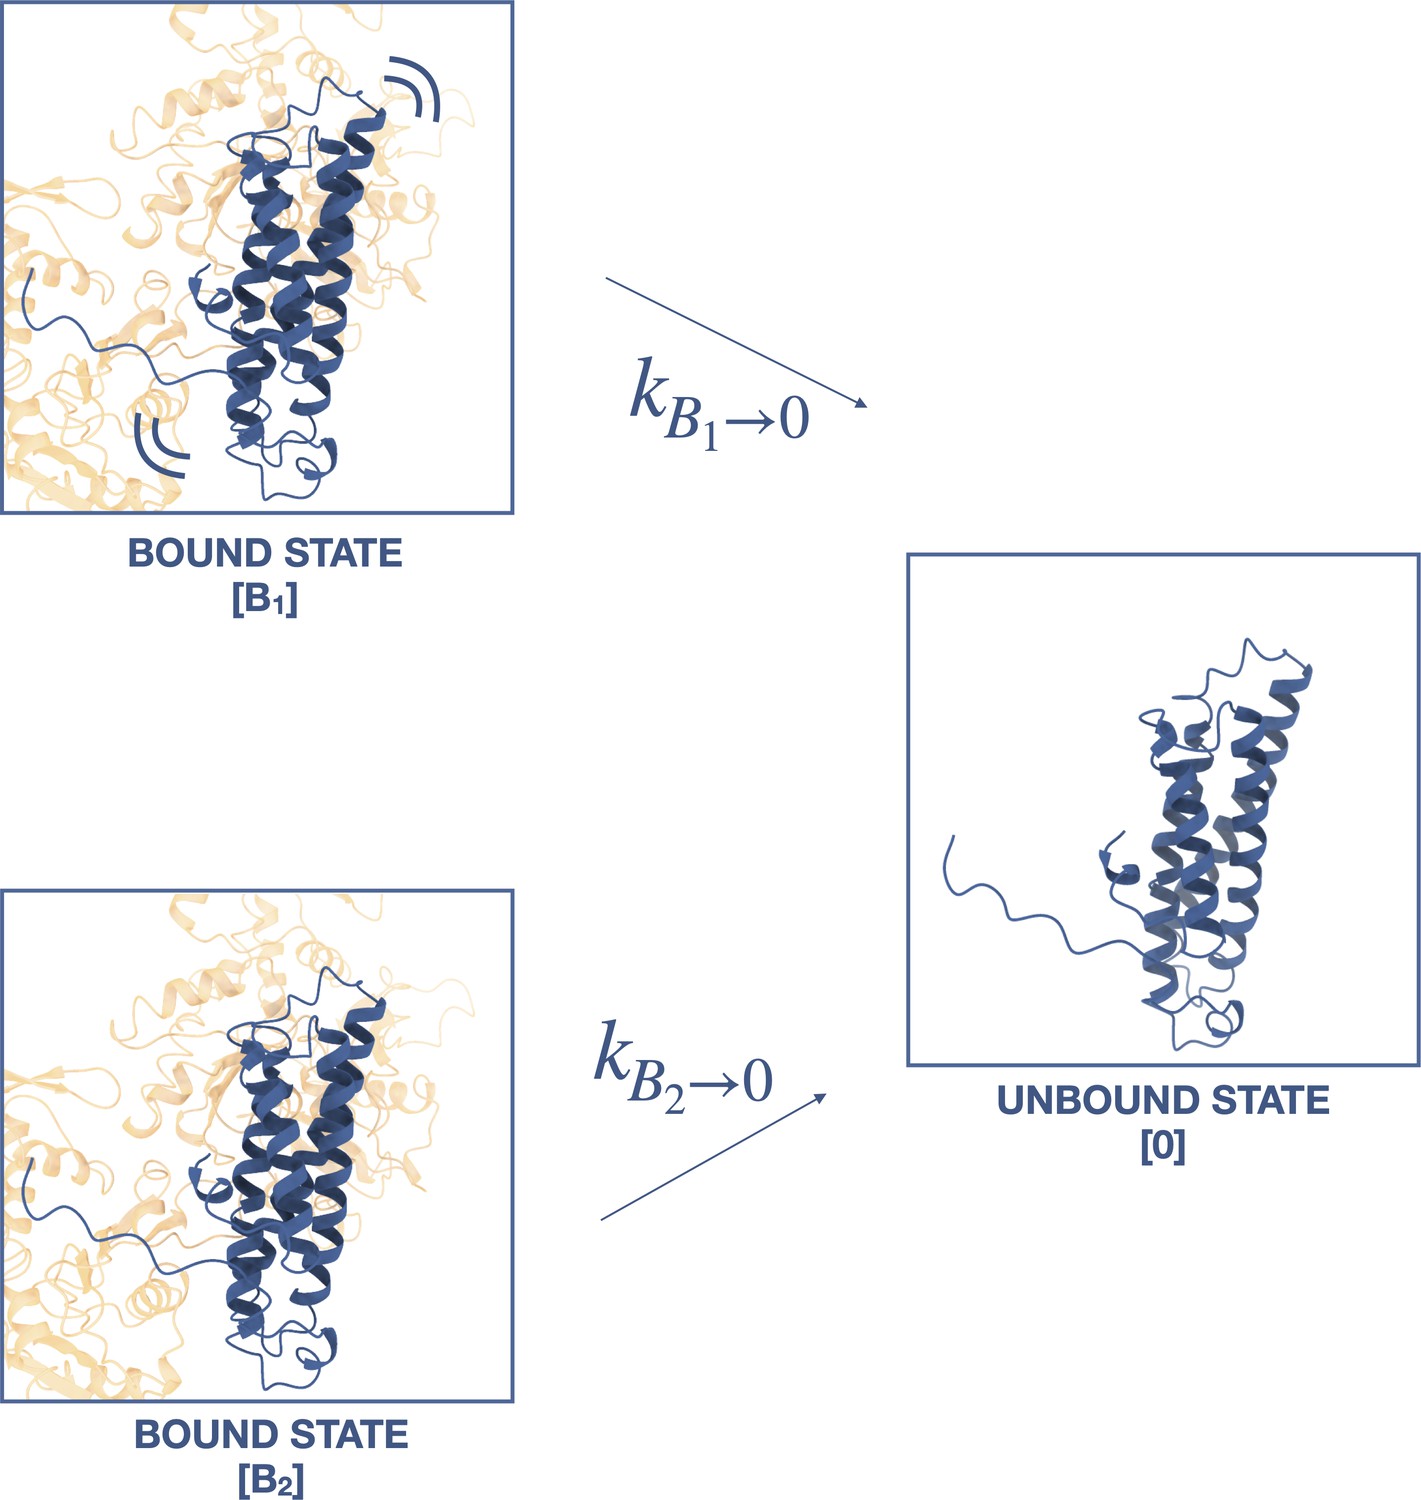
Two-state slip bond model.
In this model, the ternaryΔH1 complex interacts with F-actin in a moderately strong bound state (B1) and strongly bound state (B2), such that that the deletion of H0 and H1 hinders the transition between B1 and B2 to impart biphasic binding lifetimes. However, Akaike information criterion (AIC) and Bayesian information criterion (BIC) suggest a single-state slip bond model better represents the data (see text).
Figure 5—figure supplement 2
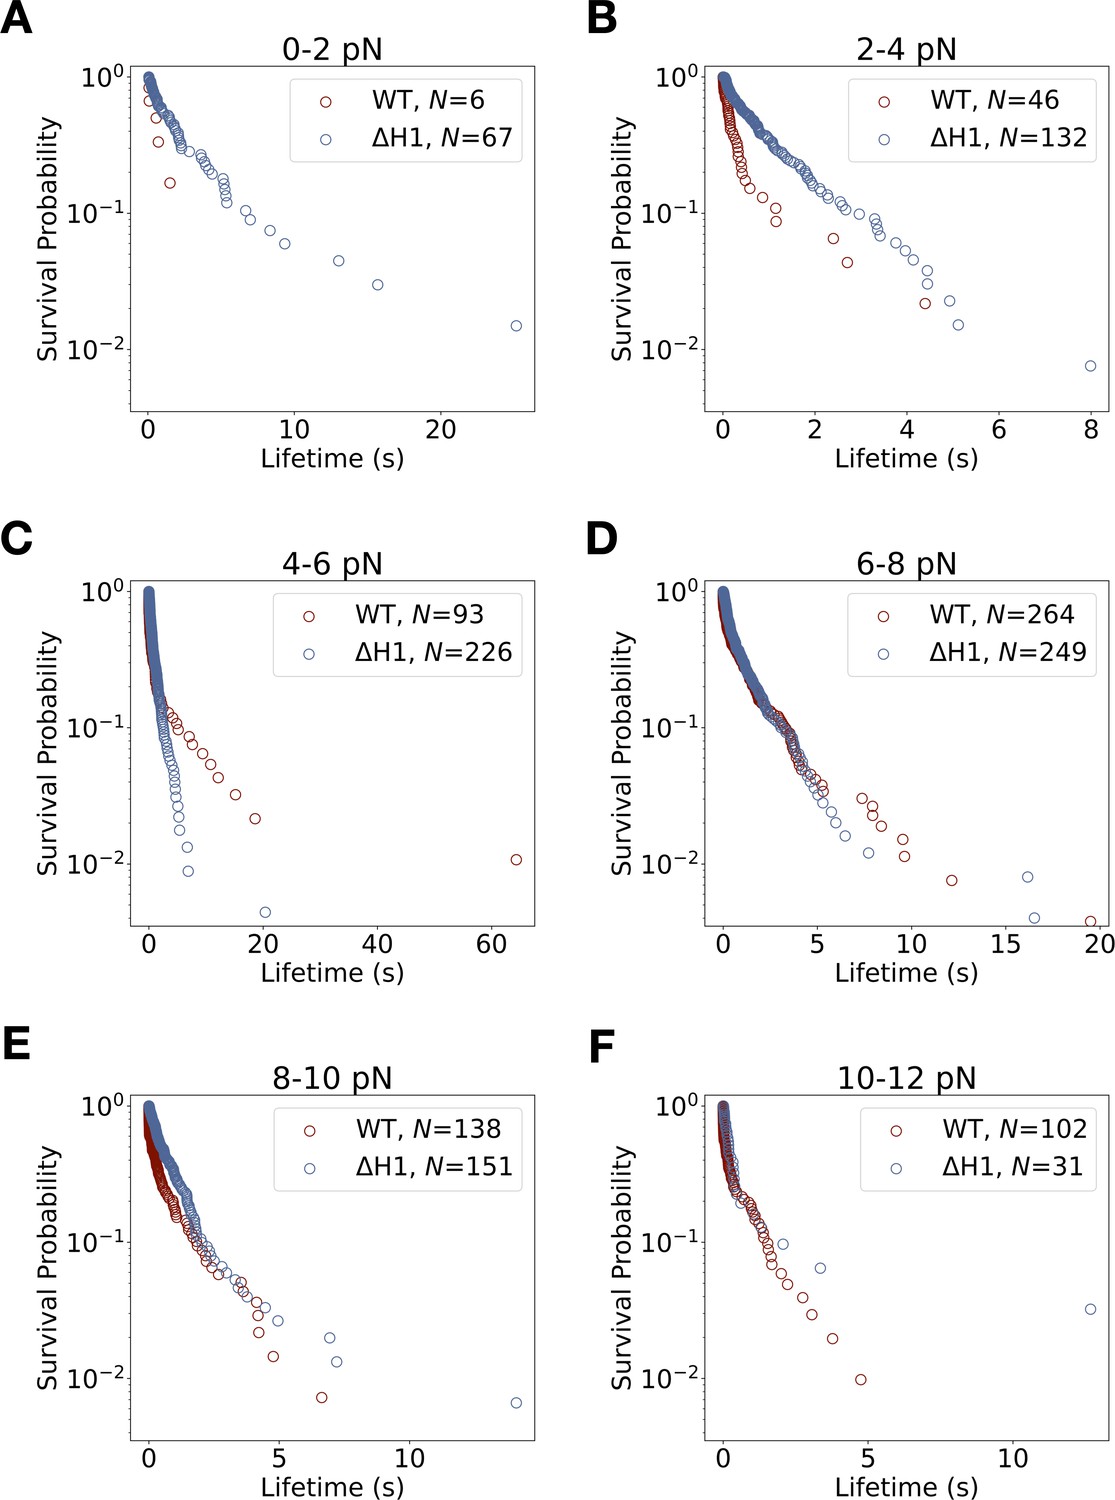
Lifetime survival analysis for wild-type E-cadherin/β-catenin/αE-catenin and E-cadherin/β-catenin/αE-cateninΔH1.
Survival probability versus binding lifetime from constant-force measurements for each 2 pN bin width. (A) Survival lifetimes are more likely to be longer for ternaryΔH1 (blue) than wild-type ternary (red) between 0 and 2 pN. (B) The ternaryΔH1 complex survival probability distribution is qualitatively more monophasic when compared to wild-type ternary. (C) Binding lifetimes for ternaryΔH1 are more likely to be shorter than wild-type ternary complex between 4 and 6 pN. The ternaryΔH1 complex is qualitatively more monophasic than wild type. (D–F) Above 6 pN, ternary wild-type and ternaryΔH1 complex survival probability distributions at these force bins are not statistically different (p < 0.01, two-sample Kolmogorov–Smirnov [KS] test).
-
Figure 5—figure supplement 2—source data 1
TernaryΔH1 optical trap low-force assay multi-step data.
- https://cdn.elifesciences.org/articles/80130/elife-80130-fig5-figsupp2-data1-v3.xlsx
-
Figure 5—figure supplement 2—source code 1
Code for analyzing survival lifetimes across 2 pN force bins.
- https://cdn.elifesciences.org/articles/80130/elife-80130-fig5-figsupp2-code1-v3.zip
Figure 5—figure supplement 3
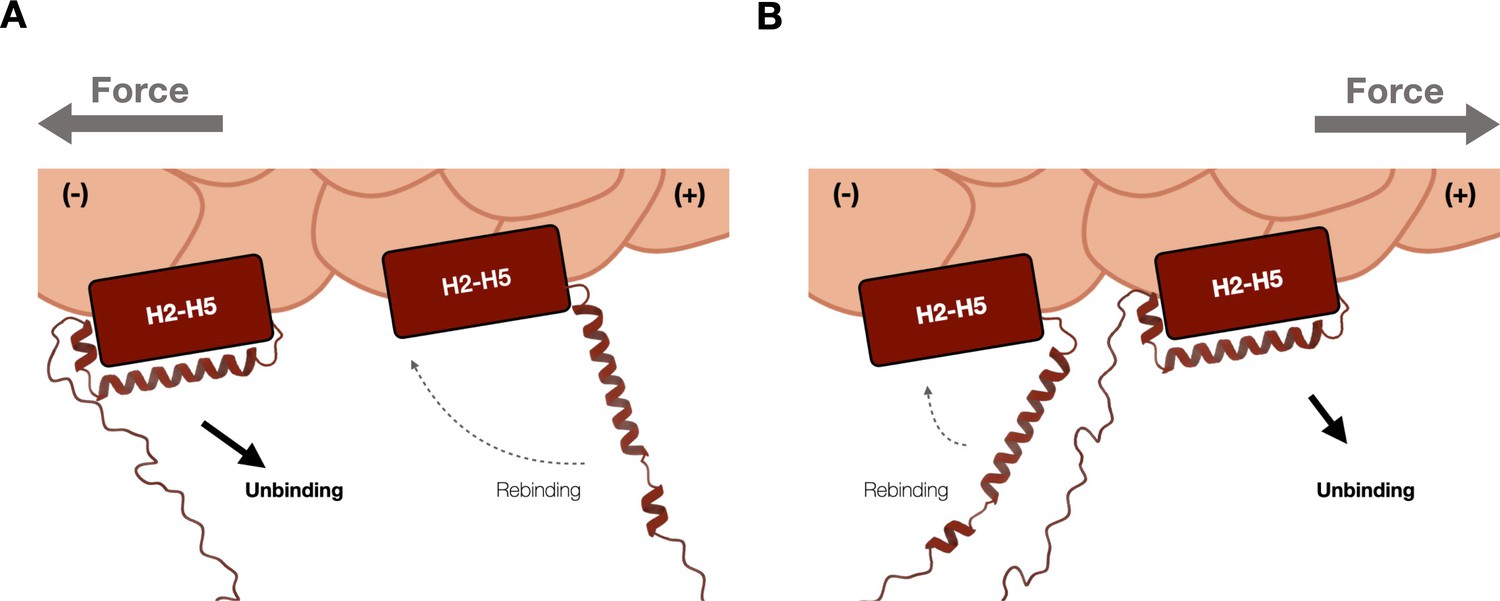
Molecular basis of catch bond directionality.
(A) Force on actin (gray arrow) directed in the (−) direction of ternary wild type. When force is applied in the (−) direction, H1 is moved away from H2–H5 and oriented such that reassociation of H0/H1 to the H2–H5 bundle is disfavored (dotted lines). (B) Force on actin (gray arrow) directed in (+) direction of ternary wild type. When force is applied in the (+) direction, H1 is predicted to be positioned relatively closer to the H2–H5 bundle, where the bound actin-binding domain (ABD) may more likely adopt conformations similar to the five-helix weak state (dotted lines). Also see Xu et al., 2020.
-
Figure 5—figure supplement 3—source data 1
Data file of binding events parsed by statistically inferred directionality.
- https://cdn.elifesciences.org/articles/80130/elife-80130-fig5-figsupp3-data1-v3.zip
-
Figure 5—figure supplement 3—source code 1
Code for parsing and analyzing maximum directionality of ternary and ternaryΔH1 datasets.
- https://cdn.elifesciences.org/articles/80130/elife-80130-fig5-figsupp3-code1-v3.zip
Figure 6 with 1 supplement

Model for cooperative binding under tension.
(A) Computed lifetime ratios (LRs) with a 4 pN sliding window across 0–13 pN showing that lifetimes from actin-binding domain (ABD) multi-step events are longer than single-step events (mean LR = 3.54). Envelopes represent 90% confidence intervals (CIs), obtained via empirical bootstrapping mean (90% CI = 1.69–9.83). (B) Wild-type ternary lifetimes from multi- and single-step events have similar binding lifetimes (mean LR = 1.15, 90% CI = 0.68–1.78). (C) Upon stable binding with actin, a loaded ABD could enable stronger binding to actin by neighbors by allosteric coupling of involving contacts of the C-terminal extension (CTE) and the H2–H5 bundle. (D) The loaded ternary complex may interact with its neighbor differently than the ABD. Allosteric regulation of the ABD by the other αE-catenin domains, steric effects of the large N–M region, and/or differences in force propagation could prevent rearrangements in the ABD that would enhance its load-bearing capacity.
-
Figure 6—source code 1
Code for analyzing and bootstrapping lifetime ratios.
- https://cdn.elifesciences.org/articles/80130/elife-80130-fig6-code1-v3.zip
-
Figure 6—source data 1
Bootstrapped lifetime ratios for αE-catenin actin-binding domain (ABD) multi- versus single-step.
- https://cdn.elifesciences.org/articles/80130/elife-80130-fig6-data1-v3.zip
-
Figure 6—source data 2
Bootstrapped lifetime ratios for ternary complex multi- versus single-step.
- https://cdn.elifesciences.org/articles/80130/elife-80130-fig6-data2-v3.zip
Figure 6—figure supplement 1
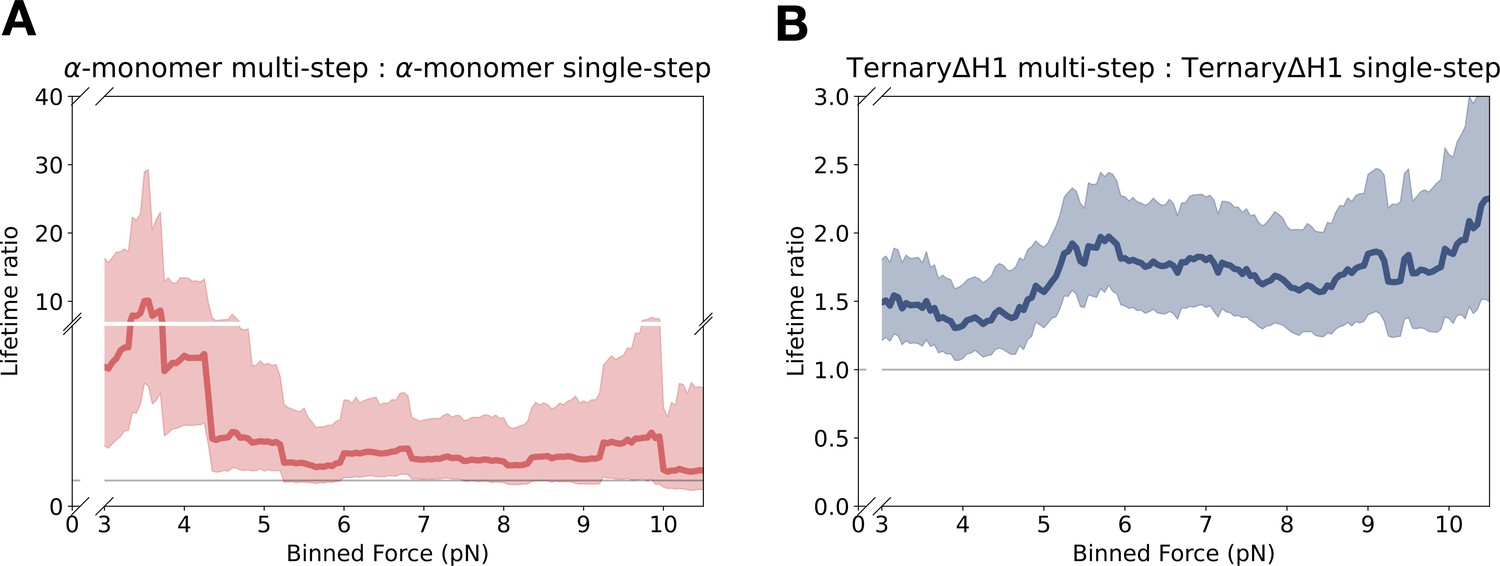
Force-dependent cooperative binding for αE-catenin monomer and ternaryΔH1.
(A) αE-catenin monomer data (mean lifetime ratio [LR] = 3.04, 90% confidence interval [CI] = 1.46–7.73) from multi-step yielded longer binding lifetimes than single-step observations across all force ranges, and particularly at the low-force range. (B) TernaryΔH1 multi-step data show a modest lifetime enhancement over single step (mean LR = 1.69, 90% CI = 1.34–2.15).
-
Figure 6—figure supplement 1—source data 1
Bootstrapped lifetime ratios for αE-catenin monomer multi- versus single step.
- https://cdn.elifesciences.org/articles/80130/elife-80130-fig6-figsupp1-data1-v3.zip
-
Figure 6—figure supplement 1—source data 2
Bootstrapped lifetime ratios for ternaryΔH1 multi- versus single step.
- https://cdn.elifesciences.org/articles/80130/elife-80130-fig6-figsupp1-data2-v3.zip
-
Figure 6—figure supplement 1—source data 3
Ternary ΔH1 optical trap constant-force assay single-step force versus lifetimes.
- https://cdn.elifesciences.org/articles/80130/elife-80130-fig6-figsupp1-data3-v3.xlsx
Tables
Table 1
Kinetic parameters for the two-bound-state catch bond model for αE-catenin actin-binding domain (ABD) (top) and monomer (bottom).
State 0 is the unbound state, state 1 is the weak bound state, and state 2 is the strong bound state. The 95% confidence interval (CI) was determined for each parameter via empirical bootstrapping. The transition rate between state i and j under no load is indicated by , whereas the distance between the initial state, i, and the transition state between i and j is given by . A negative distance parameter indicates that the transition rate is decreased by force.
| ABD multi-step: two-state catch bond, nondirectional fit | ||||
|---|---|---|---|---|
| 2 → 0 | 2 → 1 | 1 → 0 | 1 → 2 | |
| 0.051 | 15.02 | 1.40 | 0.46 | |
| CI (s−1) | (0.02, 0.10) | (1.33, 1000) | (1.00, 2.46) | (0.18, 1.50) |
| 0.17 | 9.69 | 0.002 | 0.004 | |
| CI (nm) | (0.01, 0.62) | (5.35, 21.42) | Fixed | (0.004, 0.145) |
| αE-catenin monomer multi-step: two-state catch bond, nondirectional fit | ||||
| 2 → 0 | 2 → 1 | 1 → 0 | 1 → 2 | |
| 0.046 | 0.72 | 4.97 | 0.87 | |
| CI (s−1) | (0.003, 0.39) | (0.40, 1000) | (3.41, 6.94) | (0.25, 2.75) |
| 0.64 | 0.66 | 0.002 | 0.76 | |
| CI (nm) | (0.008, 2.29) | (0.08, 16.38) | Fixed | (0.004, 1.66) |
Table 2
Kinetic parameters describing force-dependent models for ternary wild type versus ternaryΔH1.
95% confidence intervals (CIs) for each parameter are obtained through empirical bootstrapping. Bound to unbound B → U single-state slip bond parameters for ternaryΔH1 correspond to the strong to unbound 2 → 0 two-state catch bond parameters for ternary wild type. Akaike information criterion (AIC) and Bayesian information criterion (BIC) indicated that the single-state slip bond model represented ternaryΔH1 data better than the two-state slip bond model.
| TernaryΔH1: one-state slip bond | ||||
|---|---|---|---|---|
| B → U | ||||
| 0.49 | ||||
| CI (s−1) | (0.41, 0.58) | |||
| 0.48 | ||||
| CI (nm) | (0.36, 0.60) | |||
| AIC | 6.4 | |||
| BIC | 16.21 | |||
| Ternary wild type: two-state catch bond | ||||
| 2 → 0 | 2 → 1 | 1 → 0 | 1 → 2 | |
| 0.22 | 6.27 | 13.57 | 0.15 | |
| CI (s−1) | (0.15, 0.35) | (1.61, 369.66) | (13.27, 14.21) | (0.05, 0.39) |
| 0.55 | 3.46 | 0 | 4.72 | |
| CI (nm) | (0.28, 0.78) | (1.30, 18.30) | Fixed | (3.92, 5.70) |
| 0.98 | 15 | 0 | 2.73 | |
| CI (nm) | (0.74, 1.19) | Fixed | Fixed | (2.11, 3.40) |
| Ternary wild type: two-state catch bond, non-directional fit | ||||
| 2 → 0 | 2 → 1 | 1 → 0 | 1 → 2 | |
| 0.19 | 884.52 | 13.28 | 1.17 | |
| CI (s−1) | (0.05, 0.40) | (5.18, 1000.0) | (13.26, 14.37) | (0.08, 5.39) |
| 0.76 | 15.20 | 0 | 2.17 | |
| CI (nm) | (0.37, 1.43) | (2.44, 17.53) | Fixed | (1.22, 4.55) |
Key resources table
| Reagent type (species) or resource | Designation | Source or reference | Identifiers | Additional information |
|---|---|---|---|---|
| Recombinant DNA reagent | pGEX-TEV | Choi et al., 2012 | Ampicillin resistance; expression in bacterial cultures; pGEX-KG plasmid (ATCC) with a new TEV protease site Contact Weis lab for distribution | |
| Strain, strain background (Escherichia coli) | BL21 (DE3) Codon-Plus RIL | Agilent | 230245 | Strain for expressing recombinant proteins |
| Chemical compound, drug | Halo-tag ligand Succinimidyl Ester O4 | P6741 | Used for labeling GFP to attach to halotag constructs | |
| Chemical compound, drug | Biotin-NHS | Millipore Sigma | P203118 | Labeling actin filaments |
| Chemical compound, drug | Rhodamine phallodin | Cytoskeleton | PHDR1 | Visualizing actin filaments |
| Chemical compound, drug | Trolox | Fischer Scientific | AC218940010 | |
| Chemical compound, drug | Bovine serum albumin, BSA | MCLAB | UBSA-100 | |
| Other | Streptavidin-coated polystyrene microspheres | Bangs Laboratories, Inc | CP01004 | |
| Software, algorithm | UCSF Chimera 1.14 | Pettersen et al., 2004 | RRID:SCR_004097 | |
| Software algorithm | Python 3.9.1 | https://www.python.org/ | RRID:SCR_008394 | |
| Software algorithm | NumPy (v. 1.20.2) | https://numpy.org | RRID:SCR_008633 | Python library |
| Software algorithm | Pandas (v.1.3.1) | https://pandas.pydata.org | RRID:SCR_018214 | Python library |
| Software algorithm | SciPy (v.1.6.2) | https://scipy.org | RRID:SCR_008058 | Python library |
| Software algorithm | Matplotlib (v.3.5.1) | http://matplotlib.sourceforge.net | RRID:SCR_008624 | Python library |
Additional files
-
Supplementary file 1
Analysis of energy-minimized models of isolated and bound actin-binding domain (ABD) superimposed with actin.
- https://cdn.elifesciences.org/articles/80130/elife-80130-supp1-v3.docx
-
Supplementary file 2
Kinetic parameters for a ternaryΔH1 two-state slip bond model.
The estimated parameters for the purported weak state in the two-state slip bond model, B1, predicted binding lifetimes an order of magnitude larger than that of ternary wild type. Akaike information criterion (AIC) and Bayesian information criterion (BIC indicate the slip-bond model better describes the data).
- https://cdn.elifesciences.org/articles/80130/elife-80130-supp2-v3.docx
-
Supplementary file 3
R2 values of single exponential and biexponential fit to survival probability distributions in 2 pN bins.
Biexponential fit R2 are higher in both the ternary wild-type and ternaryΔH1 datasets, although the single exponential model describes ternaryΔH1 better (R2 > 0.95) than it does for ternary wild type (R2 > 0.8).
- https://cdn.elifesciences.org/articles/80130/elife-80130-supp3-v3.docx
-
Supplementary file 4
Two-sample Kolmogorov–Smirnov (KS) test comparing ternary wild-type versus ternaryΔH1 survival probability distributions.
- https://cdn.elifesciences.org/articles/80130/elife-80130-supp4-v3.docx
-
Supplementary file 5
Best-fit two-bound-state catch bond model kinetic parameters for single-step data of αE-catenin actin-binding domain (ABD) (top) and monomer (bottom).
- https://cdn.elifesciences.org/articles/80130/elife-80130-supp5-v3.docx
-
MDAR checklist
- https://cdn.elifesciences.org/articles/80130/elife-80130-mdarchecklist1-v3.docx
-
Source data 1
Contacts between isolated and bound actin-binding domain (ABD) superimposed with actin.
- https://cdn.elifesciences.org/articles/80130/elife-80130-data1-v3.zip
Download links
A two-part list of links to download the article, or parts of the article, in various formats.
Downloads (link to download the article as PDF)
Open citations (links to open the citations from this article in various online reference manager services)
Cite this article (links to download the citations from this article in formats compatible with various reference manager tools)
Mechanism of the cadherin–catenin F-actin catch bond interaction
eLife 11:e80130.
https://doi.org/10.7554/eLife.80130


