TRPV1 drugs alter core body temperature via central projections of primary afferent sensory neurons
- Department of Physiology, University of California, United States
- Department of Anatomy, University of California, United States
Figures
Figure 1 with 2 supplements
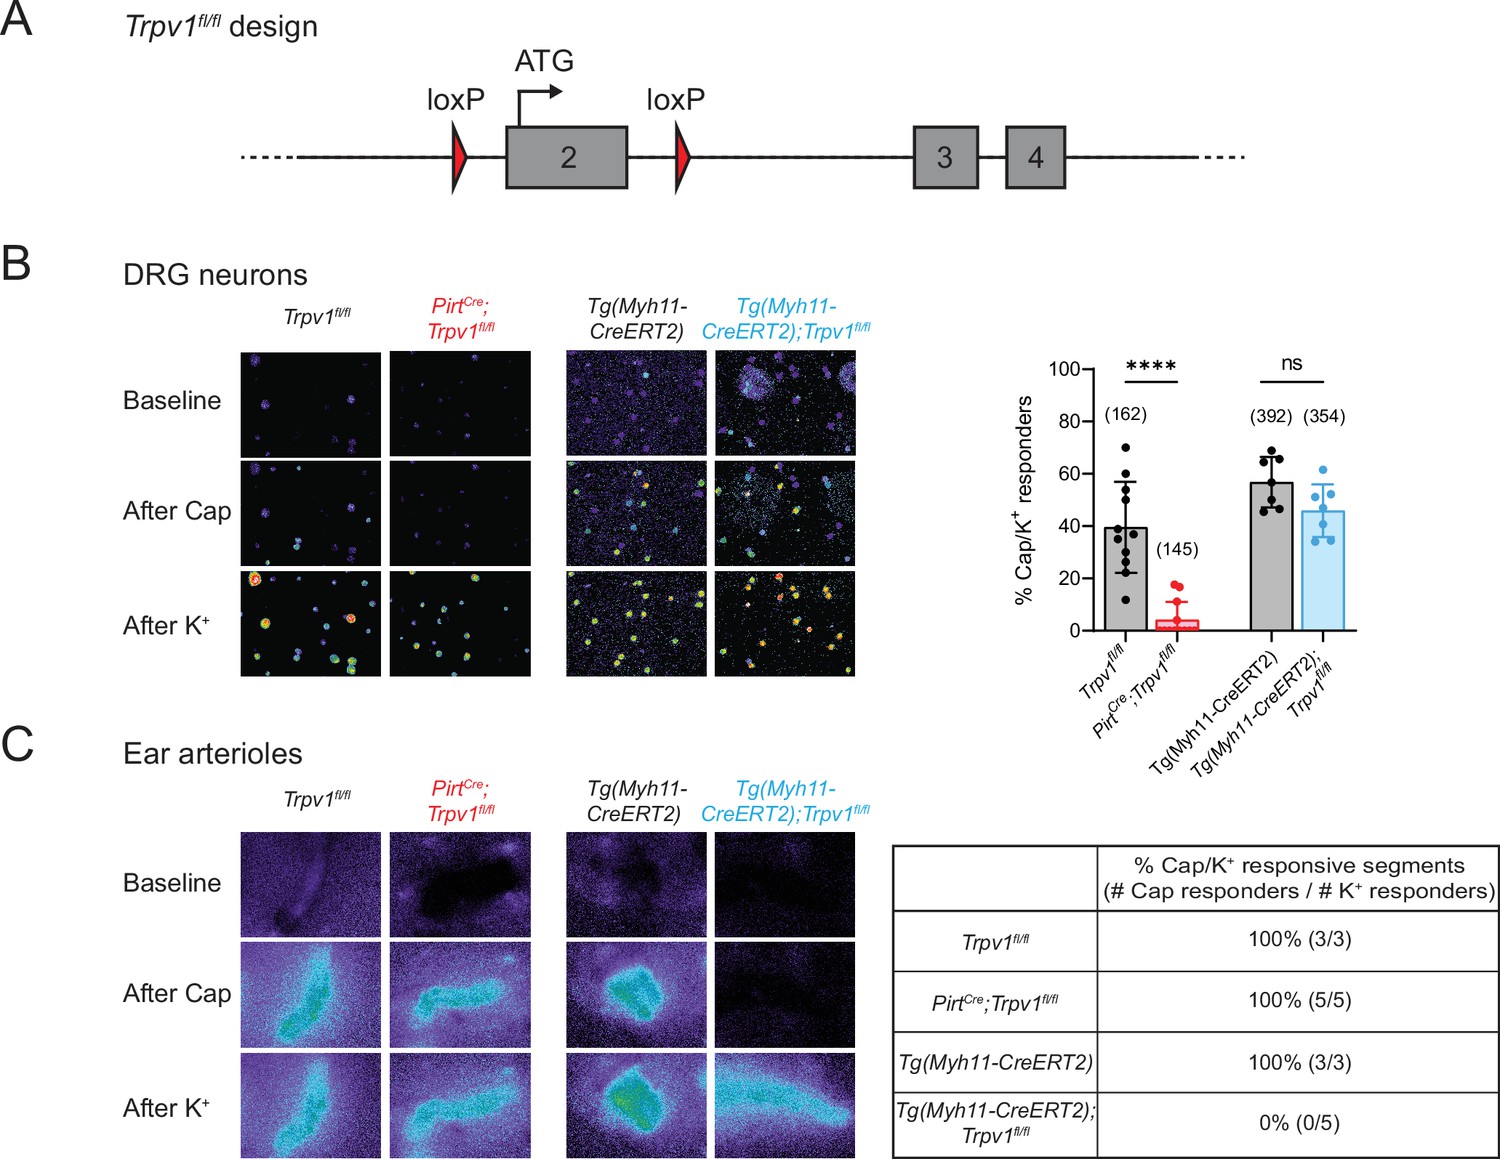
Tissue-specific knockout selectively abolishes functional expression of TRPV1 in sensory neurons or vascular smooth muscle cells.
(A) Design of the Trpv1-floxed mouse line. Numbered gray boxes indicate exons. (B) Calcium responses of Fura2-AM-loaded dorsal root ganglion (DRG) neurons from sensory neuron-specific knockouts (PirtCre;Trpv1fl/fl), smooth muscle-specific knockouts (Tg(Myh11-CreERT2);Trpv1fl/fl), and their respective genotype controls following capsaicin (5 µM) application. In these and all following experiments, control animals received same tamoxifen treatment as knockouts. High (~50 mM) extracellular K+ was used to reveal all neurons in the imaging field. Left panels show representative images of 340/380 emission ratio in rainbow scale; summary data are in bar graph on right. Each datapoint represents one experimental preparation. Total numbers of K+ responders are indicated in brackets. Statistical analyses by unpaired, two-tailed Welch’s t-test; ****: p ≤ 0.0001, ns: not significant. (C) Calcium responses of Fura2-AM-loaded ear arterioles of the indicated genotypes to capsaicin (10 µM) and high extracellular K+ application. Table on right shows the percentage of capsaicin-responsive segments among K+-responsive arteriole segments, with respective number of segments given in brackets. Source data for (B) can be found in Figure 1—source data 1.
-
Figure 1—source data 1
Calcium imaging of DRG neurons from tissue-specific Trpv1 knockouts and controls (related to Figure 1B).
- https://cdn.elifesciences.org/articles/80139/elife-80139-fig1-data1-v1.xlsx
Figure 1—figure supplement 1
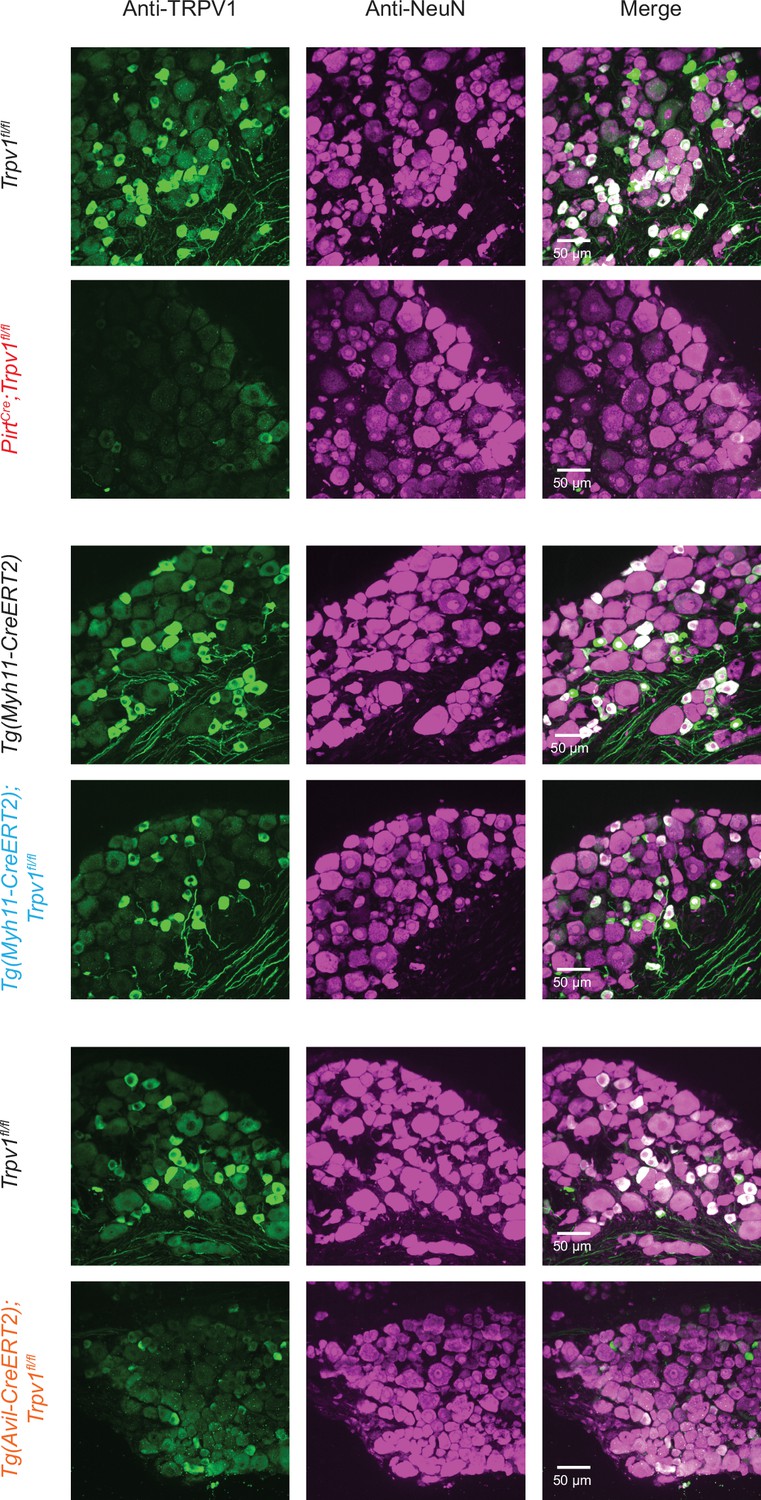
Representative images of dorsal root ganglion (DRG) sections from mice of indicated genotypes immunostained with anti-TRPV1 antibody (green).
Figure 1—figure supplement 2
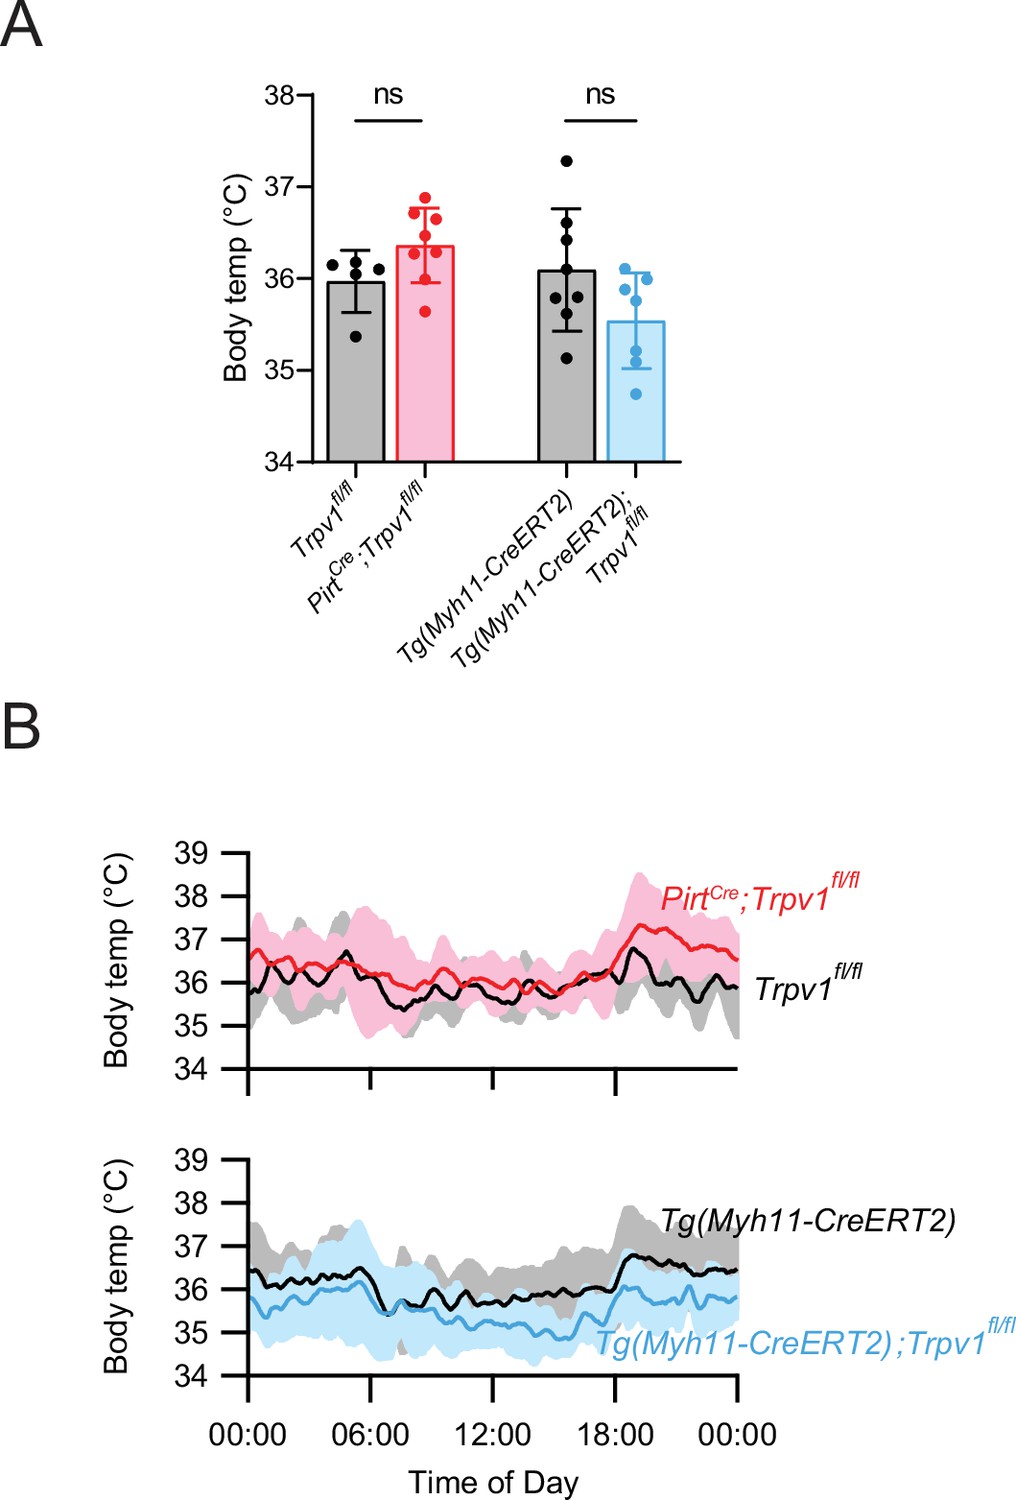
Average core body temperature (A) and circadian body temperature fluctuations (B) of the indicated genotypes.
Unpaired, two-tailed Welch’s t-test in (A), with each datapoint representing a single mouse; ns: not significant. Traces in (B) were smoothened by taking running averages (see Materials and methods). Source data for (A) are provided.
-
Figure 1—figure supplement 2—source data 1
Average core body temperature of tissue-specific Trpv1 knockouts and controls (related to Figure 1—figure supplement 2F).
- https://cdn.elifesciences.org/articles/80139/elife-80139-fig1-figsupp2-data1-v1.xlsx
Figure 2 with 1 supplement
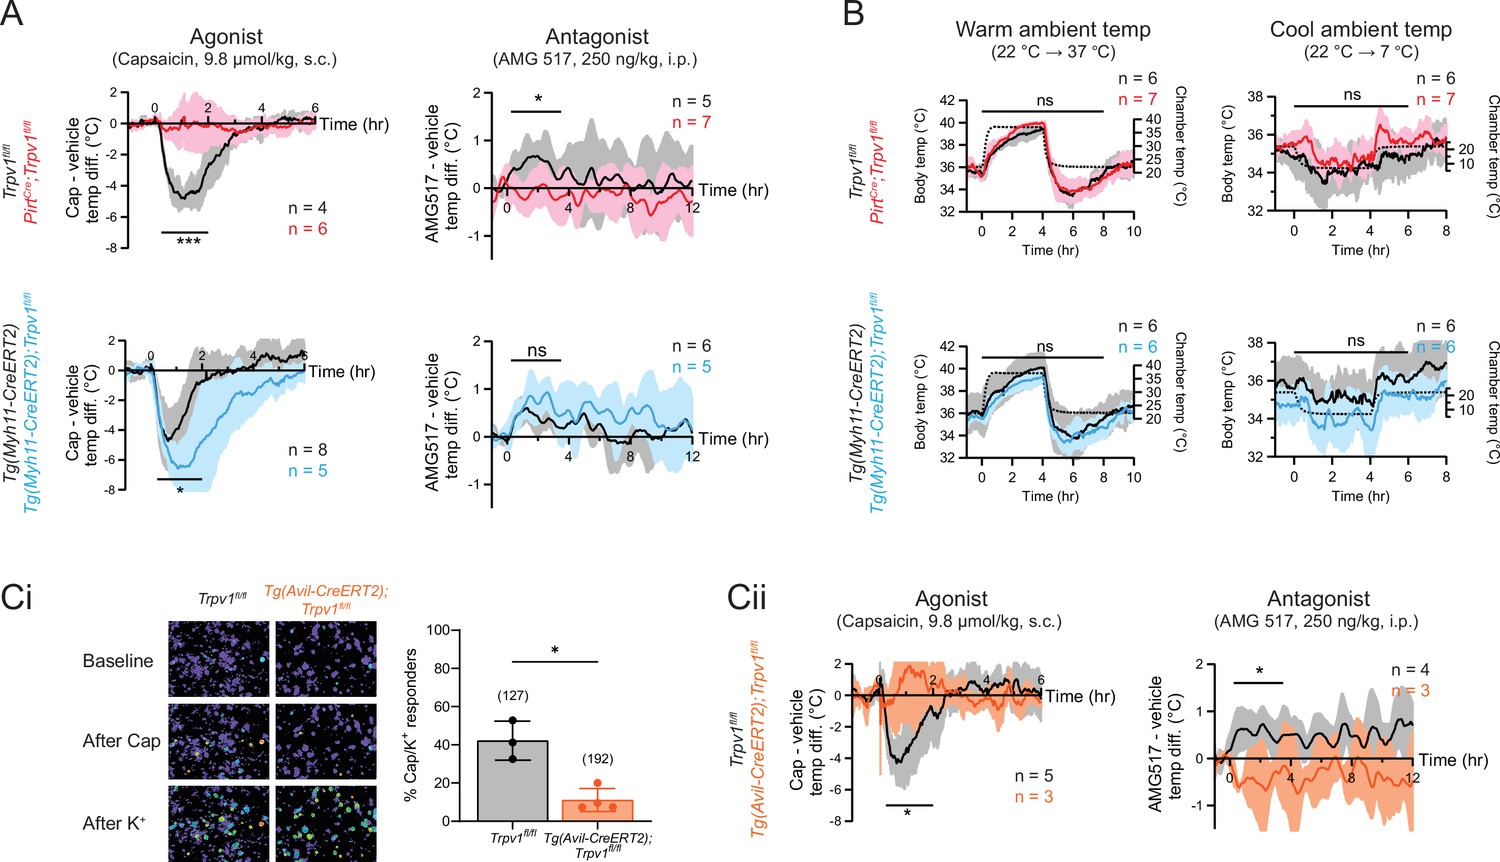
Neuronal, rather than vascular, TRPV1 mediates drug-evoked thermomodulatory effects.
(A) Telemetric recordings of core body temperatures of PirtCre;Trpv1fl/fl mice (red), Tg(Myh11-CreERT2);Trpv1fl/fl mice (blue), and their respective genotype controls (black). Traces show responses to subcutaneous injection of capsaicin (9.8 µmol/kg) and intraperitoneal injection of AMG517 (250 nmol/kg) administered at time 0, after subtracting measurements from vehicle-alone trials. Baselines (mean temperature across the 1-hr window before drug administration) have been offset to zero for comparison. Responses to AMG517 were smoothened by taking running averages to better display trends. All traces are mean ± standard deviation (SD). Black bars above traces indicate the time windows over which statistical comparisons (mixed effects analyses) between genotypes were made. (B) Body temperature response of the above genotypes to changes in ambient temperature (dotted line, right axis). Statistical comparisons by mixed effects analyses. Source data are in Figure 2—source data 2. (Ci) Representative images (left) and quantification (right) of dorsal root ganglion (DRG) neurons from Tg(Avil-CreERT2);Trpv1fl/fl and control mice that are responsive to capsaicin (5 µM) and high extracellular K+. Source data are in Figure 2—source data 3. (Cii) Body temperature recordings as in (A) but from Tg(Avil-CreERT2);Trpv1fl/fl mice (orange) and controls (black). Source data for (A) and (Cii) can be found in Figure 2—source data 1. For all statistical tests, *: p ≤ 0.05; ***: p ≤ 0.001; ns: not significant.
-
Figure 2—source data 1
Core body temperature responses of tissue-specific Trpv1 knockouts and controls to Trpv1 drugs (related to Figure 2A and Cii).
- https://cdn.elifesciences.org/articles/80139/elife-80139-fig2-data1-v1.xlsx
-
Figure 2—source data 2
Core body temperature responses of tissue-specific Trpv1 knockouts and controls to ambient temperature changes (related to Figure 2B).
- https://cdn.elifesciences.org/articles/80139/elife-80139-fig2-data2-v1.xlsx
-
Figure 2—source data 3
Calcium imaging of DRG neurons from inducible, sensory neuron-specific Trpv1 knockouts and controls (related to Figure 2Ci).
- https://cdn.elifesciences.org/articles/80139/elife-80139-fig2-data3-v1.xlsx
Figure 2—figure supplement 1
Core body temperature comparisons between drug- and vehicle-injected trials.
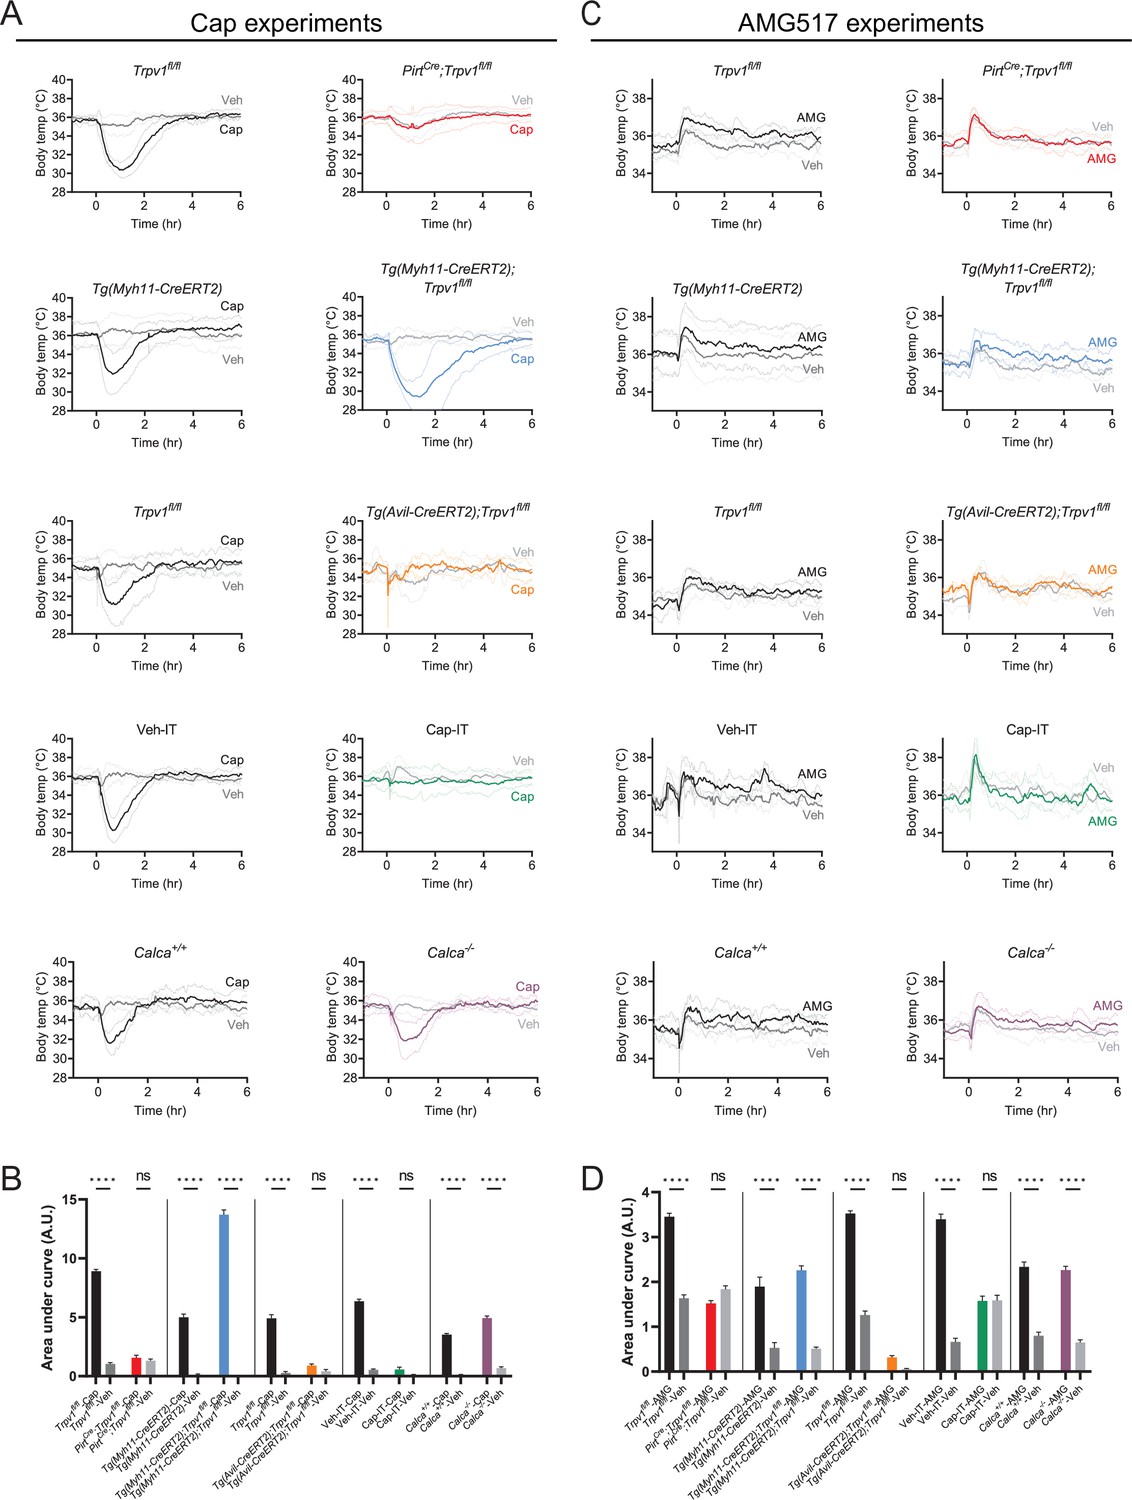
(A) Absolute core body temperature of mice of the indicated genotypes after subcutaneous injection of capsaicin (9.8 µmol/kg) or vehicle at time 0. Same data as in Figures 2 and 3. All traces are mean ± standard deviation (SD), with mean presented in thicker, darker strokes and SD in thinner, lighter strokes. (B) Statistical comparisons between capsaicin- and vehicle-injected trials. Area under curve (AUC) was extracted from the traces in (A) over the time window of 0–4 hr with baseline defined to be the 1 hr stretch before drug administration. Unpaired, one-way ANOVA with multiple comparisons were done on the extracted AUC values. (C) Absolute core body temperature of mice of indicated genotypes after intraperitoneal injection of AMG517 (250 nmol/kg) or vehicle at time 0. Same data as in Figures 2 and 3. In order to show all raw data, traces have not been smoothened in this panel. (D) Statistical comparisons between AMG- and vehicle-injected trials carried out with the same method as in (B). For all statistical tests, ****: p ≤ 0.0001; ns: not significant. Source data have been provided for all panels.
-
Figure 2—figure supplement 1—source data 1
Raw core body temperature data for comparisons between drug- and vehicle-injected trials (related to Figure 2—figure supplement 1).
- https://cdn.elifesciences.org/articles/80139/elife-80139-fig2-figsupp1-data1-v1.xlsx
Figure 3 with 1 supplement
Thermomodulatory effects of TRPV1-selective drugs require central transmission, but not peripheral calcitonin gene-related peptide (CGRP) release.
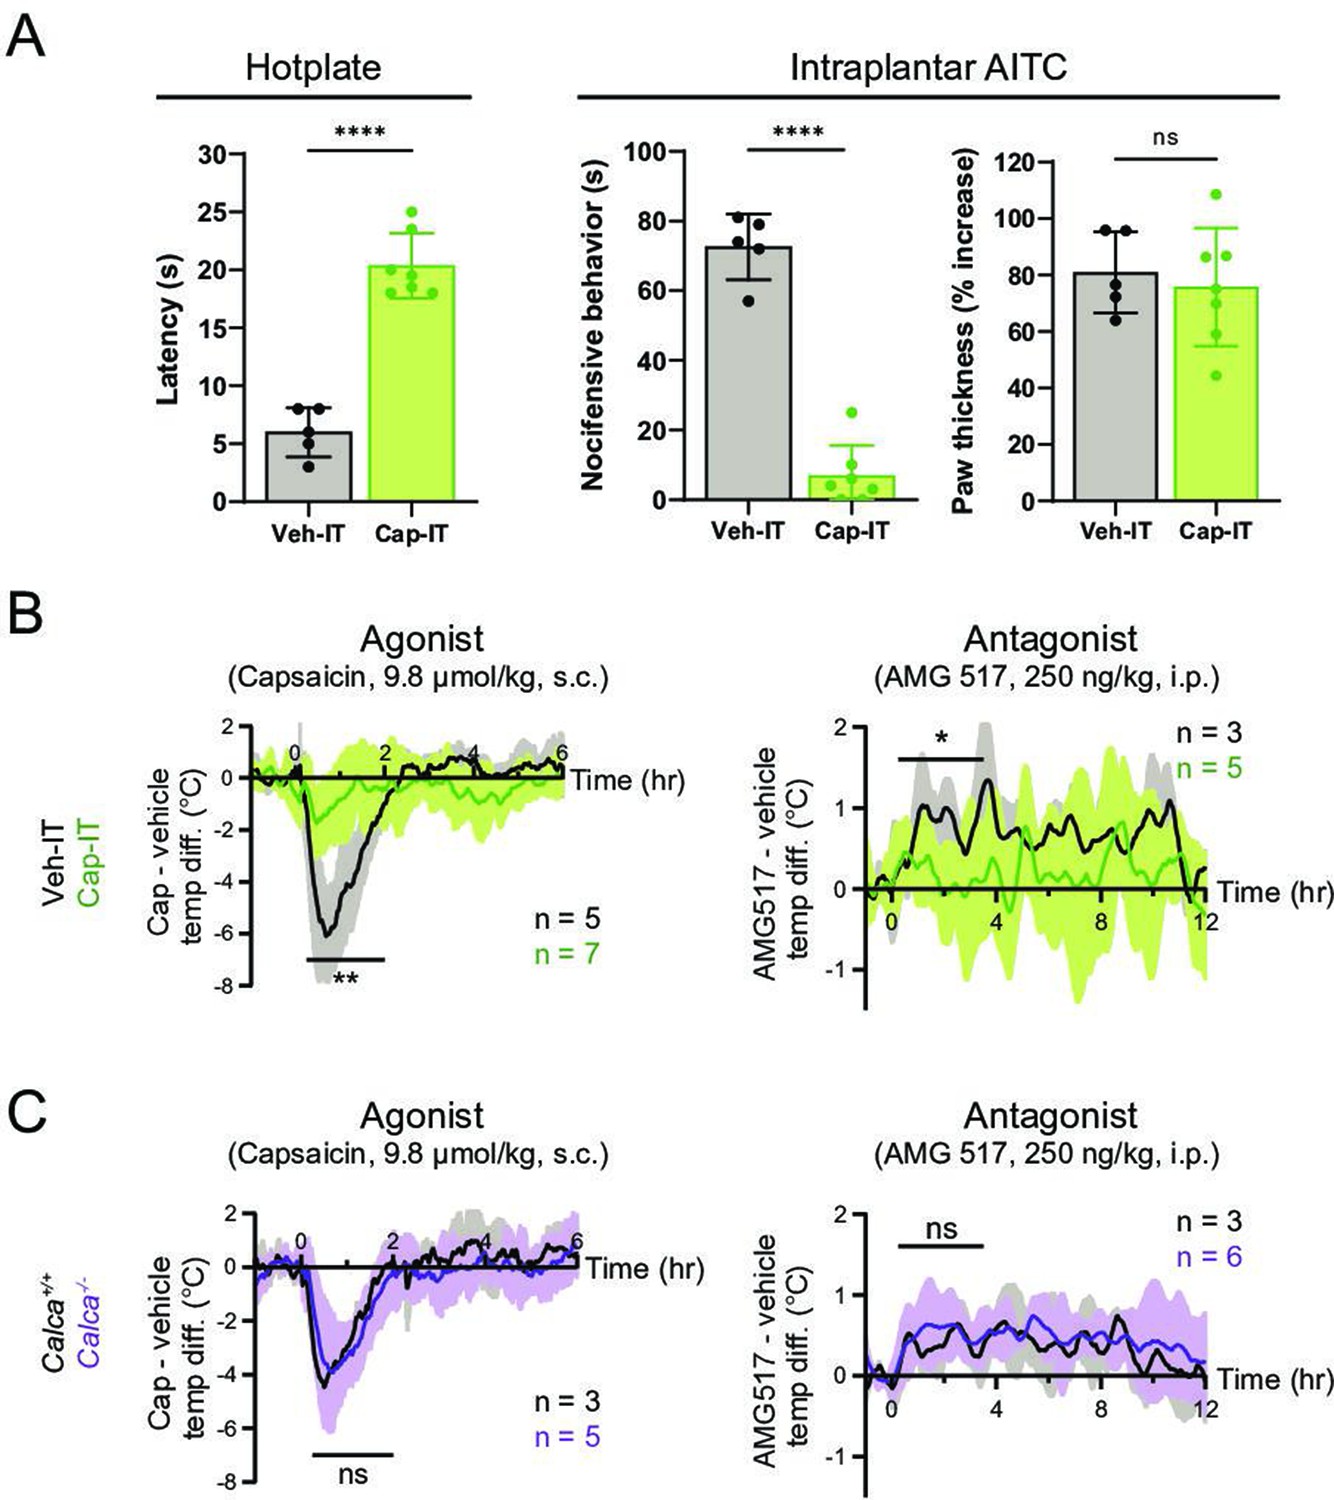
(A) Comparison of nocifensive behaviors of mice injected intrathecally with capsaicin (Cap-IT, green, 10 µg/mouse, n = 7) versus vehicle controls (black, n = 5). Cap-IT mice were significantly slower (i.e., had higher latency) in showing the first nocifensive response in a hotplate test (left). Cap-IT mice also spent significantly less time in nocifensive behaviors (middle) after intraplantar AITC injection despite similar levels of local edema (right), suggesting successful selective ablation of TRPV1+ nociceptors’ central projections. Unpaired, two-tailed Welch’s t-test in all panels. See Figure 3—source data 1 for source data. (B) Core body temperature recordings showing diminished hypo- and hyperthermic responses to capsaicin and AMG517, respectively, in Cap-IT mice. (C) Normal hypo- and hyperthermic responses to capsaicin and AMG517, respectively, in Calca−/− mice. All traces are plotted and statistical tests carried out as in Figure 2. For all statistical tests, *: p ≤ 0.05; ****: p ≤ 0.0001; ns: not significant. Source data for (B) and (C) are in Figure 3—source data 2.
-
Figure 3—source data 1
Nocifensive behaviors of Cap-IT and Veh-IT mice (related to Figure 3A).
- https://cdn.elifesciences.org/articles/80139/elife-80139-fig3-data1-v1.xlsx
-
Figure 3—source data 2
Core body temperature responses to Trpv1 drugs of Cap-IT and Calca-/- mice as well as controls (related to Figure 3B and C).
- https://cdn.elifesciences.org/articles/80139/elife-80139-fig3-data2-v1.xlsx
Figure 3—figure supplement 1
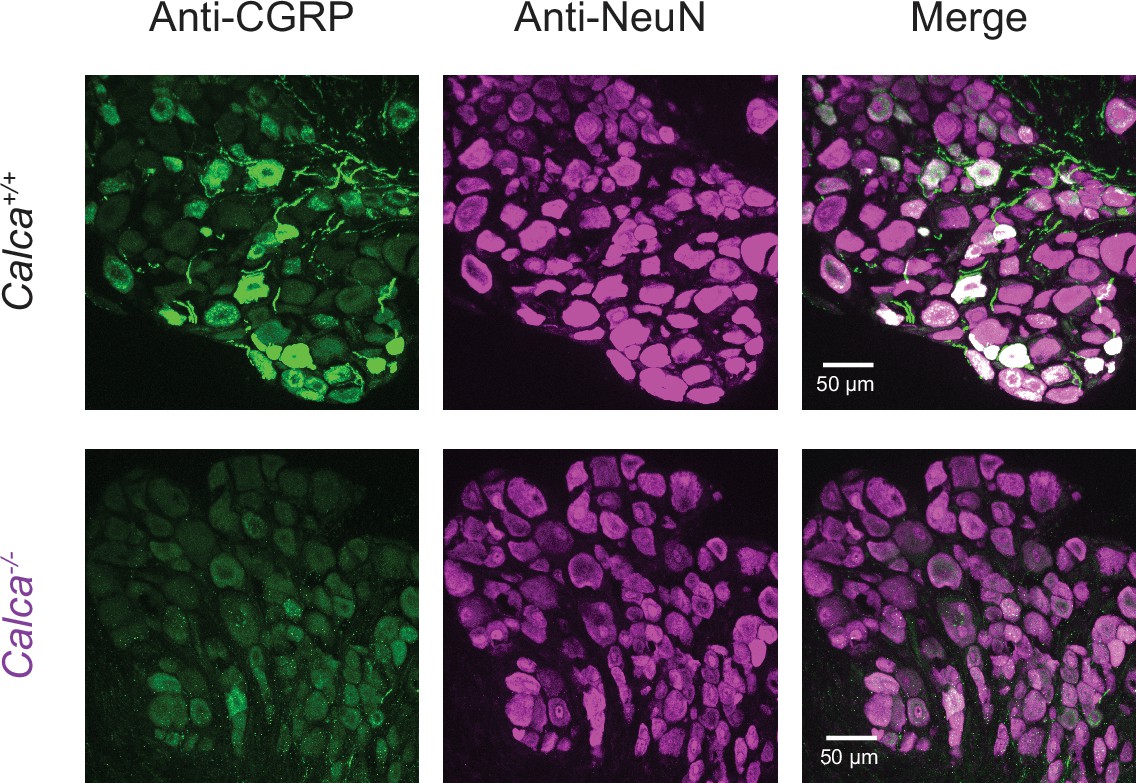
Successful ablation of calcitonin gene-related peptide (CGRP) expression in Calca−/− mouse line as shown by the lack of anti-CGRP immunosignal (green) in an example dorsal root ganglion (DRG) section from a Calca−/− mouse compared to a wild-type littermate control.
Anti-NeuN (magenta) is included to reveal all neuronal cell bodies.
Additional files
Download links
A two-part list of links to download the article, or parts of the article, in various formats.
Downloads (link to download the article as PDF)
Open citations (links to open the citations from this article in various online reference manager services)
Cite this article (links to download the citations from this article in formats compatible with various reference manager tools)
TRPV1 drugs alter core body temperature via central projections of primary afferent sensory neurons
eLife 11:e80139.
https://doi.org/10.7554/eLife.80139


