The role of conjunctive representations in prioritizing and selecting planned actions
- Department of Cognitive, Linguistic, and Psychological Sciences, Brown University, United States
- RIKEN Center for Brain Science, Japan
- Department of Psychology, University of Oregon, United States
- Carney Institute for Brain Science, Brown University, United States
Figures
Figure 1
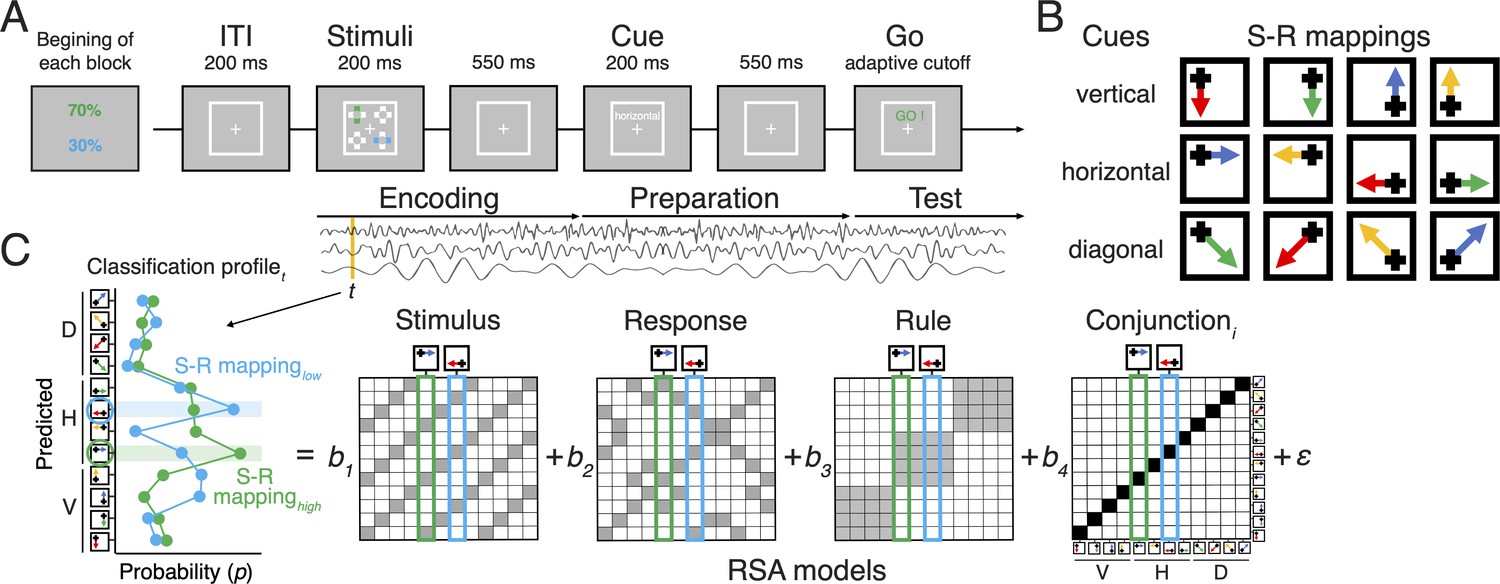
Task design and the procedure of decoding analysis.
(A) Sequence of trial events in the rule-selection task with two independent action plans. Test probabilities of each action are assigned randomly every block. (B) Spatial translation of different rules (rows) mapping different stimuli (columns) to responses (arrows). (C) Schematic of the steps used for representational similarity analysis (RSA). For each sample time (t), a scalp-distributed pattern of EEG power was used to decode the specific rule/stimulus/response configuration of two actions of a given trial. The decoder produced sets of classification probabilities for each of the possible action constellations. The profile of classification probabilities reflects the similarity structure of the underlying representations, where action constellations with shared features are more likely to be confused. The figure shows an example of classification probabilities for two actions cued by a shared rule and two independent stimuli. For each trial and timepoint, the profile of classification probabilities was regressed onto model vectors as predictors that reflect the different, possible representations. In each model matrix, the shading of squares indicates the theoretically predicted classification probabilities (darker shading means higher probabilities) in all possible pairs of constellation. The coefficients associated with each predictor (i.e. t-values) reflect the unique variance explained by each of the constituent features and their conjunction for each action plan.
Figure 2
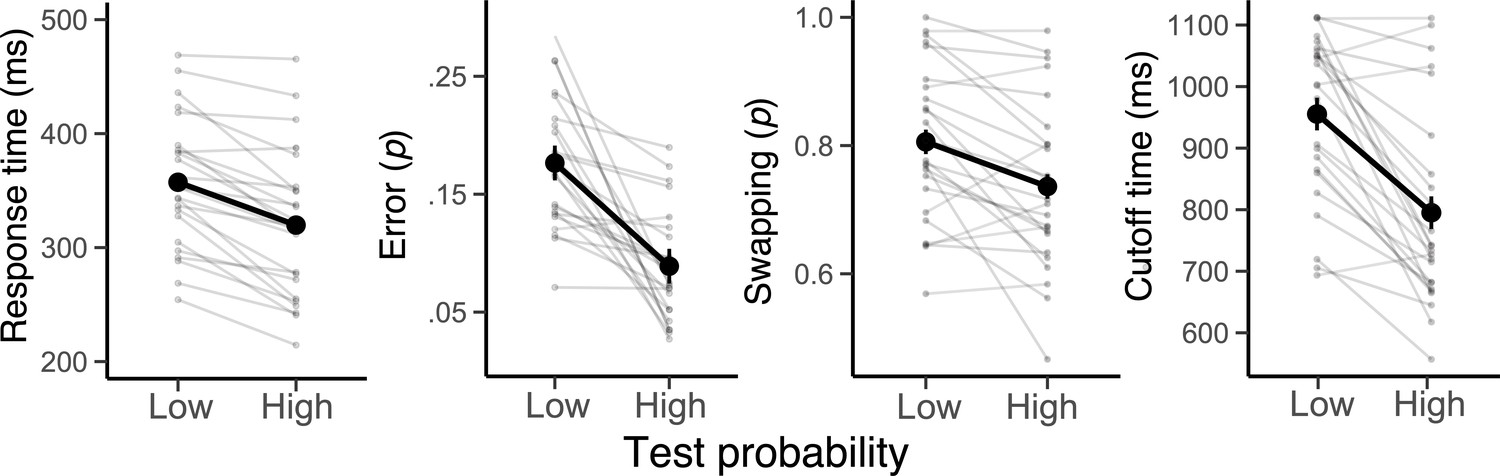
The effect of priority of actions on behavior.
Average response times, error probability, swapping probability, and cutoff time (i.e. trial-to-trial response deadlines) in the low and high test probability conditions. Note that a swapping error was computed out of all committed errors, rather than all trials. Error bars specify 95% within-subject confidence intervals. Faint lines plot individual participants.
Figure 3 with 1 supplement
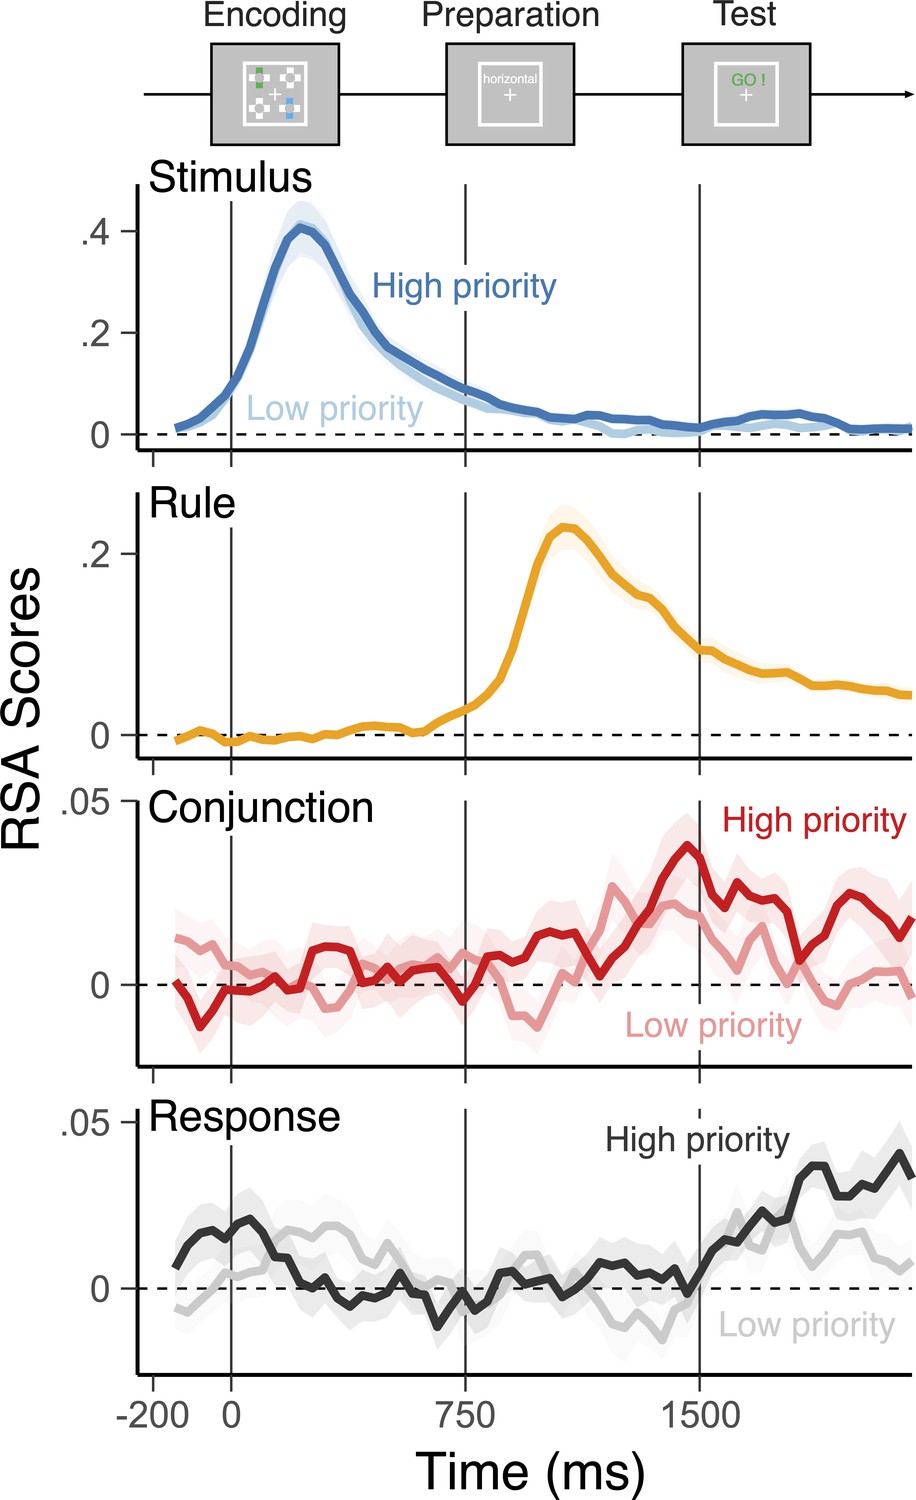
Trajectories of decoded representations of two actions in the different levels of priority.
Average, single-trial t-values associated with each of the basic features (rule, stimulus, and response) and their conjunction derived from the representational similarity analysis (RSA), separately for high-priority (bold colors) action and low-priority action (faint colors). Shaded regions specify the 95% within-subject standard errors.
Figure 3—figure supplement 1
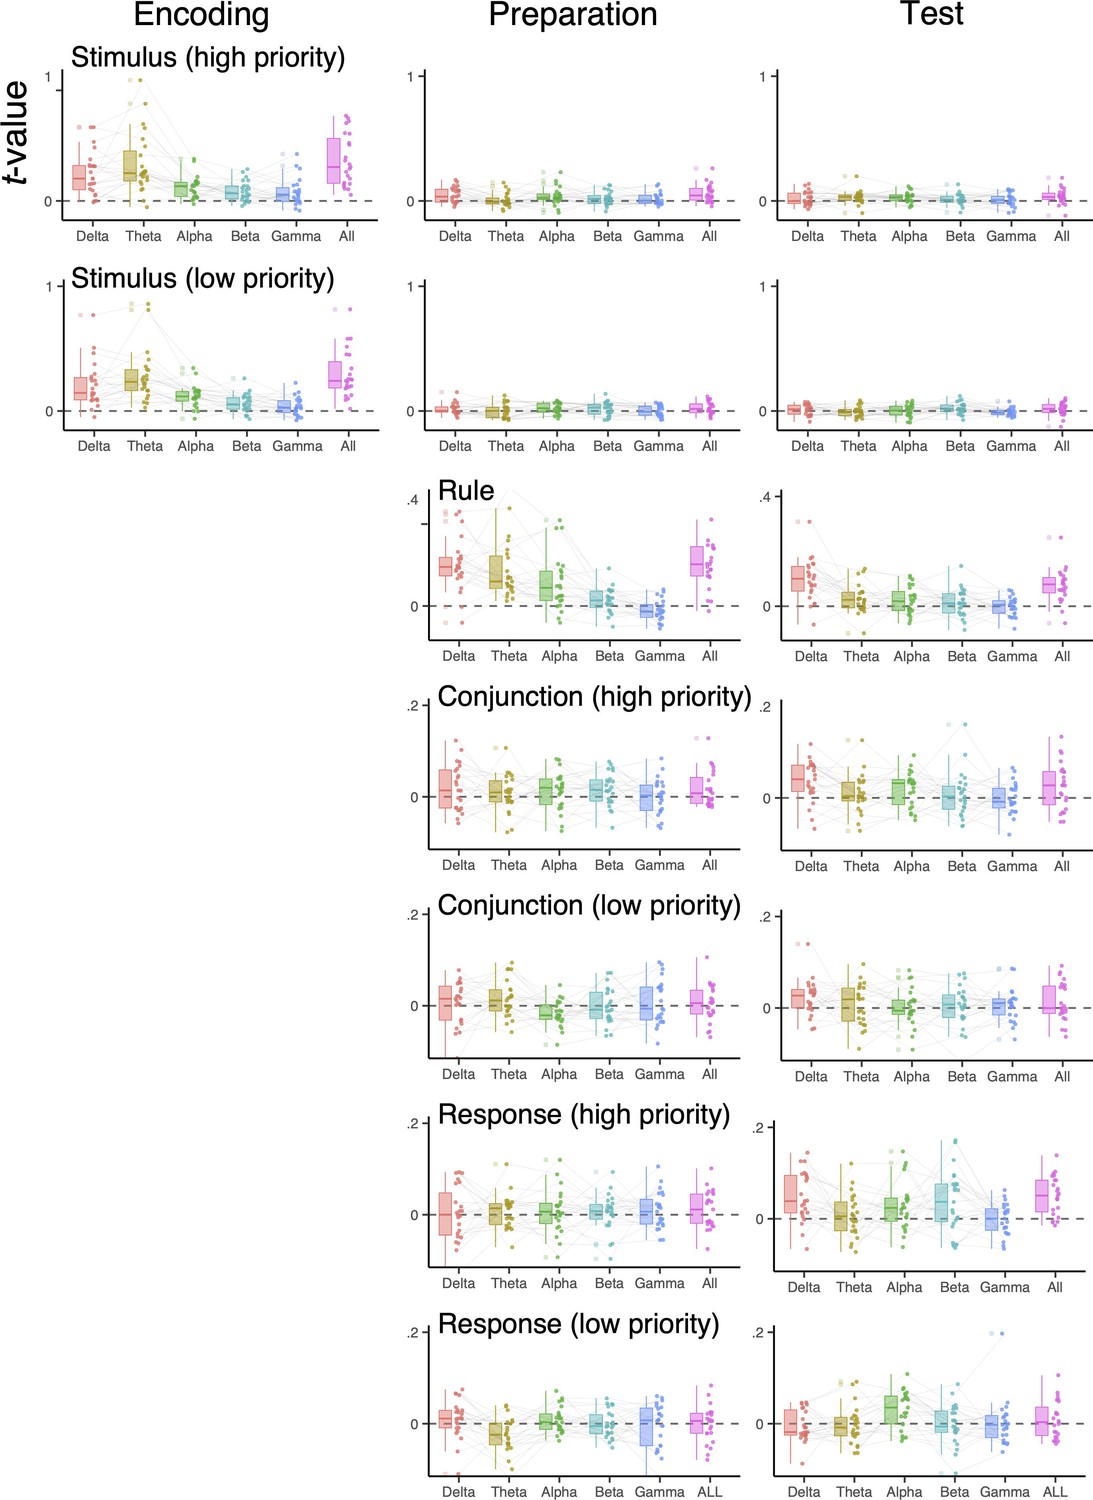
Decoded representations of two actions using frequency-specific scalp topography.
The representational similarity analysis scores of individual subjects using EEG signals in specific frequency ranges (1–3 Hz for the delta-band, 4–7 Hz for the theta-band, 8–12 Hz for the alpha-band, 13–30 Hz for the beta-band, 31–35 Hz for the gamma-band, and 1–35 Hz for all). EEG signals were averaged over encoding (0–750 ms), maintenance (750–1500 ms), and selection (1500–2200 ms) time intervals before decoding analysis.
Figure 4 with 1 supplement
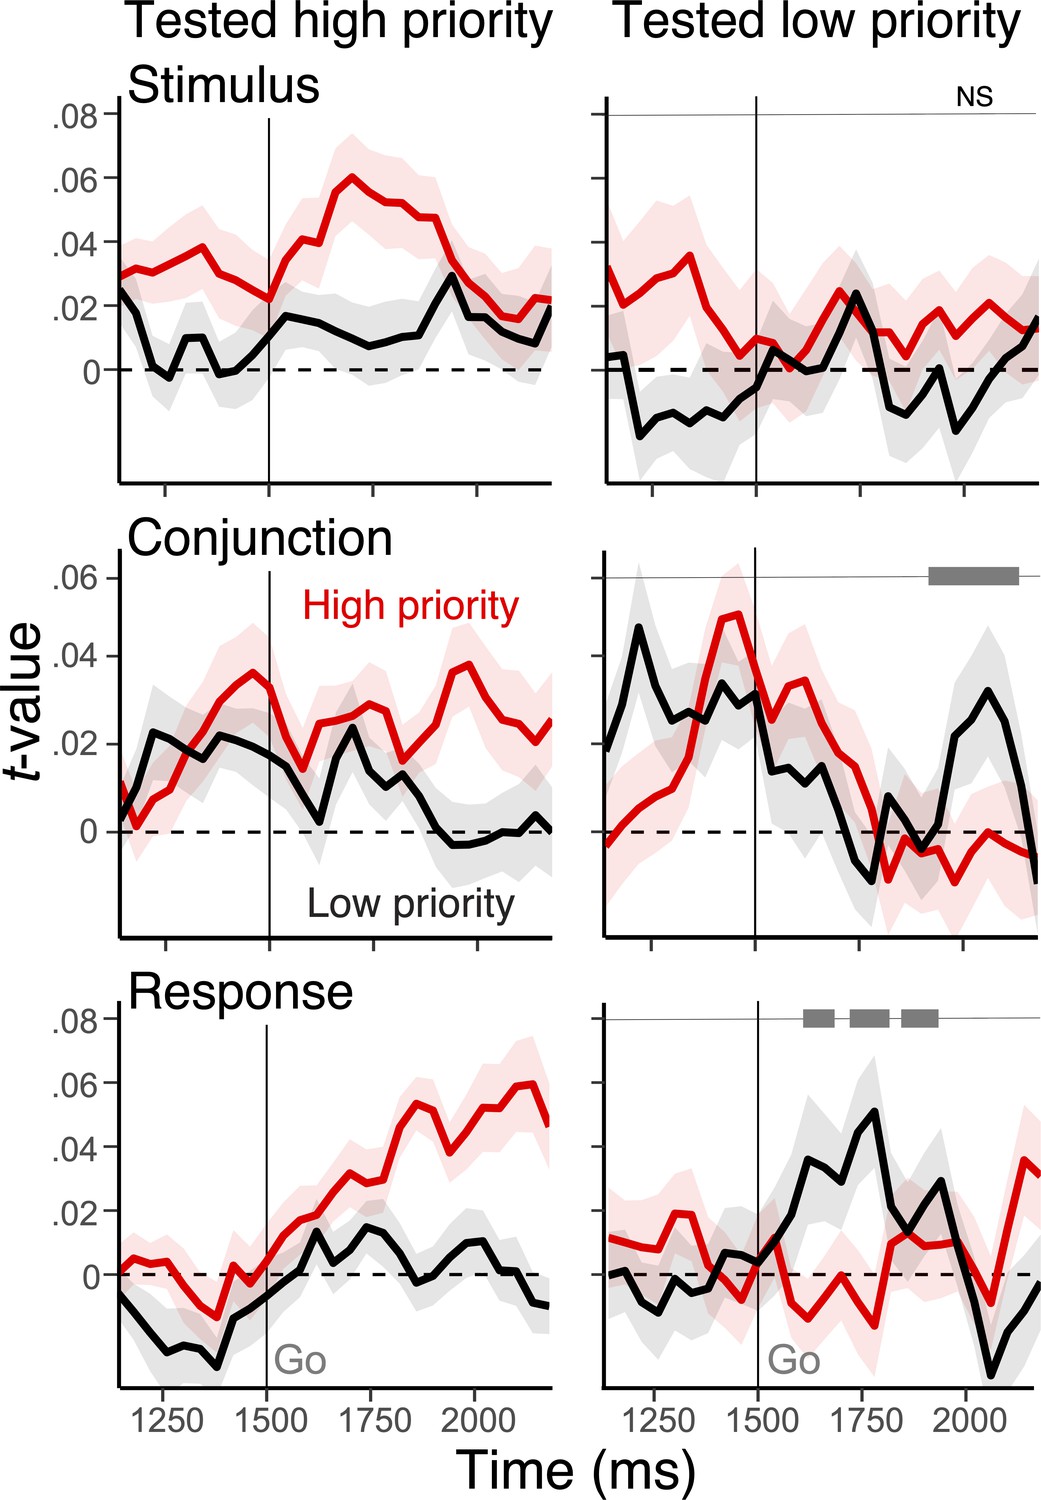
Modulation of action representations during selection using stimulus-aligned EEG.
Average, single-trial t-values associated with the stimulus, conjunction, and response derived from the representational similarity analysis (RSA), separately for high-priority (red) action and low-priority action (black). The left panels show RSA scores when the high-priority action was tested, whereas the right panels show the result for the low-priority action. Shaded regions specify the within-subject standard errors. On the right side panels, the gray bars at the top show clusters with a significant interaction effect between the priority and the test type of actions after cluster-based correction (cluster-forming threshold, p<0.05).
Figure 4—figure supplement 1
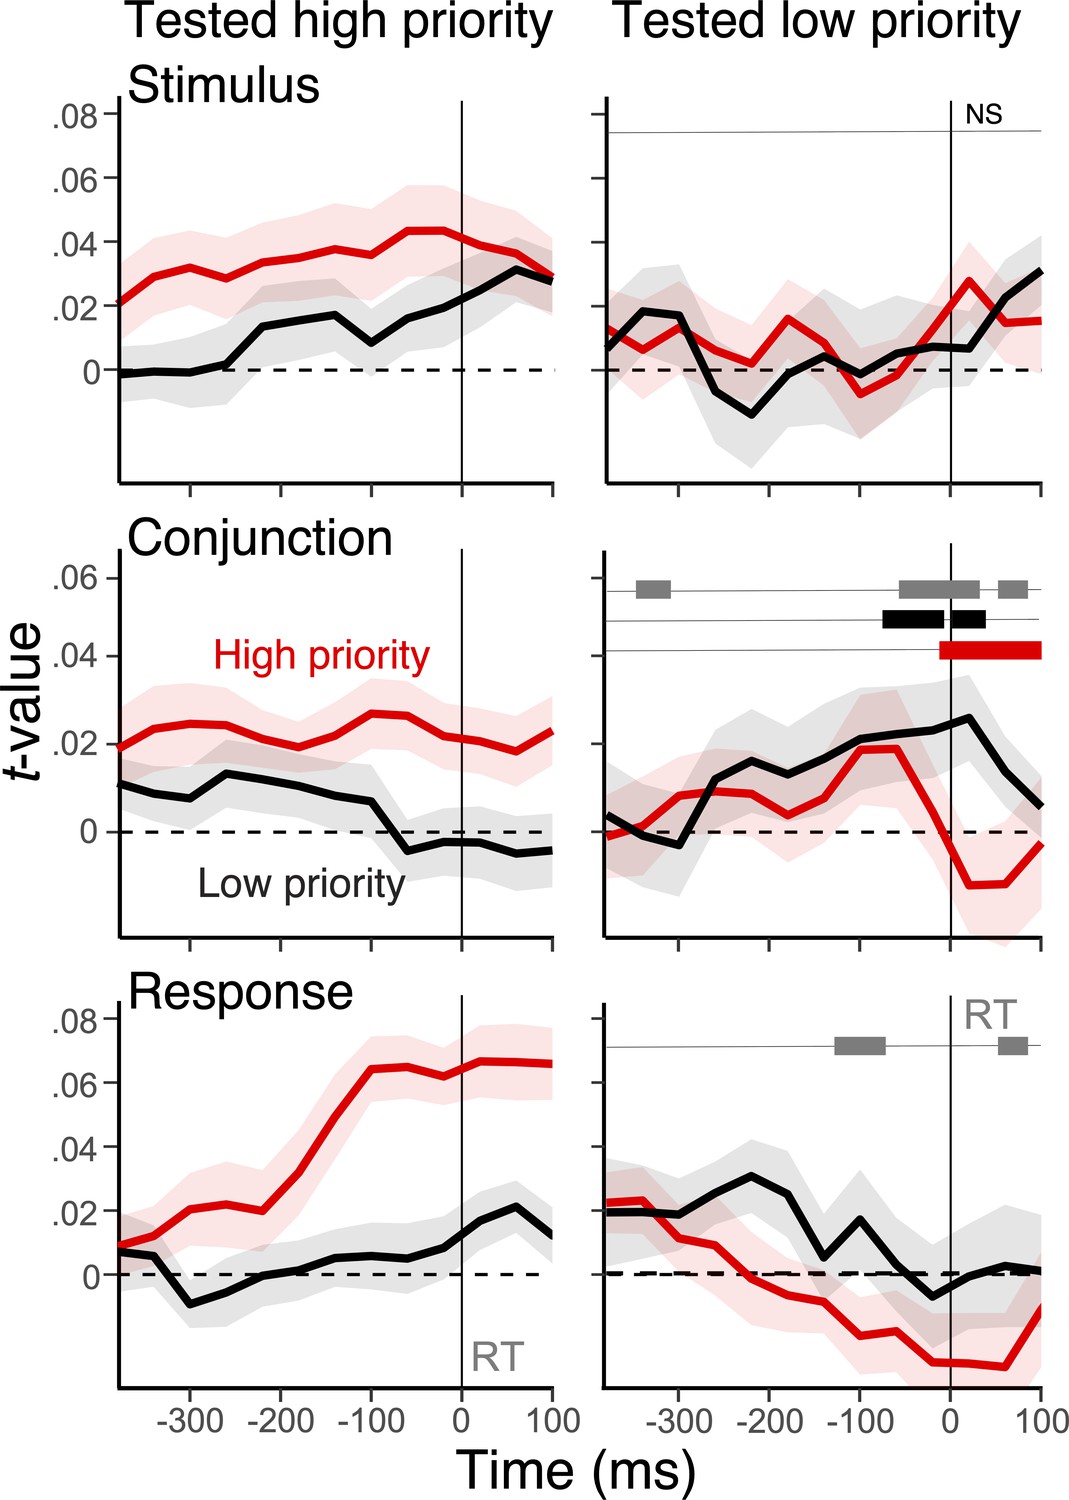
Modulation of action representations during selection using response-aligned EEG.
Average, single-trial t-values associated with the stimulus, conjunction, and response derived from the representational similarity analysis (RSA), separately for high-priority (red) action and low-priority action (black). The left panels show RSA scores when the high-priority action was tested, whereas the right panels show the result for the low-priority action. Shaded regions specify the within-subject standard errors. On the right side panels, the gray bars at the top show clusters with a significant interaction effect between the priority and the test type of actions, the black bars indicate the difference in low-priority conjunctions in each test context, and the red bars indicate the difference in high-priority conjunctions in each text context (cluster-forming threshold, p<0.05).
Figure 5
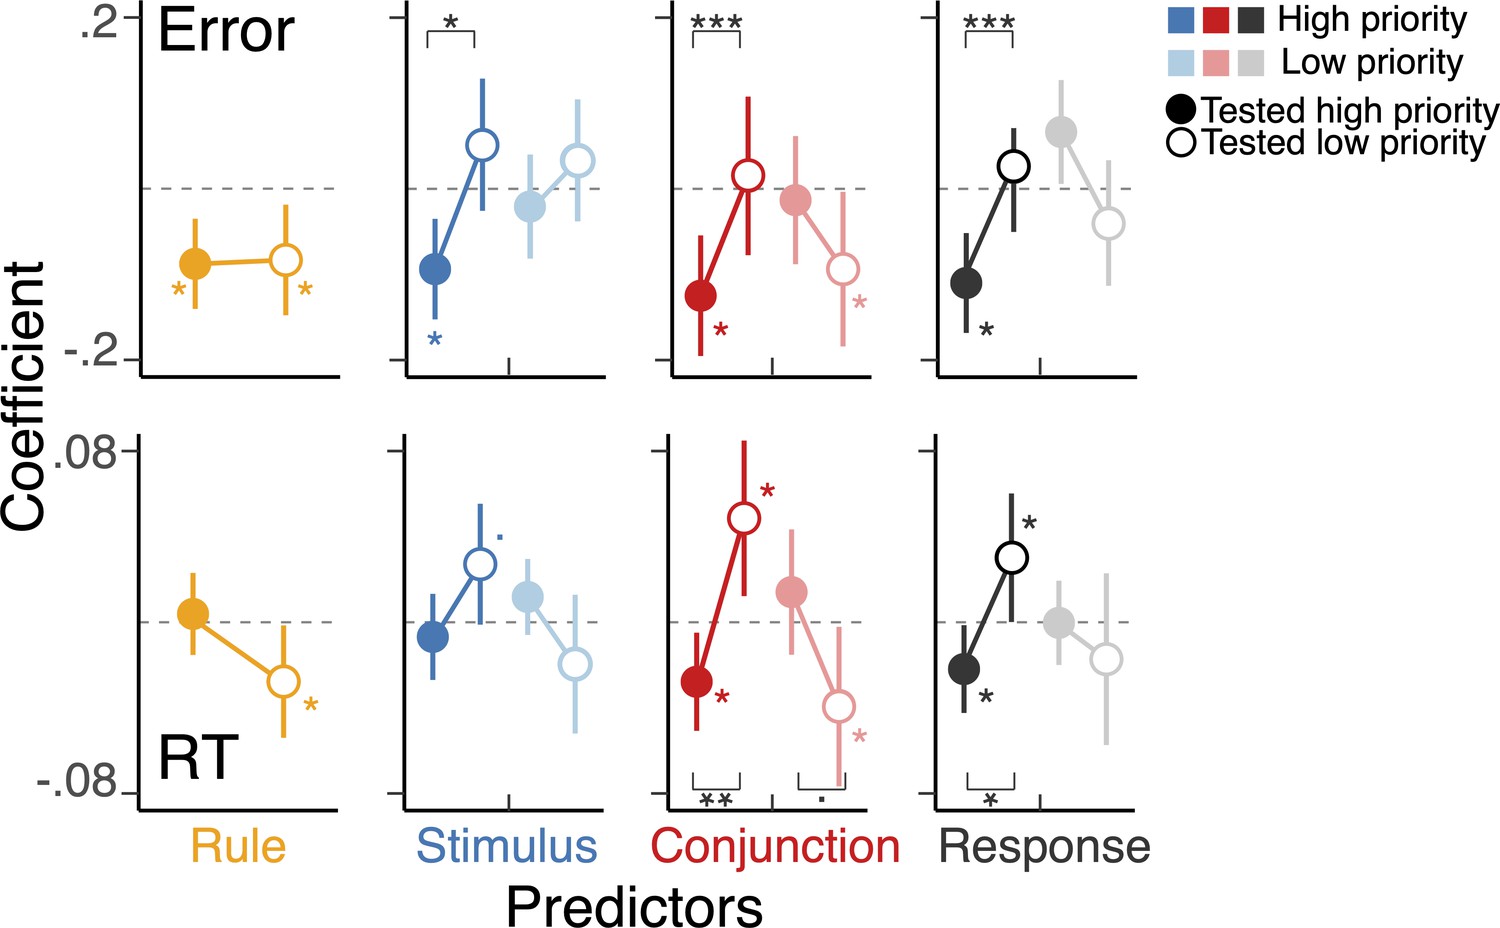
Interference between tested and untested actions with different levels of priority.
The coefficients of the multilevel regression models predicting the variability in trial-to-trial RTs and errors. The model included representational similarity analysis scores of all action features of both actions during the test phase as predictors as well as the main effect of text context. The left-half side of a panel (denoted as ‘H’) for stimulus, conjunction, and response corresponds to the features of high-priority action, and the right-half side (denoted as ‘L’) shows the features of low-priority action. The stars without a bracket indicate the level of significance for individual coefficients, and the stars with a bracket show the effect of selection (i.e. an action required for the test). *, **, ***, and a dot indicate p<0.05, p<0.01, p<.001, and p<0.1, respectively.
Author response image 1
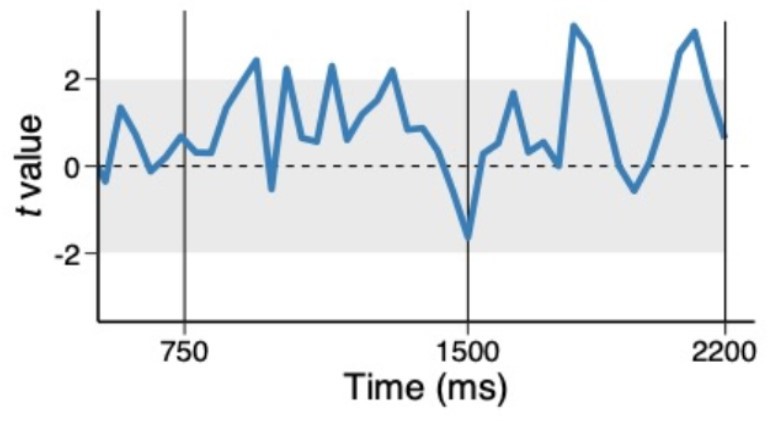
Trial-to-trial variability between high and low priority conjunctions, using above median trials.
The coefficients of the multilevel regression model predicting the variability in trial-to-trial highpriority conjunction by low-priority conjunction.
Author response image 2
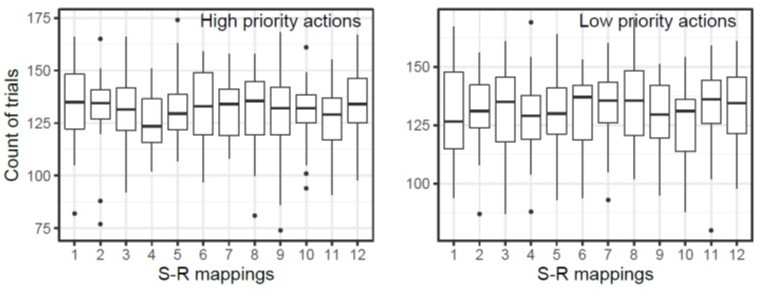
The number of retained trials of each S-R mapping condition.
The box plot shows the count of number of trials retained after artifact rejection. The number label of each S-R mapping corresponds to Figure 1C in the main text.
Author response image 3
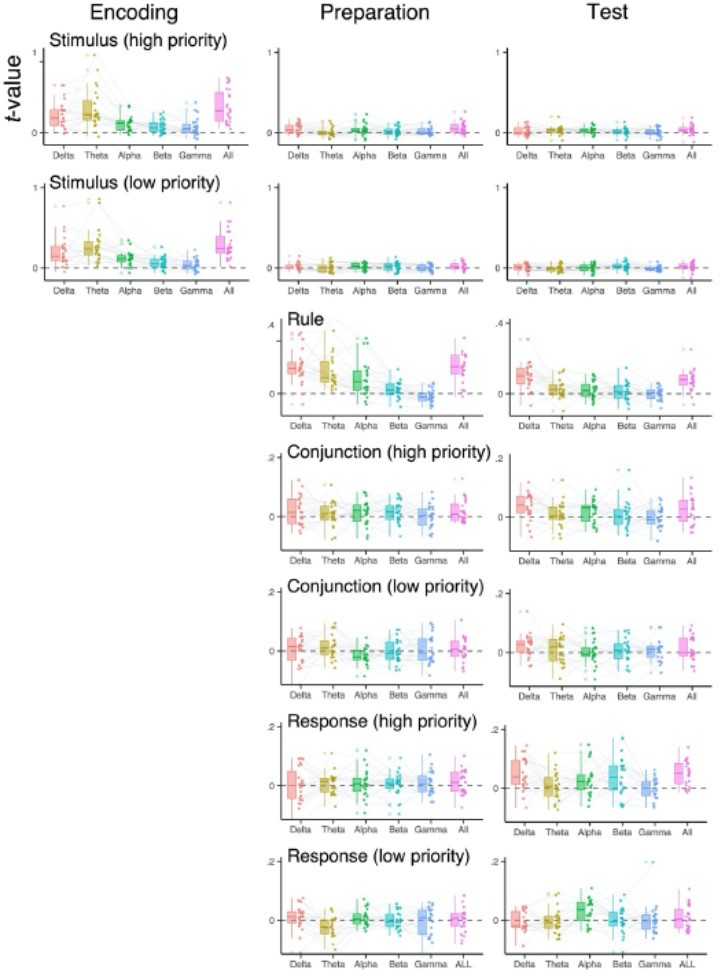
Decoded representations of two actions using frequency-specific scalptopography.
The RSA scores of individual subjects using EEG signals in specific frequency ranges (1-3 Hz for the δ-band, 4-7 Hz for the theta-band, 8-12 Hz for the α- band, 13-30 for the β-band, 31-35 Hz for the γ-band, and 1-35 Hz for all). EEG signals were averaged over encoding (0 to 750 ms), maintenance (750 to 1500 ms) selection (1500 to 220 ms) time intervals before decoding analysis.
Tables
Table 1
Trial-by-trial representational similarity analysis scores of high- and low-priority actions in each test probability context during the test phase.
| Decoded features | Tested high priority | Tested low priority | ||
|---|---|---|---|---|
| beta (CI) | t-Value | beta (CI) | t-Value | |
| Rule | 0.071 (.05.09) | 6.08*** | 0.069 (.04.09) | 4.76** |
| Stimulus (high priority) | 0.034 (.01.05) | 3.41* | 0.021 (.01.03) | 2.9* |
| Conjunction (high priority) | 0.021 (.01.04) | 3.57* | 0.007 (–.01.02) | 0.86 |
| Response (high priority) | 0.034 (.02.05) | 5.04** | 0.009 (–.01.03) | 1.04 |
| Stimulus (low priority) | 0.011 (.01.02) | 2.20* | 0.014 (–.01.03) | 1.30 |
| Conjunction (low priority) | 0.003 (–.01.01) | 0.61 | 0.001(–.01.02) | 0.12 |
| Response (low priority) | 0.008 (–.01.02) | 1.61 | 0.015(–.01.03) | 1.82 |
-
Note: *, **, ***, and a dot indicate p<0.05, p<0.01, p<.001.
Table 2
Cluster-level statistics for the main effects of the interaction model between test type and priority regressed on the representational similarity analysis (RSA) scores.
| RSA scores | Effect | Time (ms) | Cluster T-value | Cluster p-value |
|---|---|---|---|---|
| Stimulus | Priority | 1566–1598 | 20.11 | <0.01 |
| Priority | 1846–1866 | 12.45 | <0.01 | |
| Conjunction | Test type | 1898–2050 | 98.36 | <0.01 |
| Response | Priority | 1738–1794 | 38.70 | <0.01 |
| Test type | 1858–1894 | 22.94 | <0.01 | |
| Test type | 2014–2110 | 67.02 | <0.01 |
-
Note: The clusters were identified from the model that included the effect of priority and test type and their interaction using a cluster-forming threshold, p<0.05. The interaction effect is shown in Figure 4.
Additional files
Download links
A two-part list of links to download the article, or parts of the article, in various formats.
Downloads (link to download the article as PDF)
Open citations (links to open the citations from this article in various online reference manager services)
Cite this article (links to download the citations from this article in formats compatible with various reference manager tools)
The role of conjunctive representations in prioritizing and selecting planned actions
eLife 11:e80153.
https://doi.org/10.7554/eLife.80153


