Interplay between PML NBs and HIRA for H3.3 dynamics following type I interferon stimulus
- University of Lyon, Université Claude Bernard Lyon 1, CNRS UMR 5261, INSERM U 1315, LabEx DEVweCAN, Institut NeuroMyoGène (INMG), Pathophysiology and Genetics of the Neuron and Muscle (PGNM) laboratory, team Chromatin Dynamics, Nuclear Domains, Virus, France
- Univ Lyon, Université Claude Bernard Lyon 1, CNRS UMR 5310, INSERM U 1217, Institut NeuroMyoGène (INMG), team Nerve-Muscle interactions, France
Figures
Figure 1 with 1 supplement
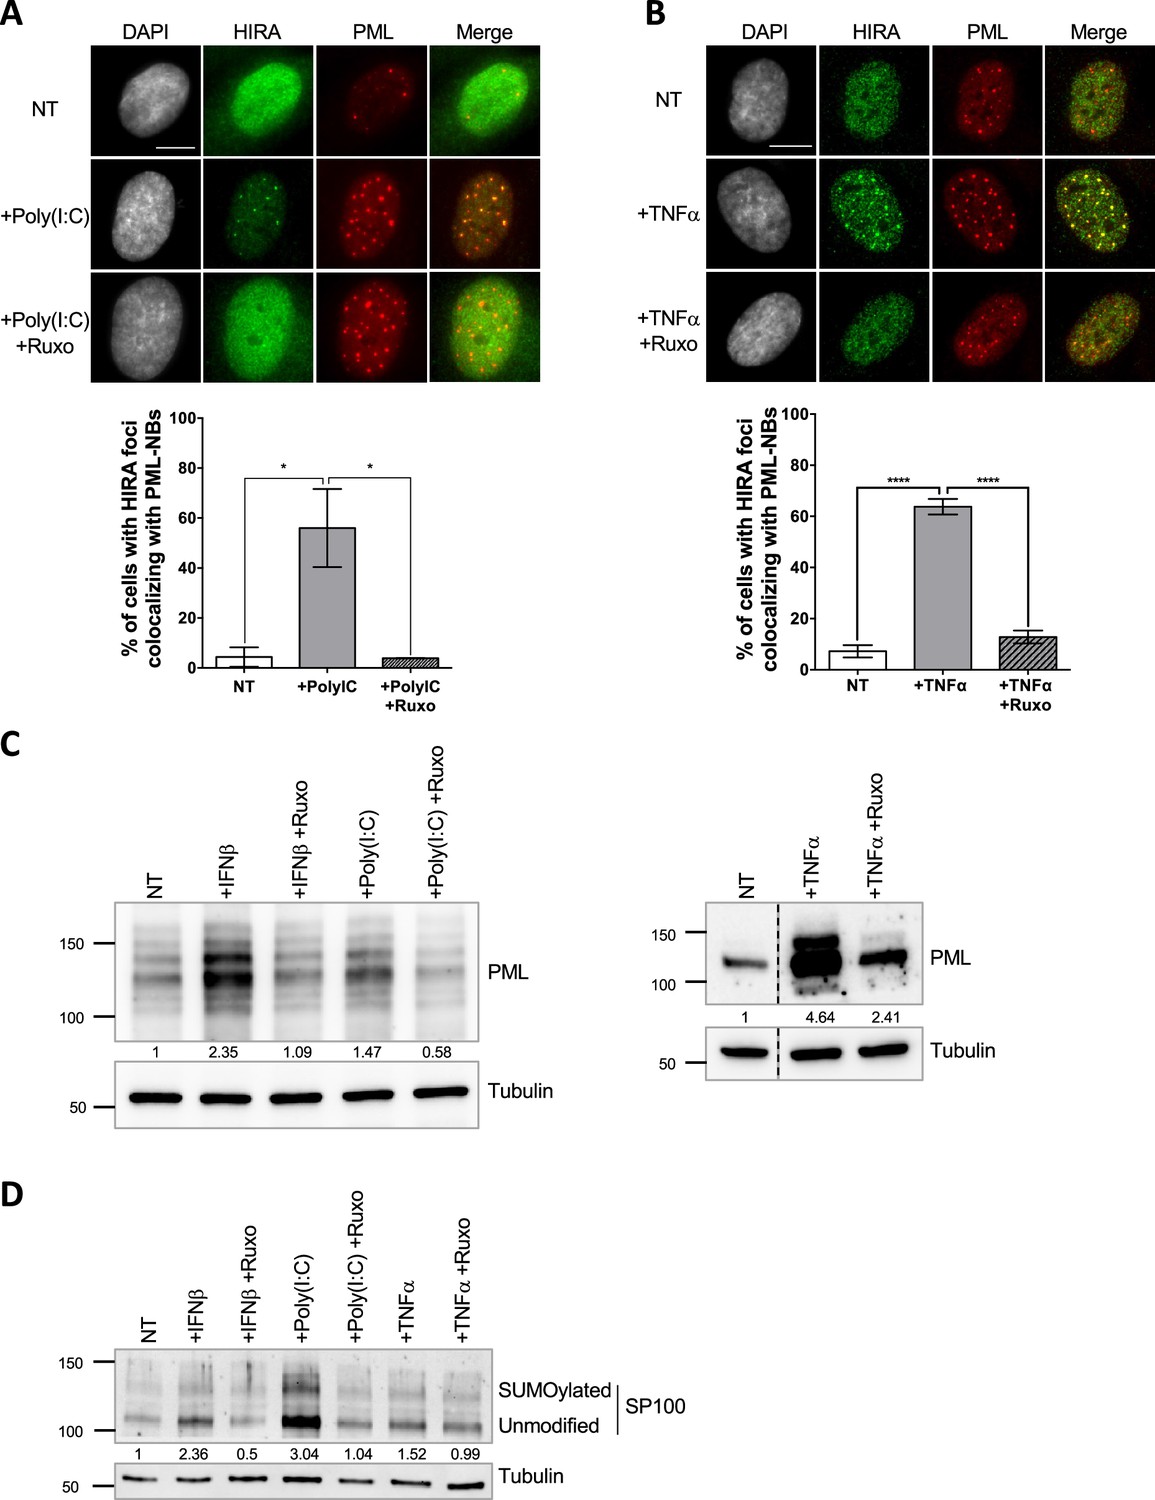
HIRA accumulation in PML NBs correlates with increased PML concentration in primary cells.
(A–B) (top) Fluorescence microscopy visualization of HIRA (green) and PML (red) in BJ cells treated with Poly(I:C) at 10 μg/mL for 24 hr (left) or with TNFα at 100 ng/mL for 24 hr (right). Ruxolitinib (Ruxo) was added at 2 μM one hour before Poly(I:C) or TNFα treatment and for 25 hr. Cell nuclei are visualized by DAPI staining (grey). Scale bars represent 10 μm. (bottom) Histograms show quantitative analysis of cells with HIRA localization at PML NBs. p-values (Student t-test): *<0.05; ****<0.0001. Numbers on all histograms represent the mean of three independent experiments (± SD). (C) (left) Western blot visualization of PML from total cell extracts of BJ cells treated with IFNβ at 1000 U/mL or Poly(I:C) at 10 μg/mL for 24 hr and with ruxolitinib (Ruxo) at 2 µM 1 hr before treatment and for 25 hr. (right) Western blot visualization of PML from RIPA extracts of BJ cells treated with TNFα at 100 ng/mL for 24 hr and with ruxolitinib (Ruxo) at 2 µM 1 hr before treatment and for 25 hr. Tubulin is a loading control. Quantification of PML levels relative to tubulin are shown below the WB (numbers are representative from three independent experiments) (D) Western blot visualization of SP100 from total cell extracts of BJ cells treated as in C. Quantification of SP100 levels relative to tubulin are shown below the WB (numbers are representative from two independent experiments).
-
Figure 1—source data 1
Raw WB for Figure 1C (left panel) for PML and tubulin.
- https://cdn.elifesciences.org/articles/80156/elife-80156-fig1-data1-v1.tif
-
Figure 1—source data 2
Raw WB for Figure 1C (left panel) for PML and tubulin with labels.
- https://cdn.elifesciences.org/articles/80156/elife-80156-fig1-data2-v1.tif
-
Figure 1—source data 3
Raw WB for Figure 1C (right panel) for PML.
- https://cdn.elifesciences.org/articles/80156/elife-80156-fig1-data3-v1.tif
-
Figure 1—source data 4
Raw WB for Figure 1C (right panel) for PML with labels.
- https://cdn.elifesciences.org/articles/80156/elife-80156-fig1-data4-v1.tif
-
Figure 1—source data 5
Raw WB for Figure 1C (right panel) for tubulin.
- https://cdn.elifesciences.org/articles/80156/elife-80156-fig1-data5-v1.tif
-
Figure 1—source data 6
Raw WB for Figure 1C (right panel) for tubulin with labels.
- https://cdn.elifesciences.org/articles/80156/elife-80156-fig1-data6-v1.tif
-
Figure 1—source data 7
Raw WB for Figure 1D for SP100.
- https://cdn.elifesciences.org/articles/80156/elife-80156-fig1-data7-v1.tif
-
Figure 1—source data 8
Raw WB for Figure 1D for SP100 with labels.
- https://cdn.elifesciences.org/articles/80156/elife-80156-fig1-data8-v1.tif
-
Figure 1—source data 9
Raw WB for Figure 1D for tubulin.
- https://cdn.elifesciences.org/articles/80156/elife-80156-fig1-data9-v1.tif
-
Figure 1—source data 10
Raw WB for Figure 1D for tubulin with labels.
- https://cdn.elifesciences.org/articles/80156/elife-80156-fig1-data10-v1.tif
Figure 1—figure supplement 1
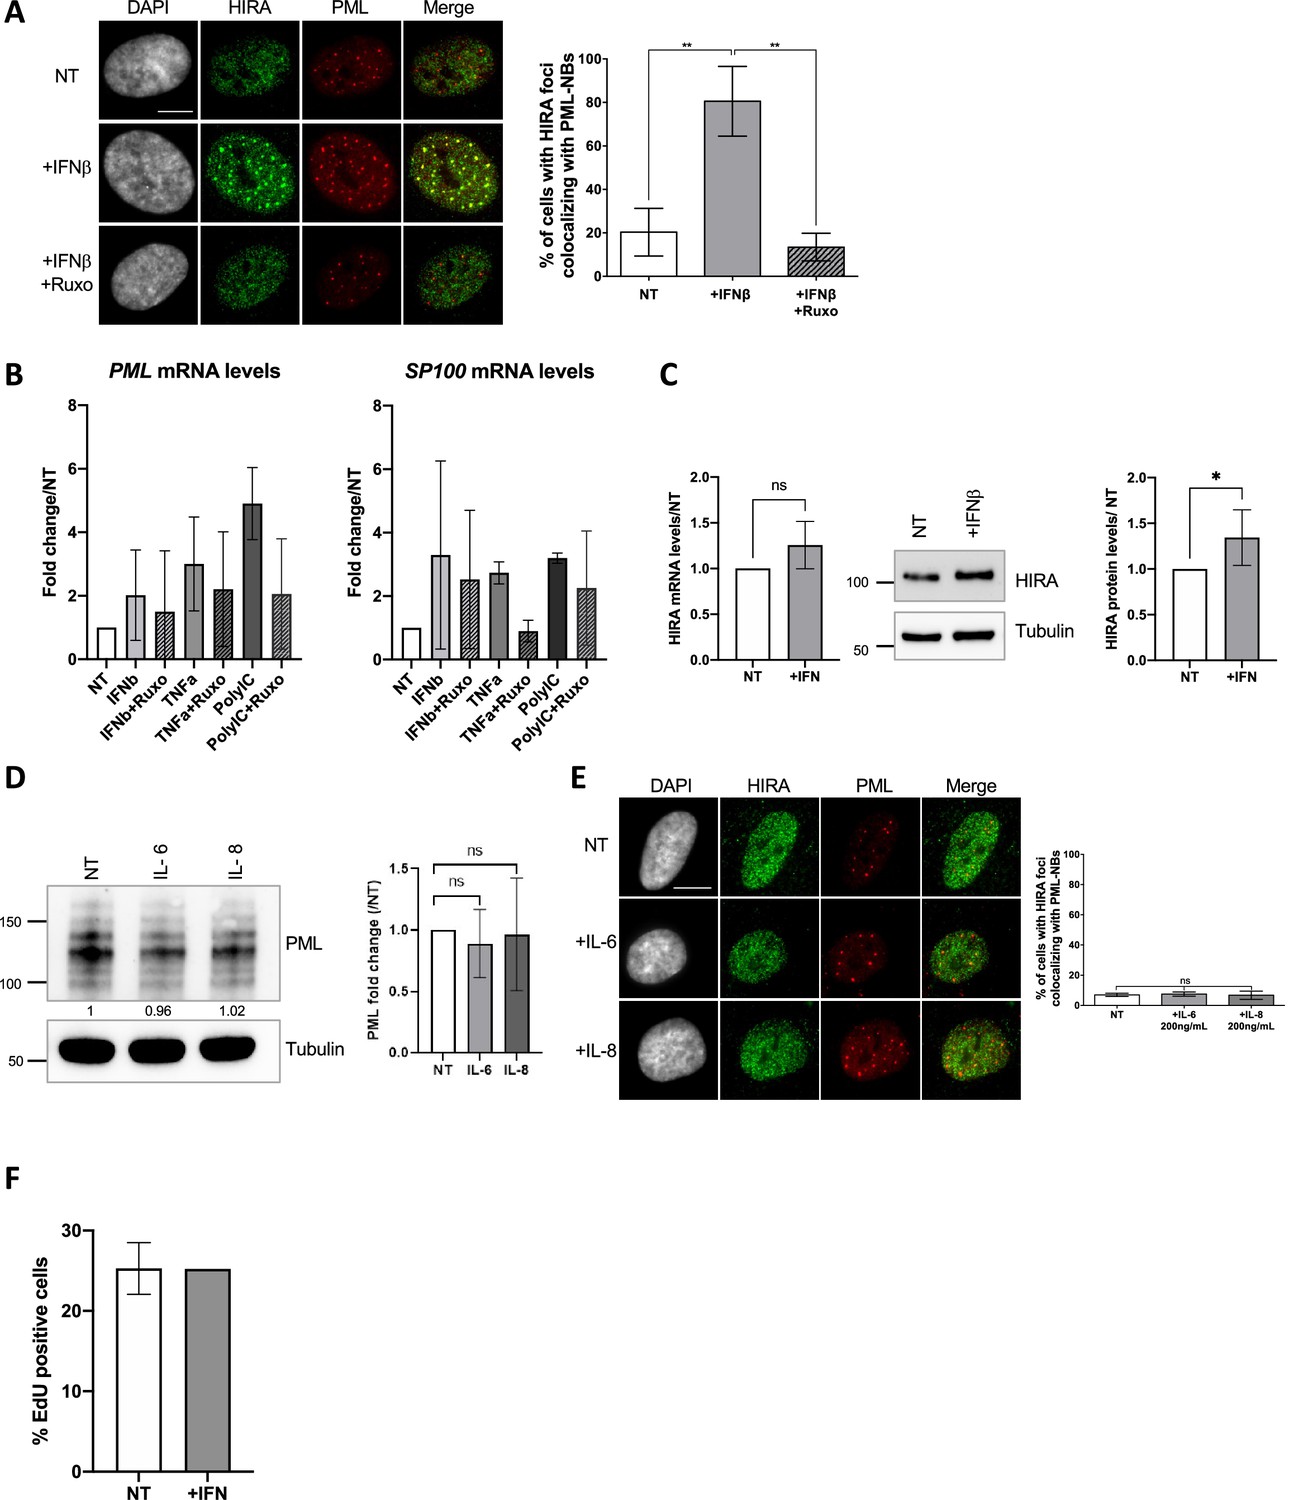
Impact of various cytokines on HIRA localization in PML NBs.
(A) (left) Fluorescence microscopy visualization (left) of HIRA (green) and PML (red) in BJ cells treated with IFNβ at 1000 U/mL for 24 hr. Ruxolitinib (Ruxo) was added at 2 μM 1 hr before IFNβ and left for 25 h. Cell nuclei are visualized by DAPI staining (grey). Scale bar represents 10 μm. (right) Histogram shows quantitative analysis of cells with HIRA localization at PML NBs. Numbers represent the mean of three independent experiments (± SD). p-values (Student t-test): **<0.01. (B) Histograms show relative PML mRNA levels (left) and SP100 mRNA levels (right) (normalized on GAPDH mRNA levels) of BJ cells treated with IFNβ at 1000 U/mL, TNFα at 100 ng/mL or Poly(I:C) at 10 µg/mL for 24 hr and with Ruxolitinib (Ruxo) at 2 µM 1 hr before treatment and for 25 hr. Rationalization was performed on the untreated condition. Numbers represent the mean of two or three independent experiments (± SD). (C) (left) Histogram shows relative HIRA mRNA levels (normalized on GAPDH mRNA levels) of BJ cells treated with IFNβ at 1000 U/mL for 24 hr. Rationalization was performed on the untreated condition. Numbers represent the mean of five independent experiments (± SD). p-value (Student t-test) is non significant (ns). (middle) Western blot visualization of HIRA from total cell extracts of BJ cells treated as on the left panel. Tubulin is a loading control. (right) Histogram shows HIRA protein levels relative to tubulin in BJ cells treated as on the left panel. Numbers represent the mean of seven independent experiments (± SD). p-value (Student t-test): *<0.05. (D) (left) Western blot visualization of PML from total cell extracts of BJ cells treated with IL-6 or IL-8 at 200 ng/mL for 24 hr. Tubulin is a loading control. (right) Histogram shows PML protein levels relative to tubulin from total cellular extracts of BJ cells treated as in the left panel. Numbers represent the mean of three independent experiments. p-value (Student t-test): ns: non significant. (E) (left) Fluorescence microscopy visualization (left) of HIRA (green) and PML (red) in BJ cells treated as in D. Cell nuclei are visualized by DAPI staining (grey). Scale bar represents 10 μm. (right) Histogram shows quantitative analysis of cells with HIRA localization at PML NBs. Numbers represent the mean of three independent experiments (± SD). p-value (Student t-test): ns: non significant. (F) Histogram shows quantitative analysis of EdU-positive BJ cells treated as in C. EdU was added at 10 μM for 2 hr. Numbers represent the mean of two independent experiments (± SD).
-
Figure 1—figure supplement 1—source data 1
Raw WB for Figure 1—figure supplement 1C for HIRA.
- https://cdn.elifesciences.org/articles/80156/elife-80156-fig1-figsupp1-data1-v1.tif
-
Figure 1—figure supplement 1—source data 2
Raw WB for Figure 1—figure supplement 1C for HIRA with labels.
- https://cdn.elifesciences.org/articles/80156/elife-80156-fig1-figsupp1-data2-v1.tif
-
Figure 1—figure supplement 1—source data 3
Raw WB for Figure 1—figure supplement 1C for tubulin.
- https://cdn.elifesciences.org/articles/80156/elife-80156-fig1-figsupp1-data3-v1.tif
-
Figure 1—figure supplement 1—source data 4
Raw WB for Figure 1—figure supplement 1C for tubulin with labels.
- https://cdn.elifesciences.org/articles/80156/elife-80156-fig1-figsupp1-data4-v1.tif
-
Figure 1—figure supplement 1—source data 5
Raw WB for Figure 1—figure supplement 1D for PML.
- https://cdn.elifesciences.org/articles/80156/elife-80156-fig1-figsupp1-data5-v1.tif
-
Figure 1—figure supplement 1—source data 6
Raw WB for Figure 1—figure supplement 1D for PML with labels.
- https://cdn.elifesciences.org/articles/80156/elife-80156-fig1-figsupp1-data6-v1.tif
-
Figure 1—figure supplement 1—source data 7
Raw WB for Figure 1—figure supplement 1D for tubulin.
- https://cdn.elifesciences.org/articles/80156/elife-80156-fig1-figsupp1-data7-v1.tif
-
Figure 1—figure supplement 1—source data 8
Raw WB for Figure 1—figure supplement 1D for tubulin with labels.
- https://cdn.elifesciences.org/articles/80156/elife-80156-fig1-figsupp1-data8-v1.tif
Figure 2 with 1 supplement
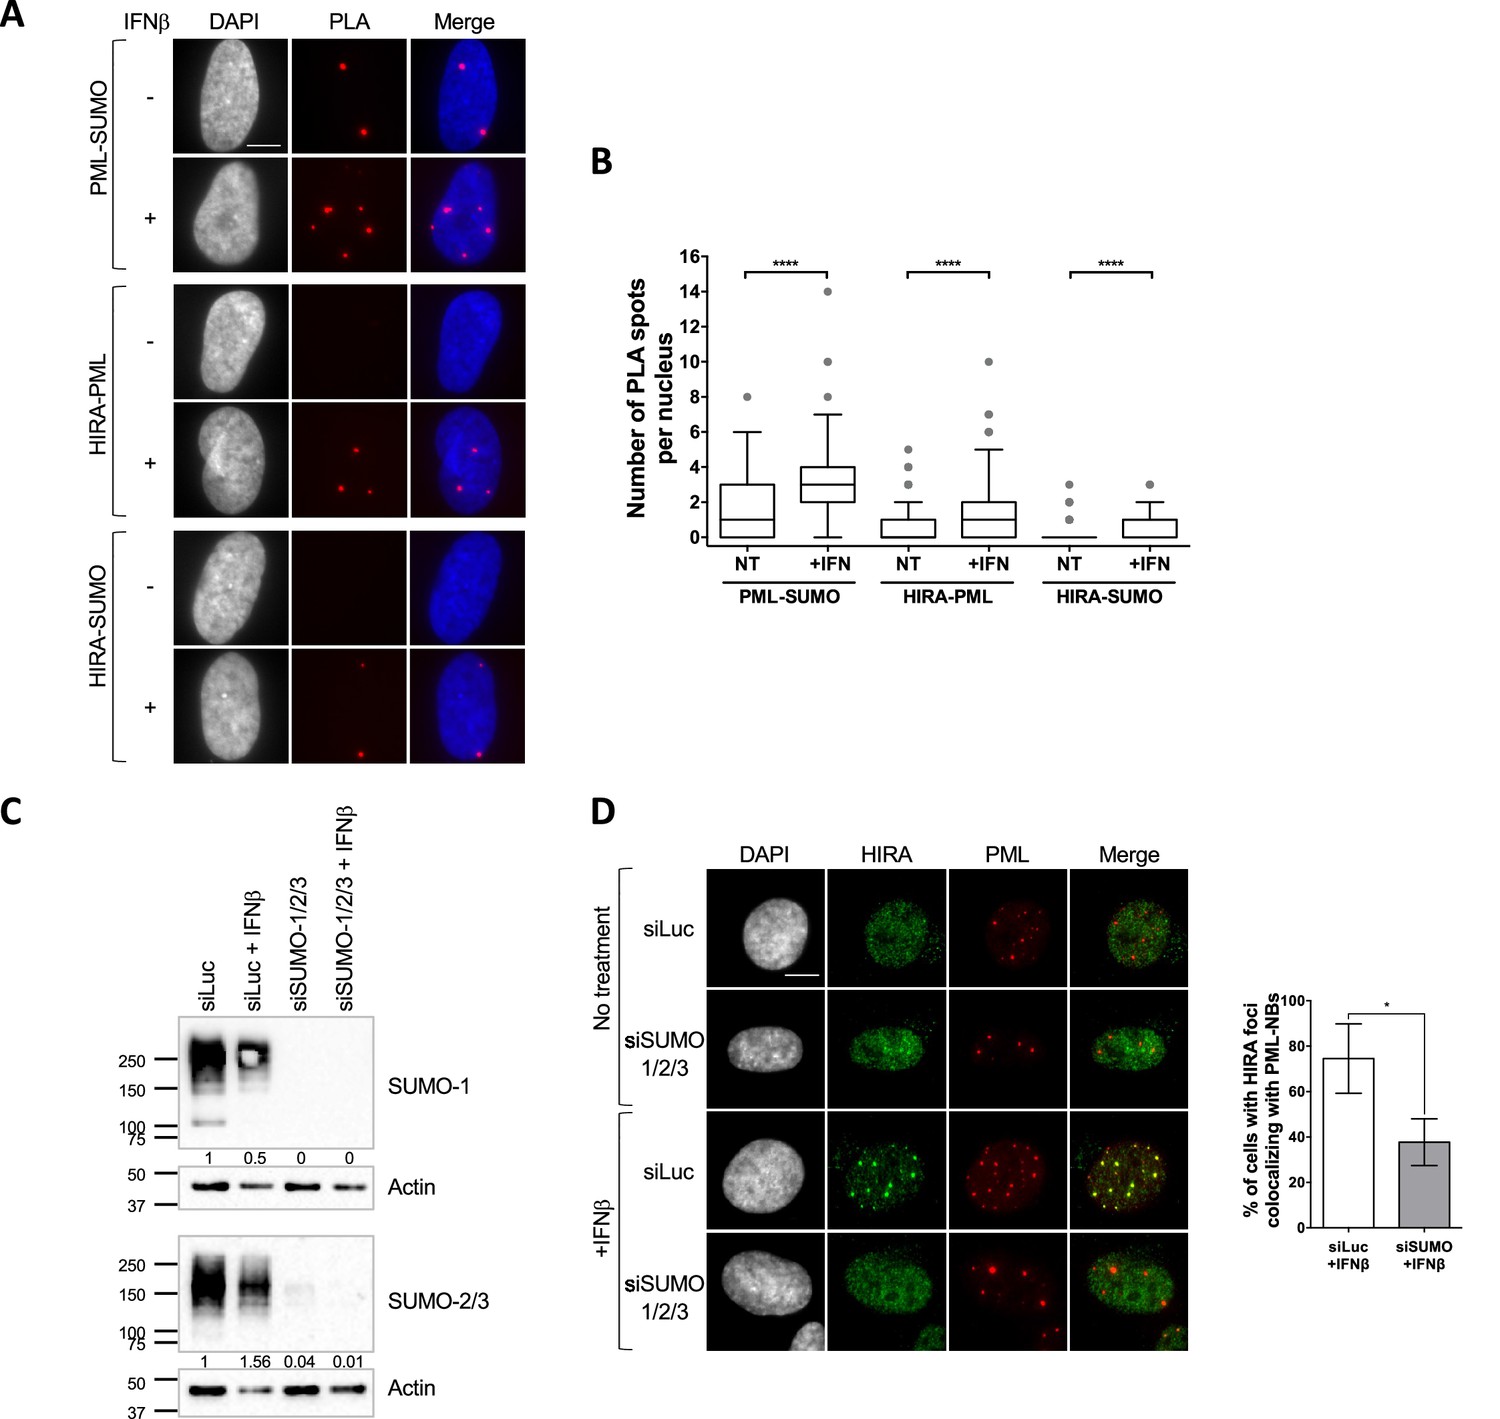
HIRA recruitment to PML NBs is dependent on SUMO proteins.
(A) Fluorescence microscopy visualization of Proximity Ligation Assays (PLA) signals (red) obtained after incubation of anti-PML +anti SUMO, anti-HIRA +anti PML or anti-HIRA +anti SUMO antibodies on BJ cells treated or not with IFNβ at 1000 U/mL for 24 h. Cell nuclei are visualized by DAPI staining (grey or blue on the merge). Scale bar represents 10 μm. (B) Box-and-whisker plot shows the number of PLA spots detected in cells described in A. In average, 200 nuclei/condition were analyzed from three independent experiments. The line inside the box represents the median of all observations with interquartile range. p-values (Mann-Whitney u-test): ****<0.0001. (C) Western-blot visualization of SUMO-1 and SUMO-2/3 from total cellular extracts of BJ cells treated with the indicated siRNAs for 48 hr and with IFNβ at 1000 U/mL during the last 24 hr. Actin is a loading control. Quantification of SUMO-1 and SUMO-2/3 levels relative to tubulin are shown below the WB (numbers are representative from three independent experiments). (D) (left) Fluorescence microscopy visualization of HIRA (green) and PML (red) in BJ cells treated with siRNAs as described in C. Cell nuclei are visualized by DAPI staining (grey). Scale bar represents 10 μm. (right) Histograms show quantitative analysis of cells with HIRA localization at PML NBs. Numbers represent the mean of three independent experiments (± SD). p-value (Student t-test): *<0.05.
-
Figure 2—source data 1
Raw WB for Figure 2C for SUMO1.
- https://cdn.elifesciences.org/articles/80156/elife-80156-fig2-data1-v1.tif
-
Figure 2—source data 2
Raw WB for Figure 2C for SUMO1 with labels.
- https://cdn.elifesciences.org/articles/80156/elife-80156-fig2-data2-v1.tif
-
Figure 2—source data 3
Raw WB for Figure 2C for Actin.
- https://cdn.elifesciences.org/articles/80156/elife-80156-fig2-data3-v1.tif
-
Figure 2—source data 4
Raw WB for Figure 2C for Actin with labels.
- https://cdn.elifesciences.org/articles/80156/elife-80156-fig2-data4-v1.tif
-
Figure 2—source data 5
Raw WB for Figure 2C for SUMO2/3.
- https://cdn.elifesciences.org/articles/80156/elife-80156-fig2-data5-v1.tif
-
Figure 2—source data 6
Raw WB for Figure 2C for SUMO1 with labels.
- https://cdn.elifesciences.org/articles/80156/elife-80156-fig2-data6-v1.tif
-
Figure 2—source data 7
Raw WB for Figure 2C for Actin (bottom panel).
- https://cdn.elifesciences.org/articles/80156/elife-80156-fig2-data7-v1.tif
-
Figure 2—source data 8
Raw WB for Figure 2C for Actin (bottom panel) with labels.
- https://cdn.elifesciences.org/articles/80156/elife-80156-fig2-data8-v1.tif
Figure 2—figure supplement 1
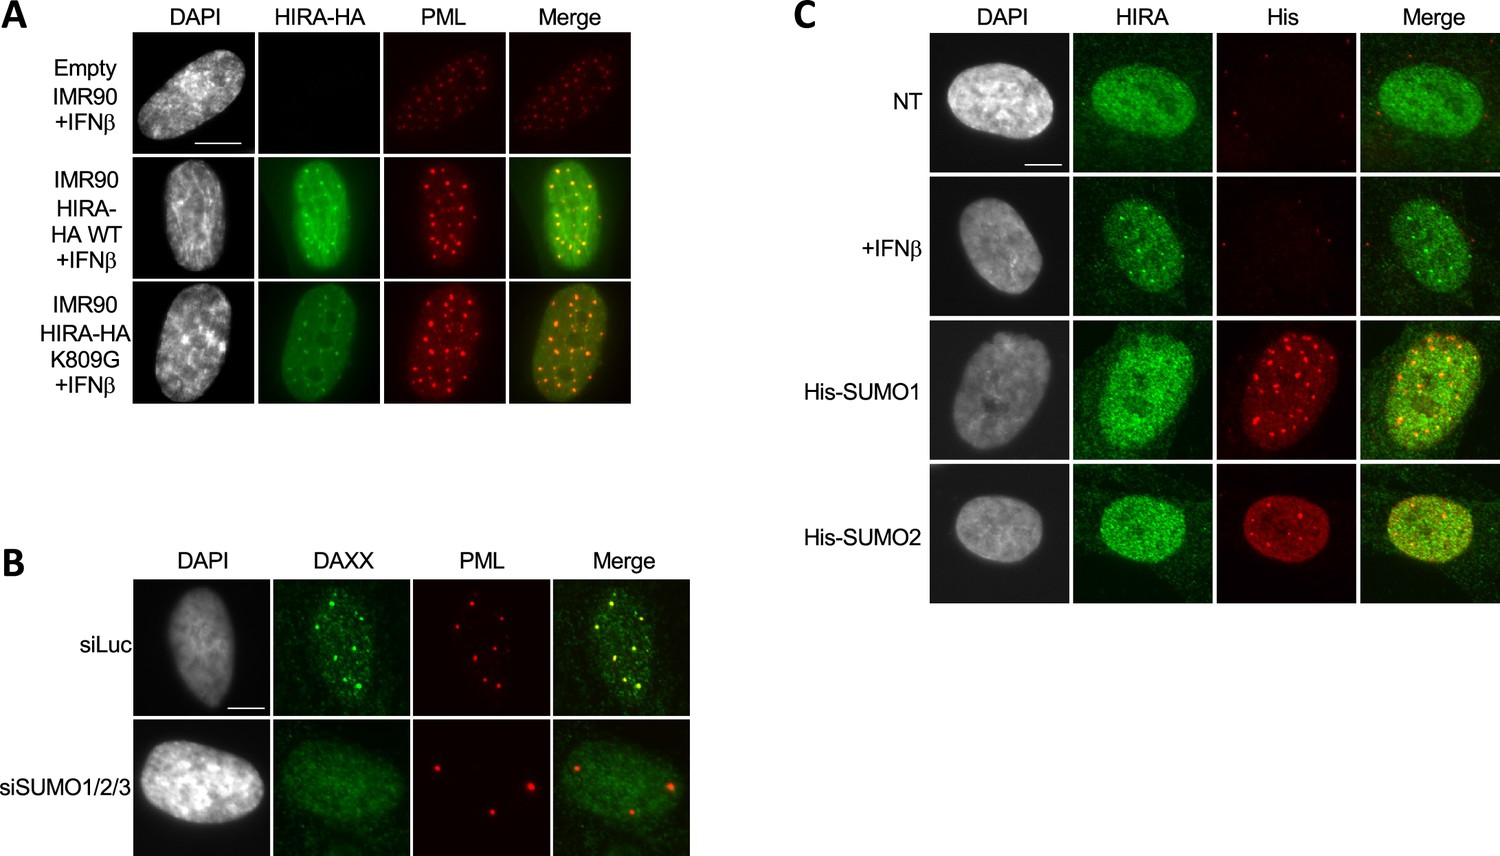
HIRA accumulation in PML NBs does not depend on overexpression of SUMO proteins nor on its SUMOylation.
(A) Fluorescence microscopy visualization of HA (green) and PML (red) in normal IMR90 cells ('empty') or in IMR90 cells stably expressing HIRA-HA WT or HIRA-HA mutated on K809G. Cells were treated with IFNβ at 1000 U/mL for 24 hr. Cell nuclei are visualized by DAPI staining (grey). Scale bar represents 10 μm. (B) Fluorescence microscopy visualization of DAXX (green) and PML (red) in BJ cells treated with the indicated siRNAs for 48 hr. Cell nuclei are visualized by DAPI staining (grey). Scale bar represents 10 μm. (C) Fluorescence microscopy visualization of HIRA (green) and 6xHis-SUMO marked by His antibody (red) in BJ cells transduced with lentiviral vectors 6xHis-tagged SUMO-1 or SUMO-2 proteins. Cells were fixed 48 hr after the transduction. Cell nuclei are visualized by DAPI staining (grey). Scale bar represents 10 μm.
Figure 3 with 2 supplements

HIRA recruitment to PML NBs relies on SIM-SUMO interactions.
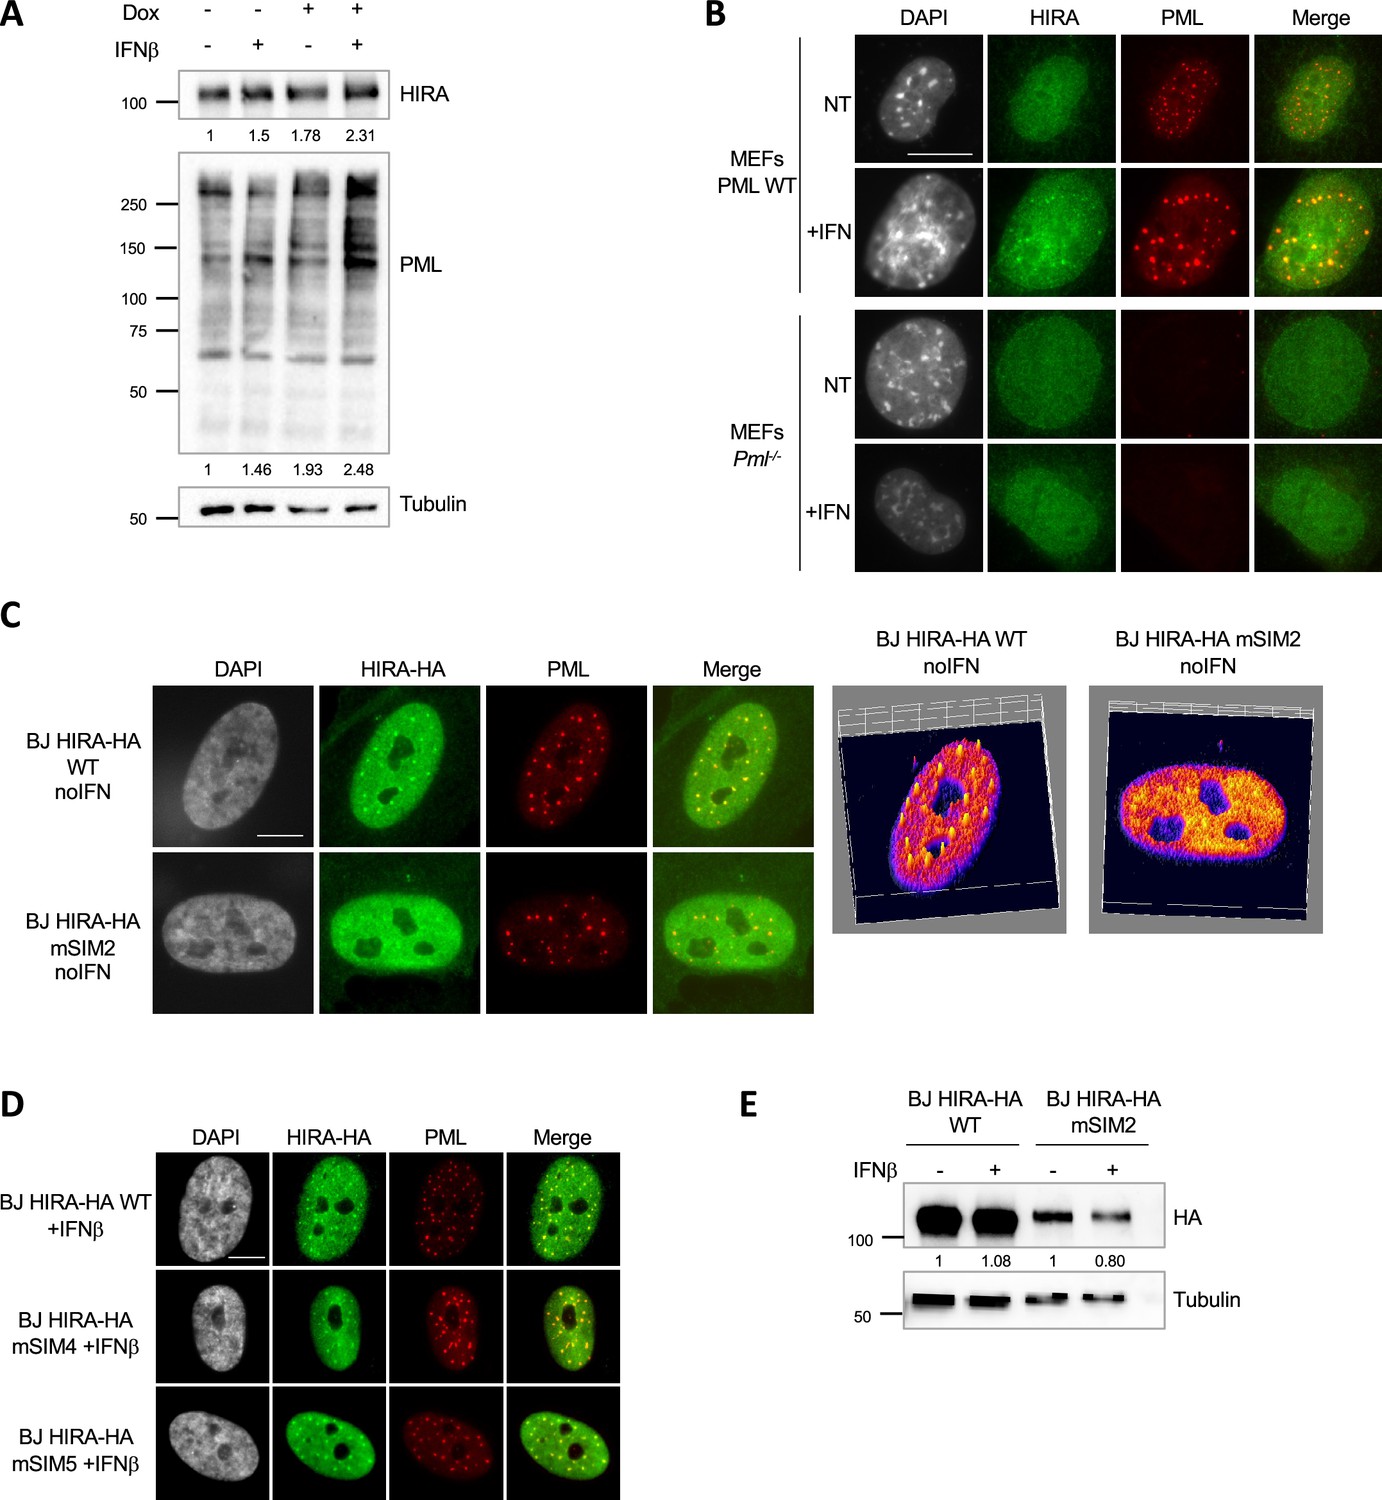
(A) Experimental design to assess SUMO-specific Affimers impact on HIRA relocalization to PML NBs. BJ cells were transduced with a Dox-inducible lentiviral vector encoding for a 6xHis-tagged SUMO-specific S1S2D5 Affimer. When expressed, S1S2D5-His Affimers localize at PML NBs through their interactions with SUMOylated PML. (B) Fluorescence microscopy visualization PML (cyan) and S1S2D5-His Affimer marked with His antibody (red) in transduced BJ cells induced or not with doxycycline at 100 ng/mL for 30 hr. Colocalization of the S1S2D5-His Affimer (red) and PML NBs (cyan) produces white spots. Cell nuclei are visualized by DAPI staining (grey). Scale bar represents 10 μm. (C) (left) Fluorescence microscopy visualization HIRA (green) and S1S2D5-His Affimer marked with His antibody (red) in transduced BJ cells induced or not with doxycycline at 100 ng/mL for 30 hr and treated with IFNβ at 1000 U/mL for the last 24 hr. Cell nuclei are visualized by DAPI staining (grey). Scale bar represents 10 μm. (right) Histogram shows quantitative analysis of cells with HIRA localization at PML NBs. Numbers represent the mean of four independent experiments (± SD). p-values (Student t-test): **<0.01; ***<0.001. (D) (top) Experimental design to assess SUMOylated PML requirement for HIRA accumulation to PML NBs. MEFs Pml-/- cells were transduced with Dox-inducible lentiviral vectors encoding for Myc-tagged WT or 3K non-SUMOylable PML proteins. Cells were then treated with murine type I IFNα and HIRA localization was observed by fluorescence microscopy. (bottom) Myc-PML proteins expression was verified by western blot analysis of human PML from total cellular extracts of MEFs cells describe above. HIRA proteins level was also verified. Actin is a loading control. Quantification of PML and HIRA levels relative to Actin are shown below the WB (numbers are representative of three independent experiments). (E) (left) Fluorescence microscopy visualization of HIRA (green) and Myc-PML with Myc antibody (red) on MEFs Pml-/- cells rescued with Myc-tagged WT (top) or 3K (bottom) PML proteins through doxycycline treatment at 100 ng/mL for 24 hr. Cells were at the same time treated with murine IFNα at 1000 U/mL. Cell nuclei are visualized by DAPI staining (grey). Scale bars represents 10 μm. (right top) Histogram shows quantitative analysis of cells with HIRA localization at ectopic WT or 3K PML NBs in MEFs PML-/- cells treated as on the left panel. Numbers represent the mean of three independent experiments (± SD). (right bottom) Histogram shows quantitative analysis of the percentage of PML NBs per cell showing colocalization with HIRA in MEFs PML-/- cells treated as on the left panel. p-value (Student t-test): ***<0.001; ****<0.0001. (F) (top) Schematic representation of the localization of the mutations on putative SIM motifs on HIRA protein. (bottom left) Fluorescence microscopy visualization of HIRA-HA marked by HA antibody (green) and PML (red) in BJ cells stably transduced with HIRA-HA WT or HIRA-HA mSIM2 mutant and treated with IFNβ at 1000 U/mL for 24 hr. Scale bar represents 10 μm. (bottom middle) Graphics show HA signal intensity of each pixel within the nuclei depicted on the left panel in a 3D-surface plot. Higher expression signal appears in yellow to white colors. (bottom right) Histograms show quantitative analysis of cells with HIRA-HA localization in PML NBs (mean of three independent experiments [± SD]) or quantitative analysis of the percentage of PML NBs per cell showing colocalization with HIRA in BJ cells treated as on the bottom left panel. p-value (Student t-test): **<0.01; ****<0.0001.
-
Figure 3—source data 1
Raw WB for Figure 3D for PML and Actin.
- https://cdn.elifesciences.org/articles/80156/elife-80156-fig3-data1-v1.tif
-
Figure 3—source data 2
Raw WB for Figure 3D for PML and Actin with labels.
- https://cdn.elifesciences.org/articles/80156/elife-80156-fig3-data2-v1.tif
-
Figure 3—source data 3
Raw WB for Figure 3D for HIRA.
- https://cdn.elifesciences.org/articles/80156/elife-80156-fig3-data3-v1.tif
-
Figure 3—source data 4
Raw WB for Figure 3D for HIRA with labels.
- https://cdn.elifesciences.org/articles/80156/elife-80156-fig3-data4-v1.tif
-
Figure 3—source data 5
Raw WB for Figure 3D for Actin.
- https://cdn.elifesciences.org/articles/80156/elife-80156-fig3-data5-v1.tif
-
Figure 3—source data 6
Raw WB for Figure 3D for Actin with labels.
- https://cdn.elifesciences.org/articles/80156/elife-80156-fig3-data6-v1.tif
Figure 3—figure supplement 1
HIRA accumulation in PML NBs depends on PML and on a putative SIM motif on HIRA.
(A) Western blot visualization of HIRA and PML from total cellular extracts of S1S2D5-His Affimer-transduced BJ cells treated as in Figure 3C. Tubulin is a loading control. Quantification of HIRA and PML levels relative to tubulin are shown below the WB (numbers are representative from three independent experiments). (B) Fluorescence microscopy analysis of HIRA (green) and PML (red) in WT MEFs and in MEFs Pml-/- treated with mIFNα at 1000 U/mL. Cell nuclei are visualized by DAPI staining (grey). Scale bar represents 10 μm. (C) (left) Fluorescence microscopy analysis of HIRA-HA marked by HA antibody (green) and PML (red) in untreated BJ cells transduced with HIRA-HA WT or mSIM2 mutant. Cell nuclei are visualized by DAPI staining (grey). Scale bar represents 10 µm. (right) Graphics show HA signal intensity of each pixel within the nuclei depicted on the left panel in a 3D-surface plot. Higher expression signal appears in yellow to white colors. (D) Fluorescence microscopy analysis of HIRA-HA marked by HA antibody (green) and PML (red) in BJ cells transduced with HIRA-HA WT, or mSIM4/5 mutants and treated with IFNβ for 24 hr. Cell nuclei are visualized in fluorescence microscopy by DAPI staining (grey). Scale bar represents 10 μm. (E) Western blot visualization of HA from total cellular extracts of BJ cells stably expressing HIRA-HA WT or HIRA-HA mSIM2. Tubulin is a loading control. Quantification of HA level relative to tubulin is shown below the WB (numbers are representative from three independent experiments).
-
Figure 3—figure supplement 1—source data 1
Raw WB for Figure 3—figure supplement 1A for HIRA.
- https://cdn.elifesciences.org/articles/80156/elife-80156-fig3-figsupp1-data1-v1.tif
-
Figure 3—figure supplement 1—source data 2
Raw WB for Figure 3—figure supplement 1A for HIRA with labels.
- https://cdn.elifesciences.org/articles/80156/elife-80156-fig3-figsupp1-data2-v1.tif
-
Figure 3—figure supplement 1—source data 3
Raw WB for Figure 3—figure supplement 1A for PML.
- https://cdn.elifesciences.org/articles/80156/elife-80156-fig3-figsupp1-data3-v1.tif
-
Figure 3—figure supplement 1—source data 4
Raw WB for Figure 3—figure supplement 1A for PML with labels.
- https://cdn.elifesciences.org/articles/80156/elife-80156-fig3-figsupp1-data4-v1.tif
-
Figure 3—figure supplement 1—source data 5
Raw WB for Figure 3—figure supplement 1A for tubulin.
- https://cdn.elifesciences.org/articles/80156/elife-80156-fig3-figsupp1-data5-v1.tif
-
Figure 3—figure supplement 1—source data 6
Raw WB for Figure 3—figure supplement 1A for tubulin with labels.
- https://cdn.elifesciences.org/articles/80156/elife-80156-fig3-figsupp1-data6-v1.tif
-
Figure 3—figure supplement 1—source data 7
Raw WB for Figure 3—figure supplement 1E for HA.
- https://cdn.elifesciences.org/articles/80156/elife-80156-fig3-figsupp1-data7-v1.tif
-
Figure 3—figure supplement 1—source data 8
Raw WB for Figure 3—figure supplement 1E for HA with labels.
- https://cdn.elifesciences.org/articles/80156/elife-80156-fig3-figsupp1-data8-v1.tif
-
Figure 3—figure supplement 1—source data 9
Raw WB for Figure 3—figure supplement 1E for tubulin.
- https://cdn.elifesciences.org/articles/80156/elife-80156-fig3-figsupp1-data9-v1.tif
-
Figure 3—figure supplement 1—source data 10
Raw WB for Figure 3—figure supplement 1E for tubulin with labels.
- https://cdn.elifesciences.org/articles/80156/elife-80156-fig3-figsupp1-data10-v1.tif
Figure 3—figure supplement 2
HIRA accumulation in PML NBs depends on SP100, independent of its SUMOylation on K297R.
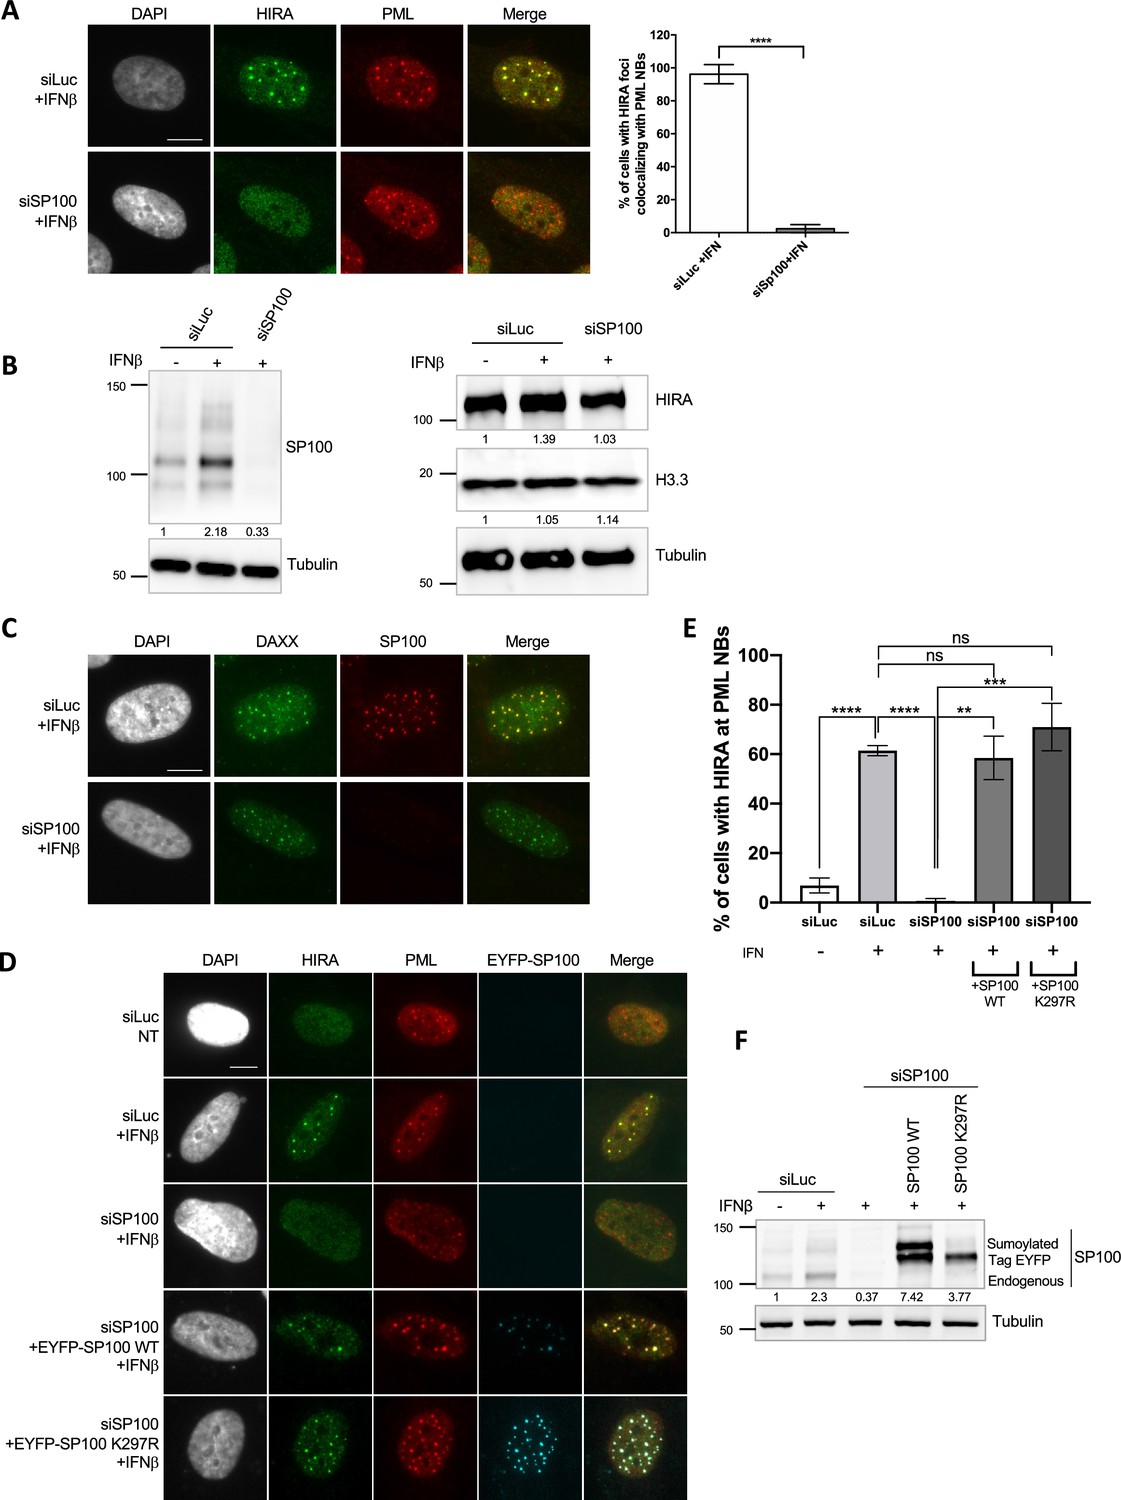
(A) (left) Fluorescence microscopy visualization of HIRA (green) and PML (red) in BJ cells treated with the indicated siRNAs for 48 hr and with IFNβ at 1000 U/mL for the last 24 hr of siRNAs treatment. Cell nuclei are visualized by DAPI staining (grey). Scale bar represents 10 µm. (right) Histogram shows quantitative analysis of cells with HIRA accumulation in PML NBs. Numbers represent the mean of three independent experiments (± SD). p-value (Student t-test): ****<0.0001. (B) Western blot visualization of SP100, HIRA and H3.3 from total cellular extracts of BJ cells treated as in A. Tubulin is a loading control. Quantification of SP100, HIRA and H3.3 levels relative to tubulin are shown below the WB (numbers are representative from two independent experiments). (C) Fluorescence microscopy visualization of DAXX (green) and SP100 (red) in BJ cells treated with the indicated siRNAs for 72 hr and with IFNβ at 1000 U/mL for the last 24 hr of siRNAs treatment. Cell nuclei are visualized by DAPI staining (grey). SP100 depletion does not impair the constitutive presence of DAXX in PML NBs. Scale bar represents 10 μm. (D) Fluorescence microscopy visualization of HIRA (green), PML (red) and EYFP-SP100 (pseudo-colored in cyan) in BJ cells treated as in A and rescued with EYFP-SP100 WT or K297R by lentiviral transduction. Expression of EYFP-SP100 WT and K297R was induced by addition of doxycyclin at 100 ng/ml in the last 24 hr of the experiment, together with IFNβ at 1000 U/mL when indicated. Cell nuclei are visualized by DAPI staining (grey). Images are taken from two independent experiments (without and with rescue). SP100 SUMOylation on K297 is not required for HIRA localization at PML NBs. Scale bar represents 10 µm. (E) Histogram shows quantitative analysis of cells with HIRA accumulation in PML NBs in BJ cells cells treated as in D. Numbers represent the mean of three independent experiments (± SD). p-value (Student t-test): **<0.01; ***<0.001; ****<0.0001; ns: non significant. (F) Western blot visualization of endogenous and exogenous SP100 revealed with SP100 antibody from total cellular extracts of BJ cells treated as in D. Tubulin is a loading control. Quantification of SP100 level relative to tubulin is shown below the WB (numbers are representative from three independent experiments).
-
Figure 3—figure supplement 2—source data 1
Raw WB for Figure 3—figure supplement 2B (left panel) for SP100 and tubulin.
- https://cdn.elifesciences.org/articles/80156/elife-80156-fig3-figsupp2-data1-v1.tif
-
Figure 3—figure supplement 2—source data 2
Raw WB for Figure 3—figure supplement 2B (left panel) for SP100 and tubulin with labels.
- https://cdn.elifesciences.org/articles/80156/elife-80156-fig3-figsupp2-data2-v1.tif
-
Figure 3—figure supplement 2—source data 3
Raw WB for Figure 3—figure supplement 2B (right panel) for HIRA.
- https://cdn.elifesciences.org/articles/80156/elife-80156-fig3-figsupp2-data3-v1.tif
-
Figure 3—figure supplement 2—source data 4
Raw WB for Figure 3—figure supplement 2B (right panel) for HIRA with labels.
- https://cdn.elifesciences.org/articles/80156/elife-80156-fig3-figsupp2-data4-v1.tif
-
Figure 3—figure supplement 2—source data 5
Raw WB for Figure 3—figure supplement 2B (right panel) for H3.3 and tubulin.
- https://cdn.elifesciences.org/articles/80156/elife-80156-fig3-figsupp2-data5-v1.tif
-
Figure 3—figure supplement 2—source data 6
Raw WB for Figure 3—figure supplement 2B (right panel) for H3.3 and tubulin with labels.
- https://cdn.elifesciences.org/articles/80156/elife-80156-fig3-figsupp2-data6-v1.tif
-
Figure 3—figure supplement 2—source data 7
Raw WB for Figure 3—figure supplement 2F (left panel) for SP100.
- https://cdn.elifesciences.org/articles/80156/elife-80156-fig3-figsupp2-data7-v1.tif
-
Figure 3—figure supplement 2—source data 8
Raw WB for Figure 3—figure supplement 2F (left panel) for SP100 with labels.
- https://cdn.elifesciences.org/articles/80156/elife-80156-fig3-figsupp2-data8-v1.tif
-
Figure 3—figure supplement 2—source data 9
Raw WB for Figure 3—figure supplement 2F (left panel) for tubulin.
- https://cdn.elifesciences.org/articles/80156/elife-80156-fig3-figsupp2-data9-v1.tif
-
Figure 3—figure supplement 2—source data 10
Raw WB for Figure 3—figure supplement 2F (left panel) for tubulin with labels.
- https://cdn.elifesciences.org/articles/80156/elife-80156-fig3-figsupp2-data10-v1.tif
Figure 4 with 2 supplements
HIRA accumulation in PML NBs depends on DAXX and H3.3 levels.
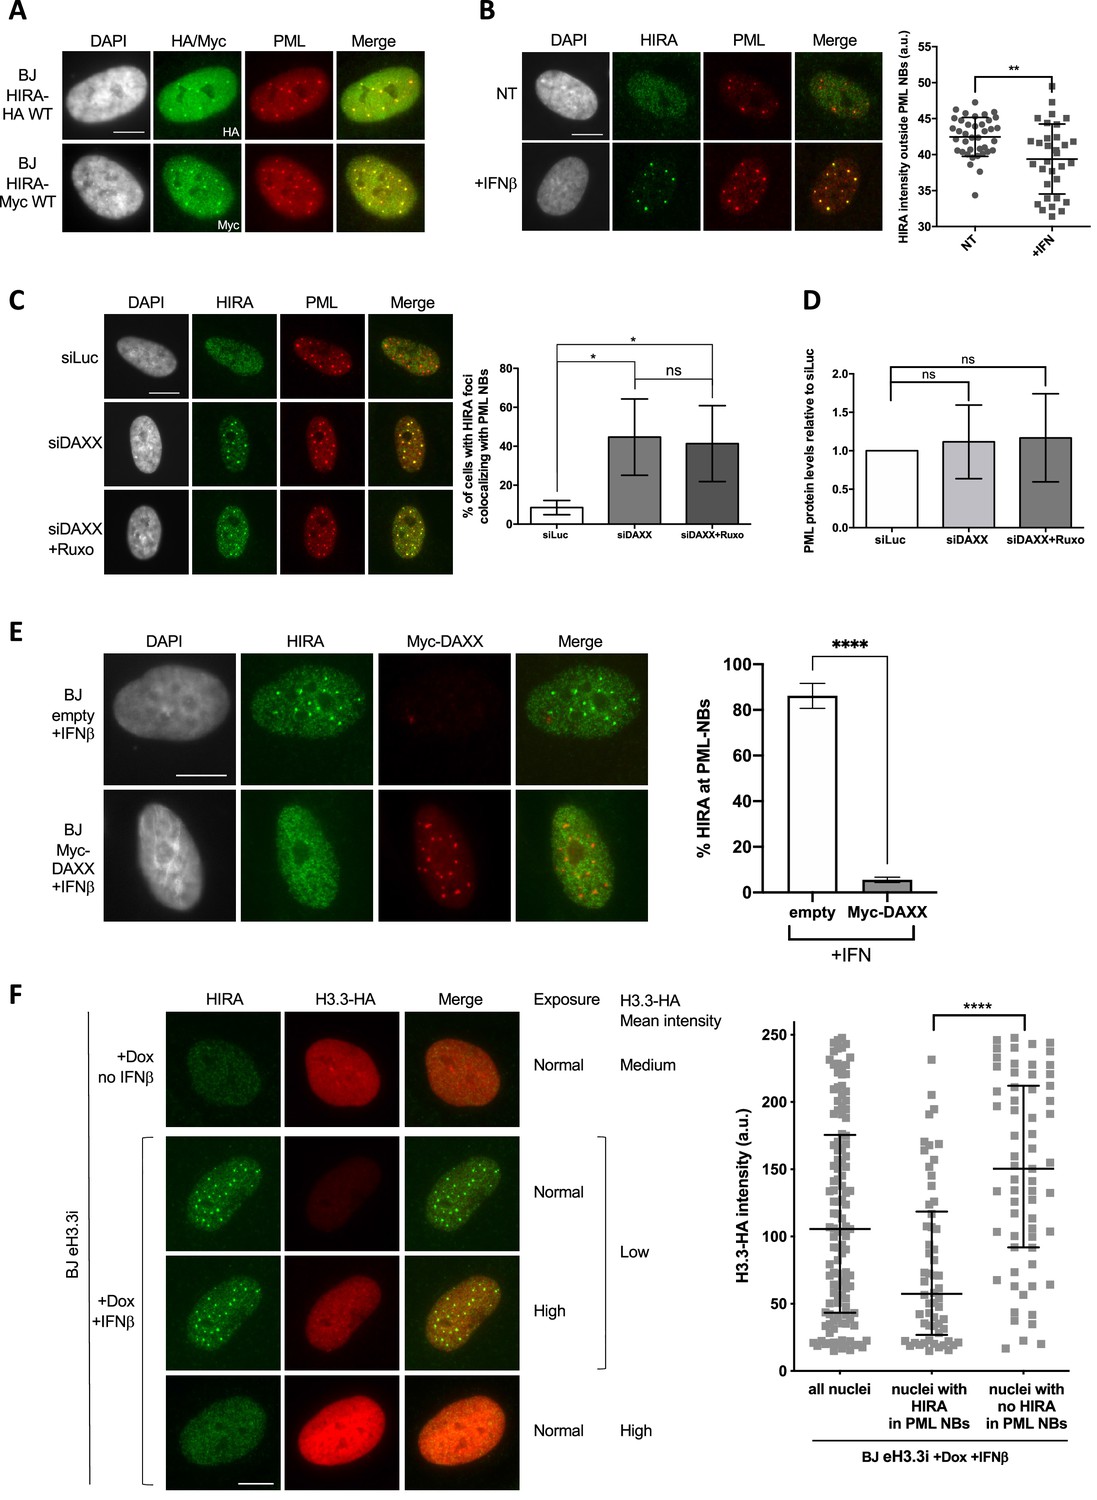
(A) Fluorescence microscopy visualization of HIRA-HA or HIRA-Myc marked respectively with HA and Myc antibodies (green) and PML (red) in BJ HIRA-HA WT and BJ HIRA-Myc WT cells. Cell nuclei are visualized by DAPI staining (grey). Scale bar represents 10 μm. (B) (left) Fluorescence microscopy visualization of HIRA (green) and PML (red) in BJ cells treated with IFNβ at 1000 U/mL for 24 hr (+IFNβ) or left untreated (NT). Cell nuclei are visualized by DAPI staining (grey). Scale bar represents 10 μm. (right) Histogram shows quantification of HIRA mean nuclear fluorescence intensity outside PML NBs (a.u: arbitrary units) in nuclei from five independent experiments. Bars represent median with interquartile range. p-values (Mann-Whitney u-test): **<0.01 (C) (left) Fluorescence microscopy visualization of HIRA (green) and PML (red) in BJ cells treated with the indicated siRNAs for 48 hr. Ruxolitinib (Ruxo) was added at 2 μM in the last 24 hr. Cell nuclei are visualized by DAPI staining (grey). Scale bars represent 10 μm. (right) Histogram shows quantitative analysis of cells with HIRA localization at PML NBs. p-values (Student t-test): *<0,05; ns: non significant. Numbers represent the mean of three independent experiments (± SD). (D) Histogram shows quantitative analysis of PML protein levels from western blot analysis presented in Figure 4—figure supplement 1A. p-values (Student t-test): ns: non significant. Numbers represent the mean of three independent experiments (± SD). (E) (left) Fluorescence microscopy visualization of HIRA (green) and Myc (red) in BJ cells transduced with a control retrovirus (empty) or with a retrovirus expressing Myc-DAXX for 48 hr. Cells were treated with IFNβ at 1000 U/ml in the last 24 hr. Cell nuclei are visualized by DAPI staining (grey). Scale bar represent 10 μm. (right) Histogram shows quantitative analysis of cells with HIRA localization at PML NBs. Numbers represent the mean of three independent experiments (± SD). p-value (Student t-test): ****<0.0001; ns: non significant. (F) (left) Fluorescence microscopy visualization of HIRA (green) and H3.3-HA marked by HA antibody (red) in BJ eH3.3i cells treated with doxycyclin at 100 ng/mL and with or without IFNβ at 1000 U/mL for 24 hr. High exposure indicates a lane where H3.3-HA signal was specifically increased in order to show H3.3-HA localization in PML NBs without saturating the signal in cells with higher expression. Scale bar represents 10 μm. (right) Quantification of nuclear H3.3-HA intensity levels in BJ eH3.3i cells treated as on the left panel. Mean H3.3-HA intensity levels were calculated on a pool of n=121 nuclei from three independent experiments. Nuclei were then separated on basis of accumulation of HIRA in PML NBs (nuclei with HIRA in PML NBs, n=58) or without it (nuclei with no HIRA in PML NBs, n=63) and mean H3.3-HA intensity was plotted for each category. Bars represent median with interquartile range. p-values (Mann-Whitney u-test): ****<0.0001.
Figure 4—figure supplement 1
HIRA accumulation in PML NBs upon IFN-I treatment can be modulated by the pool of DAXX in primary cells.
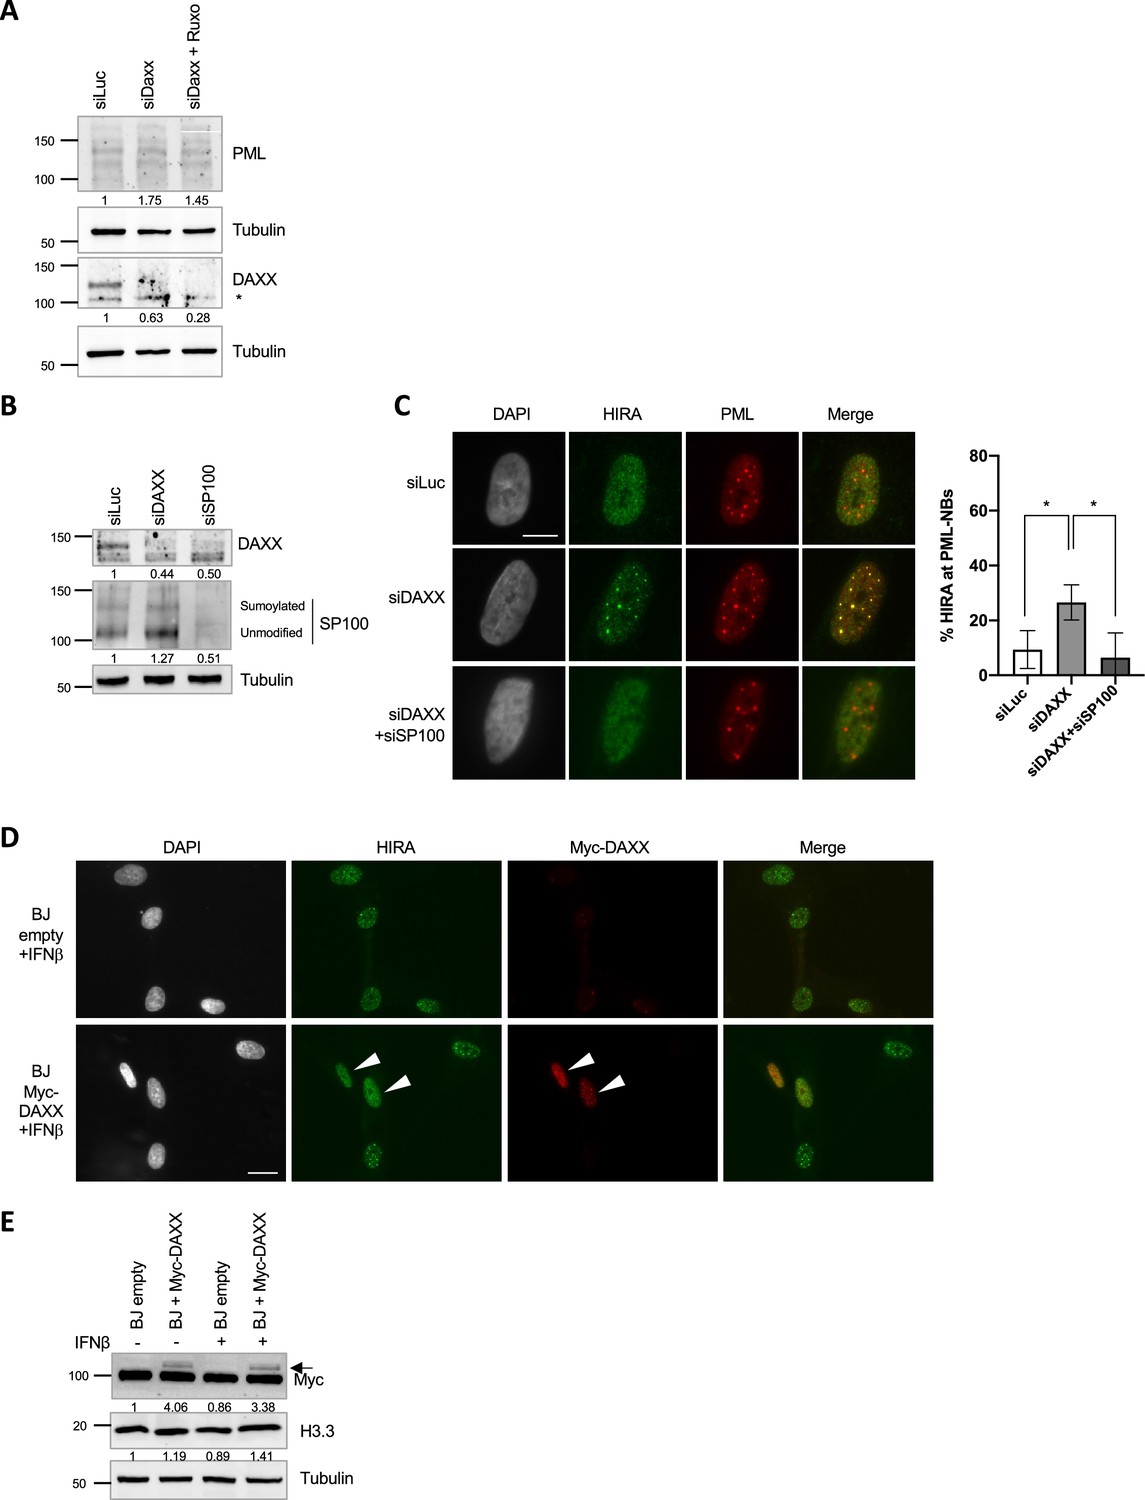
(A) Western blot visualization of PML and DAXX from total cellular extracts of BJ cells treated as in Figure 4C. Tubulin is a loading control. * indicates unspecific signal. Quantification of PML and DAXX levels relative to tubulin are shown below the WB (numbers are representative from three independent experiments). (B) Western blot visualization of DAXX and SP100 from total cellular extracts of BJ cells treated with the indicated siRNAs for 48 hr. Tubulin is a loading control. * indicates unspecific signal. Quantification of DAXX and SP100 total levels relative to tubulin are shown below the WB (numbers are representative from three independent experiments). (C) (left) Fluorescence microscopy visualization of HIRA (green) and PML (red) in BJ cells treated as in B Cell nuclei are visualized by DAPI staining (grey). Scale bar represents 10 µm. (right) Histogram shows quantitative analysis of cells with HIRA localization at PML NBs. Numbers represent the mean of three independent experiments (± SD). p-value (Student t-test): *<0.05. (D) Fluorescence microscopy visualization of HIRA (green) and Myc-DAXX marked with Myc antibody (red) in BJ cells transduced with a control retrovirus (empty) or with a retrovirus expressing Myc-DAXX for 48 hr and treated with IFNβ at 1000 U/mL for the last 24 hr. Cell nuclei are visualized by DAPI staining (grey). Arrowheads indicate Myc-DAXX-positive cells where HIRA is not forming foci. Scale bar represents 20 µm. (E) Western blot visualization of Myc-DAXX marked with Myc antibody and H3.3 from cellular extracts of BJ cells treated as in Figure 4C. Arrow indicates Myc-DAXX. Tubulin is a loading control. Quantification of Myc-DAXX and H3.3 levels relative to tubulin are shown below the WB (numbers are representative from two independent experiments).
-
Figure 4—figure supplement 1—source data 1
Raw WB for Figure 4—figure supplement 1A for PML.
- https://cdn.elifesciences.org/articles/80156/elife-80156-fig4-figsupp1-data1-v1.tif
-
Figure 4—figure supplement 1—source data 2
Raw WB for Figure 4—figure supplement 1A for PML with labels.
- https://cdn.elifesciences.org/articles/80156/elife-80156-fig4-figsupp1-data2-v1.tif
-
Figure 4—figure supplement 1—source data 3
Raw WB for Figure 4—figure supplement 1A for DAXX and tubulin.
- https://cdn.elifesciences.org/articles/80156/elife-80156-fig4-figsupp1-data3-v1.tif
-
Figure 4—figure supplement 1—source data 4
Raw WB for Figure 4—figure supplement 1A for DAXX and tubulin with labels.
- https://cdn.elifesciences.org/articles/80156/elife-80156-fig4-figsupp1-data4-v1.tif
-
Figure 4—figure supplement 1—source data 5
Raw WB for Figure 4—figure supplement 1A for HIRA.
- https://cdn.elifesciences.org/articles/80156/elife-80156-fig4-figsupp1-data5-v1.tif
-
Figure 4—figure supplement 1—source data 6
Raw WB for Figure 4—figure supplement 1A for HIRA with labels.
- https://cdn.elifesciences.org/articles/80156/elife-80156-fig4-figsupp1-data6-v1.tif
-
Figure 4—figure supplement 1—source data 7
Raw WB for Figure 4—figure supplement 1B for DAXX.
- https://cdn.elifesciences.org/articles/80156/elife-80156-fig4-figsupp1-data7-v1.tif
-
Figure 4—figure supplement 1—source data 8
Raw WB for Figure 4—figure supplement 1B for DAXX with labels.
- https://cdn.elifesciences.org/articles/80156/elife-80156-fig4-figsupp1-data8-v1.tif
-
Figure 4—figure supplement 1—source data 9
Raw WB for Figure 4—figure supplement 1B for SP100.
- https://cdn.elifesciences.org/articles/80156/elife-80156-fig4-figsupp1-data9-v1.tif
-
Figure 4—figure supplement 1—source data 10
Raw WB for Figure 4—figure supplement 1B for SP100 with labels.
- https://cdn.elifesciences.org/articles/80156/elife-80156-fig4-figsupp1-data10-v1.tif
-
Figure 4—figure supplement 1—source data 11
Raw WB for Figure 4—figure supplement 1B for tubulin.
- https://cdn.elifesciences.org/articles/80156/elife-80156-fig4-figsupp1-data11-v1.tif
-
Figure 4—figure supplement 1—source data 12
Raw WB for Figure 4—figure supplement 1B for tubulin with labels.
- https://cdn.elifesciences.org/articles/80156/elife-80156-fig4-figsupp1-data12-v1.tif
-
Figure 4—figure supplement 1—source data 13
Raw WB for Figure 4—figure supplement 1E for Myc.
- https://cdn.elifesciences.org/articles/80156/elife-80156-fig4-figsupp1-data13-v1.tif
-
Figure 4—figure supplement 1—source data 14
Raw WB for Figure 4—figure supplement 1E for Myc with labels.
- https://cdn.elifesciences.org/articles/80156/elife-80156-fig4-figsupp1-data14-v1.tif
-
Figure 4—figure supplement 1—source data 15
Raw WB for Figure 4—figure supplement 1E for H3.3 and tubulin.
- https://cdn.elifesciences.org/articles/80156/elife-80156-fig4-figsupp1-data15-v1.tif
-
Figure 4—figure supplement 1—source data 16
Raw WB for Figure 4—figure supplement 1E for H3.3 and tubulin with labels.
- https://cdn.elifesciences.org/articles/80156/elife-80156-fig4-figsupp1-data16-v1.tif
Figure 4—figure supplement 2
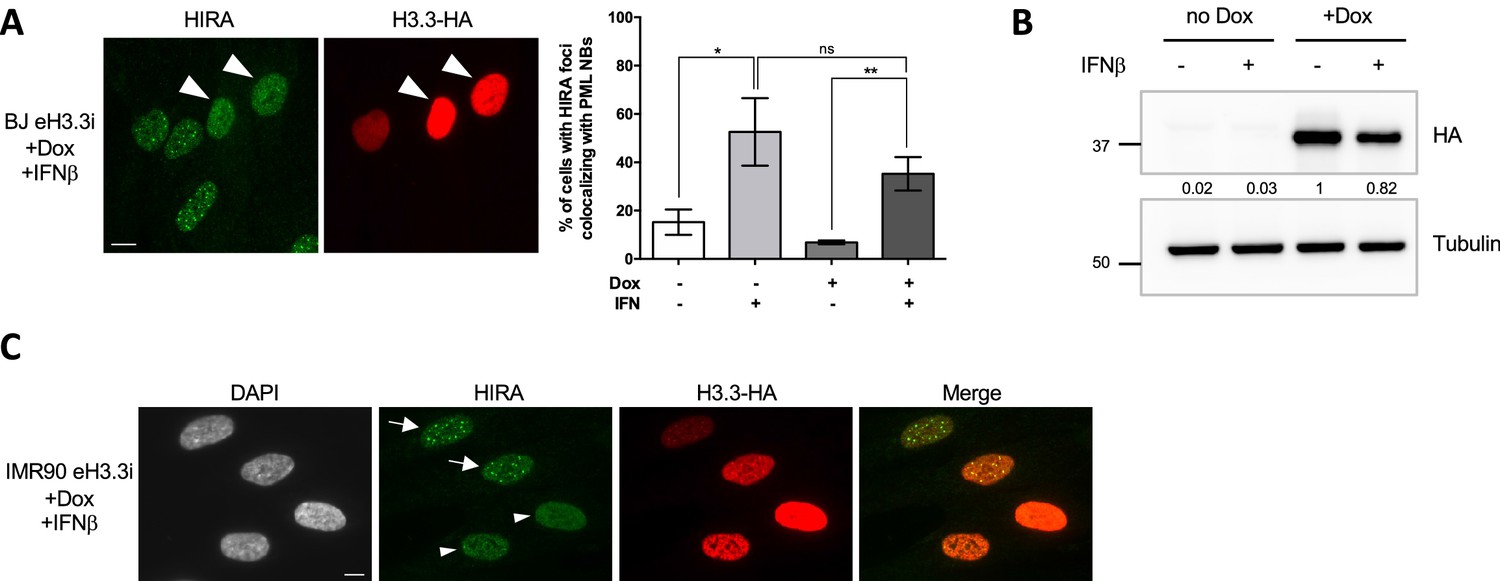
HIRA accumulation in PML NBs upon IFN-I can be modulated by the pool of H3.3 histones in primary cells.
(A) (left) Fluorescence microscopy visualization of HIRA (green) and H3.3-HA marked by HA antibody (red) in BJ eH3.3i cells treated with doxycyclin (Dox) at 100 ng/mL and with IFNβ at 1000 U/mL for 24 hr. Arrowheads indicate nuclei with high levels of nucleoplasmic H3.3-HA preventing HIRA foci formation despite IFNβ treatment. (right) Histogram shows quantitative analysis of cells with HIRA localization at PML NBs in BJ eH3.3i treated or not with Dox and IFNβ at 1000 U/mL for 24 hr. p-values (Student t-test): *<0.05; **<0.01; ns: non significant. Numbers represent the mean of three independent experiments (± SD).( B) Western blot visualization of H3.3-HA marked with HA antibody from total cellular extracts of BJ eH3.3i cells treated as in A. Tubulin is a loading control. Quantification of HA level relative to tubulin is shown below the WB (numbers are representative from three independent experiments). (C) Fluorescence microscopy visualization of HIRA (green) and H3.3-HA marked by HA antibody (red) in IMR90 eH3.3i treated with Dox at 100 ng/mL and IFNβ at 1000 U/mL for 24 hr. Arrows indicate nuclei showing formation of HIRA foci colocalizing with H3.3-HA foci, while arrowheads indicate nuclei with high levels of nucleoplasmic H3.3-HA preventing HIRA foci formation despite IFNβ treatment. Scale bar represents 10 µm.
-
Figure 4—figure supplement 2—source data 1
Raw WB for Figure 4—figure supplement 2B for HA and tubulin.
- https://cdn.elifesciences.org/articles/80156/elife-80156-fig4-figsupp2-data1-v1.tif
-
Figure 4—figure supplement 2—source data 2
Raw WB for Figure 4—figure supplement 2B for HA and tubulin with labels.
- https://cdn.elifesciences.org/articles/80156/elife-80156-fig4-figsupp2-data2-v1.tif
Figure 5 with 1 supplement
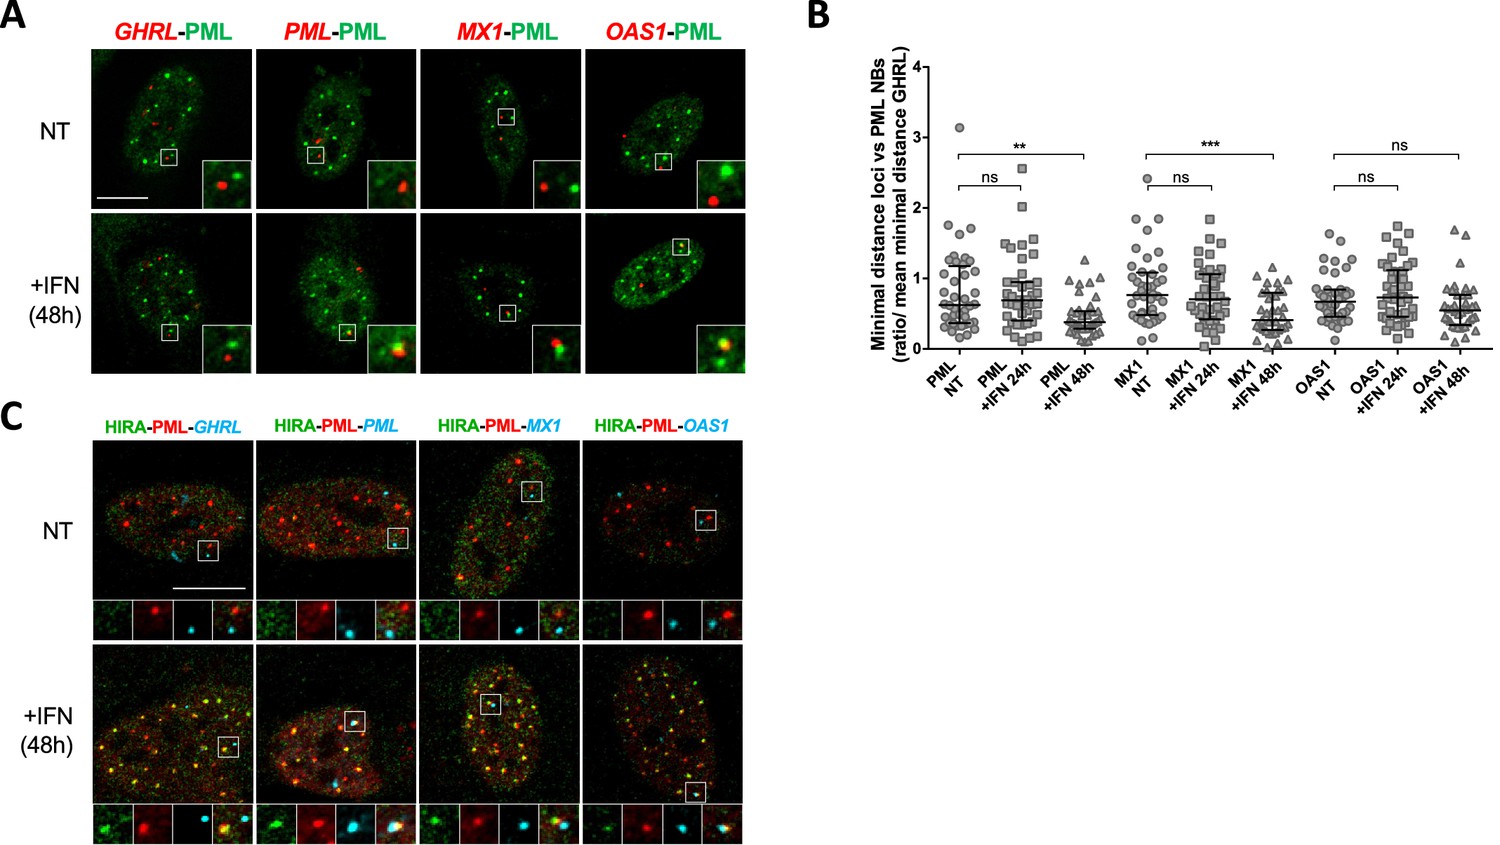
PML NBs become juxtaposed to ISGs loci upon IFN-I treatment.
(A) Confocal fluorescence microscopy visualization of IF-FISH against PML proteins (green) and GHRL control gene locus (red) or PML, MX1 or OAS1 ISGs loci (red) in BJ cells treated with IFNβ at 1000 U/mL for 48 hr. Insets represent enlarged images (3 X) of selected areas and show the relative distance between one PML NB and one gene locus. Scale bar represents 10 μm. (B) Scatter plot shows the ratio of the minimal distance between PML NBs and ISGs loci on the mean minimal distance between PML NBs and GHRL control gene locus in nuclei from BJ cells treated or not with IFNβ at 1000 U/mL for the indicated time. The line in the middle represents the median of all observations. Results are from one representative experiment out of two experiments and are calculated on an average of 40 nuclei/condition. p-value (Mann-Whitney u-test): **<0.01; ***<0.001; ns: non significant. (C) Confocal fluorescence microscopy visualization of IF-FISH against HIRA (green) and PML proteins (red) and GHRL control gene locus (cyan) or PML, MX1, or OAS1 ISGs loci (cyan) in BJ cells treated as in B. Insets and scale bar are as in B.
Figure 5—figure supplement 1
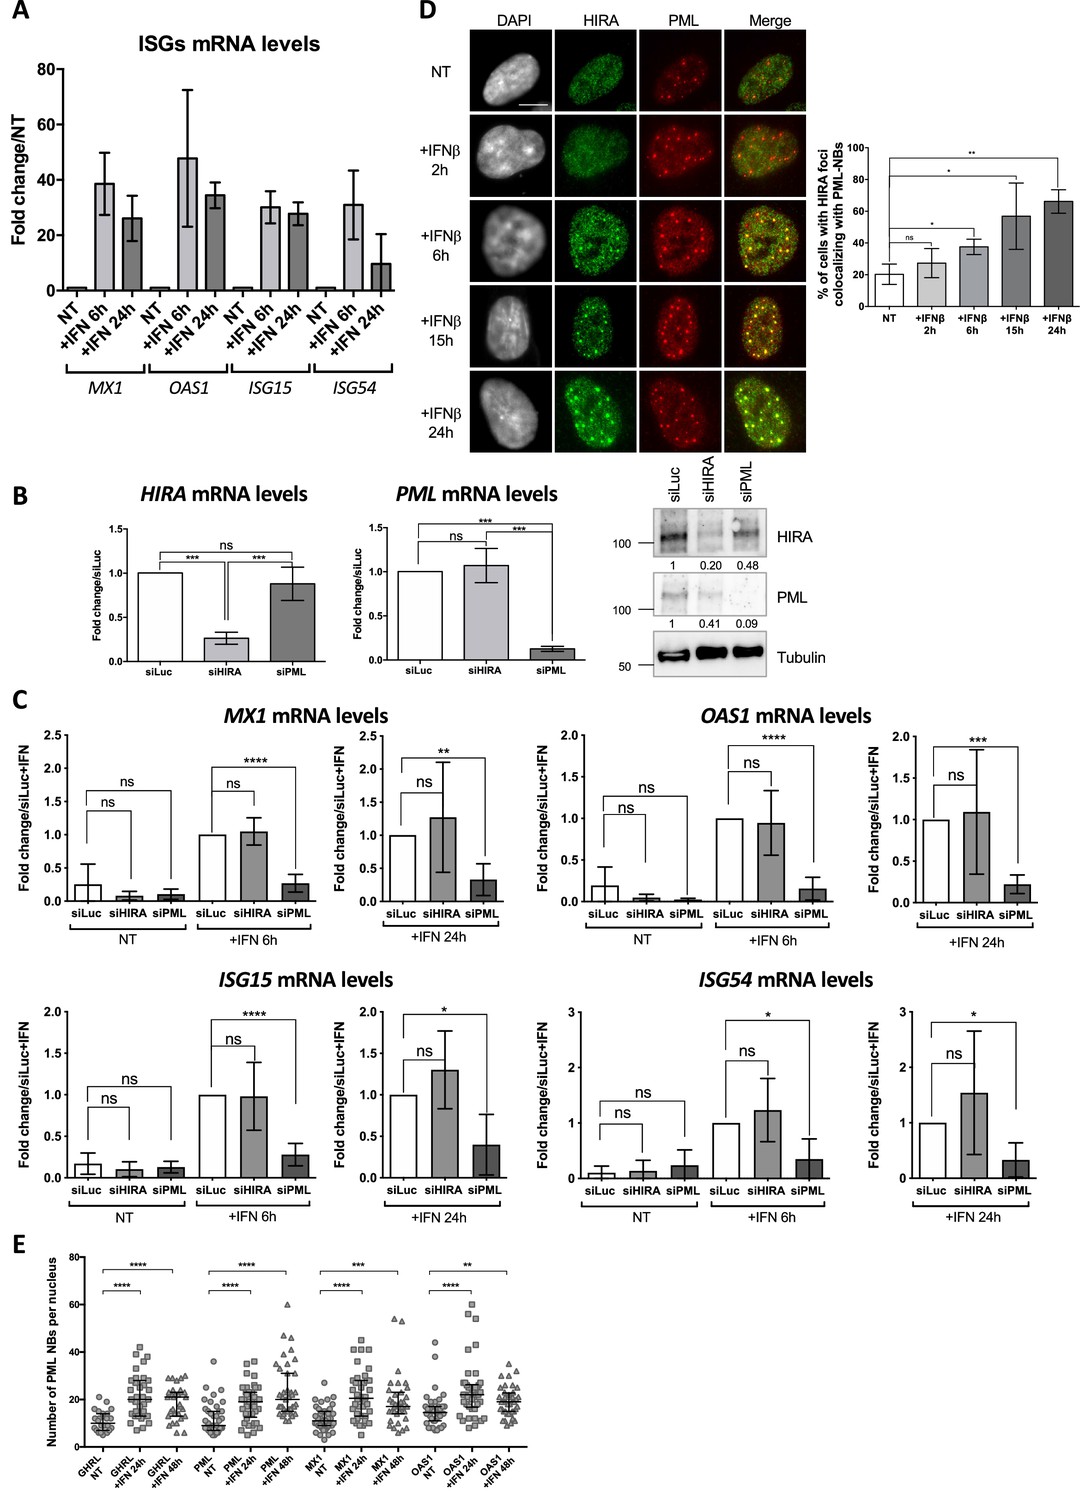
ISGs are upregulated upon IFN-I treatment in a PML-dependent manner and become juxtaposed to PML NBs.
(A) Histogram shows ISGs mRNA relative levels of MX1, OAS1, ISG15, and ISG54 normalized on GAPDH mRNA levels of BJ cells treated with IFNβ at 100 U/mL for 6 and 24 hr, or left untreated (NT). Rationalization was performed on the untreated condition. Numbers represent the mean of two independent experiments (± SD). (B) (left) Histograms show HIRA and PML mRNA relative levels normalized on GAPDH mRNA levels of BJ cells treated with the indicated siRNAs for 72 hr. Rationalization was performed on the siLuc condition. Numbers represent the mean of three to four independent experiments (± SD). p-values (Student t-test): ***<0.001; ns: non significant. (right) Western blot visualization of HIRA and PML from total cellular extracts of BJ cells treated with the indicated siRNAs for 72 hr. Tubulin is a loading control. Quantification of HIRA and PML levels relative to tubulin is shown below the WB (numbers are representative from three independent experiments). (C) Histograms show ISGs mRNA relative levels of MX1, OAS1, ISG15, and ISG54 normalized on GAPDH mRNA levels of BJ cells treated for 48 hr with the indicated siRNAs and with IFNβ at 100 U/mL for the indicated time. Rationalization was performed on the siLuc +IFN condition. Numbers represent the mean of three to five independent experiments (± SD). p-value (Student t-test): *<0.05; **<0.01; ***<0.001; ns: non significant. (D) (left) Fluorescence microscopy visualization of HIRA (green) and PML (red) in BJ cells treated with IFNβ at 1000 U/mL for the indicated time. Cell nuclei are visualized by DAPI staining (grey). Scale bar represents 10 μm. (right) Histogram shows quantitative analysis of cells with HIRA localization at PML NBs. Numbers represent the mean of three independent experiments (± SD). p-values (Student t-test): *<0.05; **<0.01; ns: non significant. (E) Scatter plot shows the number of PML NBs per cell from BJ cells treated or not with IFNβ at 1000 U/mL for the indicated time. The line in the middle represents the median of all observations with interquartile range. Results are from one representative experiment out of two experiments and are calculated on the cells analyzed on Figure 5B. p-value (Mann-Whitney u-test): **<0.01; ***<0.001; ****<0.0001; ns: non significant.
-
Figure 5—figure supplement 1—source data 1
Raw WB for Figure 5—figure supplement 1B for HIRA.
- https://cdn.elifesciences.org/articles/80156/elife-80156-fig5-figsupp1-data1-v1.tif
-
Figure 5—figure supplement 1—source data 2
Raw WB for Figure 5—figure supplement 1B for HIRA with labels.
- https://cdn.elifesciences.org/articles/80156/elife-80156-fig5-figsupp1-data2-v1.tif
-
Figure 5—figure supplement 1—source data 3
Raw WB for Figure 5—figure supplement 1B for PML.
- https://cdn.elifesciences.org/articles/80156/elife-80156-fig5-figsupp1-data3-v1.tif
-
Figure 5—figure supplement 1—source data 4
Raw WB for Figure 5—figure supplement 1B for PML with labels.
- https://cdn.elifesciences.org/articles/80156/elife-80156-fig5-figsupp1-data4-v1.tif
-
Figure 5—figure supplement 1—source data 5
Raw WB for Figure 5—figure supplement 1B for tubulin.
- https://cdn.elifesciences.org/articles/80156/elife-80156-fig5-figsupp1-data5-v1.tif
-
Figure 5—figure supplement 1—source data 6
Raw WB for Figure 5—figure supplement 1B for tubulin with labels.
- https://cdn.elifesciences.org/articles/80156/elife-80156-fig5-figsupp1-data6-v1.tif
Figure 6 with 2 supplements
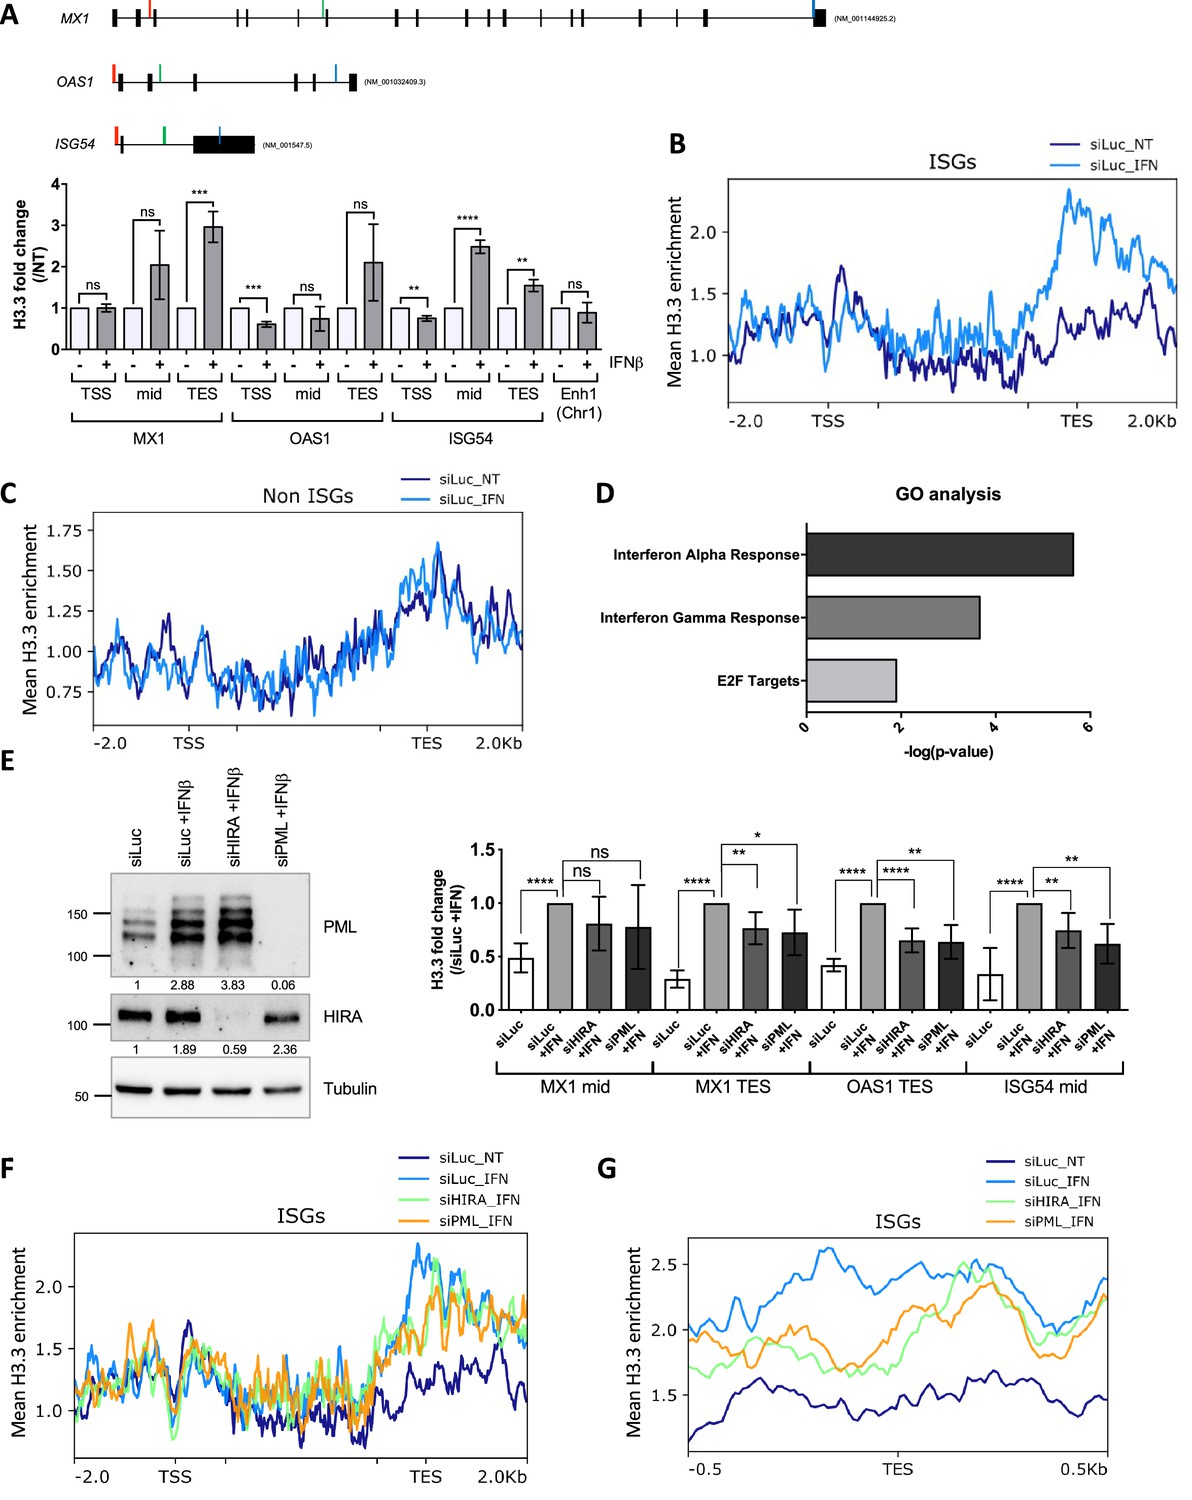
HIRA and PML depletions impair H3.3 enrichment at distal regions of ISGs.
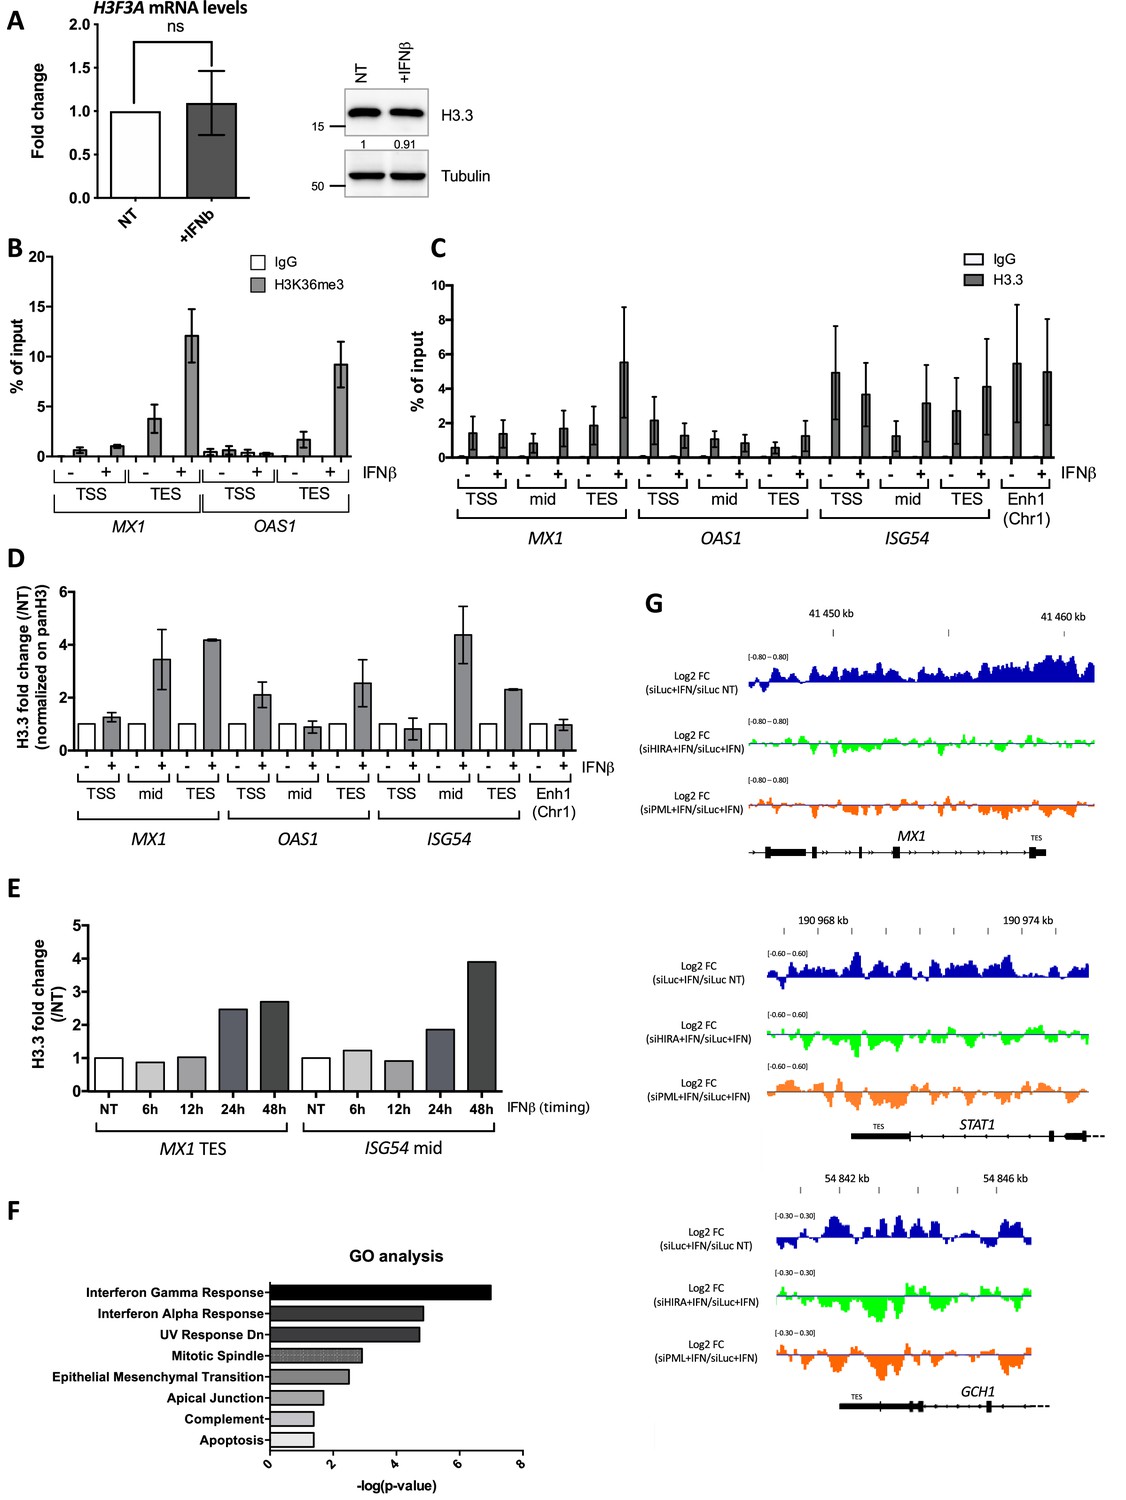
(A) (top) Schematic representation of MX1, OAS1, and ISG54 gene loci. Localization of primers is marked in color: red, green, and blue for primers localized in the Transcription Start Site (TSS), mid or Transcription End Site (TES) region respectively. Black boxes represent exons and lines represent introns. (bottom) Histogram shows H3.3 enrichment fold change obtained through ChIP experiments on BJ cells treated or not with IFNβ at 1000 U/mL for 24 hr. Rationalization was performed on H3.3 enrichment in untreated cells. qPCR was performed on MX1, OAS1, and ISG54 ISGs TSS, mid and TES regions and on one enhancer region on chromosome 1 (Enh1). Numbers represent the mean of three independent experiments (± SD). p-value (Student t-test): **<0.01; ***<0.001; ****<0.0001; ns: non significant. (B) ChIP-Seq profile of H3.3 enrichment over 48 core ISGs (McFarlane et al., 2019) ranging from –2.0 kb to 2.0 kb downstream and upstream of the gene bodies in BJ cells with siLuc for 72 hr and treated or not with IFNβ at 1000 U/mL for the last 24 hr of siRNA treatment. (C) ChIP-Seq profile of H3.3 enrichment over 48 coding non-ISGs equal in size to core ISGs (McFarlane et al., 2019), ranging from –2.0 kb to 2.0 kb downstream and upstream of the gene bodies (regions from TSS to +1000 bp and from –1000 to TES being kept unscaled) in BJ cells treated as in B. (D) Gene Ontology analysis on genes showing the highest differential H3.3 enrichment (log2(Fold Change)>5) in the TES +/-0.5 kb region between IFNβ treated and not treated conditions. (E) (left) Western blot analysis of HIRA and PML from total cellular extracts of BJ cells treated with the indicated siRNAs for 72 hr and with IFNβ at 1000 U/mL for the last 24 hr of siRNAs treatment. Tubulin is a loading control. Quantification of PML and HIRA levels relative to Tubulin are shown below the WB (numbers are representative of three independent experiments). (right) Histogram shows H3.3 enrichment obtained through ChIP experiments on BJ cells treated as on the left panel. Rationalization was performed on H3.3 enrichment in siLuc +IFN treated cells. qPCR was performed on MX1 mid and TES regions, OAS1 TES region and ISG54 mid region. Numbers represent the mean of four independent experiments (± SD). p-values (Student t-test): *<0.05; **<0.01; ****<0.0001; ns: non significant. (F) ChIP-Seq profile of H3.3 enrichment over 48 core ISGs (McFarlane et al., 2019) ranging from –2 kb before TSS to 2 kb downstream the TES in BJ cells treated as in E. (G) ChIP-Seq profile of H3.3 enrichment over 48 core ISGs (McFarlane et al., 2019) ranging from –0.5 kb to 0.5 kb downstream and upstream of the TES in BJ cells treated as in E.
-
Figure 6—source data 1
Raw WB for Figure 6E for PML.
- https://cdn.elifesciences.org/articles/80156/elife-80156-fig6-data1-v1.tif
-
Figure 6—source data 2
Raw WB for Figure 6E for PML with labels.
- https://cdn.elifesciences.org/articles/80156/elife-80156-fig6-data2-v1.tif
-
Figure 6—source data 3
Raw WB for Figure 6E for HIRA.
- https://cdn.elifesciences.org/articles/80156/elife-80156-fig6-data3-v1.tif
-
Figure 6—source data 4
Raw WB for Figure 6E for HIRA with labels.
- https://cdn.elifesciences.org/articles/80156/elife-80156-fig6-data4-v1.tif
-
Figure 6—source data 5
Raw WB for Figure 6E for tubulin.
- https://cdn.elifesciences.org/articles/80156/elife-80156-fig6-data5-v1.tif
-
Figure 6—source data 6
Raw WB for Figure 6E for tubulin with labels.
- https://cdn.elifesciences.org/articles/80156/elife-80156-fig6-data6-v1.tif
Figure 6—figure supplement 1
H3.3 and H3K36m3 increase on ISGs upon IFN-I.
(A) (left) Histogram shows relative H3F3A mRNA levels (normalized on GAPDH mRNA levels) of BJ cells treated or not with IFNβ at 100 U/mL for 24 hr. Rationalization was performed on the untreated condition. Numbers represent the mean of three independent experiments (± SD). p-value (Student t-test): ns: non significant. (right) Western blot visualization of H3.3 from total cellular extracts of IMR90 cells treated or not with IFNβ at 1000 U/mL for 24 hr. Tubulin is used here as a loading control. Quantification of H3.3 levels relative to tubulin is shown below the WB (numbers are representative of three independent experiments). (B) Histogram shows H3K36me3 and IgG enrichment (% of input) obtained through ChIP experiments on BJ cells treated or not with IFNβ at 1000 U/mL for 24 hr. qPCR was performed on MX1 and OAS1 TSS and TES regions. Numbers represent the mean of two independent experiments (± SD). (C) Histogram shows H3.3 and IgG enrichment (% of input) obtained through ChIP experiments on BJ cells treated or not with IFNβ at 1000 U/mL for 24 hr. qPCR was performed on MX1, OAS1 and ISG54 ISGs TSS, mid and TES regions and on one enhancer region on chromosome 1 (Enh1). Numbers represent the mean of three independent experiments (± SD). (D) Histogram shows H3.3 enrichment fold change obtained through ChIP experiments on BJ cells treated as in B. and normalized on panH3 enrichment. Rationalization was performed on H3.3 enrichment of untreated cells. qPCR was performed as in C. Numbers represent the mean of two independent experiments (± SD). (E) Histogram shows H3.3 enrichment fold change obtained through ChIP experiments on BJ cells treated or not with IFNβ at 1000 U/mL for the indicated times. Rationalization was performed on H3.3 enrichment in untreated cells. qPCR was performed on MX1 TES and ISG54 Mid. Numbers represent one experiment. (F) Gene Ontology analysis on a set of 654 genes having the highest RPKM difference between IFNβ treated and not treated conditions (see Materials and methods). (G) Representative genome browser snapshots of the H3.3 enrichment across the TES region of three ISGs: MX1, STAT1, and GTP cyclohydrolase 1 (GCH1). Shown are the log2 fold changes of H3.3 enrichment in siLuc +IFN/siLuc NT cells (blue), siHIRA +IFN/siLuc +IFN-treated cells (green) and siPML +IFN/siLuc +IFN-treated cells (orange).
-
Figure 6—figure supplement 1—source data 1
Raw WB for Figure 6—figure supplement 1A for H3.3 and tubulin.
- https://cdn.elifesciences.org/articles/80156/elife-80156-fig6-figsupp1-data1-v1.tif
-
Figure 6—figure supplement 1—source data 2
Raw WB for Figure 6—figure supplement 1A for H3.3 and tubulin with labels.
- https://cdn.elifesciences.org/articles/80156/elife-80156-fig6-figsupp1-data2-v1.tif
Figure 6—figure supplement 2
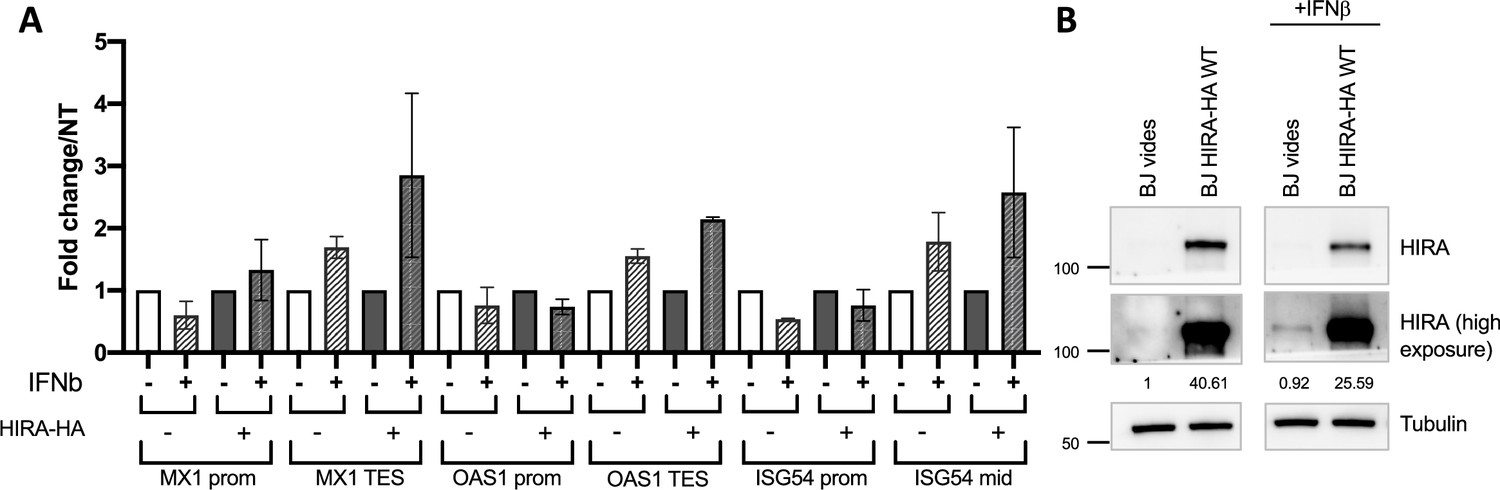
Overexpression of HIRA increases H3.3 deposition at ISGs TES region upon IFN-I.
(A) Histogram shows H3.3 enrichment obtained through ChIP experiments on BJ cells treated or not with IFNβ at 1000 U/mL for 24 hr and stably expressing or not HIRA-HA WT. Rationalization was performed on H3.3 enrichment in the no IFNβ condition. qPCR was performed on MX1 and OAS1 TSS and TES regions, as well as on ISG54 TSS and mid regions. Numbers represent the mean of two independent experiments (± SD). (B) Western blot visualization of HIRA from total cellular extracts of BJ cells treated as in A. Normal and high exposure are shown for HIRA. Tubulin is a loading control. Quantification of HIRA relative to tubulin is shown below the WB (numbers are representative of two independent experiments).
-
Figure 6—figure supplement 2—source data 1
Raw WB for Figure 6—figure supplement 2B for HIRA and tubulin.
- https://cdn.elifesciences.org/articles/80156/elife-80156-fig6-figsupp2-data1-v1.tif
-
Figure 6—figure supplement 2—source data 2
Raw WB for Figure 6—figure supplement 2B for HIRA and tubulin with labels.
- https://cdn.elifesciences.org/articles/80156/elife-80156-fig6-figsupp2-data2-v1.tif
-
Figure 6—figure supplement 2—source data 3
Raw WB for Figure 6—figure supplement 2B for HIRA (high exposure).
- https://cdn.elifesciences.org/articles/80156/elife-80156-fig6-figsupp2-data3-v1.tif
-
Figure 6—figure supplement 2—source data 4
Raw WB for Figure 6—figure supplement 2B for HIRA (high exposure) with labels.
- https://cdn.elifesciences.org/articles/80156/elife-80156-fig6-figsupp2-data4-v1.tif
Figure 7 with 1 supplement
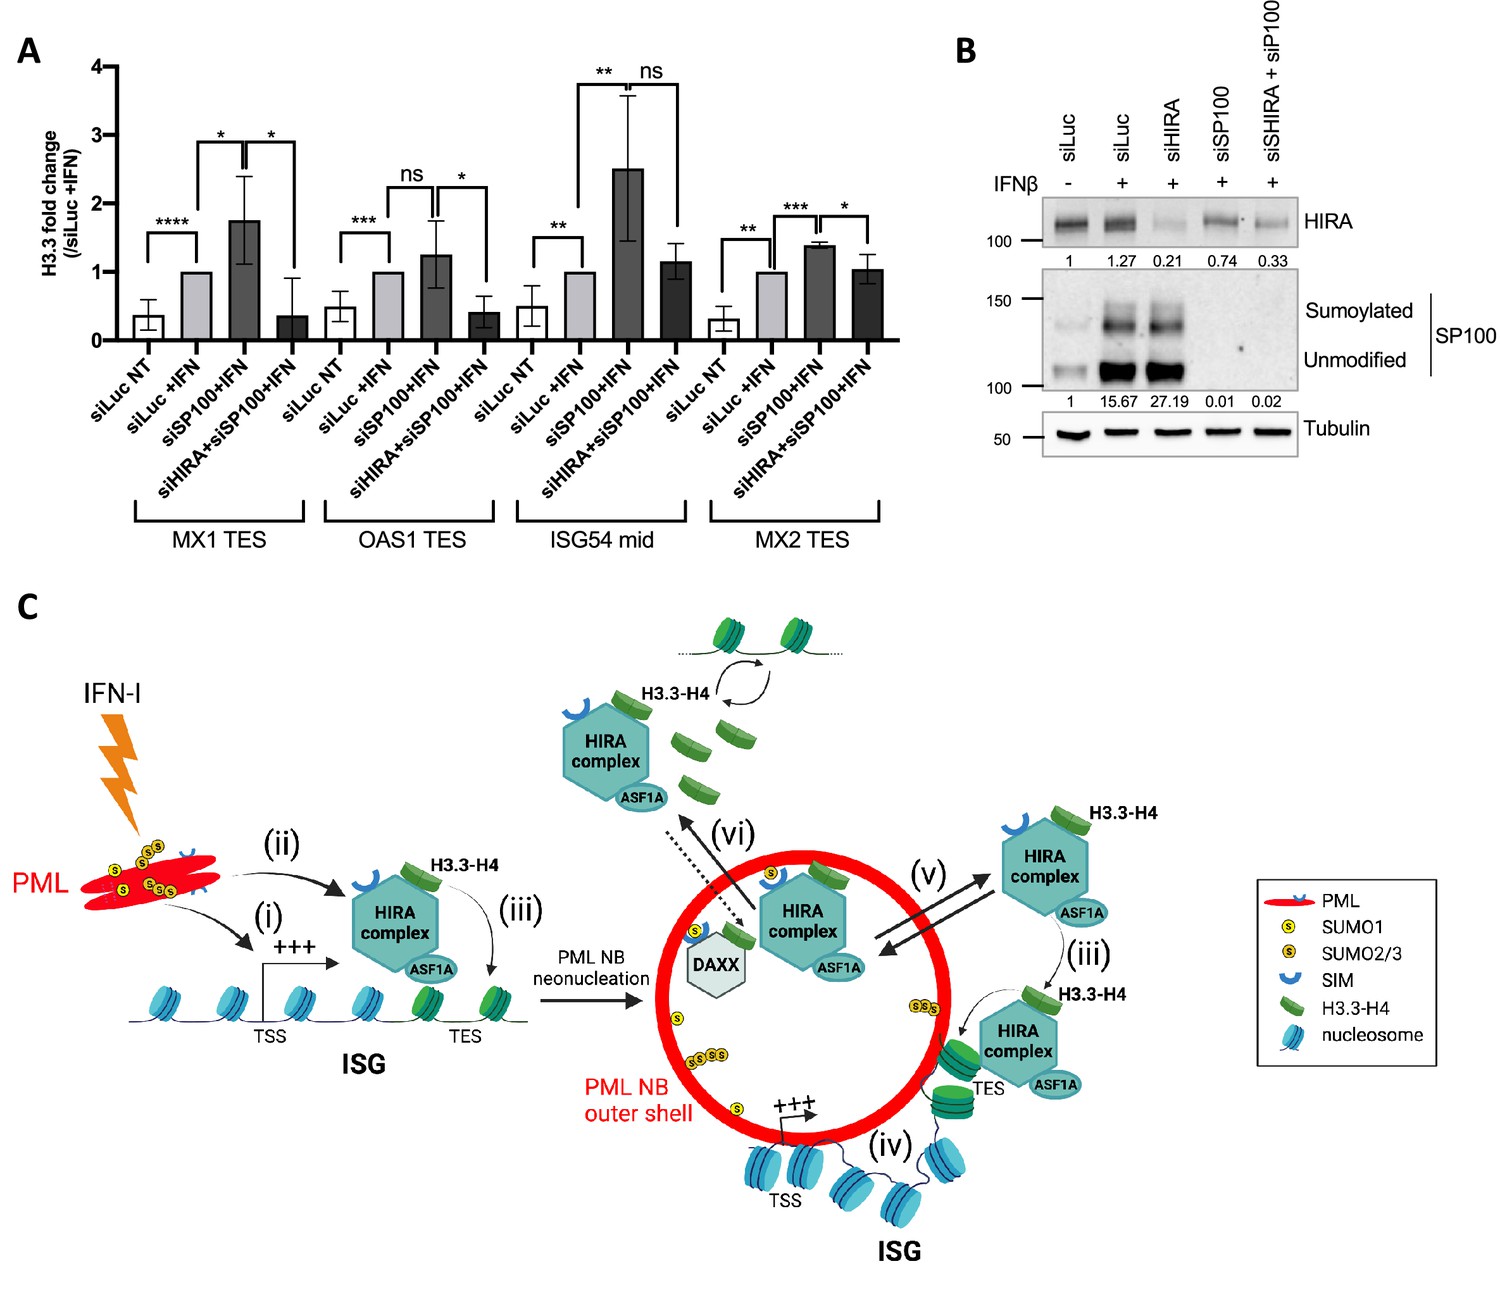
HIRA mediates H3.3 deposition during transcription of ISGs.
(A) Histogram shows H3.3 enrichment obtained through ChIP experiments on BJ cells treated with the indicated siRNAs for 48 hr and with IFNβ at 1000 U/mL for the last 24 hr of siRNAs treatment. Rationalization was performed on H3.3 enrichment in siLuc +IFN treated cells. qPCR was performed on MX1, OAS1, and MX2 TES regions as well as on ISG54 mid region. Numbers represent the mean of three technical replicates out of two independent experiments (± SD). p-value (Student t-test): *<0.05; **<0.01; ***<0.001; ****<0.0001; ns: non significant. (B) Western blot analysis of HIRA and SP100 from total cellular extracts of BJ cells treated as in A. Tubulin is a loading control. Quantification of HIRA and SP100 levels relative to Tubulin are shown below the WB (numbers are representative of two independent experiments). (C) Model for the dual role of PML/PML NBs in inflammatory response. At early time points after an initial IFN-I stimulus, (i) PML is required for ISGs transcription and (ii) this could indirectly help to load HIRA on ISGs participating in H3.3 dynamics. (iii) While HIRA depletion does not affect ISGs transcription per se, it could participate in H3.3 deposition at ISGs, a function which does not seem to require its accumulation in PML NBs. (iv) PML neonucleation would mediate juxtaposition of PML NBs with ISGs at late times after IFN-I treatment which could help to keep a memory of the physiological state of the cell. (v) In addition, PML NBs play a second independent role by buffering the extra pool of HIRA complex available in the nucleus. (vi) Increase of DAXX protein levels could modulate the amount of available binding sites for HIRA within PML NBs or overexpression of the HIRA substrate H3.3 as a pool of free soluble H3.3 in the nucleoplasm could force HIRA out of PML NBs.
-
Figure 7—source data 1
Raw WB for Figure 7B for HIRA.
- https://cdn.elifesciences.org/articles/80156/elife-80156-fig7-data1-v1.tif
-
Figure 7—source data 2
Raw WB for Figure 7B for HIRA with labels.
- https://cdn.elifesciences.org/articles/80156/elife-80156-fig7-data2-v1.tif
-
Figure 7—source data 3
Raw WB for Figure 7B for SP100.
- https://cdn.elifesciences.org/articles/80156/elife-80156-fig7-data3-v1.tif
-
Figure 7—source data 4
Raw WB for Figure 7B for SP100 with labels.
- https://cdn.elifesciences.org/articles/80156/elife-80156-fig7-data4-v1.tif
-
Figure 7—source data 5
Raw WB for Figure 7B for tubulin.
- https://cdn.elifesciences.org/articles/80156/elife-80156-fig7-data5-v1.tif
-
Figure 7—source data 6
Raw WB for Figure 7B for tubulin with labels.
- https://cdn.elifesciences.org/articles/80156/elife-80156-fig7-data6-v1.tif
Figure 7—figure supplement 1
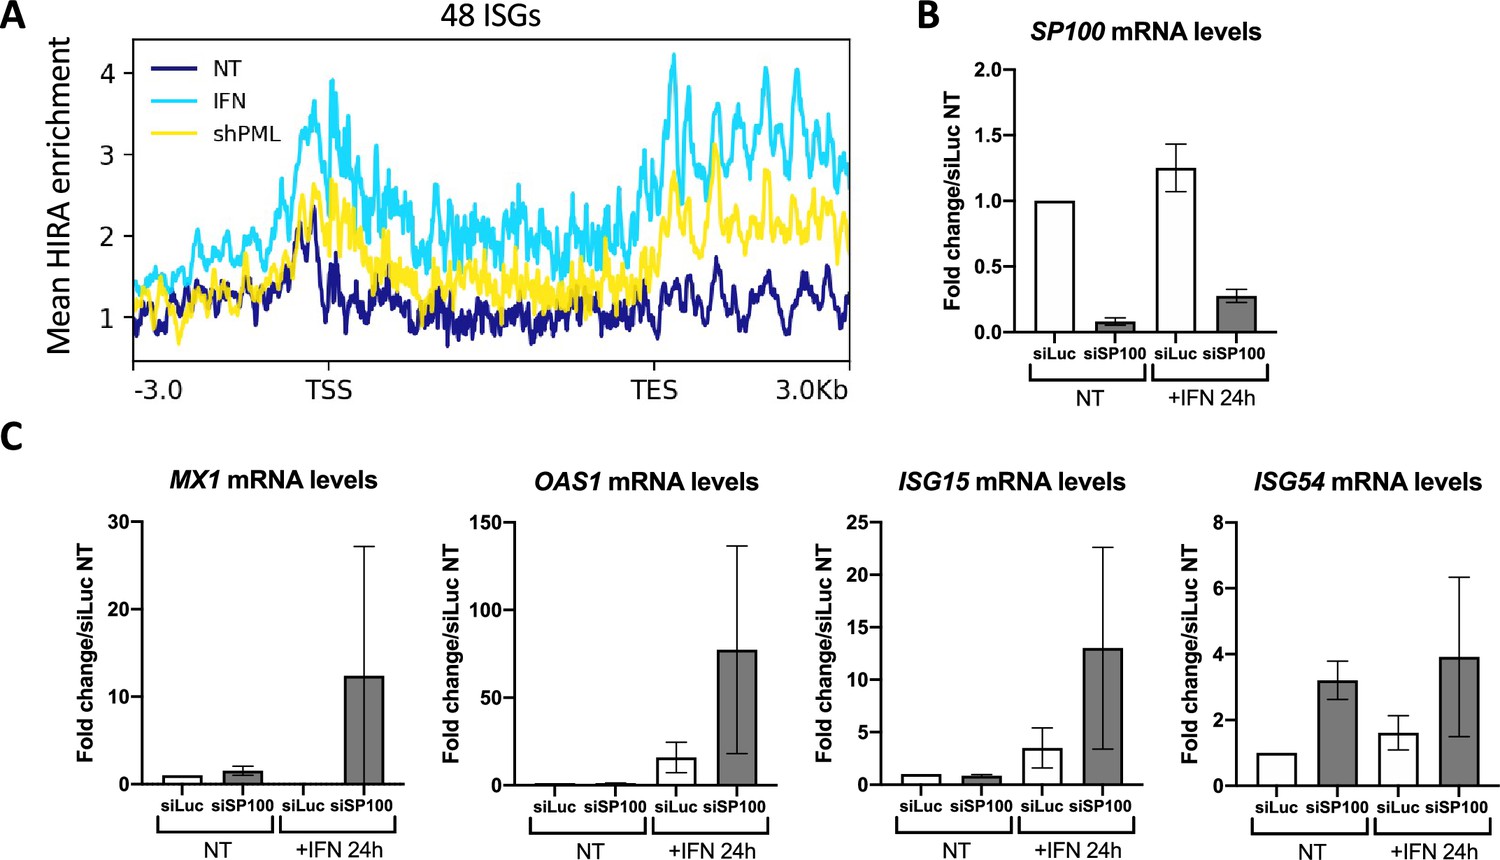
SP100 knock-down increases ISGs transcription upon IFN-I treatment.
(A) ChIP-Seq profile of HIRA enrichment over 48 core ISGs ranging from –3.0 kb to 3.0 kb downstream and upstream of the gene bodies in IMR90 cells stably transduced to express the indicated shRNAs and treated or not with IFNβ at 2000U/mL for 24 hr. Data are reanalyzed from McFarlane et al., 2019. (B) Histograms show relative SP100 mRNA levels (normalized on GAPDH mRNA levels) in BJ cells transfected with the indicated siRNA for 48 hr and treated or not with IFNβ at 100 U/mL for the last 24 hr of siRNAs treatment. Rationalization was performed on the siLuc condition. Numbers represent the mean of two independent experiments (± SD). (C) Histograms show relative MX1, OAS1, ISG15, and ISG54 mRNA levels (normalized on GAPDH mRNA levels) in BJ cells treated as in B. Rationalization was performed on the siLuc condition. Numbers represent the mean of two independent experiments (± SD). p-value (Student t-test): *<0.05; **<0.01; ***<0.001; ns: non significant.
Author response image 1
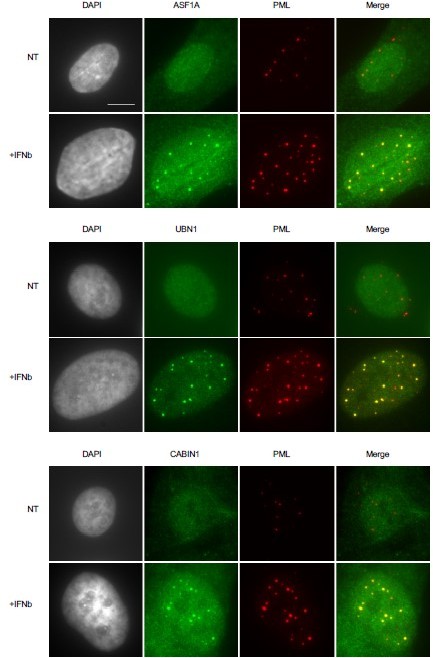
Members of the HIRA complex accumulate in PML NBs following IFN-I treatment.
Fluorescence microscopy visualization of ASF1 (green), UBN1 (green) or CABIN1 (green) together with PML (red) in BJ cells treated with IFNβ at 1000U/mL for 24h (+IFNβ) or left untreated (NT). Cell nuclei are visualized by DAPI staining (grey). Scale bar represents 10 μm.
Author response image 2

EYFP-SP100 localizes in PML NBs in absence of endogenous SP100.
Fluorescence microscopy visualization of HIRA (green) together with PML (red) and EYFP-SP100 (pseudocolored in cyan) in BJ cells treated with an siRNA against SP100 for 48h and transduced with a lentivirus expressing EYFP-SP100 WT or K297R for 48h. Cell nuclei are visualized by DAPI staining (grey). Scale bar represents 10 μm.
Tables
Appendix 1—key resources table
| Reagent type (species) or resource | Designation | Source or reference | Identifiers | Additional information |
|---|---|---|---|---|
| Cell line (H. sapiens) | BJ | ATCC | CRL-2522 | Human primary foreskin fibroblasts |
| Cell line (H. sapiens) | BJ S1S2D5 | This paper | Human primary foreskin fibroblasts transduced with TetOne-Tat-S1S2D5-Flag-His | |
| Cell line (H. sapiens) | BJ eH3.3i | This paper | Human primary foreskin fibroblasts transduced with H3.3-SNAP-HA3 | |
| Cell line (H. sapiens) | BJ HIRA-HA WT/mSIM(1-5) | This paper | Human primary foreskin fibroblasts transduced with HIRA-HA WT/mSIM(1-5) | |
| Cell line (H. sapiens) | BJ EYFP-SP100 isoform A WT or K297R (siRNA resistant) | This paper | Human primary foreskin fibroblasts transduced with EYFP-SP100 isoform A WT or K297R (siRNA resistant) | |
| Cell line (H. sapiens) | BJ Myc-DAXX | This paper | Human primary foreskin fibroblasts transduced with Myc-DAXX | |
| Cell line (H. sapiens) | IMR90 | ATCC | CCL-186 | Fetal lung primary fibroblasts |
| Cell line (H. sapiens) | IMR90 eH3.3i | This paper | Fetal lung primary fibroblasts transduced with H3.3-SNAP-HA3 | |
| Cell line (H. sapiens) | IMR90 HIRA-HA WT/K809G | This paper | Fetal lung primary fibroblasts transduced with HIRA-HA WT/K809G | |
| Cell line (H. sapiens) | HEK 293T | Intercell, AG Corpet et al., 2014 | Immortalized embryonic kidney cells | |
| Cell line (M. musculus) | MEF PML-/- | Gift from Dr. Lallemand-Breitenbach Sahin et al., 2014 | Mouse embryonic fibroblasts knocked-out for PML | |
| Cell line (M. musculus) | MEF PML-/- Myc-PML1 WT/3 K | This paper | Mouse embryonic fibroblasts knocked-out for PML and transduced with TetOne-Myc-PML1 WT/3 K | |
| Antibody | Anti-Actin (Rabbit polyclonal) | Sigma-Aldrich | A2066 | WB 1:1000 |
| Antibody | Anti-panH3 (Rabbit polyclonal) | Abcam | ab1791 | WB 1:5000 ChIP: 2 μg |
| Antibody | Anti-H3.3 (Rabbit monoclonal) | Diagenode | C15210011 | WB 1:1000 ChIP: 2 μg |
| Antibody | Anti-HA (Rabbit polyclonal) | Abcam | ab9110 | IF 1:1000 WB 1:1000 |
| Antibody | Anti-HIRA #01 (Mouse monoclonal, clone WC119) | Active Motif | 3558 | IF 1:500 WB 1:1000 |
| Antibody | Anti-HIRA #02 (Mouse monoclonal, clone WC119) | Millipore | 04–1488 | IF 1:500 WB 1:1000 |
| Antibody | Anti-HIRA #03 (Rabbit polyclonal) | Abcam | ab20655 | For mouse IF 1:100 |
| Antibody | Anti-6xHis #01 (Mouse monoclonal, clone 3D5) | Clontech | 631212 | IF 1:1000 |
| Antibody | Anti-6xHis #02 (Rabbit polyclonal) | Bethyl | A190-114A | IF 1:10000 |
| Antibody | Anti-c-Myc #01 (Mouse monoclonal, clone 9E10) | Santa Cruz | sc-40 | WB 1:1000 |
| Antibody | Anti-c-Myc #02 (Rabbit polyclonal) | Abcam | ab9106 | IF 1:1000 |
| Antibody | Anti-PML #01 (Mouse monoclonal, clone PG-M3) | Santa Cruz | sc-966 | IF 1:200 |
| Antibody | Anti-PML #02 (Rabbit polyclonal) | Santa Cruz | sc-5621 | IF 1:200 WB 1:1000 |
| Antibody | Anti-PML #03 (Rabbit polyclonal) | Sigma | PLA0172 | IF 1:5000 WB 1:1000 |
| Antibody | Anti-PML #04 (Mouse monoclonal, clone 36.1–104) | Millipore | MAB3738 | For mouse IF 1:100 |
| Antibody | Anti-SP100 (Rabbit polyclonal antiserum) | Kind gift from Dr. Thomas M. Sternsdorf | GH3 | IF: 1:100 WB: 1:1000 |
| Antibody | Anti-SUMO-1 (Rabbit monoclonal, clone Y299) | Abcam | ab32058 | WB 1:1000 |
| Antibody | Anti-SUMO-2/3 (Rabbit polyclonal) | Abcam | ab3742 | WB 1:1000 |
| Antibody | Anti-αTubulin (Mouse monoclonal, clone DM1A) | Sigma | T6199 | WB 1:10000 |
| Recombinant DNA reagent | pLentiN (plasmid) | Addgene | #37444 | Lentiviral plasmid |
| Recombinant DNA reagent | pLVX-TetOne (plasmid) | Clontech | 631849 | Doxycyclin inducible lentiviral plasmid |
| Recombinant DNA reagent | pcDNA5-Tat-S1S2D5-Flag-His (plasmid) | Gift from Dr. Hughes Hughes et al., 2017 | ||
| Recombinant DNA reagent | pLVX-TetOne-Tat-S1S2D5-Flag-His (plasmid) | This paper | PCR on pcDNA5-Tat-S1S2D5-Flag-His and cloning in lentiviral pLVX-TetOne plasmid | |
| Recombinant DNA reagent | pLentiN-HIRA-HA WT (plasmid) | This paper | RT-PCR on HeLa cells and cloning in lentiviral pLentiN plasmid | |
| Recombinant DNA reagent | pLentiN-HIRA-HA WT (plasmid) | This paper | RT-PCR on HeLa cells and cloning in lentiviral pLentiN plasmid | |
| Recombinant DNA reagent | pLentiN-HIRA-HA mSIM(1-5) (plasmid) | This paper | Site-directed mutagenesis on pLentiN-HIRA-HA WT plasmid. Mutations: mSIM1=V124 G/S125G; mSIM2=V225 G/L226G; mSIM3=L320 G/L321G; mSIM4=V805 G/V806G; mSIM5=V978 G/V979G | |
| Recombinant DNA reagent | pLentiN-HIRA-HA K809G (plasmid) | This paper | Site-directed mutagenesis K809G on pLentiN HIRA-HA WT plasmid | |
| Recombinant DNA reagent | pLNGY-PML1 WT (plasmid) | Gift from Dr. Everett Cuchet et al., 2011 | ||
| Recombinant DNA reagent | pLNGY-PML1.KKK (plasmid) | Gift from Dr. Everett Cuchet et al., 2011 | 3 main SUMOylation sites mutated PML1 | |
| Recombinant DNA reagent | pLVX-PML1 WT (plasmid) | This paper | PCR on pLNGY-PML1 WT and cloning in lentiviral pLVX-TetOne plasmid | |
| Recombinant DNA reagent | pLVX-PML1.KKK (plasmid) | This paper | PCR on pLNGY-PML1.KKK and cloning in lentiviral pLVX-TetOne plasmid | |
| Recombinant DNA reagent | pLNGY-EYFP-S100 isoform A WT (plasmid) | Gift from Dr. Everett Cuchet-Lourenço et al., 2011 | ||
| Recombinant DNA reagent | pLNGY-EYFP-S100 isoform A K297R (plasmid) | Gift from Dr. Everett Cuchet-Lourenço et al., 2011 | Main SUMOylation site K297 mutated on SP100 | |
| Recombinant DNA reagent | pLVX-EYFP-SP100 isoform A WT (plasmid) | This paper | PCR on pLNGY-EYFP-S100 isoform A WT and cloning in lentiviral pLVX-TetOne plasmid | |
| Recombinant DNA reagent | pLVX-EYFP-SP100 isoform A K297R (plasmid) | This paper | PCR on pLNGY-EYFP-S100 isoform A K297R and cloning in lentiviral pLVX-TetOne plasmid | |
| Recombinant DNA reagent | pBABE-H3.3-SNAP-HA3 (plasmid) | Gift from Dr. Jansen | ||
| Recombinant DNA reagent | pLVX-TetOne-H3.3-SNAP-HA3 (plasmid) | This paper | PCR on pBABE-H3.3-SNAP-HA3 and cloning in lentiviral pLVX-TetOne plasmid | |
| Recombinant DNA reagent | RP11-438J1 (BAC) | Gift from Dr. Schluth-Bolard | BAC used for FISH probe against GHRL | |
| Recombinant DNA reagent | RP11-185E17 (BAC) | RP11-185E17 | https://bacpacresources.org/ | BAC used for FISH probe against PML |
| Recombinant DNA reagent | RP11-120C17 (BAC) | RP11-120C17 | https://bacpacresources.org/ | BAC used for FISH probe against MX1 |
| Recombinant DNA reagent | RP11-134B23 (BAC) | RP11-134B23 | https://bacpacresources.org/ | BAC used for FISH probe against OAS1 |
| Sequence-based reagent | siHIRA | Ray-Gallet et al., 2011 | siRNA | sequence 5’GGAUAACACUGUCGUCAUCdTdT |
| Sequence-based reagent | siLuc | Adam et al., 2013 | siRNA | sequence 5’CGUACGCGGAAUACUUCGAdTdT |
| Sequence-based reagent | siPML | Everett et al., 2006 | siRNA | sequence 5’AGATGCAGCTGTATCCAAGdTdT |
| Sequence-based reagent | siSP100 | Everett et al., 2008 | siRNA | sequence 5'GUGAGCCUGUGAUCAAUAAdTdT |
| Sequence-based reagent | siSUMO-1 | Lallemand-Breitenbach et al., 2008 | siRNA | sequence 5’GGACAGGAUAGCAGUGAGAdTdT |
| Sequence-based reagent | siSUMO-2/3 | Yao et al., 2011 | siRNA | sequence 5’GUCAAUGAGGCAGAUCAGAdTdT |
| Sequence-based reagent | H3.3-ChIP-cluster3-Chr1-F (Enh1) | Pchelintsev et al., 2013 | CHIP qPCR primer | 5’GCCACTTGCCAATGTTTCTC |
| Sequence-based reagent | H3.3-ChIP-cluster3-Chr1-R (Enh1) | Pchelintsev et al., 2013 | CHIP qPCR primer | 5’TGGCCCCATGTAGTGAAAAG |
| Sequence-based reagent | ChIP-GCH1-TES-F | this paper | CHIP qPCR primer | 5'TCTGGTCCCGGTTTCCTTTG |
| Sequence-based reagent | ChIP-GCH1-TES-R | this paper | CHIP qPCR primer | 5'TTTAATTTGGCCCACGCTGC |
| Sequence-based reagent | ChIP-ISG54-TSS-F | This paper | CHIP qPCR primer | 5’GCAGGAAGTGGGGTTTGCTA |
| Sequence-based reagent | ChIP-ISG54-TSS-R | This paper | CHIP qPCR primer | 5’GAGGGATGTTTCATCGGCCT |
| Sequence-based reagent | ChIP-ISG54-mid-F | This paper | CHIP qPCR primer | 5’ATGTAACTAACCCCAGGTGCG |
| Sequence-based reagent | ChIP-ISG54-mid-R | This paper | CHIP qPCR primer | 5’TGCTTCCCACTCCCATTTTGA |
| Sequence-based reagent | ChIP-ISG54-TES-F | This paper | CHIP qPCR primer | 5’AGTCTGGAAGCCTCATCCCT |
| Sequence-based reagent | ChIP-ISG54-TES-R | This paper | CHIP qPCR primer | 5’CCTAGTGGGCACCACATCTC |
| Sequence-based reagent | ChIP-MX1-TSS-F | Cheon et al., 2013 | CHIP qPCR primer | 5’GCCCTCTCTTCTTCCAGGCAAC |
| Sequence-based reagent | ChIP-MX1-TSS-R | Cheon et al., 2013 | CHIP qPCR primer | 5’GGGACAGGCATCAACAAAGC |
| Sequence-based reagent | ChIP-MX1-mid-F | This paper | CHIP qPCR primer | 5’TCTACGCTCTGGGGACATCA |
| Sequence-based reagent | ChIP-MX1-mid-R | This paper | CHIP qPCR primer | 5’GAACCAAACCCACCACCAGA |
| Sequence-based reagent | ChIP-MX1-TES-F | This paper | CHIP qPCR primer | 5’CTCCCGTGAACTGTTCTTTCCT |
| Sequence-based reagent | ChIP-MX1-TES-R | This paper | CHIP qPCR primer | 5’GCTGTAGGTGTCCTTGTCCT |
| Sequence-based reagent | ChIP-MX2-TES-F | This paper | CHIP qPCR primer | 5’ACCACTCCAGCAAACCCTTC |
| Sequence-based reagent | ChIP-MX2-TES-R | This paper | CHIP qPCR primer | 5’AATGGGATCTGGTTGGCGAG |
| Sequence-based reagent | ChIP-OAS1-TSS-F | This paper | CHIP qPCR primer | 5’ACCACAGACAACTGTGAAAGG |
| Sequence-based reagent | ChIP-OAS1-TSS-R | This paper | CHIP qPCR primer | 5’GTCCTTTAGCCAGCAACAAGC |
| Sequence-based reagent | ChIP-OAS1-mid-F | This paper | CHIP qPCR primer | 5’GCAGCACGTTGGGAGATAGA |
| Sequence-based reagent | ChIP-OAS1-mid-R | This paper | CHIP qPCR primer | 5’TTCTCCTGATGTGGCAAGGG |
| Sequence-based reagent | ChIP-OAS1-TES-F | This paper | CHIP qPCR primer | 5’CTTGTCACATCCCCACCTCTC |
| Sequence-based reagent | ChIP-OAS1-TES-R | This paper | CHIP qPCR primer | 5’GTCCTTTGCCCCTGTTTAGC |
| Sequence-based reagent | GAPDH-F | This paper | RT qPCR primer | 5’GAGTCAACGGATTTGGTCG |
| Sequence-based reagent | GAPDH-R | This paper | RT qPCR primer | 5’TTGATTTTGGAGGGATCTCG |
| Sequence-based reagent | H3F3A-F | This paper | RT qPCR primer | 5’CCAGGAAGCAACTGGCTACA |
| Sequence-based reagent | H3F3A-R | This paper | RT qPCR primer | 5’ACCAGGCCTGTAACGATGAG |
| Sequence-based reagent | HIRA-F | This paper | RT qPCR primer | 5’AGGACTCTCGTCTCATGCCT |
| Sequence-based reagent | HIRA-R | This paper | RT qPCR primer | 5’CAGCTTCAGTGCAAGTGCT |
| Sequence-based reagent | ISG15-F | This paper | RT qPCR primer | 5’GGTGGACAAATGCGACGAAC |
| Sequence-based reagent | ISG15-R | This paper | RT qPCR primer | 5’TCGAAGGTCAGCCAGAACAG |
| Sequence-based reagent | ISG54-F | This paper | RT qPCR primer | 5’TGAAAGAGCGAAGGTGTGCT |
| Sequence-based reagent | ISG54-R | This paper | RT qPCR primer | 5’CTCAGAGGGTCAATGGCGTT |
| Sequence-based reagent | MX1-F | This paper | RT qPCR primer | 5’GGAGGCACTGTCAGGAGTTG |
| Sequence-based reagent | MX1-R | This paper | RT qPCR primer | 5’TCCTGGTAACTGACCTTGCC |
| Sequence-based reagent | OAS1-F | This paper | RT qPCR primer | 5’AGCTGGAAGCCTGTCAAAGA |
| Sequence-based reagent | OAS1-R | This paper | RT qPCR primer | 5’AGGTTTATAGCCGCCAGTCA |
| Sequence-based reagent | PML-F | This paper | RT qPCR primer | 5’CAGGGACCCTATTGACGTTG |
| Sequence-based reagent | PML-R | This paper | RT qPCR primer | 5’ATGGAGAAGGCGTACACTGG |
| Sequence-based reagent | SP100-F | This paper | RT qPCR primer | 5'CACTGACGTTGATGAGCCCT |
| Sequence-based reagent | SP100-R | This paper | RT qPCR primer | 5'AATCTGGGGTCGTGAGCAAG |
| Peptide, recombinant protein | IFNβ | Peprotech | 300-02BC | Human Final concentration: 100 or 1000 U/mL |
| Peptide, recombinant protein | IFNα | PBL assay science | 12105–1 | Mouse Final concentration: 1000 U/mL |
| Peptide, recombinant protein | IL-6 | Peprotech | 200–06 | Human Final concentration: 200 ng/mL |
| Peptide, recombinant protein | IL-8 | Peprotech | 200–08 | Human Final concentration: 200 ng/mL |
| Peptide, recombinant protein | TNF-α | Invivogen | rcyc-htnfa | Human Final concentration: 100 ng/mL |
| Chemical compound, drug | Blasticidin | Invivogen | ant-bl | Final concentration: 5 μg/mL |
| Chemical compound, drug | Doxycycline | Sigma Aldrich | D9891 | Final concentration: 100 ng/mL |
| Chemical compound, drug | EdU | Invitrogen | C10338 | Final concentration: 10 μM |
| Chemical compound, drug | PolyI:C | Invivogen | trlr-pic | Final concentration: 10 μg/mL |
| Chemical compound, drug | Puromycin | Invivogen | ant-pr | Final concentration: 1 μg/mL |
| Chemical compound, drug | Ruxolitinib | Invivogen | trlr-rux | Final concentration: 2 μM |
| Commercial assay or kit | Duolink In Situ Red Starter Kit Mouse/Rabbit | Sigma Aldrich | DUO092101 | For PLA |
| Software, algorithm | Homer | http://homer.ucsd.edu/homer/download.html | ChIP seq analysis | |
| Software, algorithm | MACS2 | Zhang et al., 2008 | ChIP seq analysis | |
| Software, algorithm | Bowtie2 | Langmead and Salzberg, 2012 | ChIP seq analysis | |
| Software, algorithm | DeepTools suite | https://deeptools.readthedocs.io/en/develop/ | ChIP seq visualization | |
| Software, algorithm | enrichR | Kuleshov et al., 2016 | GO analysis | |
| Software, algorithm | IGV | https://software.broadinstitute.org/software/igv/ | Genome browser | |
| Software, algorithm | Fiji | https://imagej.net/imagej-wiki-static/Fiji/Downloads | Image analysis | |
| Software, algorithm | Photoshop | https://www.adobe.com/products/photoshop.html | Image analysis | |
| Software, algorithm | GraphPad Prism 6 | https://www.graphpad.com/scientific-software/prism/ | Statistical analysis and graphics | |
| Software, algorithm | Biorender | biorender.com | figure creation |
Additional files
Download links
A two-part list of links to download the article, or parts of the article, in various formats.
Downloads (link to download the article as PDF)
Open citations (links to open the citations from this article in various online reference manager services)
Cite this article (links to download the citations from this article in formats compatible with various reference manager tools)
Interplay between PML NBs and HIRA for H3.3 dynamics following type I interferon stimulus
eLife 12:e80156.
https://doi.org/10.7554/eLife.80156


