Fat body phospholipid state dictates hunger-driven feeding behavior
- Basic Sciences Division, Fred Hutch, United States
- Cellular Imaging Core, Shared Resources, Fred Hutch, United States
Figures
Figure 1 with 2 supplements

High-sugar diet (HSD) causes progressive loss in hunger-driven feeding (HDF).
(A) HDF behavior in flies was tested using the schematic in (A). After aging flies for 7 days on normal lab food, flies we subject to a normal diet or an HSD (30% more sugar in food) for a duration of 3–28 days. For every timepoint, hunger was induced by subjecting flies to starvation (agarose, 0% sucrose media) overnight for 16 hr. Quantitative feeding behavior was monitored using the Fly Liquid Interaction Counter (FLIC) during a 3 hr window immediately after the starvation period. (B) Average feeding events over time for normal food (NF) flies that were either fed (filled circles) or starved for 16 hr prior to measurement (stv; no fill). Note that HDF is maintained throughout the experiment. (C) Average feeding events over time for HSD-fed flies that were either fed or starved for 16 hr prior to measurement (stv). Note the loss of HDF on day 14. (D) Comparison of basal feeding in NF and HSD fed flies over time. N = 18 for each treatment and timepoint. (E, F) Average triacylglyceride (TAG) levels per fly of NF (E) and HSD-fed (F) flies at baseline and after 16 hr of starvation. (G) Average change in TAG levels after starvation in NF and HSD flies (n = 8–9 for each treatment and timepoint). (H) Flies given HSD for 14 days were starved for various durations on 0% sucrose media (16, 20, 24, and 32 hr, respectively) with feeding events recorded as in (B–D) (n = 6–20 for each treatment). Starvation periods were staggered such that all flies were assayed on the FLIC at the same time. (I) Average TAG levels per fly of (H) flies after subjected to starvation of various durations (n = 4 for each treatment). (J) TAG levels per fly of (H) flies normalized to the HSD fed control. Two-way ANOVA with Sidak post-test correction. Asterisks indicate significant changes with p-value<0.05, p-value<0.005, and p-value<0.0005. Error bars = standard deviation.
-
Figure 1—source data 1
w1118 hunger-driven feeding responses related to Figure 1B–D.
- https://cdn.elifesciences.org/articles/80282/elife-80282-fig1-data1-v2.xlsx
-
Figure 1—source data 2
Change in w1118 triacylglyceride (TAG) levels after 16 hr of starvation related to Figure 1E–G.
- https://cdn.elifesciences.org/articles/80282/elife-80282-fig1-data2-v2.xlsx
-
Figure 1—source data 3
w1118 hunger-driven feeding responses on high-sugar diet (HSD) related to Figure 1H.
- https://cdn.elifesciences.org/articles/80282/elife-80282-fig1-data3-v2.xlsx
-
Figure 1—source data 4
Triacylglyceride (TAG) levels of 14-day high-sugar diet (HSD)-fed w1118 flies related to Figure 1I.
- https://cdn.elifesciences.org/articles/80282/elife-80282-fig1-data4-v2.xlsx
-
Figure 1—source data 5
Normalized triacylglyceride (TAG) levels of 14-day high-sugar diet (HSD)-fed w1118 flies related to Figure 1J.
- https://cdn.elifesciences.org/articles/80282/elife-80282-fig1-data5-v2.xlsx
Figure 1—figure supplement 1

Flies on high-sugar diet (HSD) show a progressive loss in hunger-driven feeding (HDF).
(left) Average feeding events over time for normal food (NF) flies that were either fed or starved with 0% sucrose agar (stv) for 16 hr prior to measurement. Note that HDF is maintained throughout the experiment. (right) Average feeding events over time for HSD-fed flies that were either fed or starved (stv) for 16 hr prior to measurement. Note the loss of HDF on day 14. Each dot denotes an individual fly. Two-way ANOVA with Sidak post-test correction. Asterisks indicate significant changes with p-value<0.05, p-value<0.005, and p-value<0.0005. Error bars = standard deviation.
-
Figure 1—figure supplement 1—source data 1
w1118 hunger-driven feeding responses on normal food (NF) and high-sugar diet (HSD) related to Figure 1—figure supplement 1A.
- https://cdn.elifesciences.org/articles/80282/elife-80282-fig1-figsupp1-data1-v2.xlsx
Figure 1—figure supplement 2

Normal food (NF) and high-sugar diet (HSD) flies show similar rates of triacylglyceride (TAG) breakdown following a starvation challenge.
Average TAG/fly levels in NF (black line) and HSD (blue line) groups over time. N = 9/group. Two-way ANOVA with Sidak post-test correction. Asterisks indicate significant changes with p-value<0.05, p-value<0.005, and p-value<0.0005. Error bars = standard deviation.
-
Figure 1—figure supplement 2—source data 1
Triacylglyceride (TAG) levels of normal food (NF) and high-sugar diet (HSD)-fed w1118 flies over time at baseline.
- https://cdn.elifesciences.org/articles/80282/elife-80282-fig1-figsupp2-data1-v2.xlsx
Figure 2 with 2 supplements

Drosophila insulin-like peptide 5 (DILP5)/forkhead box O (FOXO) accumulation and lipid droplet morphology altered under high-sugar diet (HSD) exposure.
(A, left) Representative confocal images of Dilp5 accumulation in insulin-producing cells (IPCs) of normal food (NF) flies (top panel) and HSD-fed flies on day 14 (bottom panel). (A, right) Mean Dilp5 fluorescent intensity from z-stack summation projections of IPCs from NF and HSD-fed flies. N = each square represents a single fly. All data were collected from a single experiment. Unpaired t-test with Welch’s correction. (B) Representative confocal images of nuclear FOXO accumulation in the fat bodies of NF flies (top panel) and HSD-fed flies on day 14 (bottom panel). The nuclei are marked with anti-lamin (magenta). Arrowheads point to nuclei. (B, right) Mean nuclear FOXO fluorescent intensity from z-stack summation projections of fat bodies from NF and HSD-fed flies. N = each circle represents a nucleus. All data were collected from a single experiment. Two-sided Wilcoxon rank-sum test. Error bars = standard deviation. Asterisks indicate significant changes with p-value<0.05, p-value<0.005, and p-value<0.0005. (C) Representative confocal images of lipid droplets (magenta) across time in the fat bodies of NF and HSD-fed flies.
-
Figure 2—source data 1
Drosophila insulin-like peptide 5 (Dilp5) accumulation in insulin-producing cell (IPC) after 14 days on normal food (NF)/high-sugar diet (HSD).
- https://cdn.elifesciences.org/articles/80282/elife-80282-fig2-data1-v2.xlsx
-
Figure 2—source data 2
Forkhead box O (FOXO) accumulation in w1118 (14 days after diet treatment).
- https://cdn.elifesciences.org/articles/80282/elife-80282-fig2-data2-v2.xlsx
Figure 2—figure supplement 1
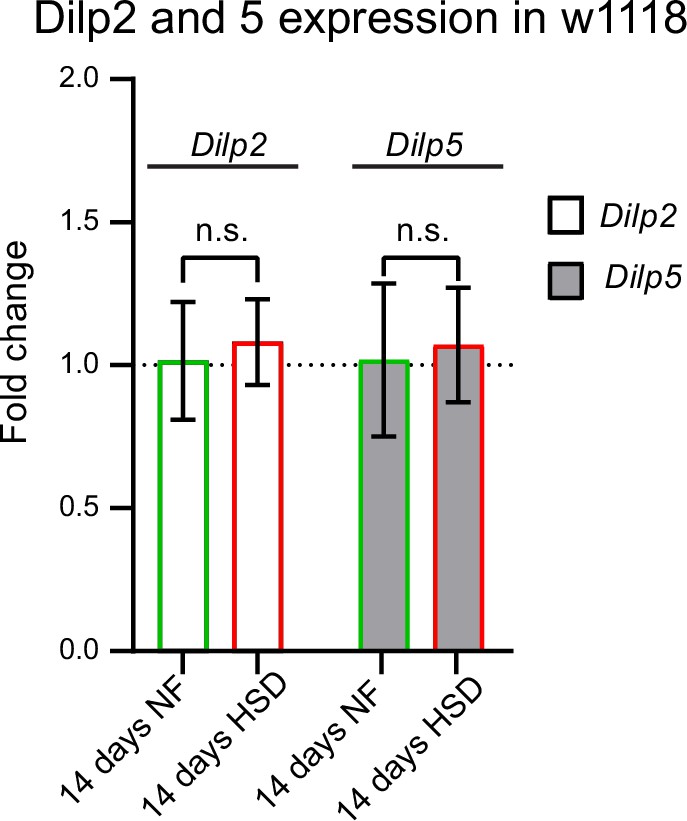
Chronic high-sugar diet (HSD) treatment does not affect Drosophila insulin-like peptides (Dilps) 2 and 5 transcript levels.
Mean fold change in Dilp 2 and Dilp 5 expression in w1118 flies fed either a normal food (NF) or an HSD for 14 days. N = 3 technical replicates of cDNA collected from 30 flies/treatment. t-test with Welch’s correction showed no significant difference.
-
Figure 2—figure supplement 1—source data 1
Drosophila insulin-like peptide (Dilp) 2 and 5 mRNA expression levels in w1118.
- https://cdn.elifesciences.org/articles/80282/elife-80282-fig2-figsupp1-data1-v2.zip
Figure 2—figure supplement 2
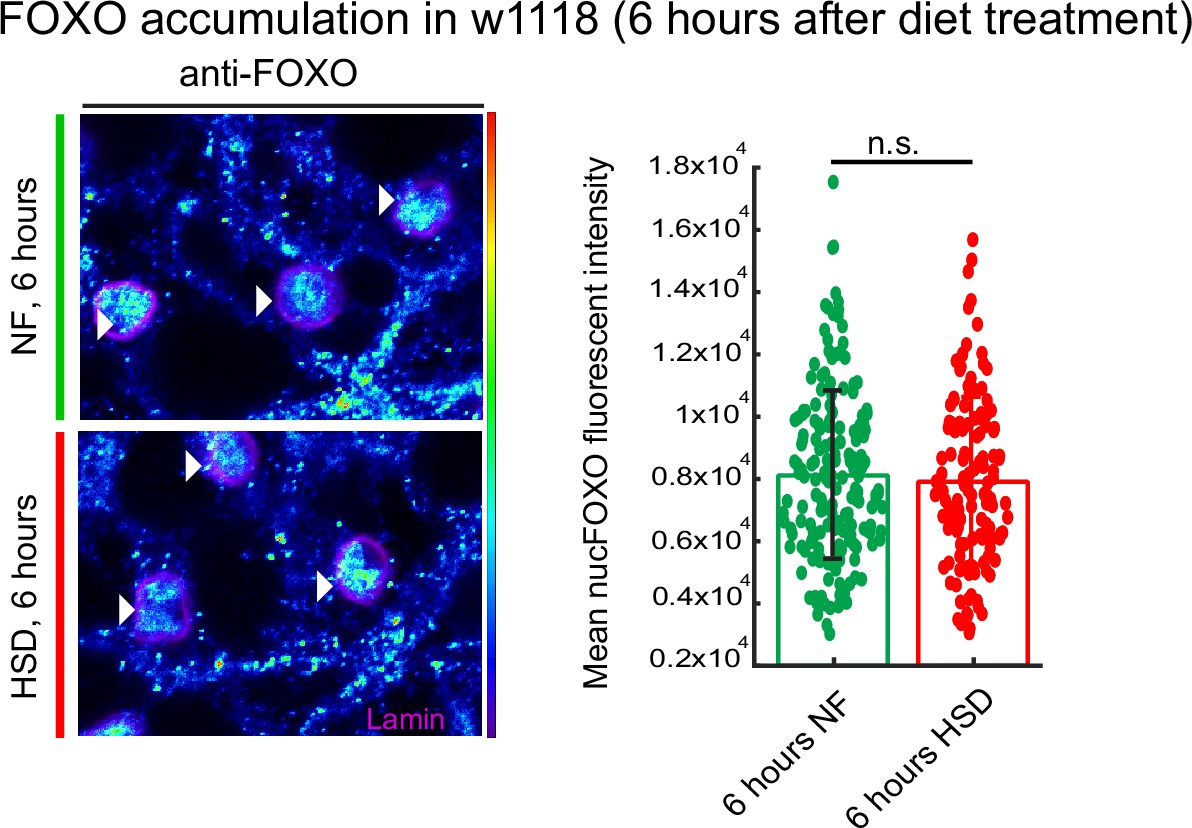
Acute high-sugar diet (HSD) exposure does not affect forkhead box O (FOXO) nuclear localization.
Representative confocal images of nuclear FOXO accumulation in the fat bodies of normal food (NF) (top panel) and HSD-fed flies for 6 hr (bottom panel). The nuclei are marked with anti-lamin (magenta). Arrowheads point to nuclei. (right) Mean nuclear FOXO fluorescent intensity from z-stack summation projections of fat bodies from NF and HSD-fed flies. N = each circle represents a nucleus. All data were collected from a single experiment. Two-sided Wilcoxon rank-sum test. Error bars = standard deviation.
-
Figure 2—figure supplement 2—source data 1
Forkhead box O (FOXO) accumulation in w1118 (6 hr after diet treatment).
- https://cdn.elifesciences.org/articles/80282/elife-80282-fig2-figsupp2-data1-v2.xlsx
Figure 3 with 1 supplement
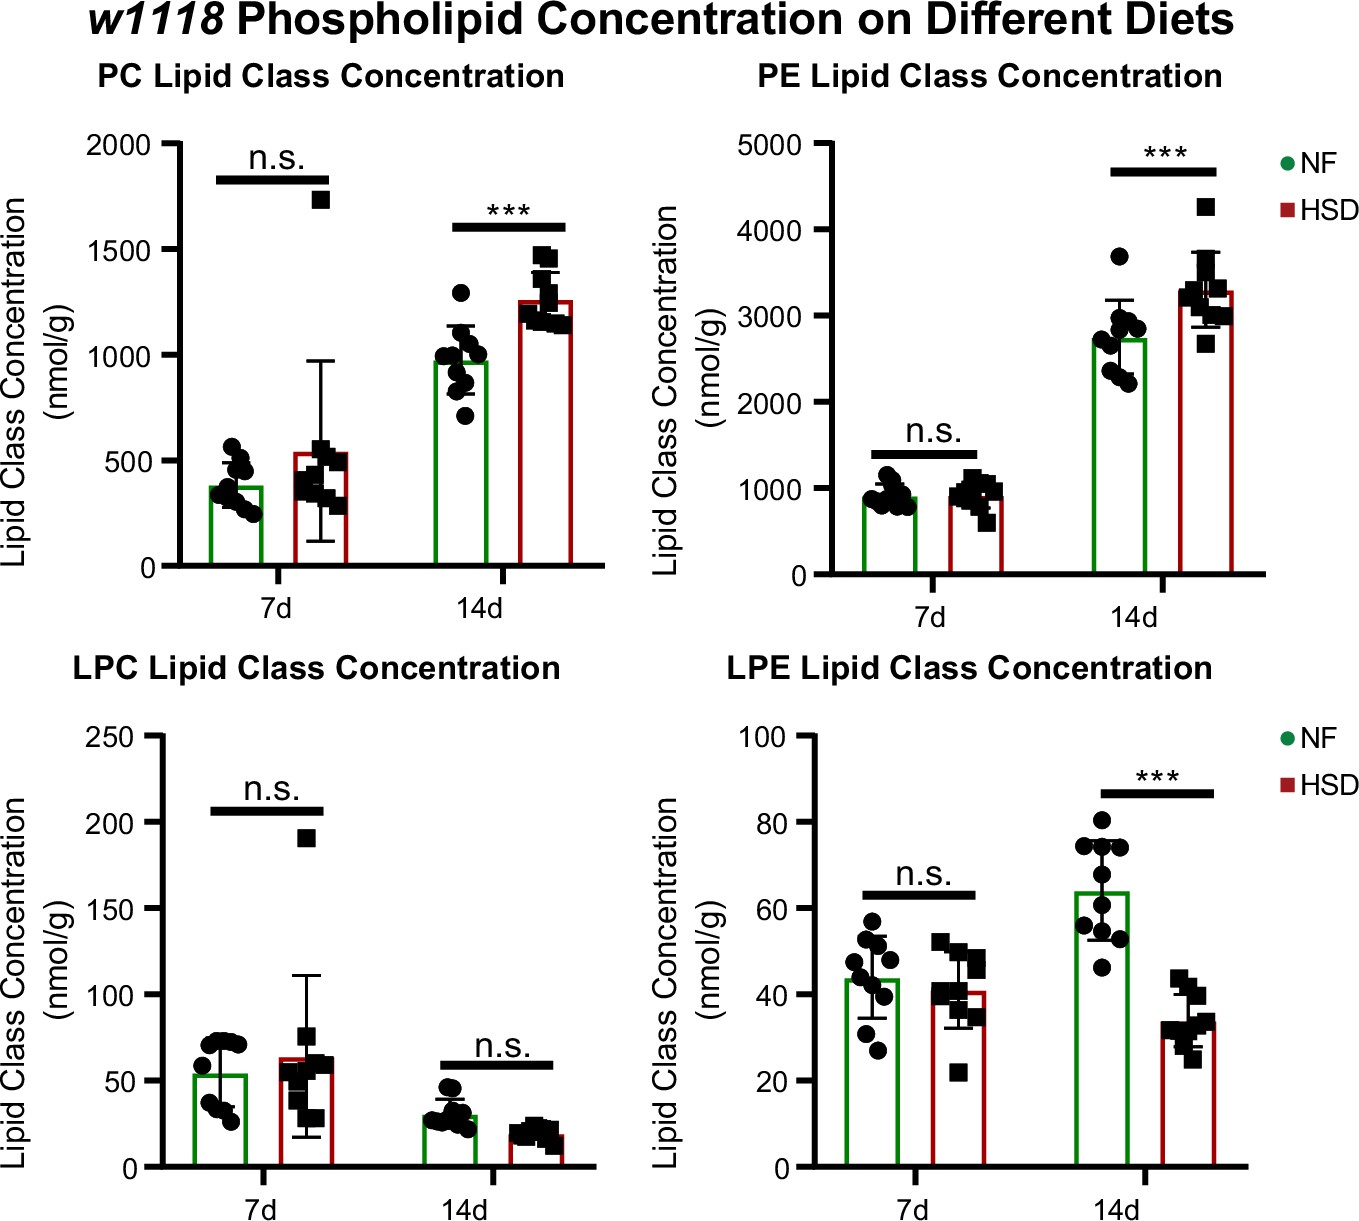
Phospholipids are elevated in whole fly during extended high-sugar diet (HSD) feeding.
Average concentrations of phosphatidylcholine (PC), phosphatidylethanolamine (PE), lysophosphatidylcholine (LPC), and lysophosphatidylethanolamine (LPE) in flies subjected to normal food (NF) (green) or an HSD (red) for 14 days. Lipidomics was performed using a targeted quantitative lipidyzer (Sciex 5500 Lipidyzer). Ten independent biological replicates were used for each diet and each day, with n = 10 flies composing one biological replicate. Two-way ANOVA and Sidak post-test correction. Asterisks indicate significant changes with p-value<0.05, p-value<0.005, and p-value<0.0005. Error bars = standard deviation.
-
Figure 3—source data 1
Lipidomics data for lipid classes of normal food (NF) and high-sugar diet (HSD)-fed flies on day 7 presented in Figure 3 and Figure 3—figure supplement 1.
- https://cdn.elifesciences.org/articles/80282/elife-80282-fig3-data1-v2.xlsx
-
Figure 3—source data 2
Lipidomics data for lipid classes of normal food (NF) and high-sugar diet (HSD)-fed flies on day 14 presented in Figure 3 and Figure 3—figure supplement 1.
- https://cdn.elifesciences.org/articles/80282/elife-80282-fig3-data2-v2.xlsx
Figure 3—figure supplement 1
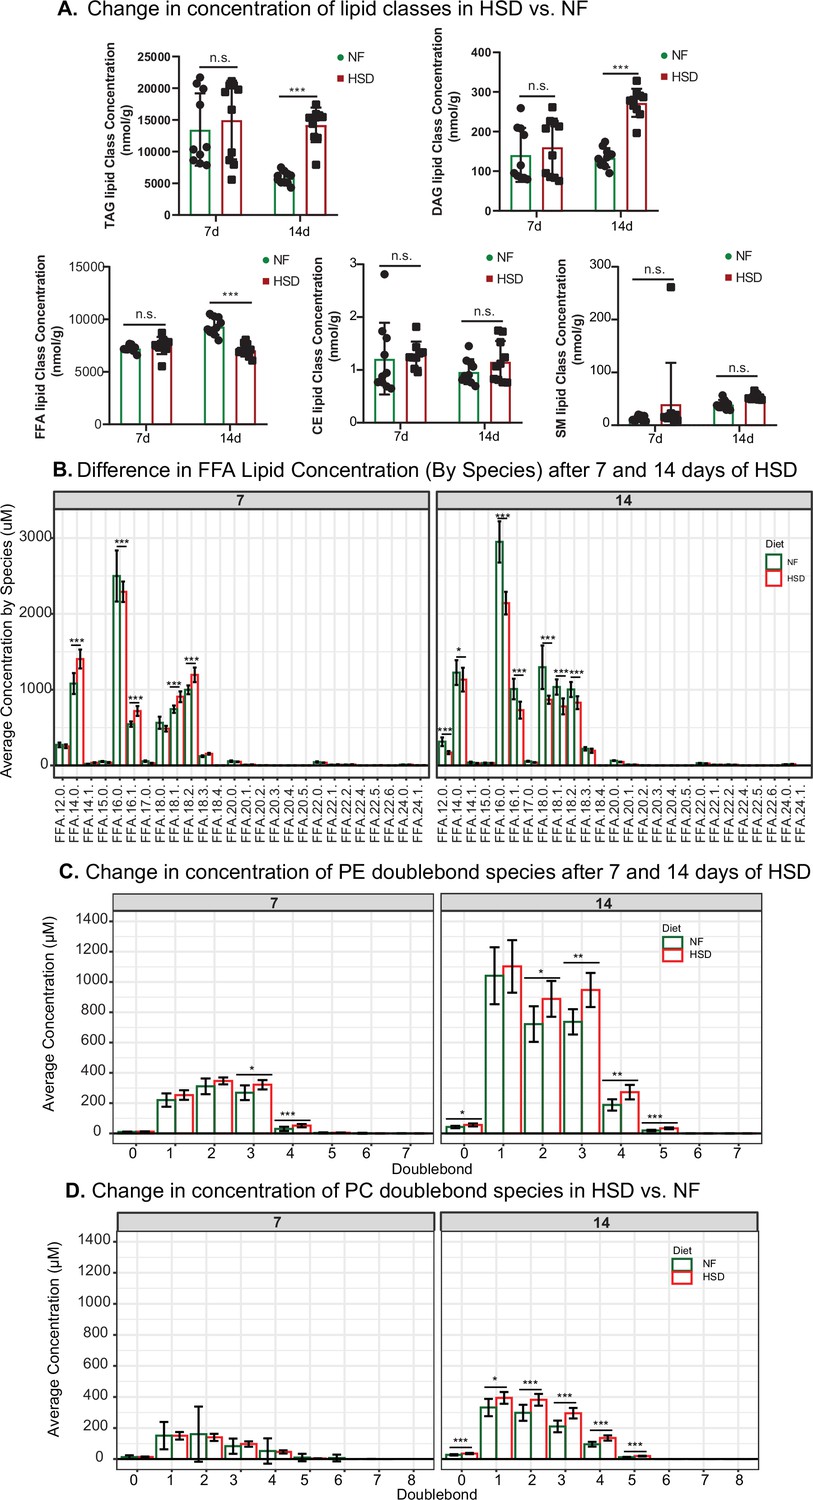
High-sugar diet (HSD) alters the lipidome and increases the concentration of phosphatidylethanolamine (PE) and phosphatidylcholine (PC) double bond species.
(A) Changes in triacylglyceride (TAG), diacylglyceride (DAG), free fatty acid (FFA), Cholesterol Ester (CE), and Sphingomyelin (SM) concentration after 7 and 14 days of normal food (NF) and HSD treatment. (B) Average concentration of double bonds for PE (C) and PC (D) at 7 and 14 days of NF or HSD treatment. Two-way ANOVA with Holm–Sidak correction. Asterisks indicate significant changes with p-value<0.05, p-value <0.005, and p-value<0.0005. Error bars = standard deviation.
Figure 4 with 1 supplement
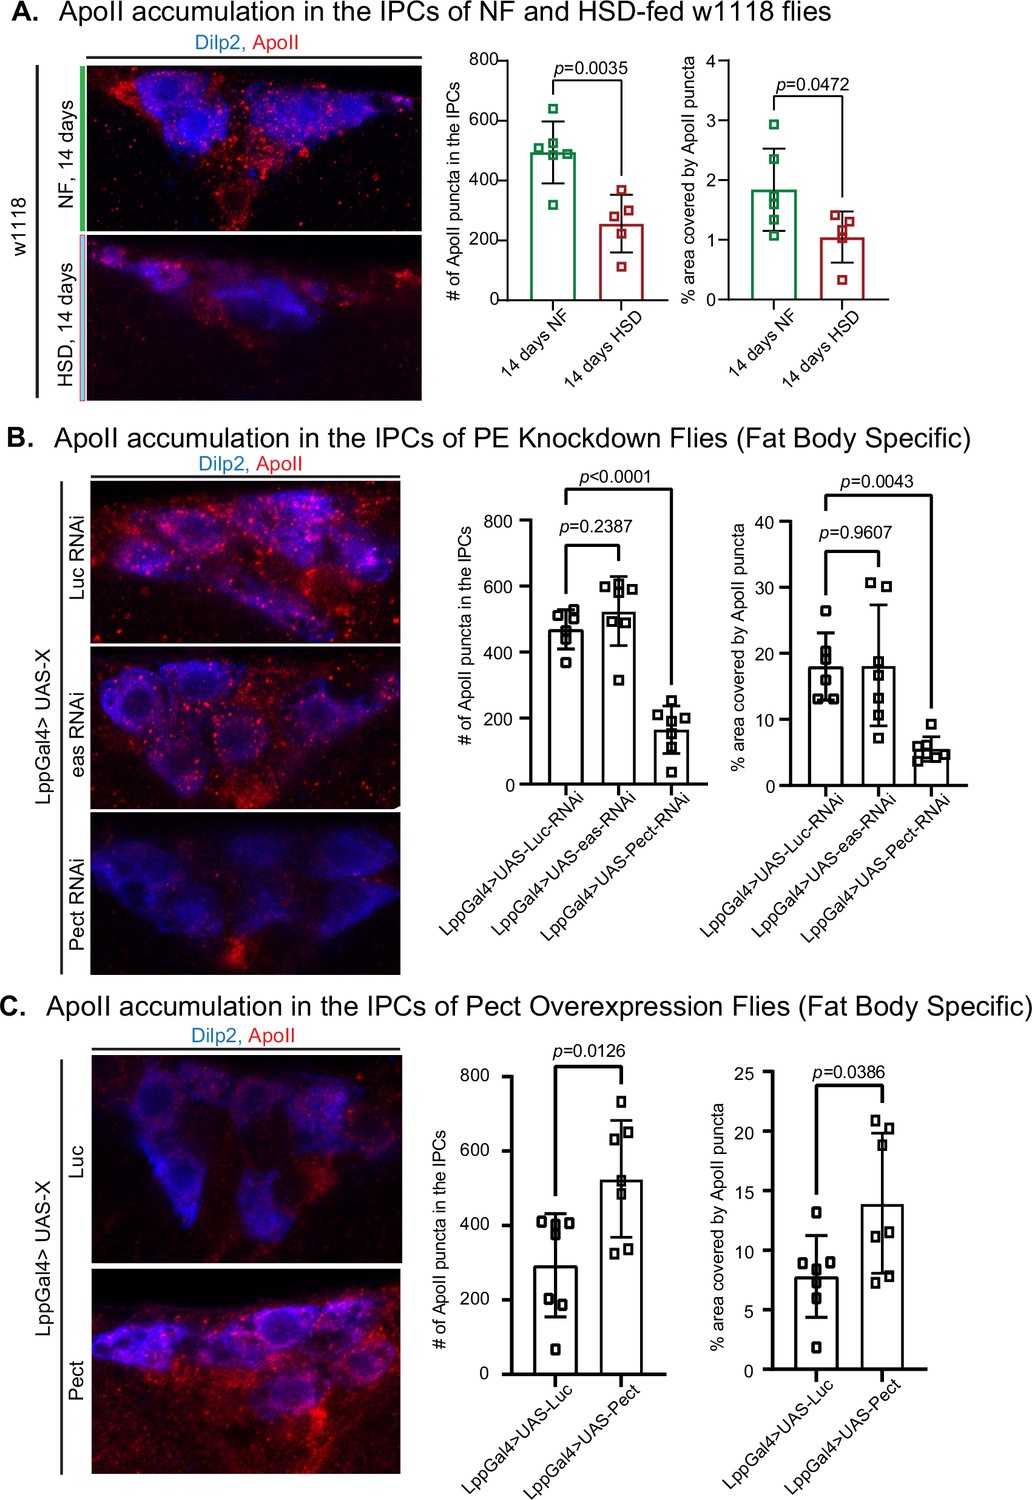
High-sugar diet (HSD) and knockdown of Pect lead to decreased ApoII levels in the brain.
(A–C, left) Representative confocal images of ApoII (red) levels in the insulin-producing cells (IPCs) (blue) of (A) normal food (NF) and HSD-fed flies on day 14, (B) flies with a fat-specific knockdown of Luc, eas, and Pect, and (C) flies with a fat-specific overexpression of Luc and Pect. (A–C, right) Mean number of ApoII puncta and % area covered by ApoII puncta in the IPCs of (A) NF and HSD-fed flies on day 14, (B) flies with a fat-specific knockdown of Luc, eas, and Pect, and (C) flies with fat-specific overexpression of Luc and Pect. N = each square represents a single fly. All data were collected from a single experiment. Unpaired t-test with Welch’s correction. Asterisks indicate significant changes with p-value<0.05, p-value<0.005, and p-value<0.0005. Error bars = standard deviation.
-
Figure 4—source data 1
ApoII accumulation in the insulin-producing cells (IPCs) of normal food (NF) and high-sugar diet (HSD)-fed w1118 flies.
- https://cdn.elifesciences.org/articles/80282/elife-80282-fig4-data1-v2.xlsx
-
Figure 4—source data 2
ApoII accumulation in the insulin-producing cells (IPCs) of phosphatidylethanolamine (PE) knockdown flies.
- https://cdn.elifesciences.org/articles/80282/elife-80282-fig4-data2-v2.xlsx
-
Figure 4—source data 3
ApoII accumulation in the insulin-producing cells (IPCs) of Pect overexpression flies.
- https://cdn.elifesciences.org/articles/80282/elife-80282-fig4-data3-v2.xlsx
Figure 4—figure supplement 1
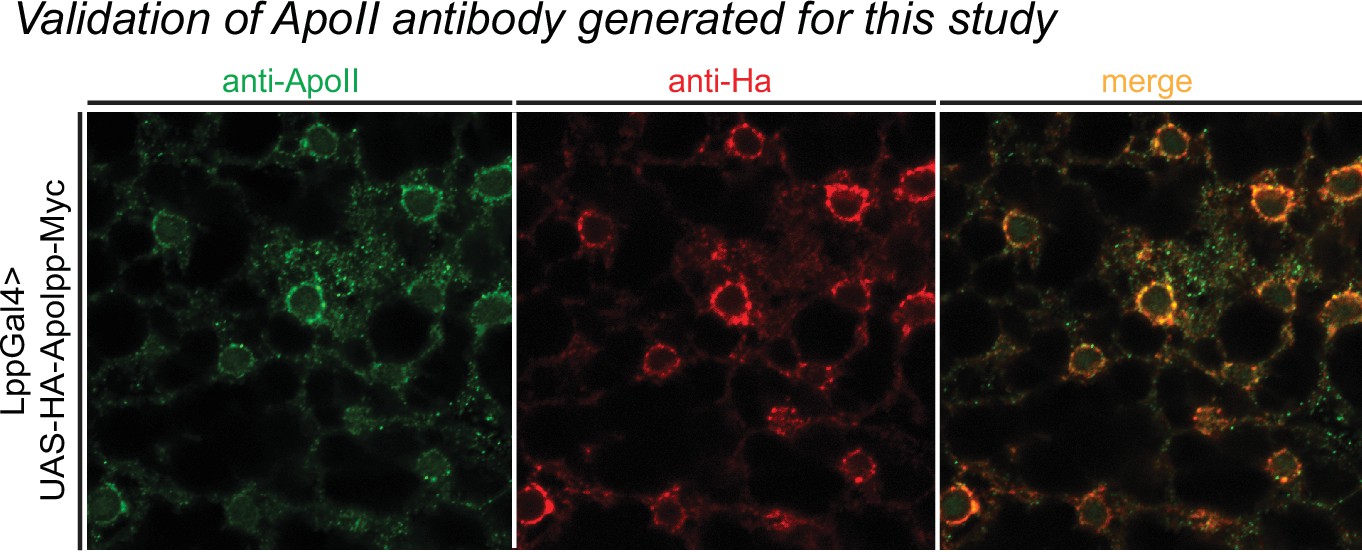
Validation of ApoII antibody.
Representative confocal images of LppGal4>UAS-HA-Apolpp-myc fly fat body stained for ApoII antibody (green), HA antibody (red), and a merge of the two images. Note colocalization of HA and ApoII.
Figure 5
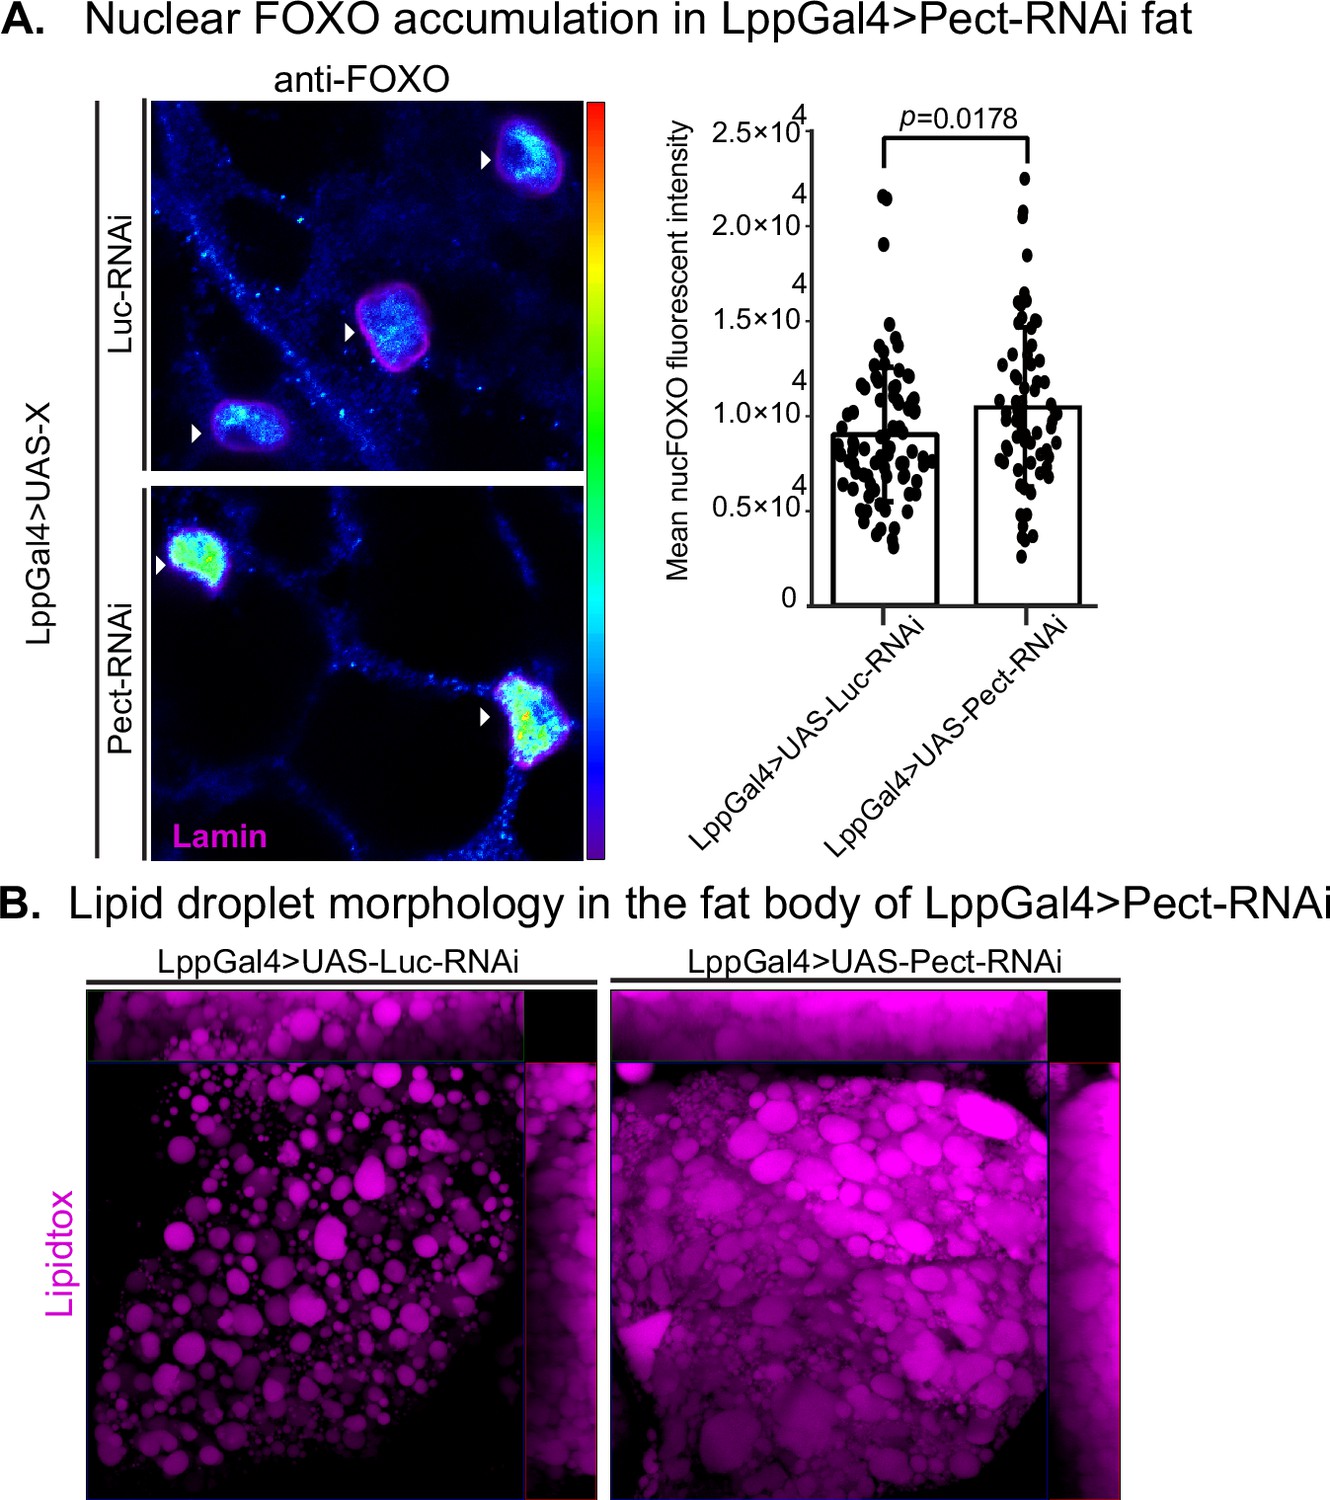
Pect knockdown in fly fat alters forkhead box O (FOXO) nuclear accumulation and lipid droplet morphology.
(A, left) Representative confocal images of Lpp-Gal4>UAS-Luc-RNAi and Lpp-Gal4>UAS-Pect-RNAi fly fat immunostained with anti-FOXO antibody (blue to green, intensity-based) and lamin (pink) on day 14. Arrowhead points to the nucleus. (A, right) Mean nuclear FOXO fluorescent intensity of fat bodies from control (LppGal4>UAS-Luc-RNAi) and fat-specific Pect knockdown flies (LppGal4>UAS-Pect-RNAi). N = each circle represents a nucleus. All data were collected from a single experiment. Two-sided Wilcoxon rank-sum test. Error bars = standard deviation. Asterisks indicate significant changes with p-value<0.05, p-value<0.005, and p-value<0.0005. Error bars = standard deviation. (B) Representative confocal images of lipid droplets (magenta) in the fat bodies of control (LppGal4>UAS-Luc-RNAi) and fat-specific Pect knockdown flies (LppGal4>UAS-Pect-RNAi). Note that lipid droplet morphology in the fat-specific Pect knockdown flies resembles that of wild-type flies on high-sugar diet (HSD).
-
Figure 5—source data 1
Nuclear forkhead box O (FOXO) accumulation in LppGal4>Pect-RNAi fat.
- https://cdn.elifesciences.org/articles/80282/elife-80282-fig5-data1-v2.xlsx
Figure 6 with 4 supplements
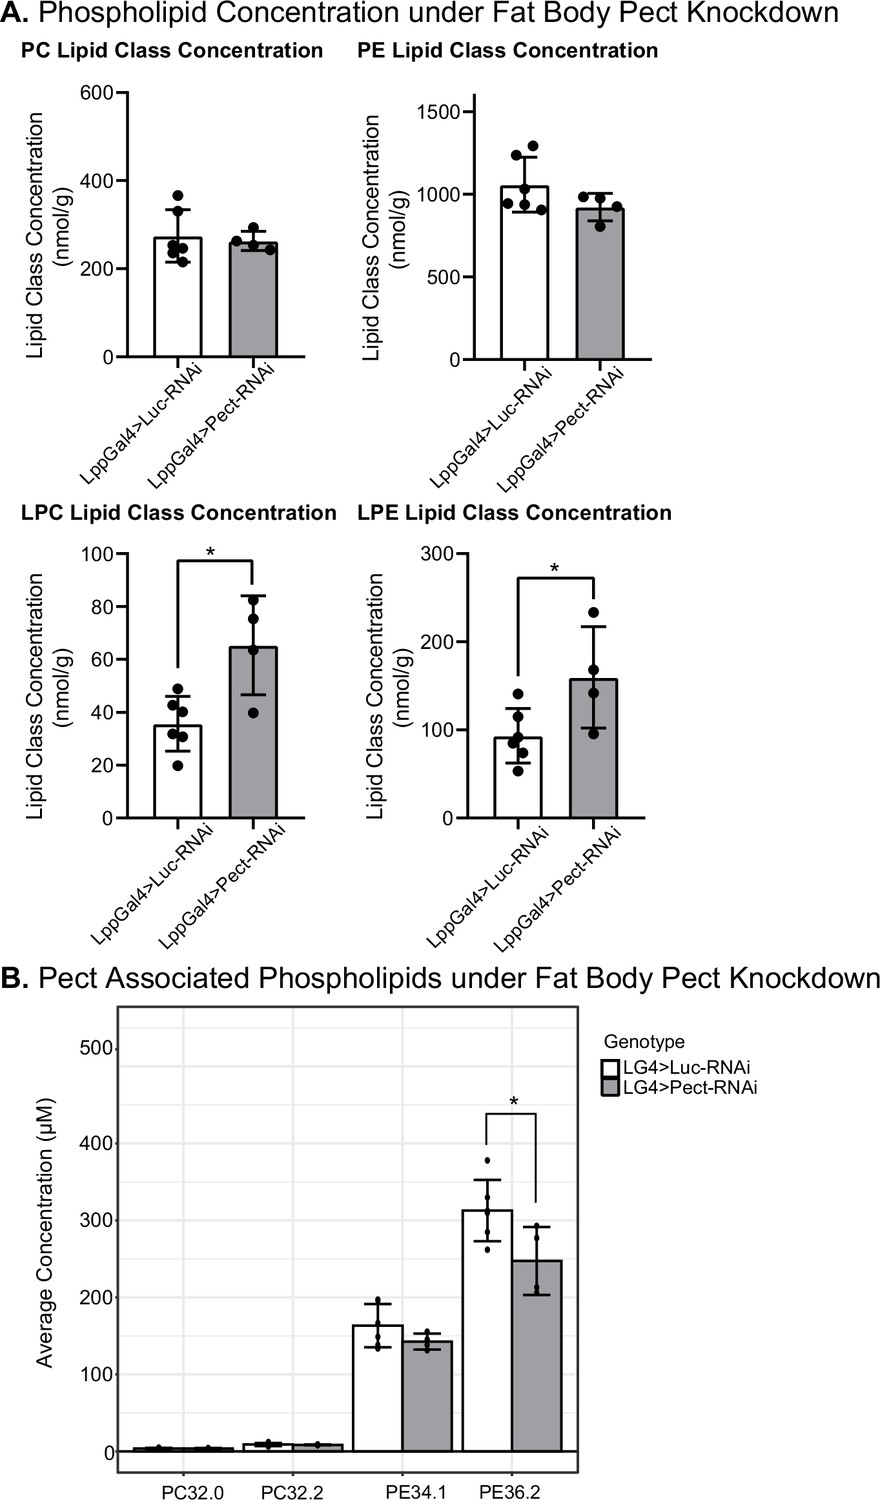
Manipulating Pect levels in the fat body alters phospholipid profile.
(A) Average concentrations of phosphatidylcholine (PC), phosphatidylethanolamine (PE), lysophosphatidylcholine (LPC), and lysophosphatidylethanolamine (LPE) lipid classes in LppGal4>UAS-Pect-RNAi flies compared to control under 7-day normal food (NF) conditions. (B) Depicts the concentration of Pect-associated phospoholipids in LppGal4>UAS-Pect-RNAi flies compared to control. Lipidomics was performed using a targeted quantitative lipidyzer (Sciex 5500 Lipidyzer). 4–6 independent biological replicates were used for each genotype, with n = 10 flies composing one biological replicate. Unpaired t-test with Welch’s correction. Asterisks indicate significant changes with p-value<0.05, p-value<0.005, and p-value<0.0005. Error bars = standard deviation, points = individual replicate values.
-
Figure 6—source data 1
Lipidomics for fat-specific Pect knockdown and Pect overexpression on normal food.
Relevant to Figure 6, Figure 6—figure supplements 2–4.
- https://cdn.elifesciences.org/articles/80282/elife-80282-fig6-data1-v2.xlsx
Figure 6—figure supplement 1

Pect mRNA expression.
(A) Mean fold change in Pect mRNA levels in the fat-specific (left) Pect knockdown flies and (right) Pect overexpression flies. Unpaired t-test with Welch’s correction. (B) Mean fold change in Pect mRNA levels of normal food (NF)-fed and high-sugar diet (HSD)-fed flies overtime. Two-way ANOVA with Holm–Sidak correction. N = 3 technical replicates/group of cDNA collected from an N = 30 flies/group. Asterisks indicate significant changes with p-value<0.05, p-value<0.005, and p-value<0.0005. Error bars = standard deviation.
-
Figure 6—figure supplement 1—source data 1
Pect expression in RNAi and OE lines related to Figure 6—figure supplement 1A.
- https://cdn.elifesciences.org/articles/80282/elife-80282-fig6-figsupp1-data1-v2.xlsx
-
Figure 6—figure supplement 1—source data 2
Pect expression in RNAi and OE lines related to Figure 6—figure supplement 1B.
Pect expression in w1118 at different normal food (NF) and high-sugar diet (HSD) timepoints related to Figure 6—figure supplement 1B.
- https://cdn.elifesciences.org/articles/80282/elife-80282-fig6-figsupp1-data2-v2.xlsx
Figure 6—figure supplement 2

Fourteen days of high-sugar diet (HSD) cause an increase in Pect-associated phospholipid classes.
Percent lipid composition for all (A) phosphatidylcholine (PC) and (B) phosphatidylethanolamine (PE) classes in normal food (NF)-fed flies overtime. Note that the overall composition does not change with age. The lipid composition was averaged amongst 10 biological replicates (n = 10 flies/replicate). Error bars indicate standard deviation. (C) Average concentration of PC and PE classes that are associated with Pect based on van Dam et al., 2020. Bars plot average concentration amongst 10 biological replicates (n = 10 flies/replicate). Two-way ANOVA with Holm–Sidak correction. Asterisks indicate significant changes with p-value<0.05, p-value<0.005, and p-value<0.0005. Error bars indicate standard deviation.
Figure 6—figure supplement 3
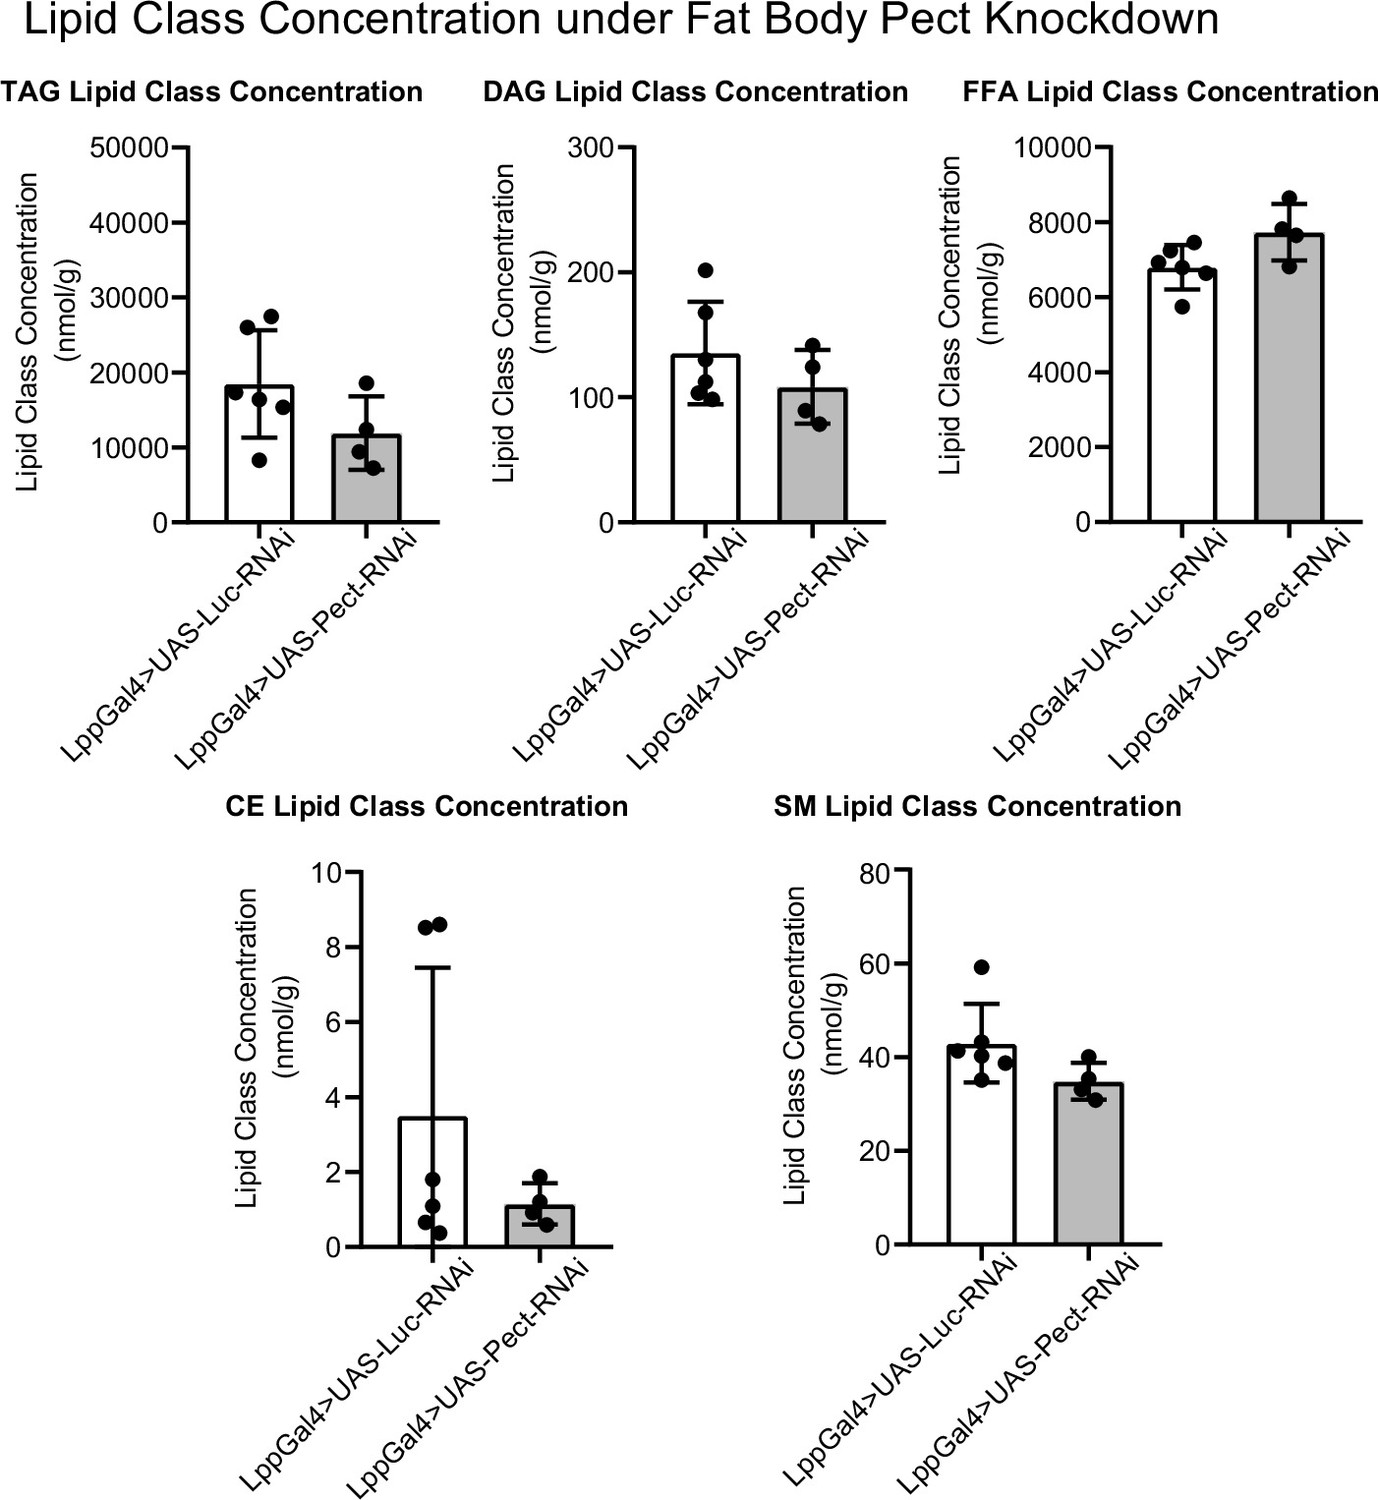
Additional lipid class responses to fat body Pect knockdown.
Average concentrations of triacylglyceride (TAG), CE, diacyl glyceride (DAG), SM, and free fatty acid (FFA) lipid classes in LppGal4>UAS-Pect-RNAi flies compared to control under 7-day normal food (NF) conditions. Lipidomics was performed using a targeted quantitative lipidyzer (Sciex 5500 Lipidyzer). 4–6 independent biological replicates were used for each genotype, with n = 10 flies composing one biological replicate. Unpaired t-test with Welch’s correction. Asterisks indicate significant changes with p-value<0.05, p-value<0.005, and p-value<0.0005. Error bars = standard deviation.
Figure 6—figure supplement 4
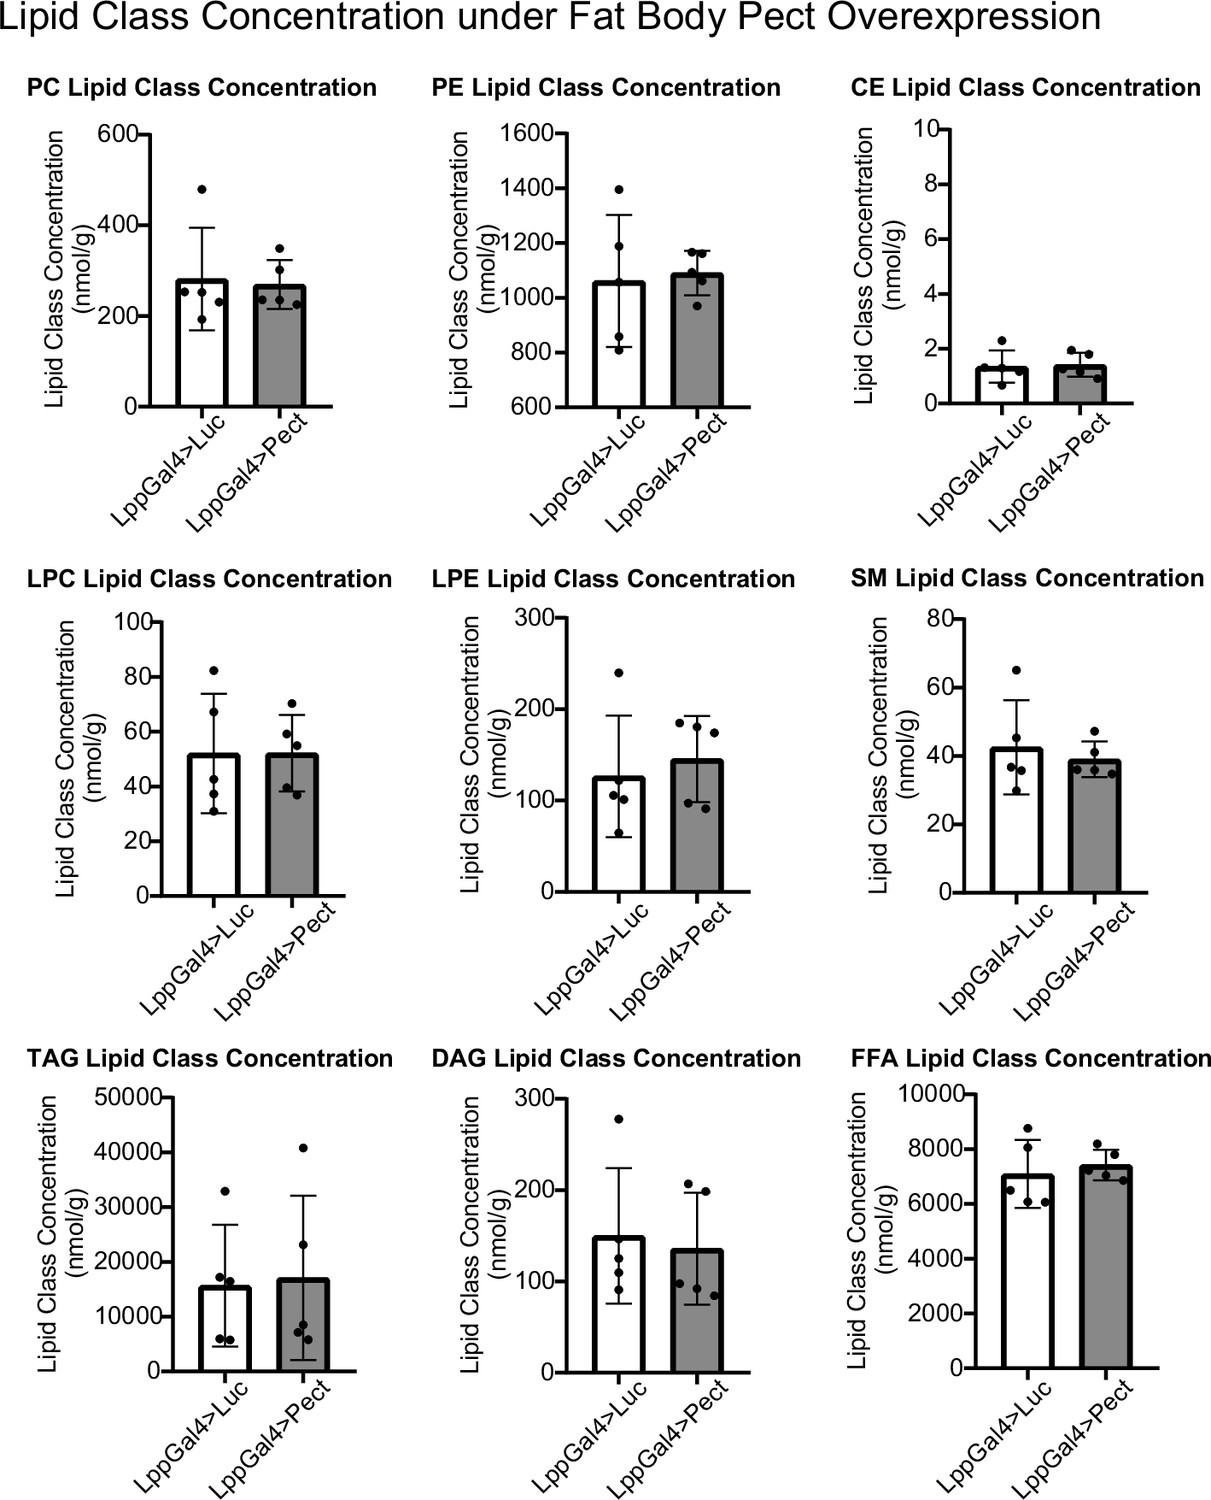
Lipidomic profile of fat body Pect overexpression flies.
Average concentrations of phosphatidylcholine (PC), phosphatidylethanolamine (PE), CE, lysophosphatidylcholine (LPC), lysophosphatidylethanolamine (LPE), SM, triacylglyceride (TAG), diacylglyceride (DAG), and free fatty acid (FFA) lipid classes in LppGal4>UAS-Pect flies compared to control under 7-day normal food (NF) conditions. Lipidomics was performed using a targeted quantitative lipidyzer (Sciex 5500 Lipidyzer). 4–6 independent biological replicates were used for each genotype, with n = 10 flies composing one biological replicate. Unpaired t-test with Welch’s correction. Asterisks indicate significant changes with p-value<0.05, p-value<0.005, and p-value<0.0005. Error bars = standard deviation.
Figure 7
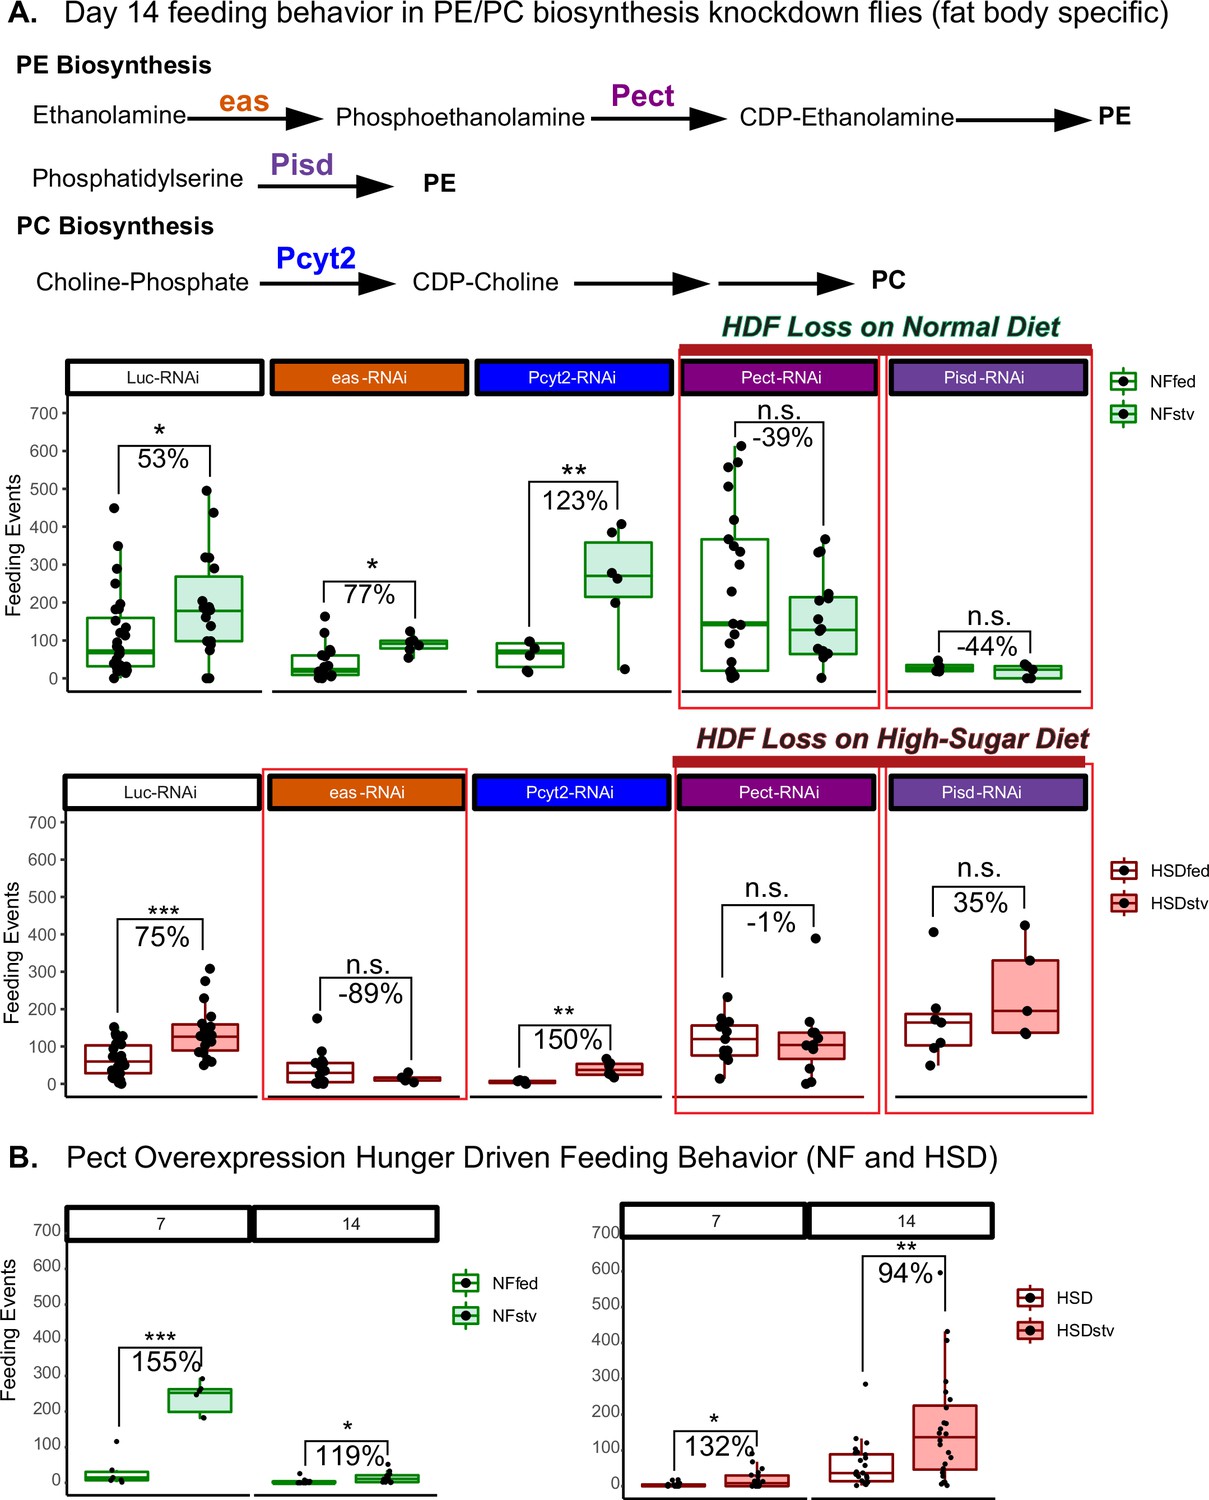
Manipulating Pect levels in the fat body alters hunger-driven feeding behavior.
(A) A simplified schematic of the phosphatidylethanolamine (PE) and phosphatidylcholine (PC) biosynthesis pathway. eas and Pect are enzymes in the PE biosynthesis pathway, whereas PCYT2 is an enzyme in the PC biosynthesis pathway. (A, top) Average fly feeding events over time for normal food (NF) flies that were either fed or starved using a 1% sucrose agar diet (stv) for 16 hr prior to measurement. (A, bottom) Average feeding events over time for high-sugar diet (HSD)-fed flies that were either fed or starved for 16 hr prior to measurement using a 1% sucrose agar diet (stv). (B) Average feeding events of fed and starved Lpp-Gal4>Pect-overexpression on NF (left) and HSD (right) at 7 and 14 days of diet treatment. Each dot denotes an individual fly. Asterisks indicate significant changes with p-value<0.05, p-value<0.005, and p-value<0.0005. Error bars = standard deviation. For (A) and (B), each dot denotes an individual fly. Two-way ANOVA with Sidak post-test correction.
-
Figure 7—source data 1
Day 14 feeding behavior in phosphatidylethanolamine (PE)/phosphatidylcholine (PC) biosynthesis enzymes fat-specific knockdown flies relevant to Figure 7A.
- https://cdn.elifesciences.org/articles/80282/elife-80282-fig7-data1-v2.xlsx
-
Figure 7—source data 2
Pect fat-specific overexpression of hunger-driven feeding behavior (normal food [NF] and high-sugar diet [HSD]) relevant to Figure 7B.
- https://cdn.elifesciences.org/articles/80282/elife-80282-fig7-data2-v2.xlsx
Figure 8
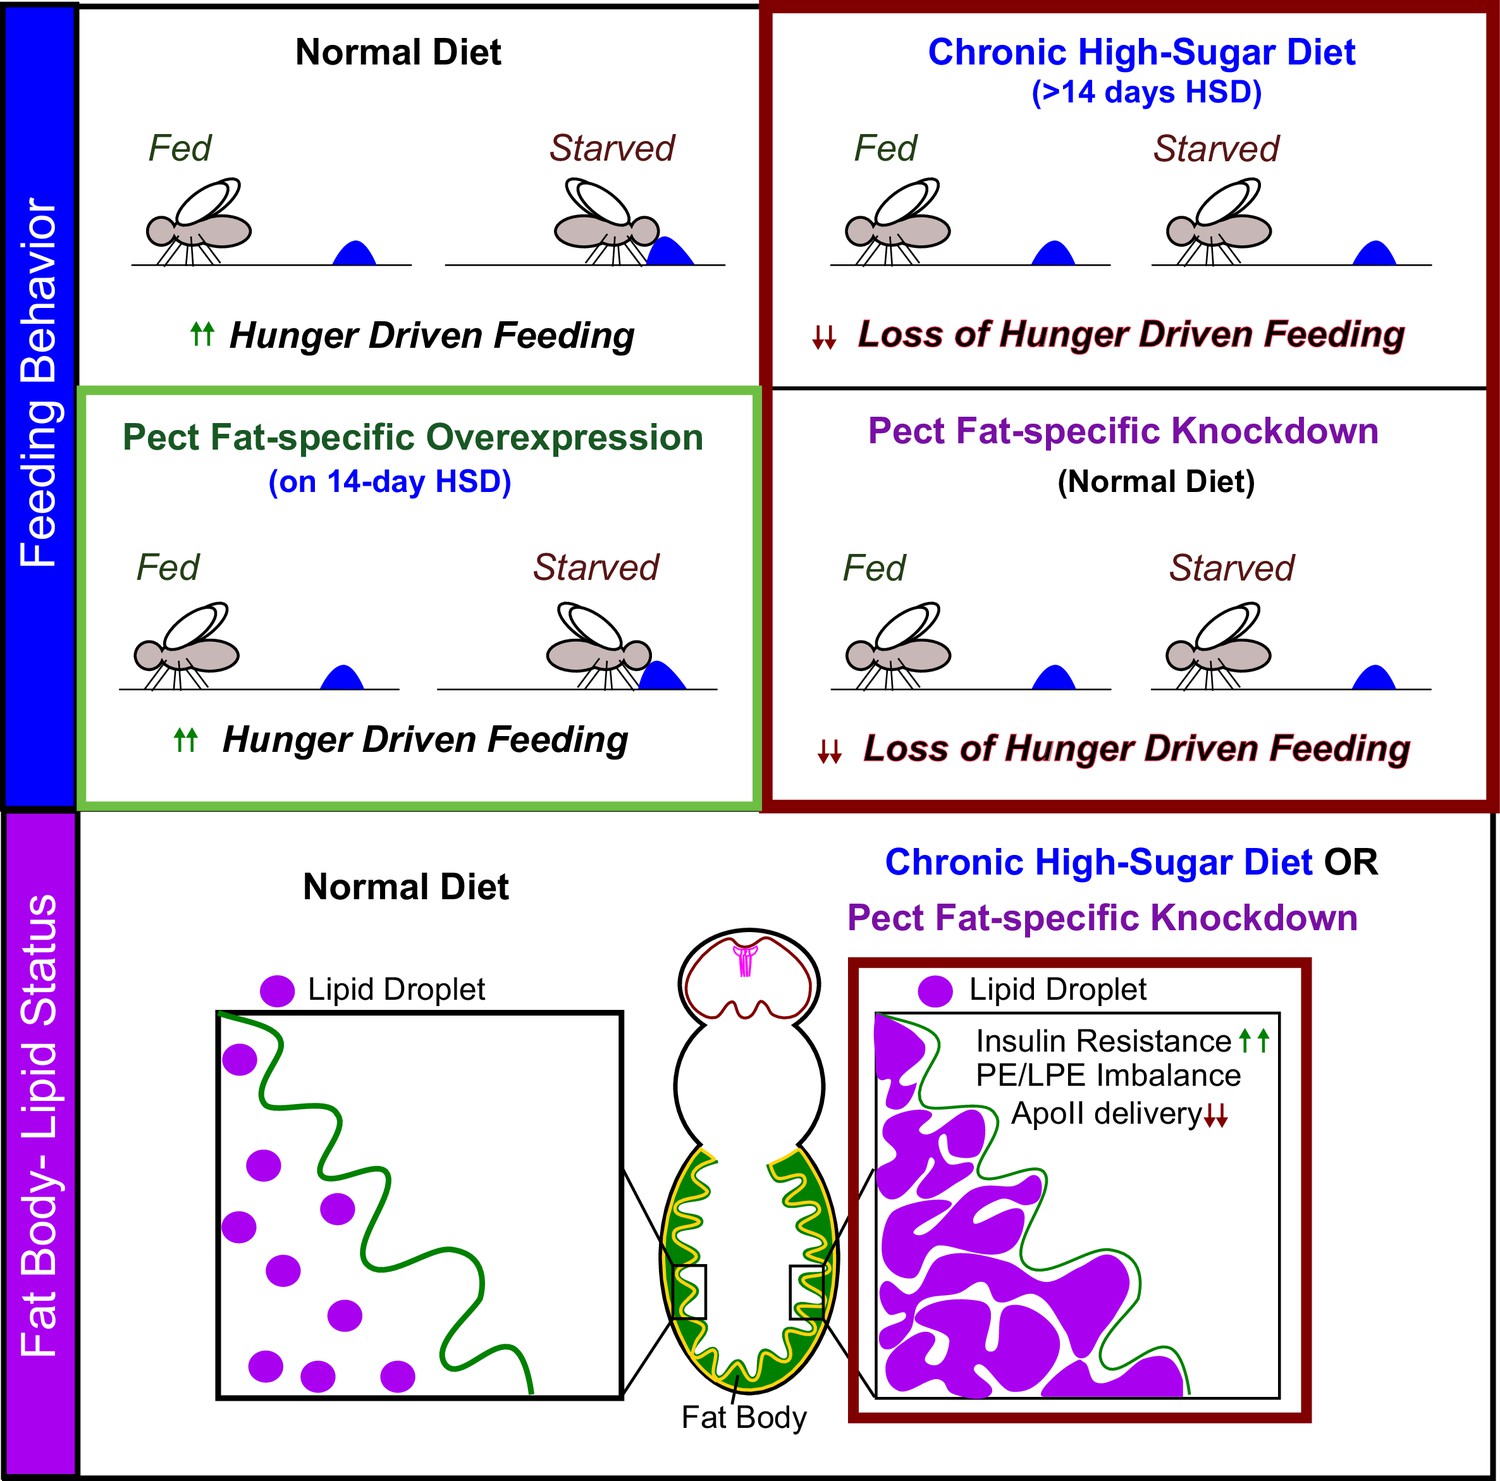
Pect function in adult fly adipocytes regulates hunger response.
We identify that fat-specific knockdown of the rate-limiting phosphatidylethanolamine (PE) synthesis enzyme, Pect, even on normal diet, phenocopies the metabolic effects of subjecting flies to chronic (>14 days) high-sugar diet. We show that Pect function, in the adult fly adipocytes, is required for appropriate hunger response (top panel), insulin signaling, and fat to brain lipoprotein delivery (lower panel). We find that fat body-specific Pect overexpression can prolong appropriate hunger response on high-sugar diets (green box, upper panel).
Author response image 1
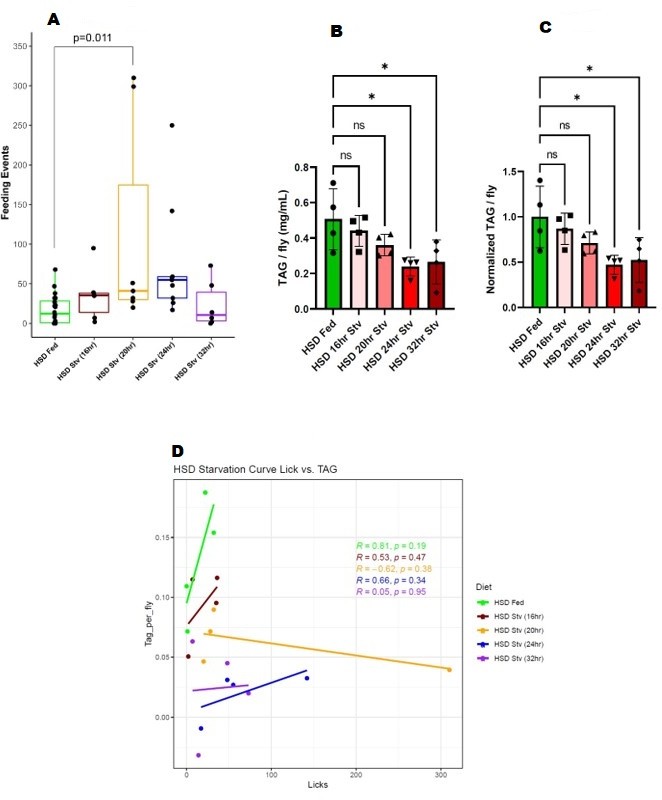
(A) Feeding events of 14-day HSD-fed flies at various starvation times. (B) TAG stores of 14-day HSD-fed flies at various starvation times. (C) Normalized TAG of 14-day HSD-fed flies at various starvation times. (D) Regression analysis of feeding events and TAG.
Author response image 2
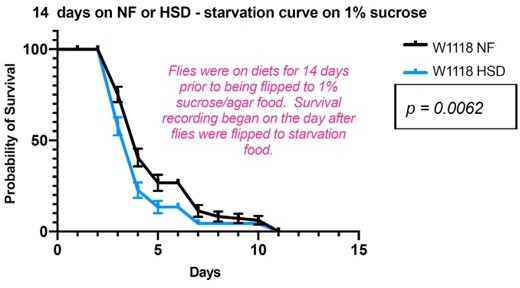
Starvation survival on 1% sucrose agar of 14-day NF vs. HSD fed flies.
Author response image 3
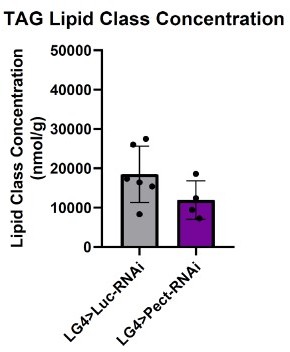
PECT-KD in fat tissue on normal diets does not alter TAG stores.
Additional files
Download links
A two-part list of links to download the article, or parts of the article, in various formats.
Downloads (link to download the article as PDF)
Open citations (links to open the citations from this article in various online reference manager services)
Cite this article (links to download the citations from this article in formats compatible with various reference manager tools)
Fat body phospholipid state dictates hunger-driven feeding behavior
eLife 11:e80282.
https://doi.org/10.7554/eLife.80282


