Interplay between VSD, pore, and membrane lipids in electromechanical coupling in HCN channels
- Department of Applied Physics of Science for Life Laboratory, KTH Royal Institute of Technology, Sweden
- Center for Investigation of Membrane Excitability Diseases, Department of Anesthesiology, Washington University School of Medicine, United States
Figures
Figure 1 with 1 supplement
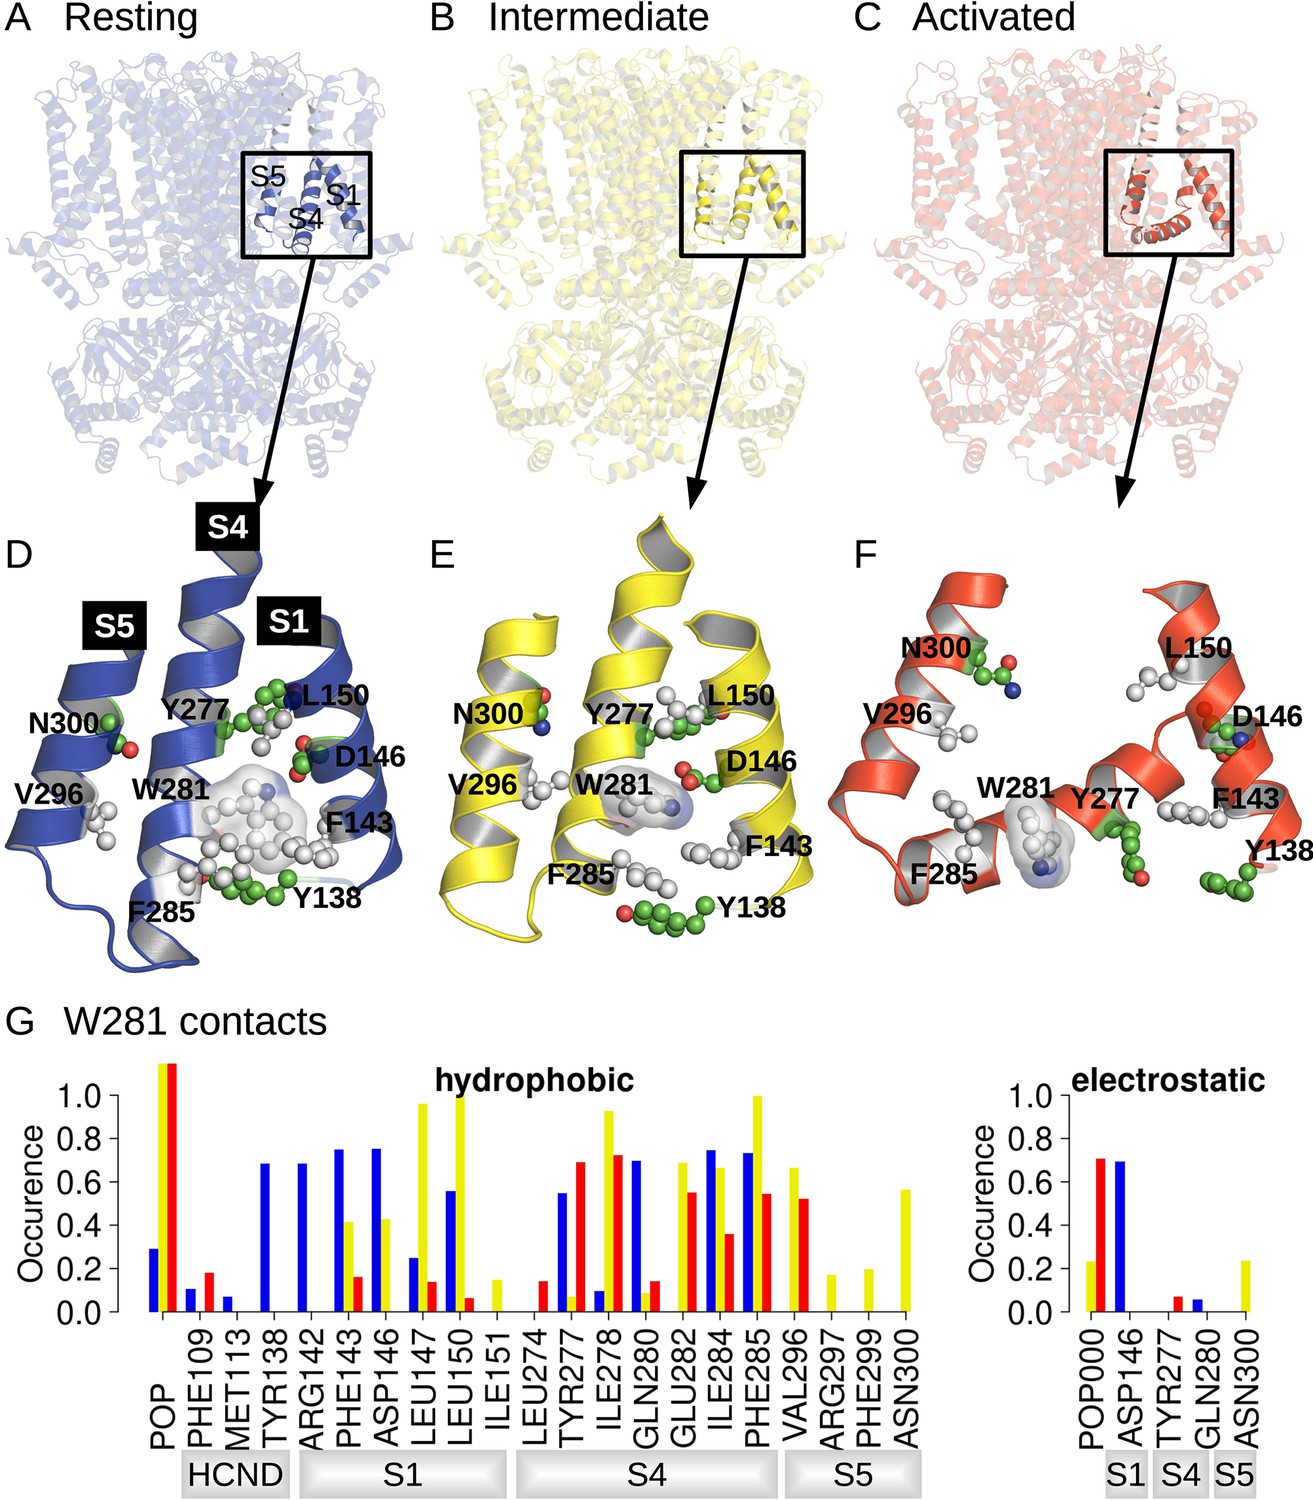
Position and contact network of W281.
The three cryoEM structures of the resting (A; PDB ID 5U6P), intermediate (B; PDB ID 6UQG), and activated (C; PDB ID 6UQF) states of hHCN1, shown in blue, yellow, and red, respectively, were investigated by equilibrium molecular dynamics (MD) simulations. The position of W281 is highlighted in ball/stick, and transparent surface and surrounding residues are shown in ball and stick in the resting (D), intermediate (E), and activated (F) conformations. (G) Contact occurrence between W281 and nearby residues and lipid molecules along 1-μs-long MD simulations.
Figure 1—figure supplement 1
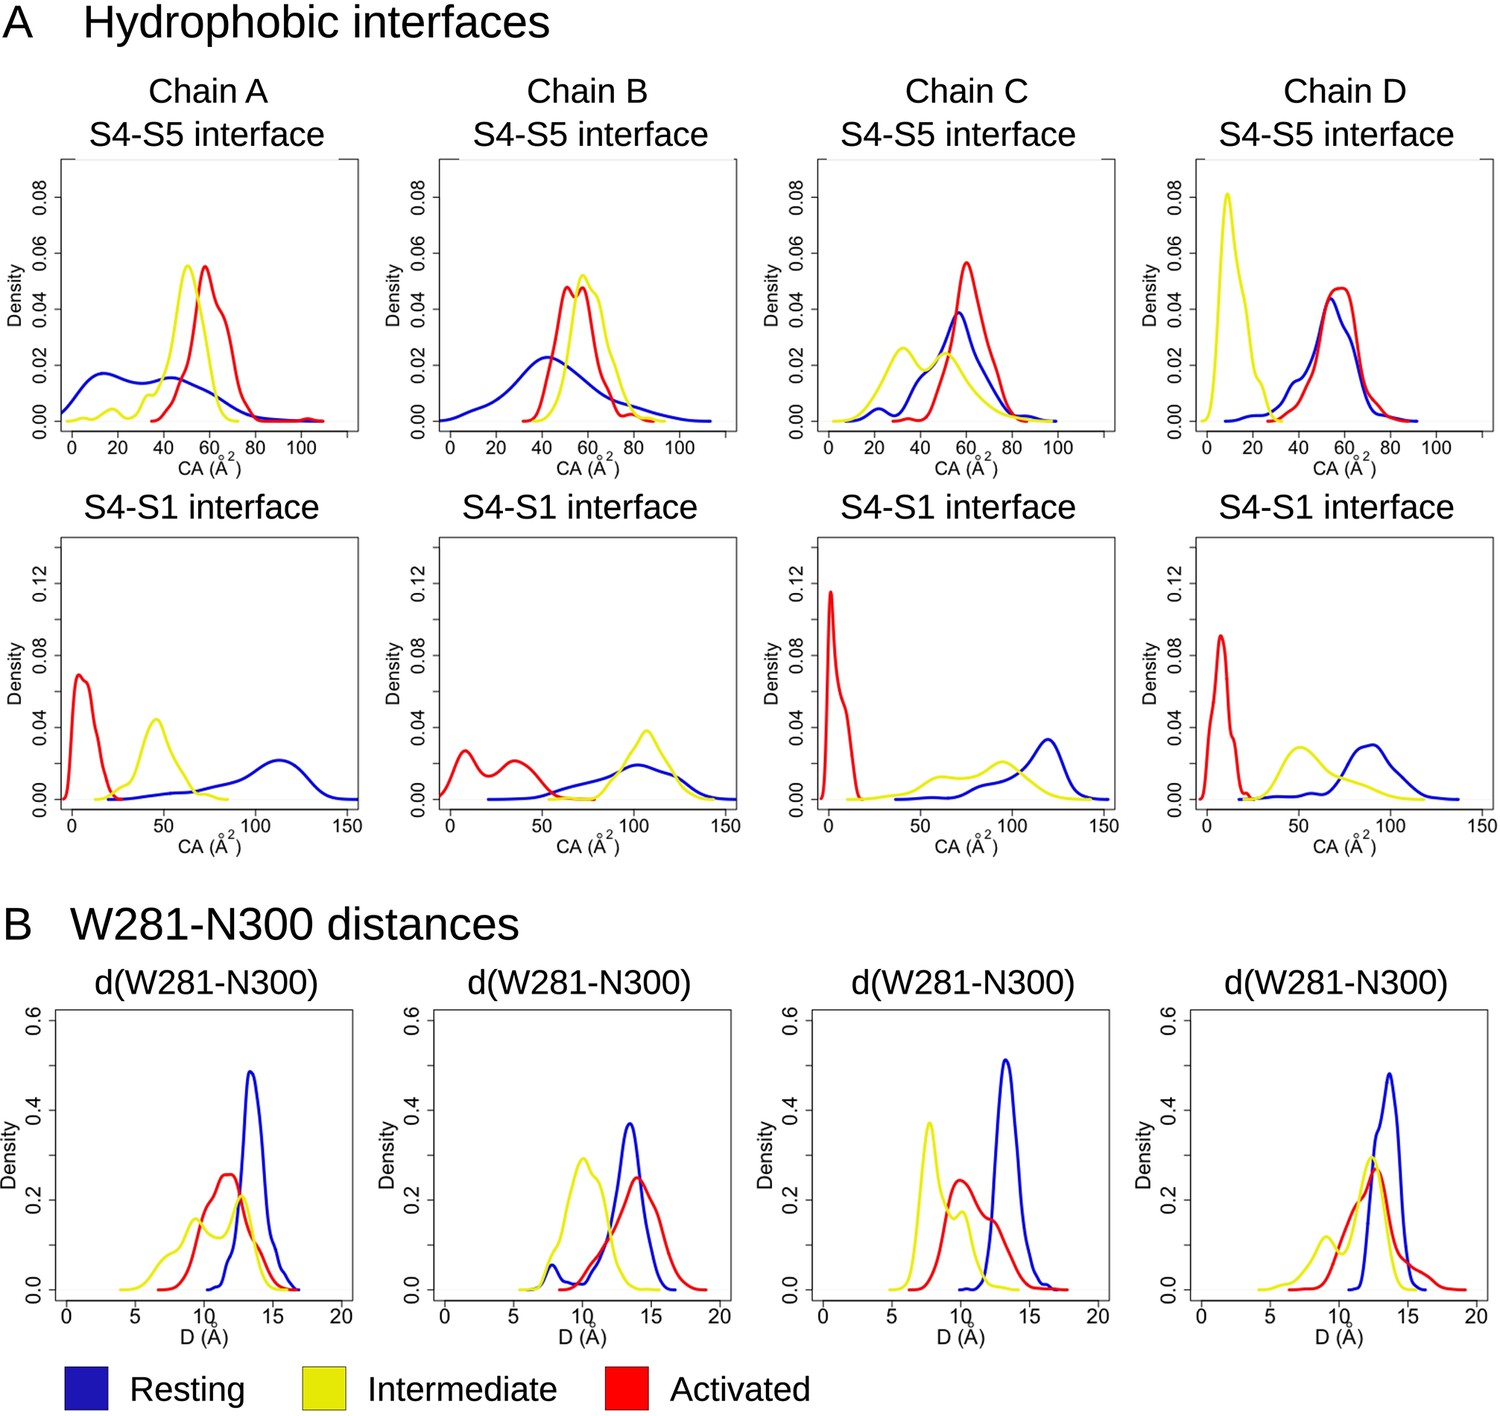
S4-S5 and S4-S1 hydrophobic interfaces in the resting, intermediate, and activated states.
Probability distributions of (A) the hydrophobic contact areas at the S4-S5 (A, top panel – measured between the innermost parts of S4 [residues 277–289] and S5 [residues 290–305]) and S4-S1 (A, bottom panel – measured between the bottom parts of S4 [res 277–279] and S1 [res 139–150]) interfaces and (B) the W281-N300 distances along the equilibrium simulations of the resting (blue), intermediate (yellow), and activated (red) states.
Figure 2 with 3 supplements
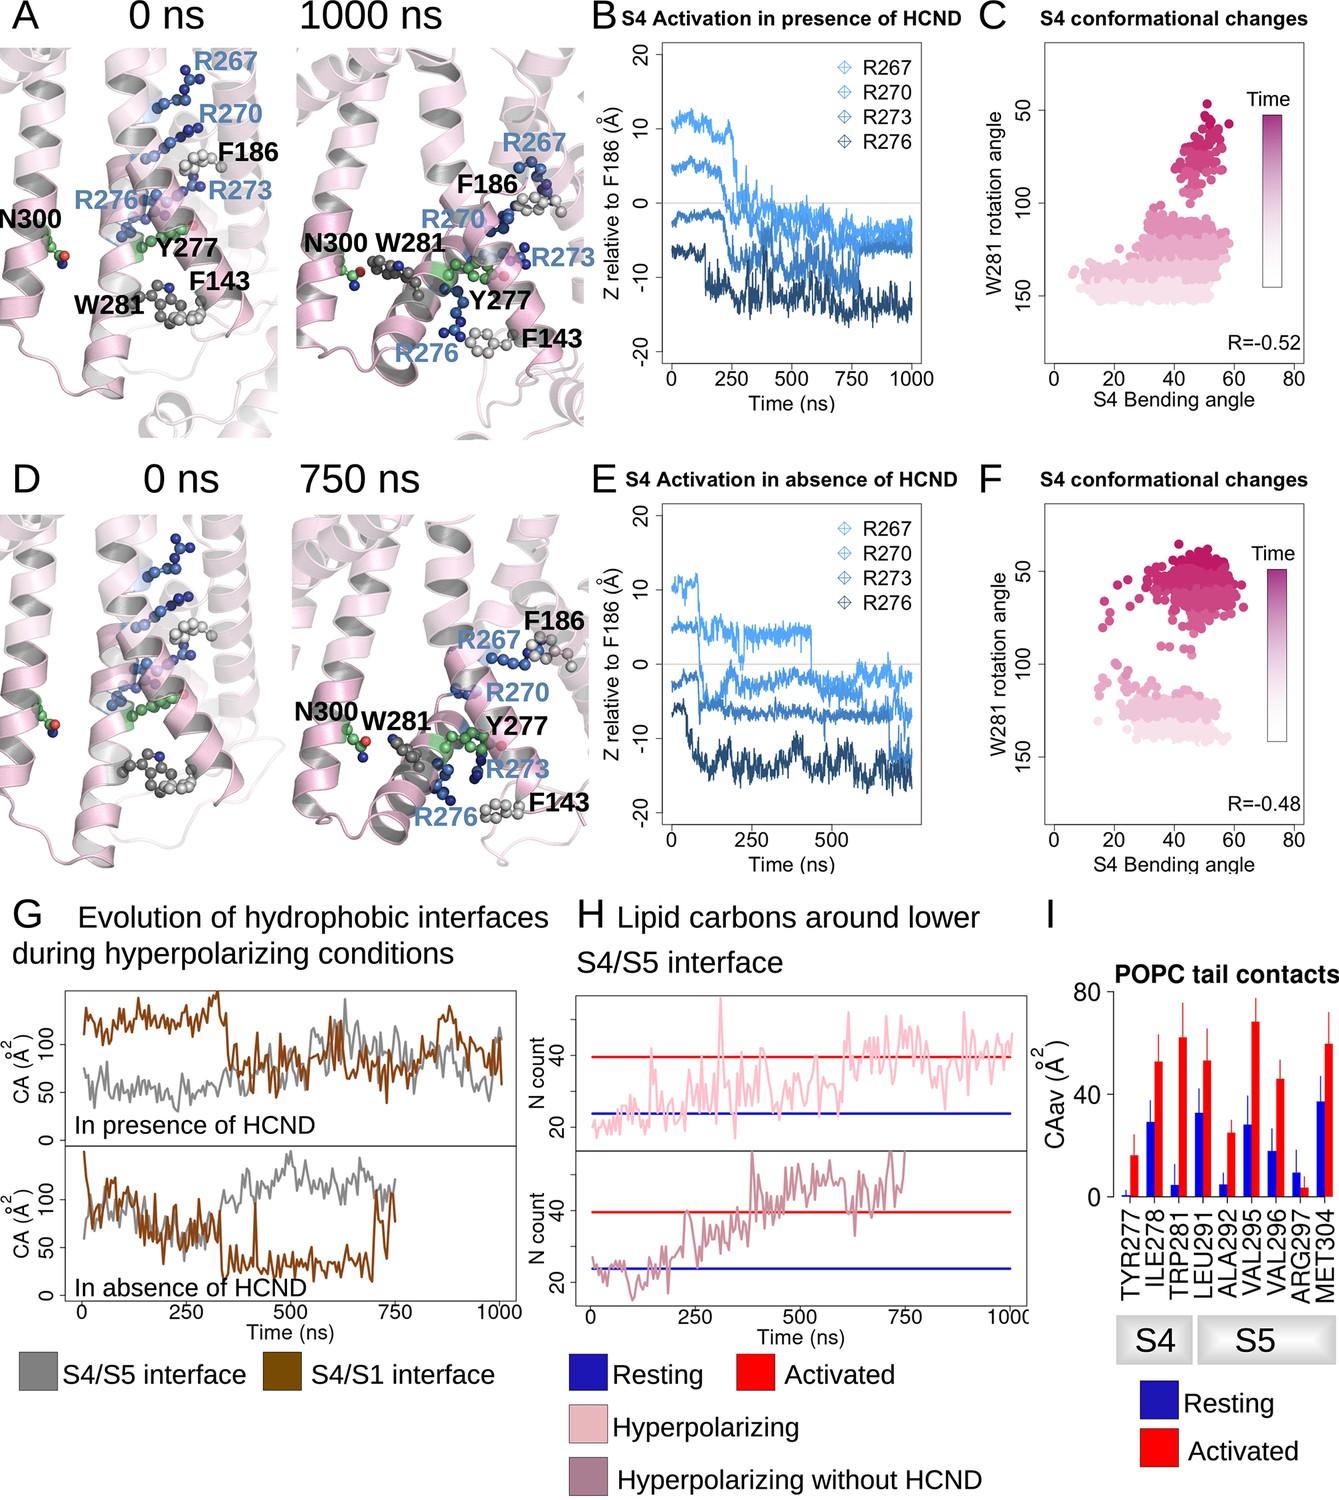
HCN1 activation induces an increase in the lower S4/S5-lipids hydrophobic interfaces.
(A, D) First and last snapshots of voltage-sensor domains (VSDs) extracted from activating simulations of intact (panel A, subunit D) or HCND-less system (panel D, subunit A). The gating charges and residues W281, Y277 (S4), N300 (S5), and F143 (S1) are highlighted using ball and stick representation. (B, E) Downward displacement of the gating charges with respect to the charge transfer center F186 during the activation of S4 in subunit D (panel B, intact HCN1 model) and subunit A (panel E, HCND-less HCN1 model) during activating simulations. (C, F) Correlation between the S4 bending angle and the rotation of W281 in subunit D (panel C, intact HCN1 model) and subunit A (panel F, HCND-less HCN1 model) during activating simulations. The time evolution is represented by a color gradient, from white/light pink to dark pink. (G) Evolution of the S4/S5 (brown) and S4/S1 (gray) hydrophobic interfaces (contact areas) along activating simulations of HCN1 in the presence (subunit D, top box) or absence (subunit A, bottom box) of the HCN domain. (H) Evolution of the number of lipid carbon atoms, N, in contact with hydrophobic residues from the lower S4/S5 interface along activating simulations of HCN1 in the presence and absence of HCN domain are shown for subunit D in light pink (top box) and for subunit A in dark pink (bottom box), respectively. N count values for the resting and activated states were averaged for the four subunits from the equilibrium simulations and are displayed as blue and red horizontal lines, respectively. (I) Contact area between lipid tails and residues on the lower S4/S5 interface, averaged over the four subunits and over the simulation time, in the resting (blue) and activated (red) states. Error bars are given as standard deviation calculated over the four subunits and over the simulation time.
Figure 2—figure supplement 1
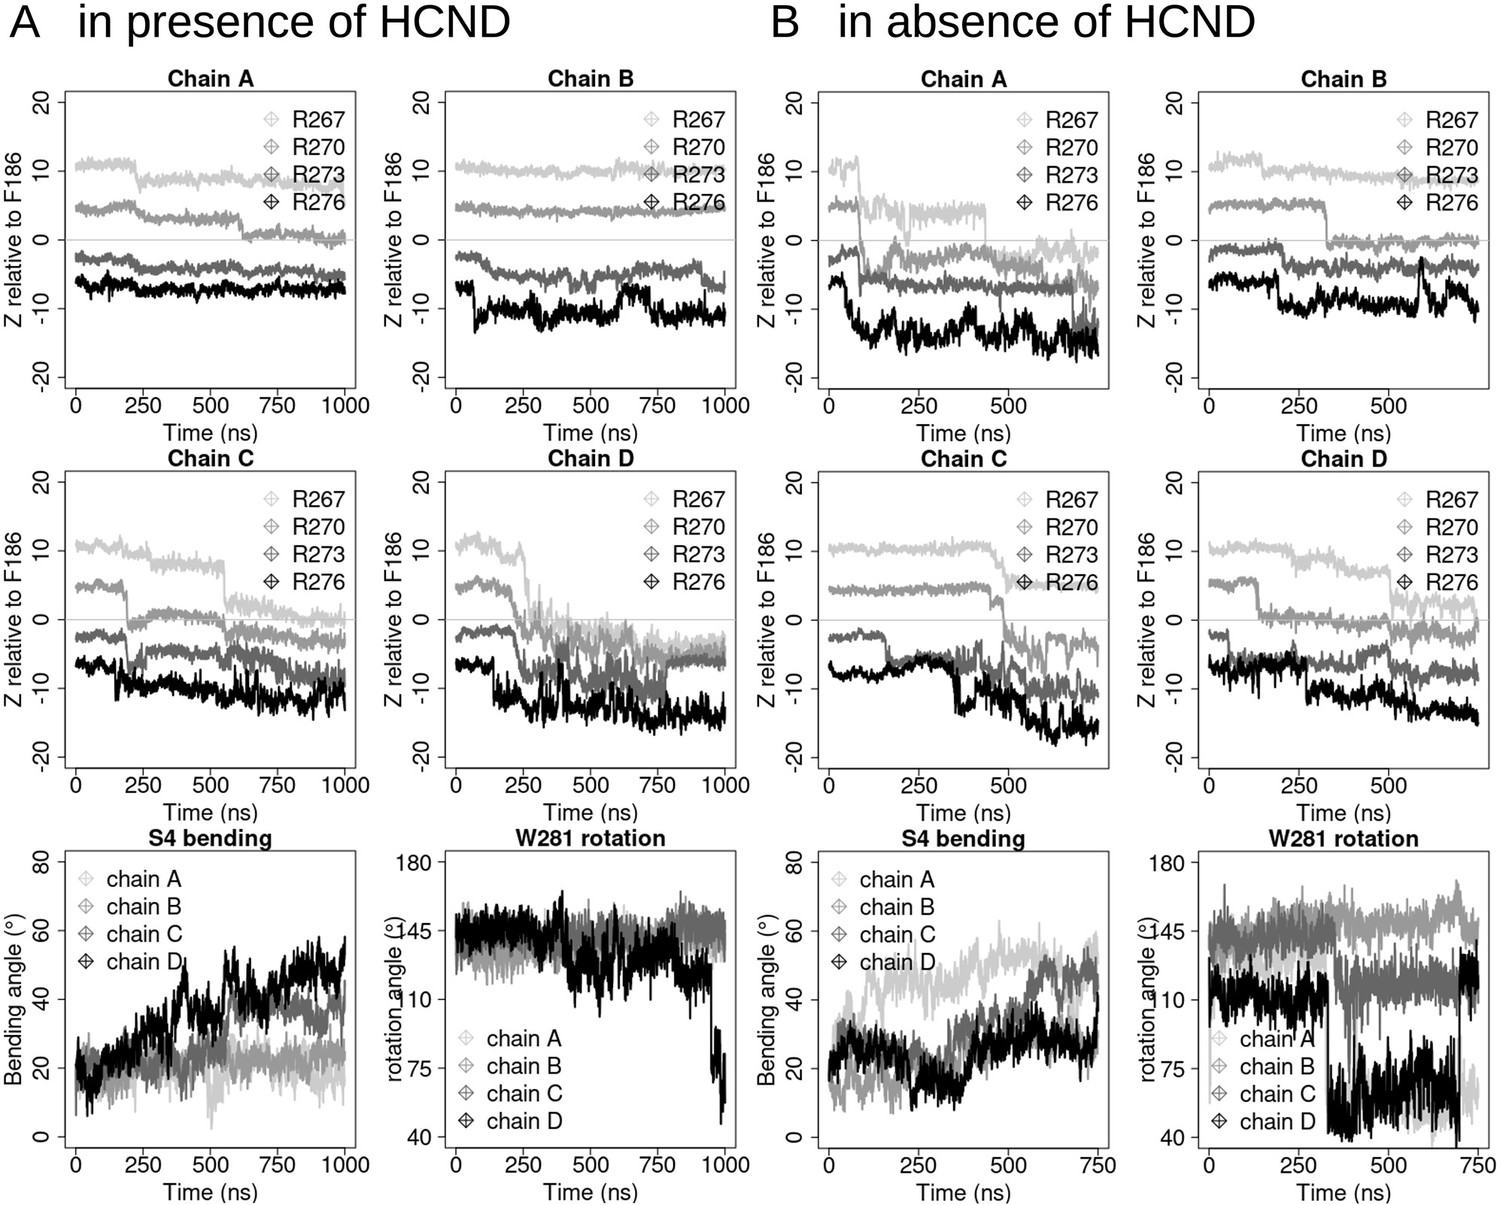
S4 displacement in simulations of the intact (A, 1 µs) or in the HCND-less system (B, 750 ns).
In both panels, the first two rows represent the gating charges (R267, R270, R273, and R276 colored from light gray to black) movement with respect to the charge transfer center (F186, z = 0) for the four protein chains (chains A, B, C, and D). The last rows show the evolution of the bending angle of S4 (defined as the angle between segments encompassing residues 252–272 and 272–289) and the rotation angle of W281 (right panel, defined as the angle between atoms Cɑ-V296 [on S5], Cɑ-W281 and CE2-W281 [on S4]). The four monomers, chains A, B, C, and D, are colored from light gray to black.
Figure 2—figure supplement 2
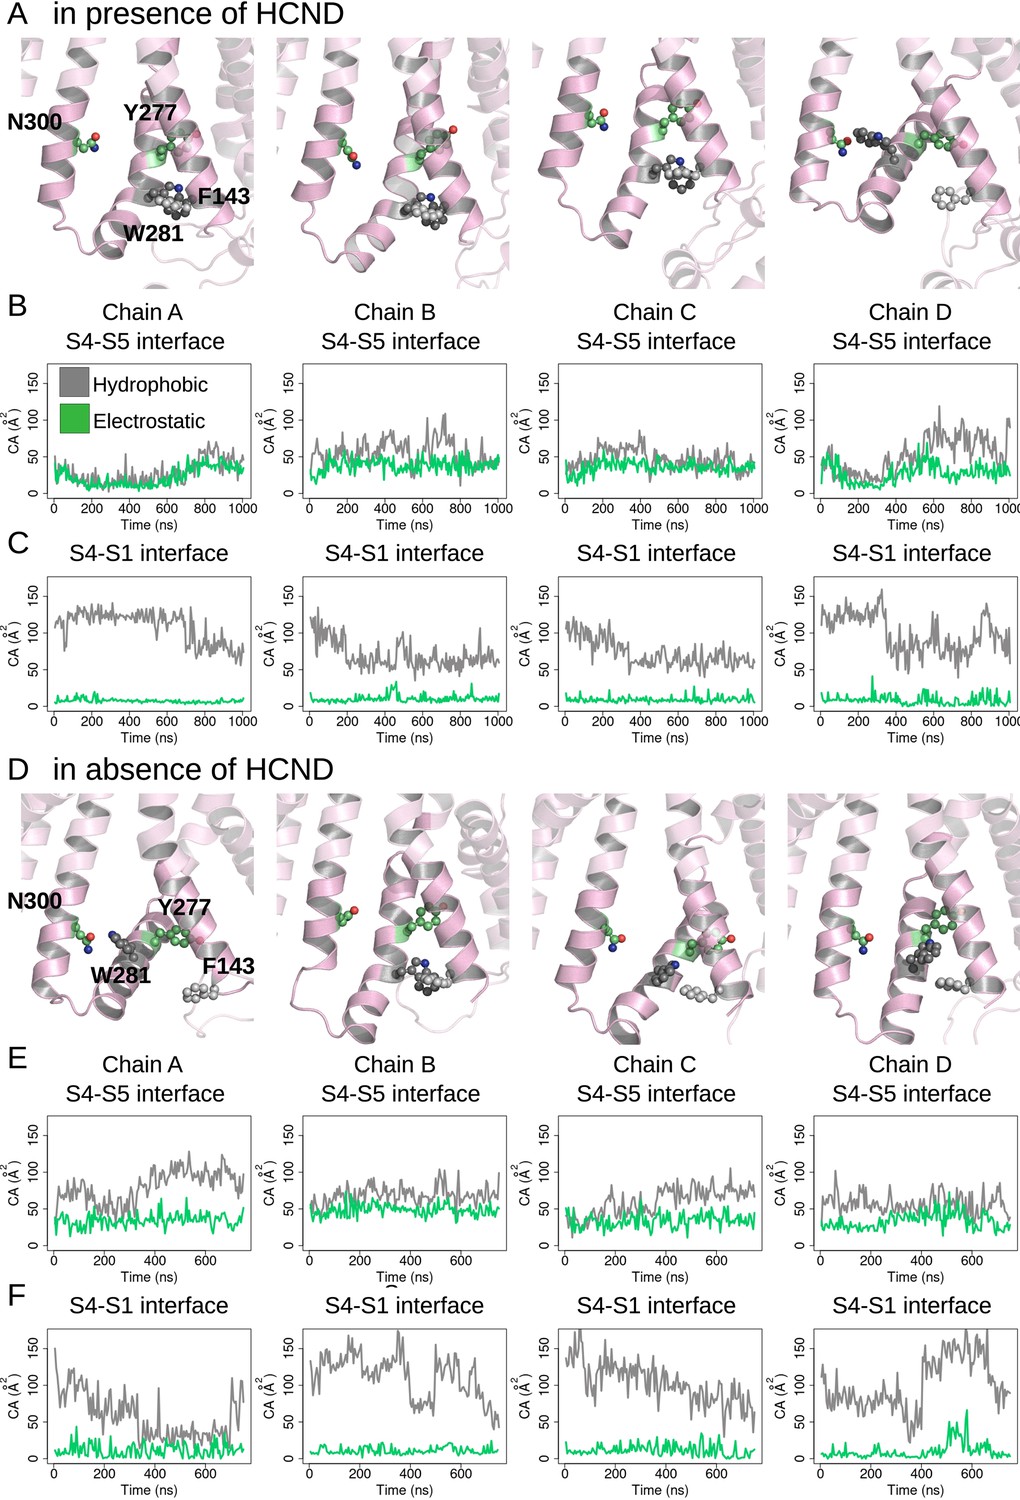
Evolution of the S4/S5 and S4/S1 interfaces in activating molecular dynamics (MD) simulations of intact (A–C) and in HCND-less HCN1 models (D–F).
Each column represents a different subunit. First row: last snapshot from Hyperpolarizing EF-simulation showing the position of W281 and Y277 with respect to F143 and N300. Second row: hydrophobic (gray) and electrostatic (green) contact areas measured between the innermost parts of S4 (residues 277–289) and S5 (residues 290–305) as a function of simulation time. Third row: hydrophobic (gray) and electrostatic (green) contact areas measured between the bottom parts of S4 (res 277–279) and S1 (res 139–150) as a function of simulation time.
Figure 2—figure supplement 3
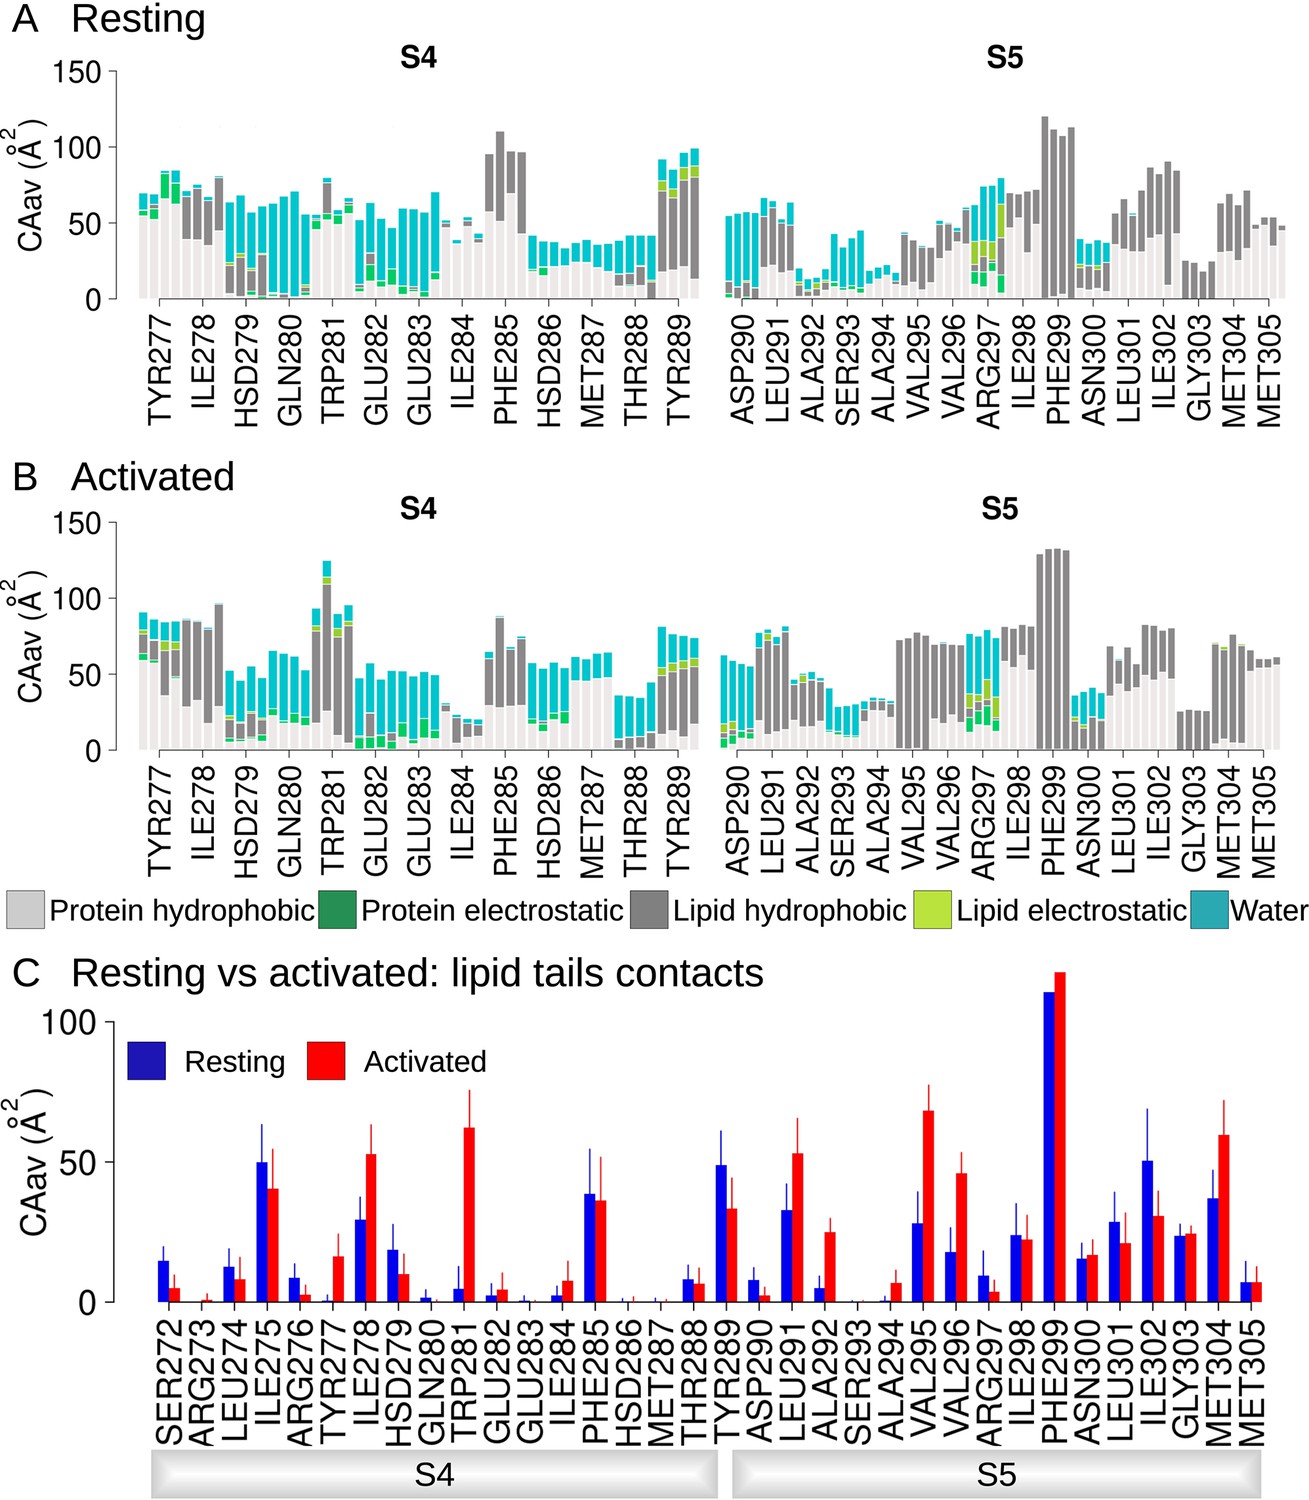
Hydrophobic and electrostatic interactions in the lower S4/S5 region are state-dependent.
Average contact areas between each residue/subunit from the lower S4 (left) and S5 (right) and surrounding hydrophobic (light gray) and hydrophilic (spring green) protein residues, lipid tails (dark gray) and headgroups (light green), and water molecules (turquoise) in the resting (panel A) and activated (panel B) states equilibrium molecular dynamics (MD) simulations (1 µs). (C) Contact area between lower S4/S5 protein residues and lipid tails averaged over the four subunits and over the simulation time, in the resting (blue) and activated (red) states. Error bars are given as standard deviation calculated over the four subunits and over the simulation time.
Figure 3 with 1 supplement
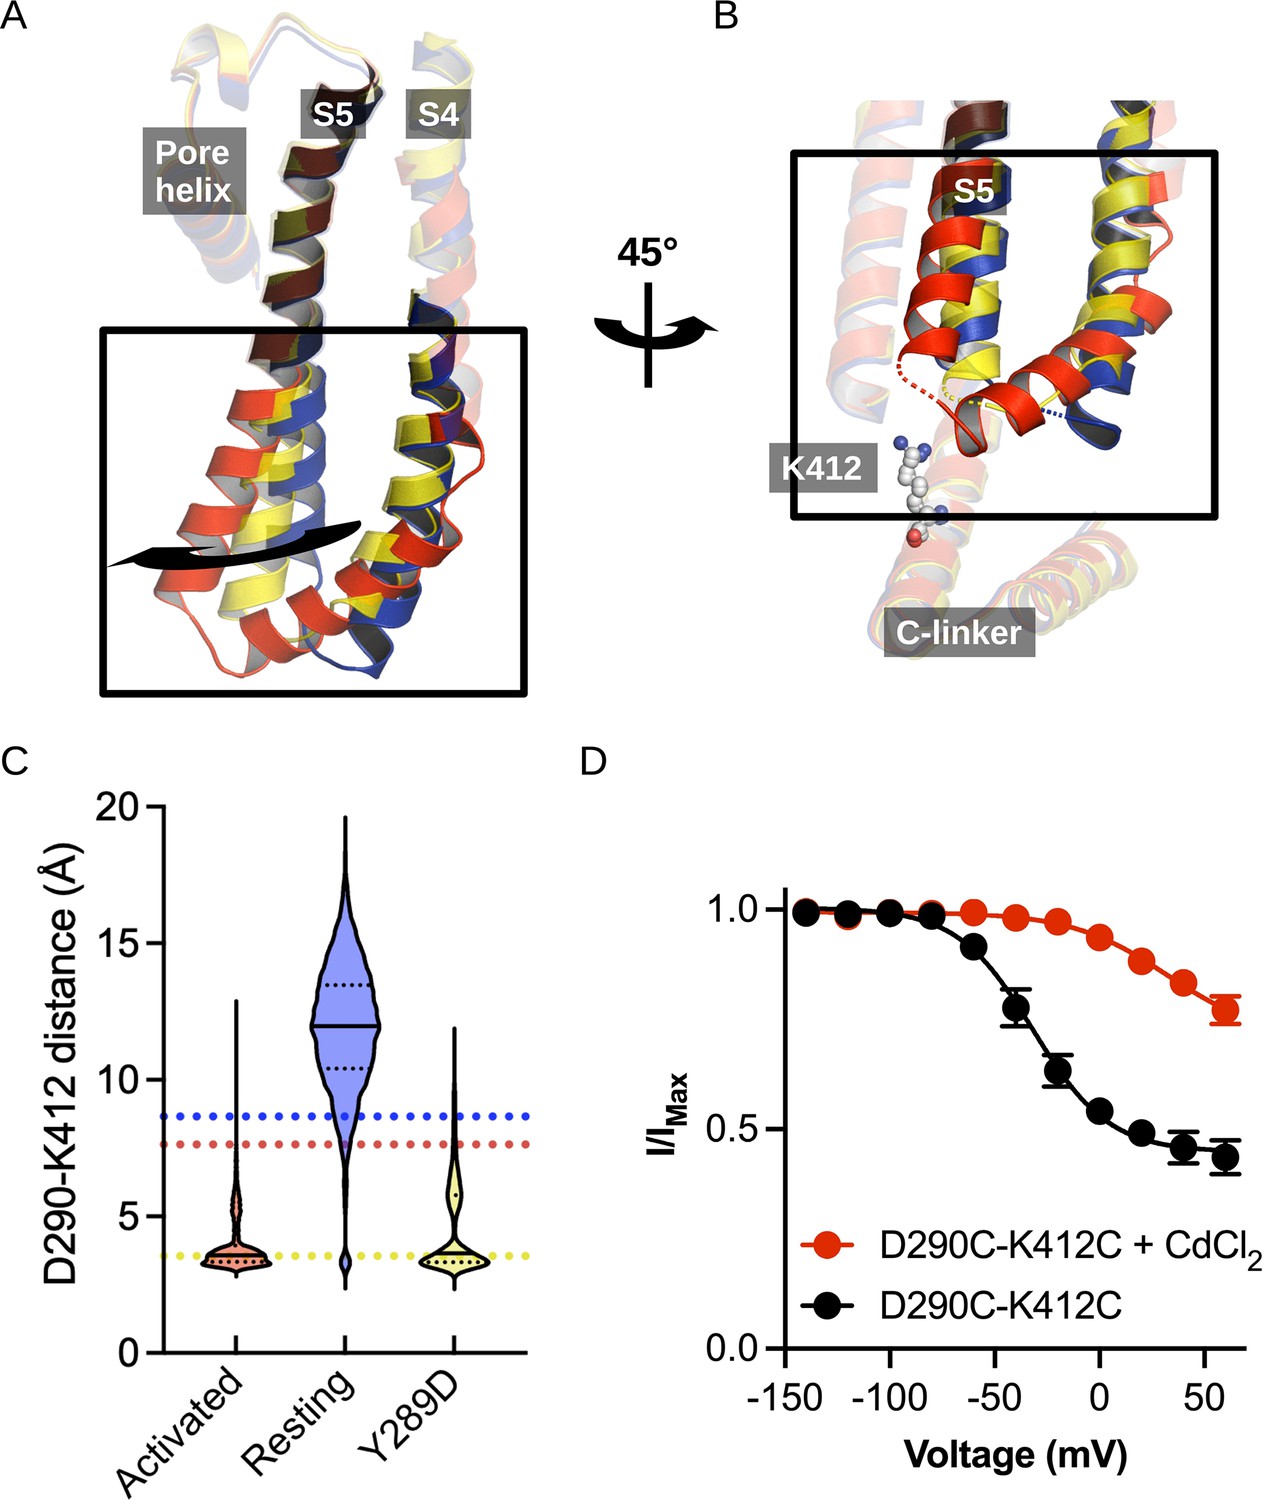
Structural comparison of the S4/S5 linker and C-linker regions.
(A) Structural comparison of the S4-S6 region of the resting (5U6P; blue), intermediate (6UQG; yellow), and activated (6UQF; red) states of hHCN1. Alignment was performed on the entire structure. (B) Structural comparison of the S4/S5 linker and C-linker regions of the resting, intermediate, and activated states of hHCN1. Residue K412 of the C-linker is shown as grey spheres. (C) D290-K412 distance distribution in simulations of the resting, intermediate, and activated states. Dashed lines represent distances in the starting cryoEM structures of the same color. (D) Peak tail current versus voltage plot for whole-cell recordings from HEK cells expressing HCN1 D290C/K412C with (red) or without (black) 100 uM CdCl2 in the patch pipette. Error bars represent SEM for n = 5 independent cells for each condition.
Figure 3—figure supplement 1
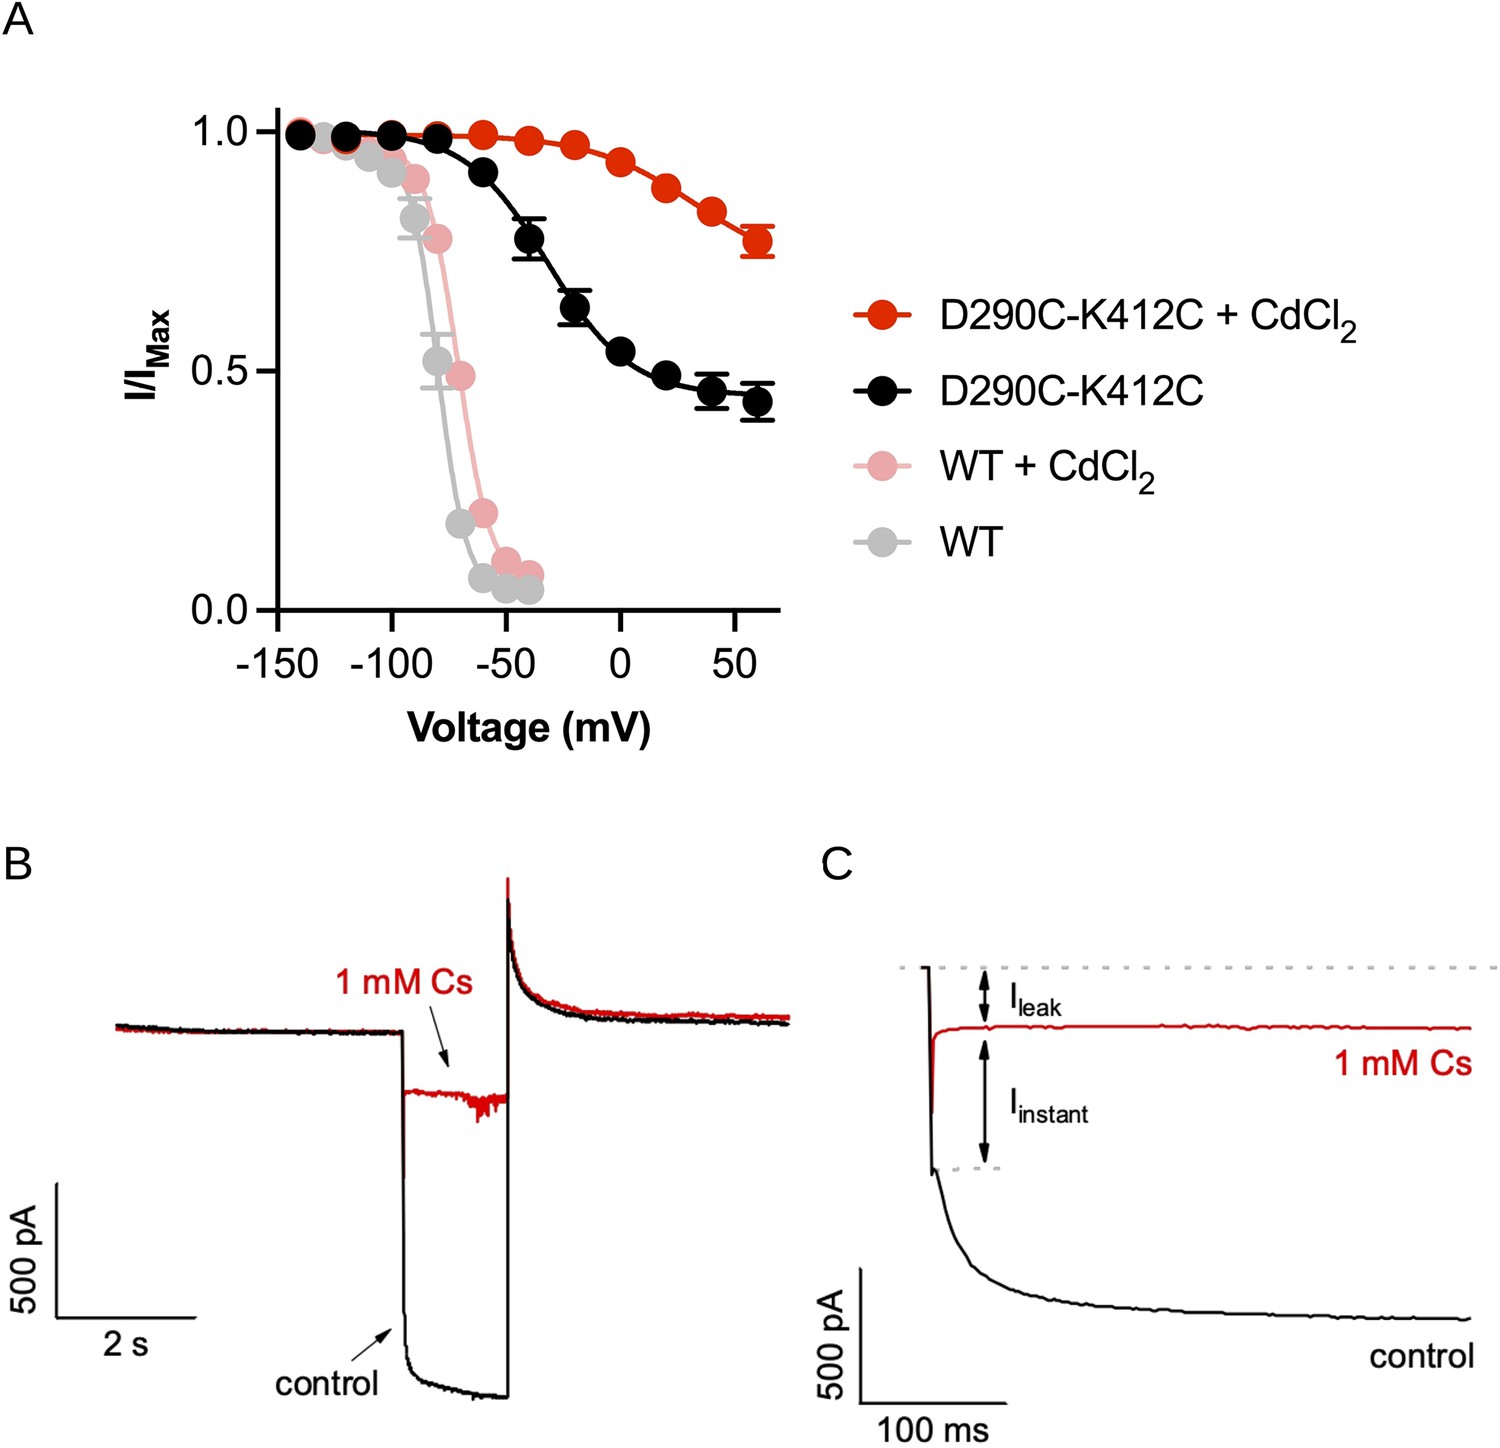
Functional recordings of the D290C-K412C double mutant.
(A) Comparison of the relative peak tail current versus voltage relationships for HCN1-EM with (pink) and without (gray) cadmium chloride and the D290C-K412C double mutant with (red) and without (black) cadmium chloride in the patch pipette. Error bars represent SEM for n = 5 independent cells for each condition. (B) Example of cesium blockage and residual leak current from cells expressing the D290C-K412C mutant. Currents are elicited from the same cell from test pulses to –140 mV with (red) and without (black) 1 mM CsCl present in the bath solution. (C) Same as (B) showing just the test pulse to highlight the lack of time-dependence to the ‘instantaneous’ current component (Iinstant).
Figure 4 with 4 supplements
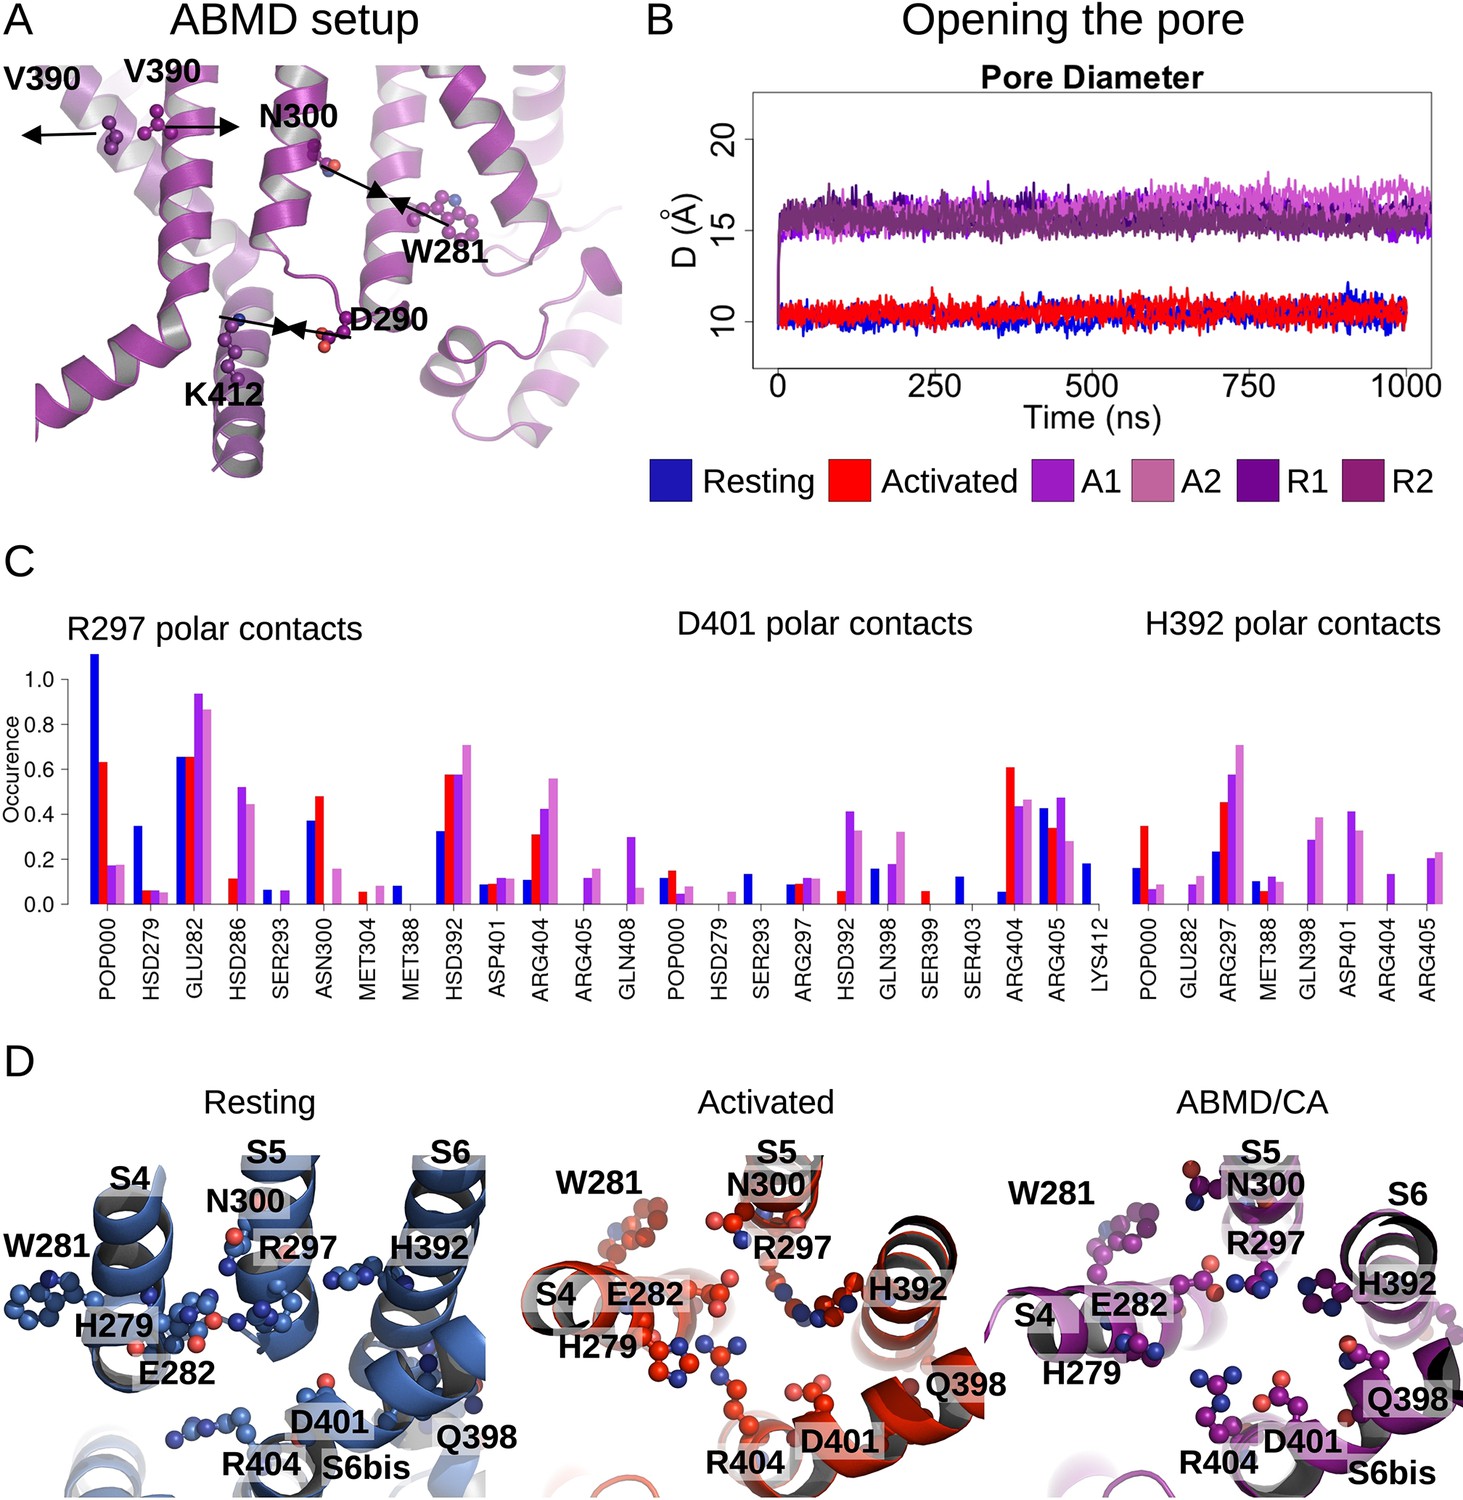
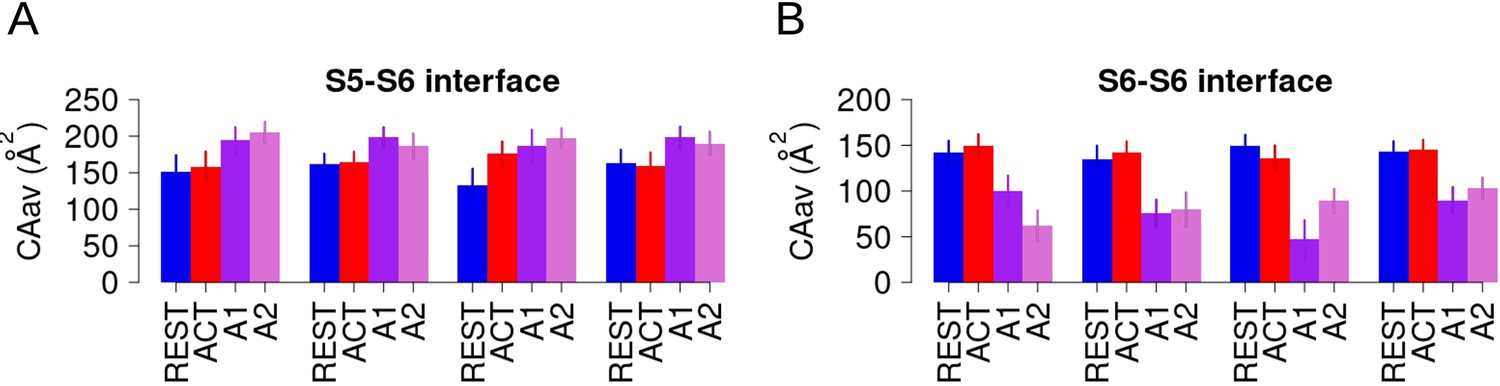
Pore opening of HCN1.
(A) Residues and distances used as collective variables in adiabatic bias molecular dynamics (ABMD) simulations are highlighted by ball and stick and black double arrows, respectively. (B) Inter-subunit distances between opposite V390 residues are represented as a function of time in the resting (blue), activated (red), and ABMD (crimson) simulations starting from the closed activated (A1/A2 in light purple and light orchid) and resting (R1/R2 in dark purple and dark orchid) states. (C) Contact occurrences of R297, D401, and H392 in HCN1 are shown for the resting (blue), activated (red), and ABMD (crimson) simulations starting from the closed activated (A1/A2 in light purple and light orchid). (D) Lower S4/S5, S5/S6, S6/S6(bis) S4/CL(bis) interfaces/interactions. Important/interesting residues from these interfaces are highlighted in ball and stick.
Figure 4—figure supplement 1
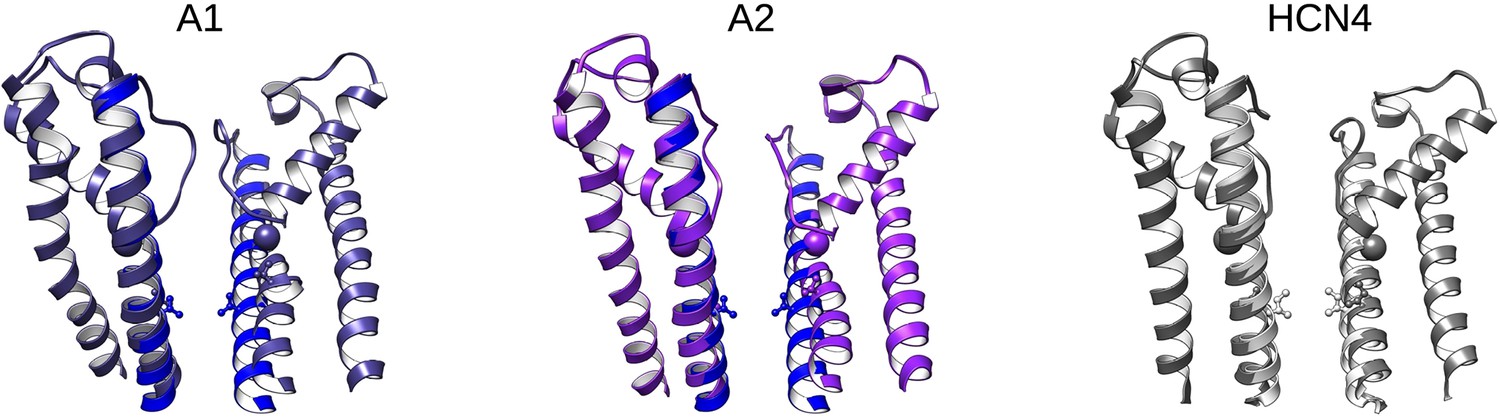
Open pore models from adiabatic bias molecular dynamics (ABMD) simulations compared to HCN4.
Left and middle: Overlay of pore domains from the start (blue) and end (purple) for two ABMD replicates starting from the activated-closed state. Right: overlay of the closed (white) and open (gray) pores from HCN4. Spheres highlight the alpha carbon of G382 for HCN1 or G503 for HCN4. Sticks highlight V390 in HCN1 and the corresponding position I511 in HCN4. Only two opposing subunits are shown for clarity.
Figure 4—figure supplement 2
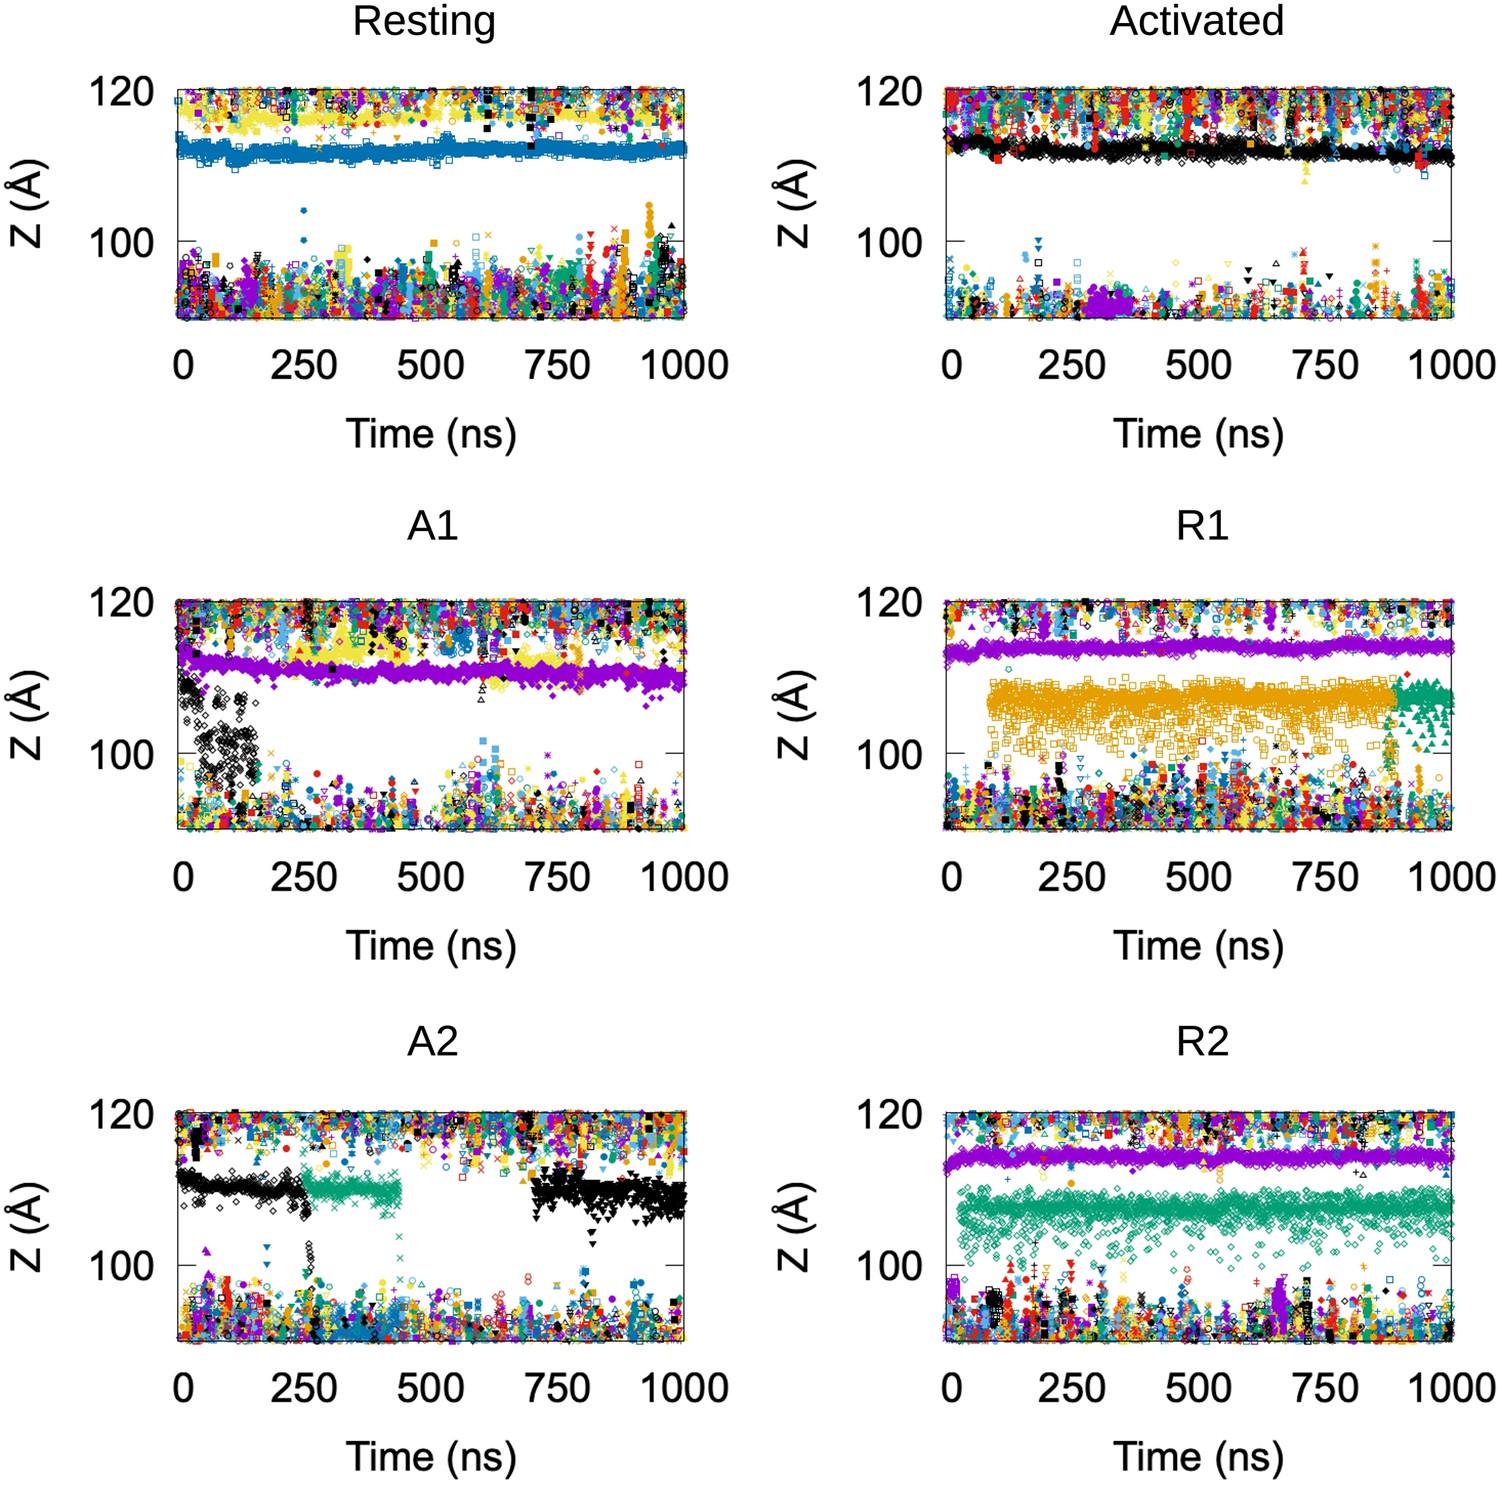
Potassium permeation along the HCN1 pore.
Positions of potassium ions along the Z-axis of the simulation box, each shown in a different symbol and color, as a function of the simulation time. The membrane is located between Z = ~90 Å and Z = ~120 Å. Data from six simulations are shown: resting and activated/closed HCN1 structures equilibrium molecular dynamics (MD) simulations, and adiabatic bias molecular dynamics (ABMD) simulation of the transition toward open channel starting from resting/closed (R1 and R2) and activated/closed (A1 and A2) HCN1 structures.
Figure 4—figure supplement 3
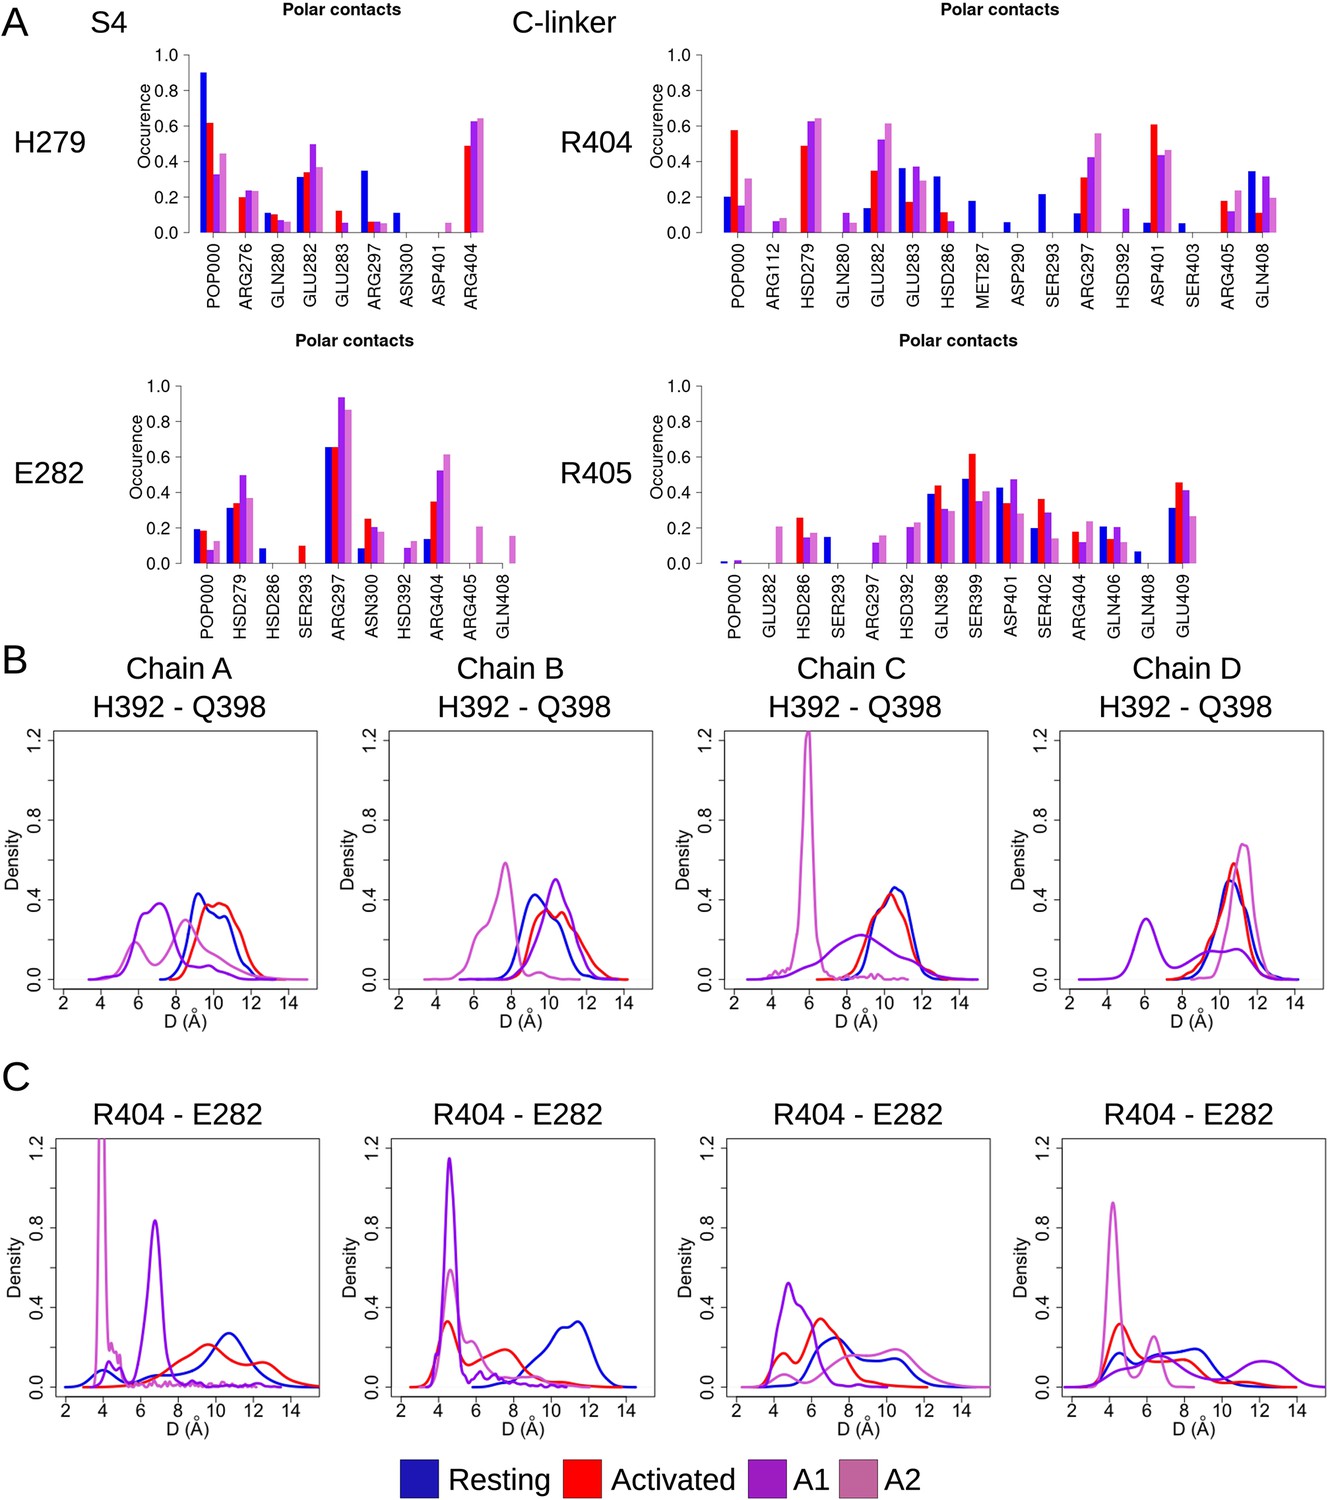
Key state-dependent interactions.
(A) Contact occurrences of H279 and E282 from S4 and R404 and R405 from the C-linker in HCN1 are shown for the resting (blue), activated (red), and adiabatic bias molecular dynamics (ABMD) simulations starting from the closed activated (A1/A2 in light purple and light orchid). (B, C) Probability distributions of H392-Q398 (B) and R404-E282 distances (C) along the equilibrium simulations of the resting (blue), activated (red), and the ABMD simulations (A1 in purple and A2 in orchid).
Figure 4—figure supplement 4
Opening implies slightly reinforced hydrophobic S6-S5 interfaces and substantially weakened hydrophobic S6-S6 interfaces.
(A) Time-averaged contact areas between intra-subunit lower S5 and S6 in each subunit in the resting (blue) and activated (red) equilibrium simulations and in the adiabatic bias molecular dynamics (ABMD) simulation (A1/A2 in purple and orchid) starting from the activated state. (B) Time-averaged contact areas between adjacent (inter-subunit) lower S6 helices in each subunit in the resting (blue) and activated (red) and in the ABMD simulation (A1/A2 in purple and orchid) starting from the activated state.
Figure 5
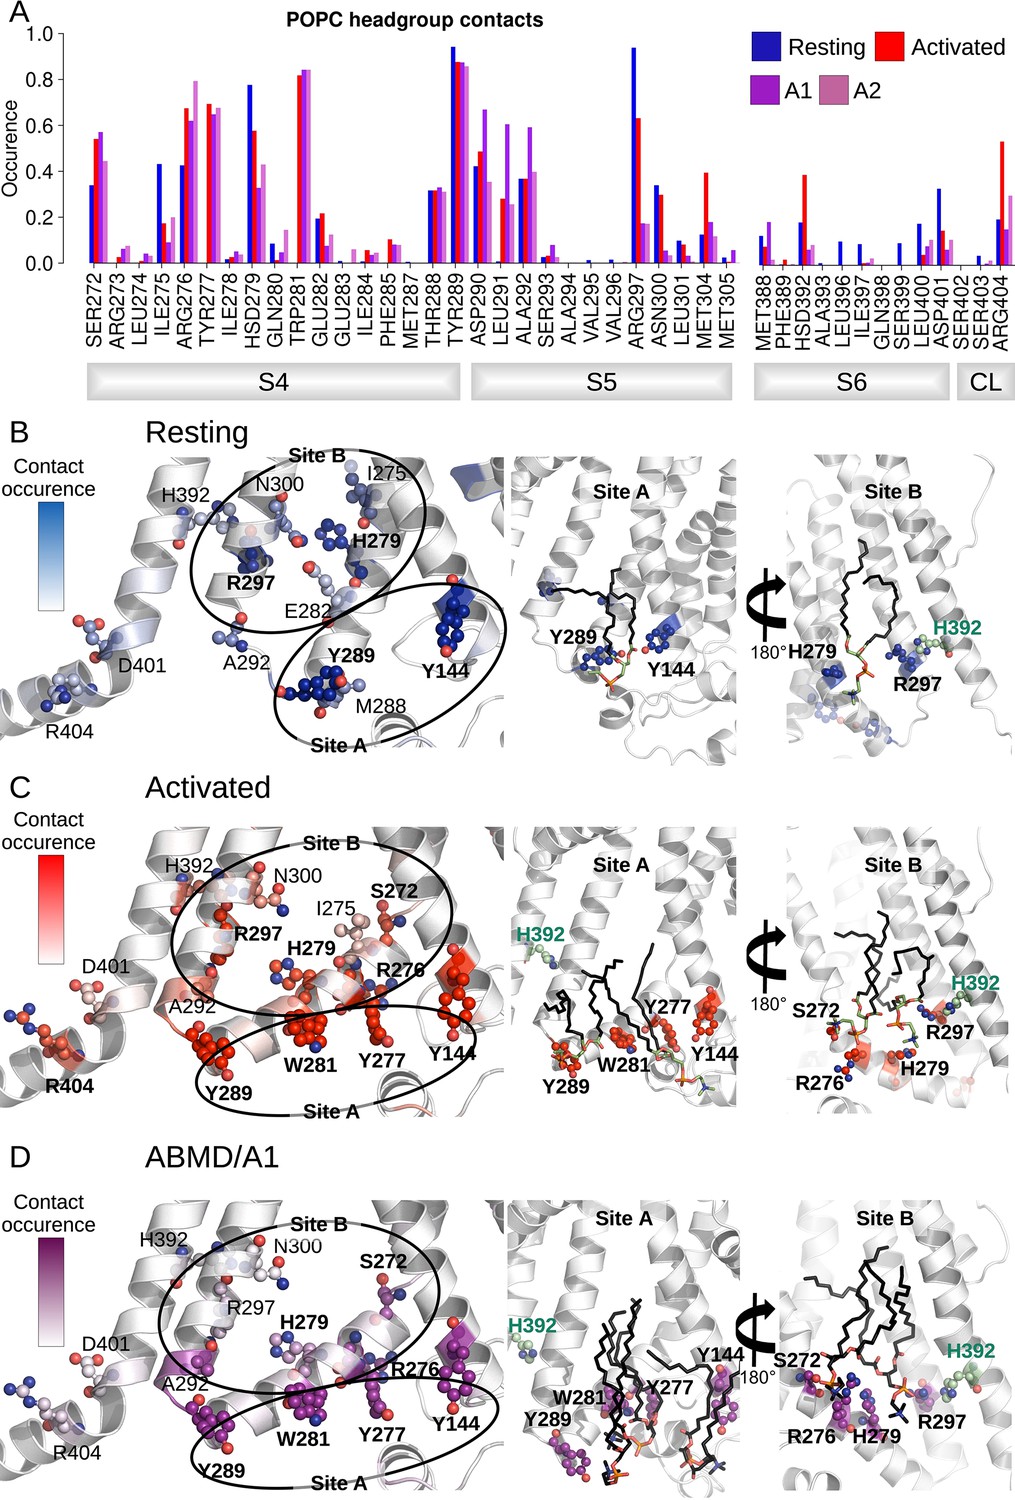
Interactions between the lower S4/S5/S6 region of HCN1 and the lipid headgroups are state-dependent.
(A) Contact area between lower S4/S5/S6 protein residues and lipid headgroups averaged over the four subunits and over the simulation time, in the resting (blue), activated (red), and adiabatic bias molecular dynamics (ABMD) simulations (A1/A2 in purple and orchid) starting from the activated state. (B) Residues from lower S1/S4/S5 in contacts with lipid headgroups for more than 50% of the simulation time in the resting HCN1 are highlighted in blue. Snapshot of POPC lipids (sticks) bound to lipid headgroup binding sites found in HCN1 resting state (C) Residues from lower S1/S4/S5 in contacts with lipid headgroups for more than 50% of the simulation time in the activated HCN1 are highlighted in red. Snapshot of POPC lipids (sticks) bound to lipid headgroup binding sites found in HCN1 activated state. (D) Residues from lower S1/S4/S5 in contacts with lipid headgroups for more than 50% of the simulation time in the ABMD simulation A1 are highlighted in purple. Snapshot of POPC lipids (sticks) bound to lipid headgroup binding sites found in ABMD/A1 simulation.
Figure 6

Hydrophobic domino-effect model of HCN1 gating upon activation.
Hyperpolarization triggers the downward and breaking movement of S4 at S272 and initiates a cascade of rearrangements of the hydrophobic interfaces between and within the voltage-sensor domains (VSD) and pore. First, W281 is pulled out of a S1/HCND hydrophobic cavity leading the lower S4 helix to rotate and form of new contacts with N300 on S5 (step 1). This is accompanied by an increase in the hydrophobic interface between the lower S4, S5, and the surrounding lipid tails. These interactions and the formation of the D290-K412 contact between the S4-S5 linker and the C-linker result in a slight bending of S5 away from S6 as hydrophobic contacts between S5 and S6 form. Lipid contacts at this interface are also increased (step 2). This results in hinging of S6 and a rotation of V390 away from the pore axis, opening of a conductive hydrophilic pathway along the pore axis. The open conformation is stabilized by interactions between R297 (S5) and E282 (S4), between R297 (S5) and H392 (S6), and between H392 and Q398, D401, and R404 from the adjacent subunit (step 3).
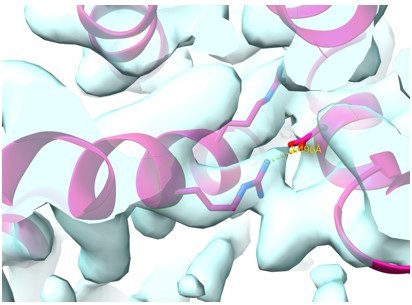
Author response image 1

overlay between model (light green helices) and density (EMD-8512) for the closed state hHCN1 model (5U6P).
Author response image 2

Figure R2: overlay between model (light pink helices) and density (EMD-0093) for the closed state hHCN4 model (6GYN).
Author response image 3

Figure R3: overlay between model (bright pink helices) and density (EMD-12513) for the closed state rabbit HCN4 model (7NP4).
Author response image 4

Figure R4: overlay between model (light blue helices) and density (EMD-12512) for the open state rabbit HCN4 model (7NP3).
Author response image 5
Zoom in onto the VSD region of the closed state rabbit HCN4 model.
Overlay between model (bright pink helices) and density highlighting a well-established salt bridge interaction.
Videos
Video 1
Structural position of Y289 in ABMD1 open model relative to previously probed positions in the C-linker.
ABMD1 open state model highlighting positions of cysteine mutations from Kwan et al., 2012 highlighted with their beta carbon as spheres. Y289 is colored in the same color as the model while the positions on the C-linker are colored according to their functional effect with applied cadmium. Green indicates lock-open effect, red indicates lock-closed effect, and gray indicates no effect. Only the pore domain and A′ helix of the C-linker are shown for clarity.
Video 2
Structural position of Y289 in ABMD2 open model relative to previously probed positions in the C-linker.
ABMD2 open state model highlighting positions of cysteine mutations from Kwan et al., 2012 highlighted with their beta carbon as spheres. Y289 is colored in the same color as the model while the positions on the C-linker are colored according to their functional effect with applied cadmium. Green indicates lock-open effect, red indicates lock-closed effect, and gray indicates no effect. Only the pore domain and A′ helix of the C-linker are shown for clarity.
Video 3
Structural position of L291 in ABMD1 open model relative to previously probed positions in the C-linker.
ABMD1 open state model highlighting positions of cysteine mutations from Kwan et al., 2012 highlighted with their beta carbon as spheres. L291 is colored in the same color as the model while the positions on the C-linker are colored according to their functional effect with applied cadmium. Green indicates lock-open effect, red indicates lock-closed effect, and gray indicates no effect. Only the pore domain and A′ helix of the C-linker are shown for clarity.
Video 4
Structural position of L291 in ABMD2 open model relative to previously probed positions in the C-linker.
ABMD2 open state model highlighting positions of cysteine mutations from Kwan et al., 2012 highlighted with their beta carbon as spheres. L291 is colored in the same color as the model while the positions on the C-linker are colored according to their functional effect with applied cadmium. Green indicates lock-open effect, red indicates lock-closed effect, and gray indicates no effect. Only the pore domain and A′ helix of the C-linker are shown for clarity.
Video 5
Structural position of A294 in ABMD1 open model relative to previously probed positions in the C-linker.
ABMD1 open state model highlighting positions of cysteine mutations from Kwan et al., 2012 highlighted with their beta carbon as spheres. A294 is colored in the same color as the model while the positions on the C-linker are colored according to their functional effect with applied cadmium. Green indicates lock-open effect, red indicates lock-closed effect, and gray indicates no effect. Only the pore domain and A′ helix of the C-linker are shown for clarity.
Video 6
Structural position of A294 in ABMD2 open model relative to previously probed positions in the C-linker.
ABMD2 open state model highlighting positions of cysteine mutations from Kwan et al., 2012 highlighted with their beta carbon as spheres. A294 is colored in the same color as the model while the positions on the C-linker are colored according to their functional effect with applied cadmium. Green indicates lock-open effect, red indicates lock-closed effect, and gray indicates no effect. Only the pore domain and A′ helix of the C-linker are shown for clarity.
Tables
Table 1
Table summary of the molecular dynamics (MD) simulations carried out in this work.
CryoEM structures (first column, PDB code in brackets) were simulated under different conditions (second column, including the presence/absence of specific domains/binding partners, under external electric field [EF] or not). The total simulation time is provided in the third column.
| Structure | Conditions | Time (ns) |
|---|---|---|
| HCN1 resting with cAMP (5U6P) | No EF | 1000 |
| HCN1 intermediate with cAMP (6UQG) | No EF | 1000 |
| HCN1 activated closed with cAMP (6UQF) | No EF | 1000 |
| HCN1 resting with cAMP (5U6P) | Without HCN domain + EF (–1 V) | 750 |
| HCN1 resting with cAMP (5U6P) | EF (–1 V) | 1000 |
| HCN1 resting with cAMP (5U6P) | EF (–550 mV) | 12,000 |
| HCN1 resting with cAMP (5U6P) | ABMD + EF (-) | 2 × 1000 |
| HCN1 activated with cAMP (6UQF) | ABMD + EF (-) | 2 × 1000 |
-
ABMD, adiabatic bias molecular dynamics.
Additional files
Download links
A two-part list of links to download the article, or parts of the article, in various formats.
Downloads (link to download the article as PDF)
Open citations (links to open the citations from this article in various online reference manager services)
Cite this article (links to download the citations from this article in formats compatible with various reference manager tools)
Interplay between VSD, pore, and membrane lipids in electromechanical coupling in HCN channels
eLife 12:e80303.
https://doi.org/10.7554/eLife.80303


