The transcription factor RUNX2 drives the generation of human NK cells and promotes tissue residency
- Department of Diagnostic Sciences, Ghent University, Belgium
- Cancer Research Institute Ghent, Belgium
- Department of Biomolecular Medicine, Ghent University, Belgium
- Laboratory of Immunobiology, Rega Institute for Medical Research, Department of Microbiology, Immunology and Transplantation, KU Leuven, Belgium
- Department of Pharmaceutics, Ghent University, Belgium
Figures
Figure 1 with 1 supplement
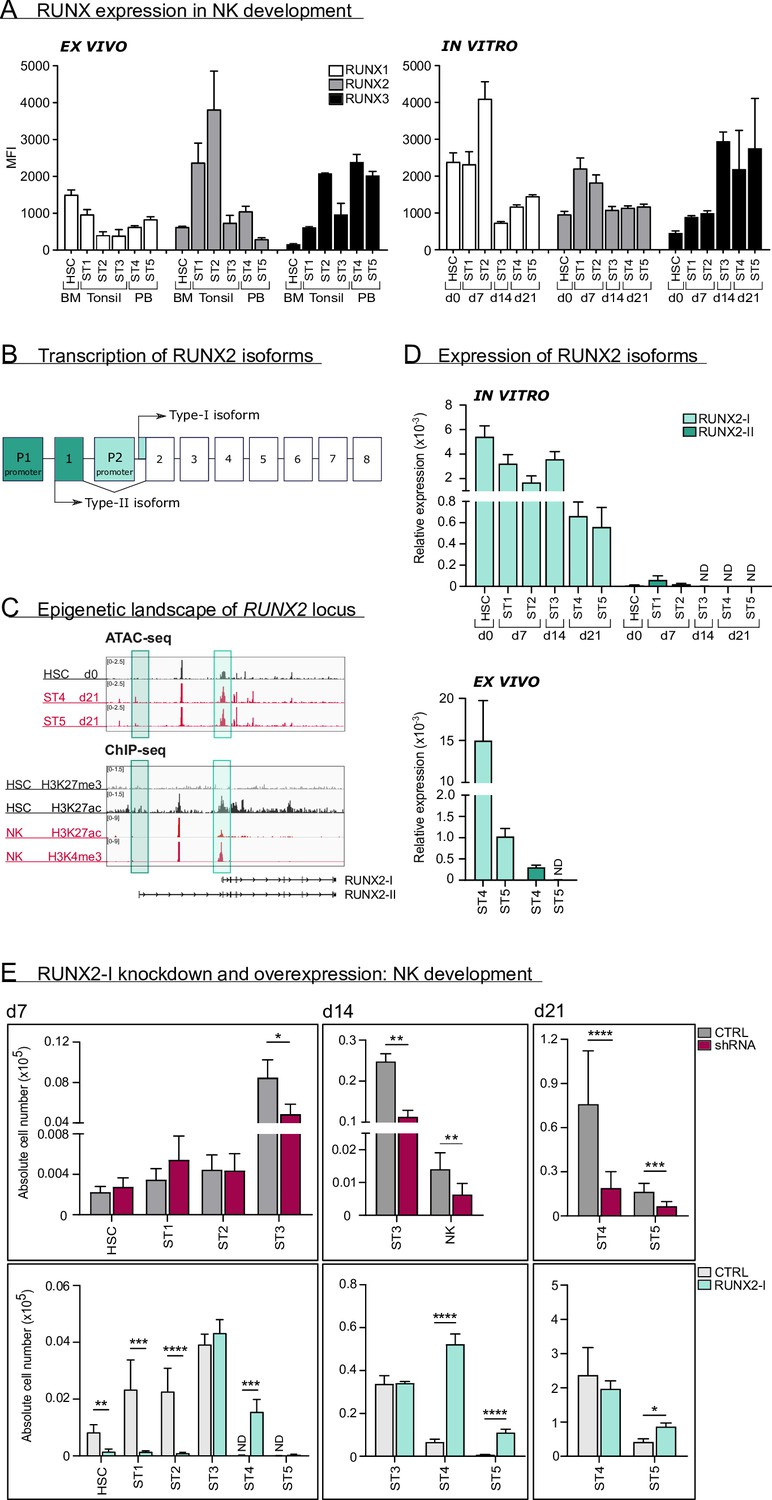
RUNX2-I is predominantly expressed and plays an important role in natural killer (NK) cell development.
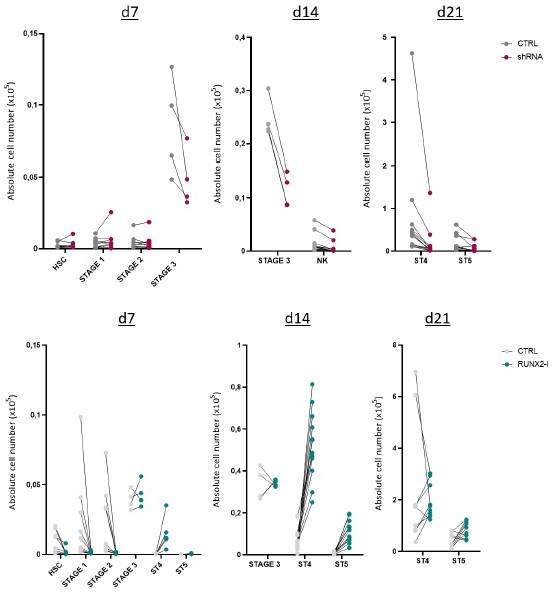
(A) RUNX1, RUNX2, and RUNX3 expression were evaluated in ex vivo and in vitro NK cell developmental stages with flow cytometry and presented as mean fluorescence intensity (MFI). For ex vivo data, haematopoietic stem cells (HSC; CD34+CD45RA−) originated from bone marrow, stage 1 (CD34+CD45RA+CD117−), stage 2 (CD34+CD45RA−CD117+), and stage 3 (CD34−CD117+CD94−HLA-DR−NKp44−) progenitors from tonsil, and stage 4 (CD56+CD94+CD16−) and stage 5 (CD56+CD94+CD16+) NK cells from peripheral blood (mean ± SEM; n=2–4). In vitro expression levels were determined in equivalent stages from cord blood (CB) HSC-based NK cell differentiation cultures at indicated time points (mean ± SEM; n=6). (B) Schematic overview of the transcriptional regulation of the RUNX2 principal isoforms. The type II isoform (RUNX2-II, eight exons) is transcribed from distal promoter P1, while the type I isoform (RUNX2-I, seven exons) is regulated by proximal promoter P2. (C) Genome browser tracks of RUNX2 locus obtained from publicly available ATAC-seq data from HSC (d0), stages 4 and 5 NK cells (d21) of in vitro differentiation cultures (top panel) and histone ChIP-seq data from CB HSC (H3K27me3 and H2K27ac) and PB NK cells (H3K27ac and H3K4me3). The highlighted regions emphasise the promoter regions of the two RUNX2 isoforms. (D) Relative expression of the RUNX2 isoforms was measured in the indicated in vitro NK cell developmental stages and in ex vivo stages 4 and 5 PB NK cells using quantitative PCR (mean ± SEM; n=2–3). (E) CB-derived CD34+ HSC were transduced with either a lentiviral vector containing a RUNX2-specific shRNA or a retroviral vector with the RUNX2-I isoform cDNA. A lentiviral vector containing scrambled shRNA and an empty retroviral vector were negative controls. Transduced eGFP+ HSC (Lin−CD34+CD45RA−) were sorted and cultured in NK cell-specific differentiation conditions. Absolute cell numbers of indicated NK cell developmental stages in RUNX2(-I) knockdown and overexpression differentiation cultures were determined using flow cytometry at the indicated time points (mean ± SEM; n=4–12). Statistical significance was determined using the paired Student's t-test. *, **, ***, and **** represent statistical significance compared to control-transduced cultures with p<0.05, p<0.01, p<0.001, and p<0.0001, respectively. ND, not detectable.
Figure 1—figure supplement 1
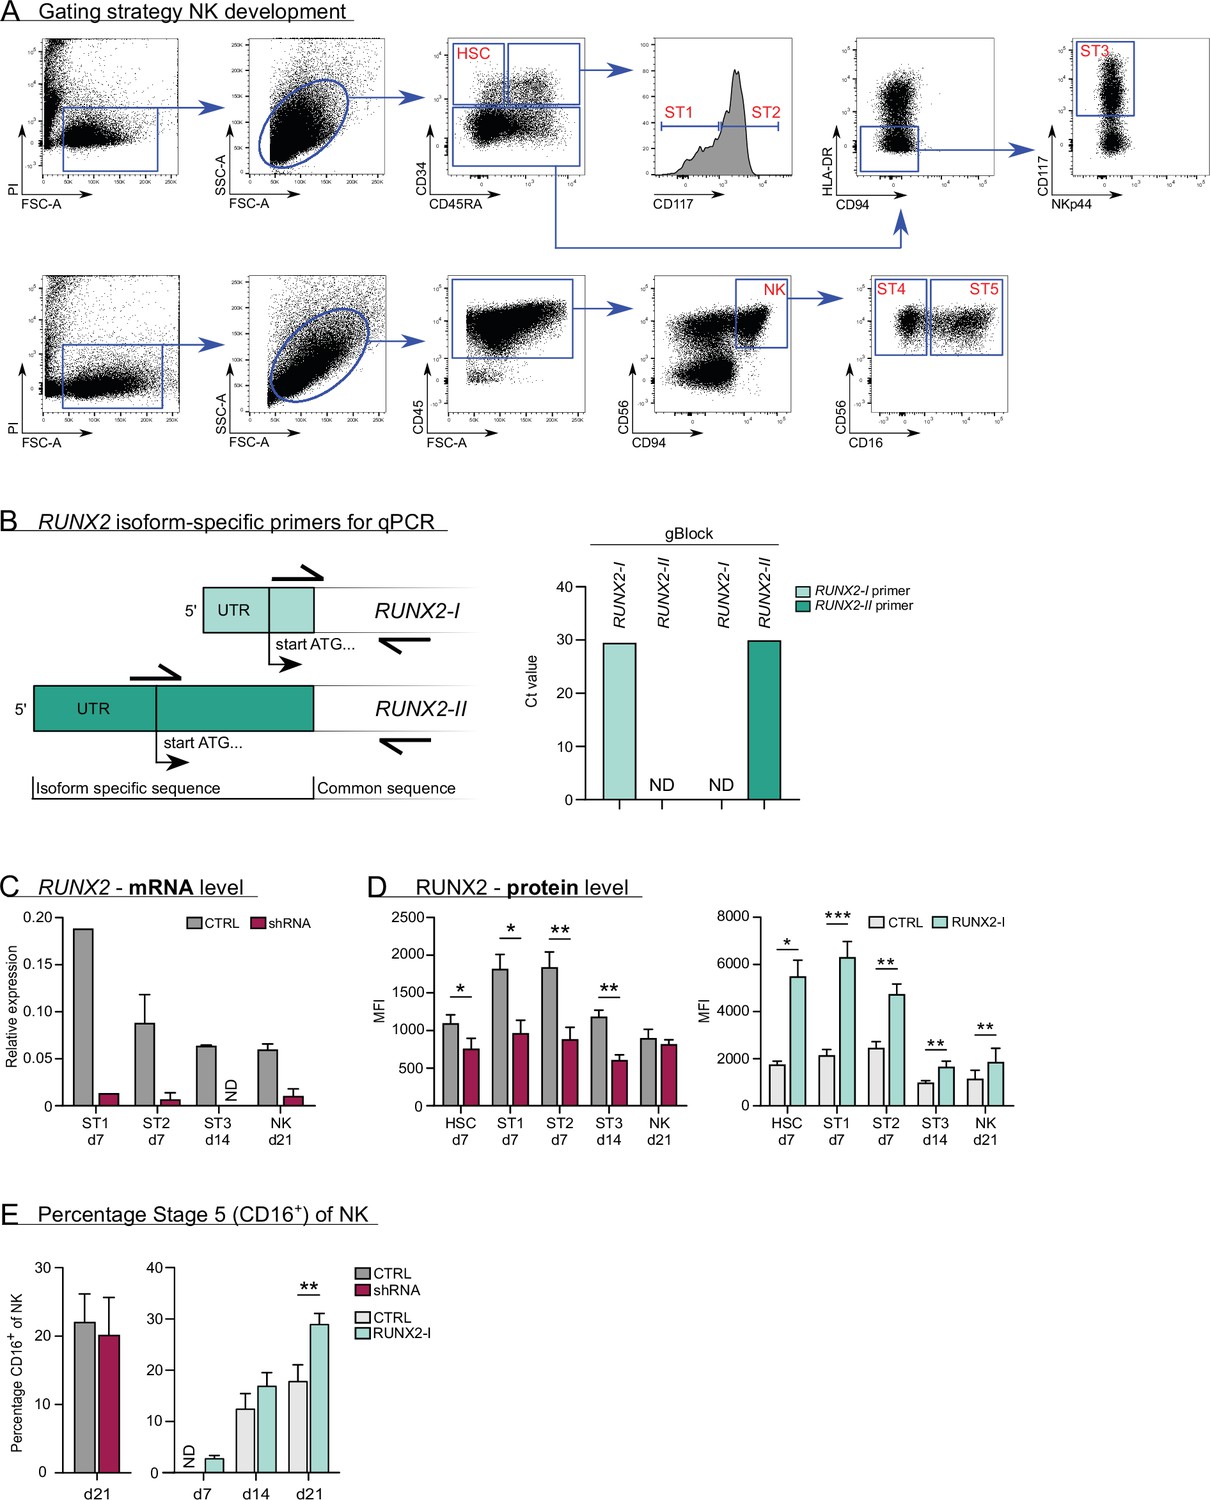
Gating strategy and expression of RUNX2 in knockdown and overexpression differentiation cultures.
(A) Flow cytometry gating strategy of natural killer (NK) cell developmental stages, including haematopoietic stem cells (HSC), stage 1, stage 2, and stage 3 progenitors and stage 4 and 5 NK cells. (B) Schematic overview of the binding sites of the RUNX2 isoform-specific primers. The reverse primer binds to a common sequence and was used for both isoforms. The forward primers dock to isoform-specific regions. The specificity of the primers was validated using gBlocks of the RUNX2-I and RUNX2-II isoforms that consisted of the 5'-UTR and the first 100–150 bp of the coding sequence. (C) Expression of RUNX2 mRNA in knockdown differentiation cultures as measured with qPCR. The developmental stages were sorted at the indicated time points (mean ± SEM; n=1–6). (D) Expression of RUNX2 protein in knockdown and overexpression differentiation cultures analysed by flow cytometry at the indicated time points (mean ± SEM; n=3–7). (E) Percentage of CD16+ cells of NK cells (stage 5) at the indicated time points in RUNX2(-I) knockdown or overexpression cultures (mean ± SEM; n=5–12). Statistical significance was determined using the paired Student's t-test. * and ** represent statistical significance compared to the control-transduced cultures with p<0.05 and p<0.01, respectively. ND, not detectable.
Figure 2 with 1 supplement
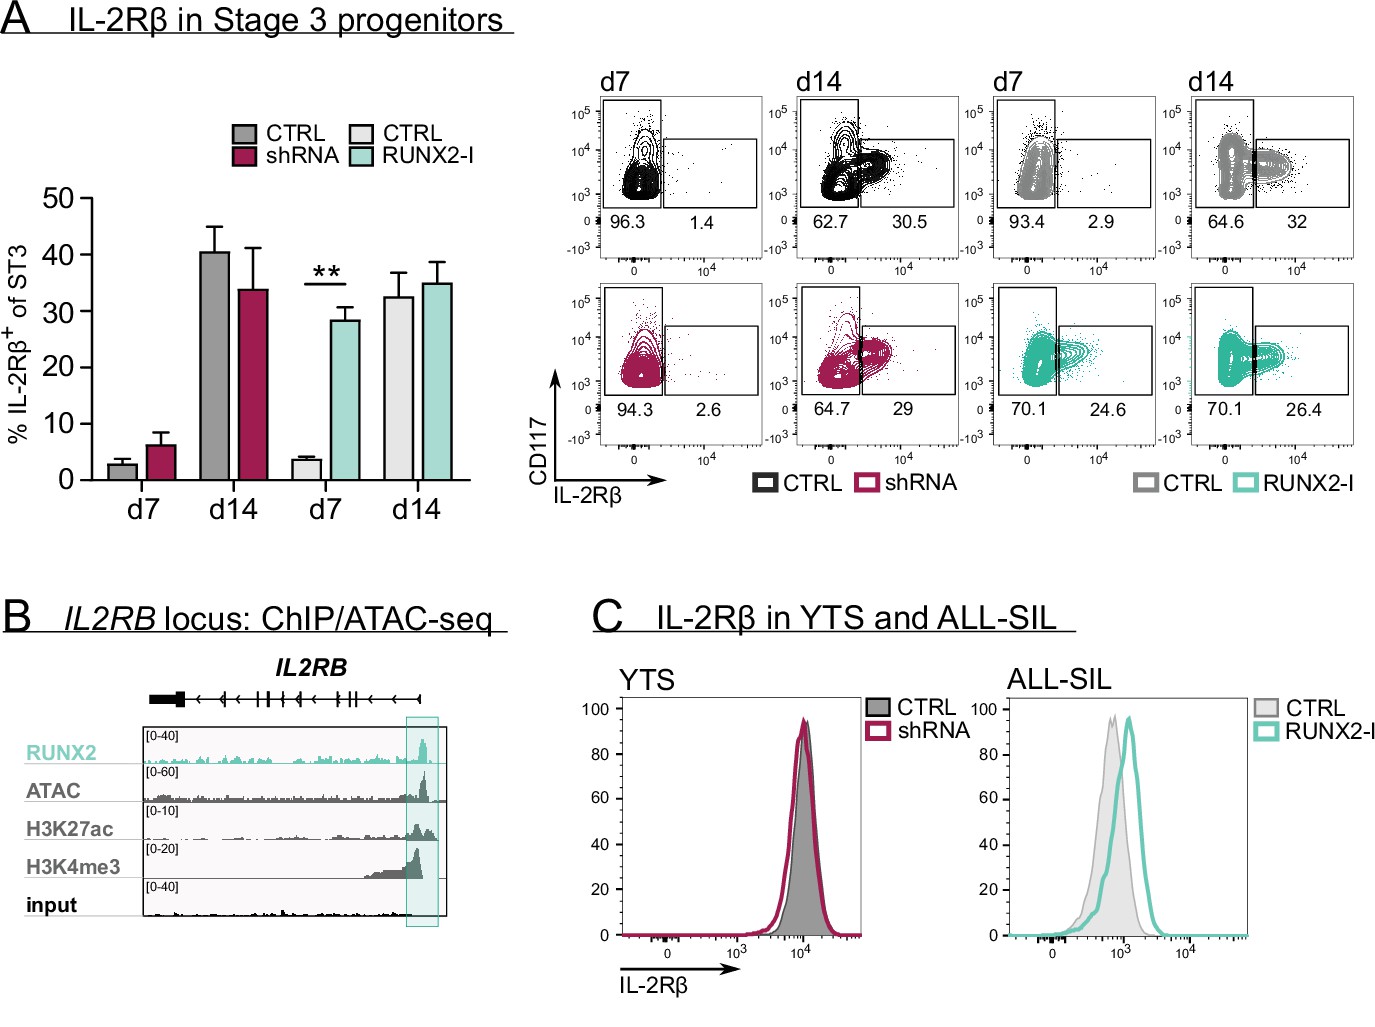
RUNX2 controls human natural killer (NK) development by directly regulating expression of IL-2Rβ.
(A) The frequency of IL-2Rβ+ cells of stage 3 progenitors was determined by flow cytometry at day 7 and day 14 of RUNX2(-I) knockdown and overexpression cultures (mean ± SEM; n=3–4). The dot plots show representative CD117 versus IL-2Rβ stainings of gated stage 3 progenitors from the indicated cultures. (B) Genome browser tracks of the IL2RB locus of RUNX2 ChIP-seq of sorted human PB NK cells and of histone (H3K27ac and H3K4me3) ChIP-seq and ATAC-seq of PB NK cells. The significant RUNX2 ChIP peaks are marked in green. (C) RUNX2 knockdown and overexpression vectors were transduced in YTS and ALL-SIL cell lines, respectively. At 4 days after transduction, expression of IL-2Rβ was examined with flow cytometry. Statistical significance is determined using the paired Student's t-test. ** represents statistical significance compared to the control-transduced cultures with p<0.01.
Figure 2—figure supplement 1
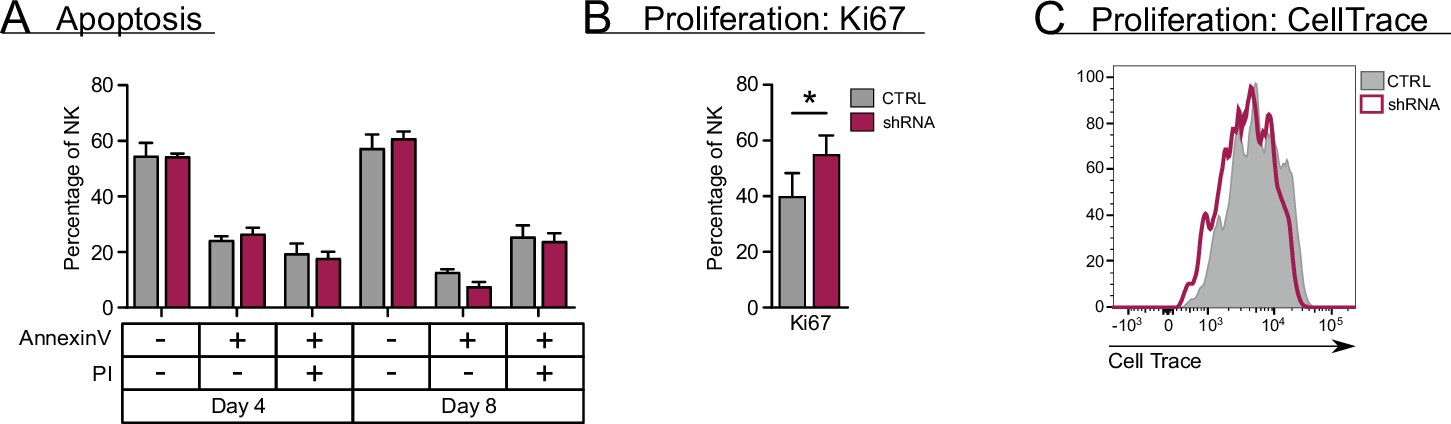
RUNX2 plays no role in apoptosis and exerts a negative effect on proliferation of natural killer (NK) cells.
(A) Sorted NK cells (CD45+CD56+CD94+) at day 18 of RUNX2 knockdown cultures were put in a secondary culture for an additional 4 and 8 days, after which the viable, dying, and dead cells were analysed with flow cytomery using AnnexinV and propidium iodide (PI) staining (mean ± SEM; n=3). (B–C) Proliferation of NK cells from RUNX2 knockdown cultures was examined by either adding Ki67-specific antibodies at d21 (mean ± SEM; n=6) (B) or by labelling NK cells with CellTrace at day 17. Sorted CellTrace-positive NK cells were subjected to a 4-day secondary culture, after which CellTrace signal was measured with flow cytometry (C). Statistical significance was determined using the paired Student's t-test. * represents statistical significance compared to the control-transduced cultures with p<0.05.
Figure 3

RUNX2 regulates a tissue residency transcriptional program.
(A–B) RUNX2 ChIP-seq analysis was performed on sorted human PB natural killer (NK) cells. (A) Locations of RUNX2 ChIP peaks relative to genomic annotations. (B) The top 7 motifs obtained from the HOMER motif enrichment analysis of the RUNX2 ChIP-seq are depicted. (C–E) NK cells from RUNX2(-I) knockdown and overexpression cultures were sorted, and the transcriptome was analysed using RNA-sequencing (n=4–5). (C) The Venn diagrams show the overlap between ChIP-seq and the indicated RNA-seq analysis. The majority of the significantly up- (‘UP’) or downregulated (‘DOWN’) genes in both the knockdown and overexpression cultures were directly targeted by RUNX2. (D) MA plots displaying down- and upregulated genes in NK cells from RUNX2(-I) knockdown (top panel) and overexpression cultures (bottom panel). Tissue residency-associated genes are depicted. (E) Gene Set Enrichment Analysis (GSEA). The gene sets were obtained from studies comparing tissue-resident (trNK) and recirculating (circNK) NK cells in the liver (top 500 up- and downregulated genes; Cuff et al., 2016) or bone marrow (Melsen et al., 2018). Up- and downregulated genes in tissue-resident versus recirculating NK cell subsets are presented in the left and right box, respectively. The datasets were obtained by RNA-seq analysis of NK cells from RUNX2(-I) overexpression (top row) and knockdown cultures (bottom row).
Figure 4 with 1 supplement
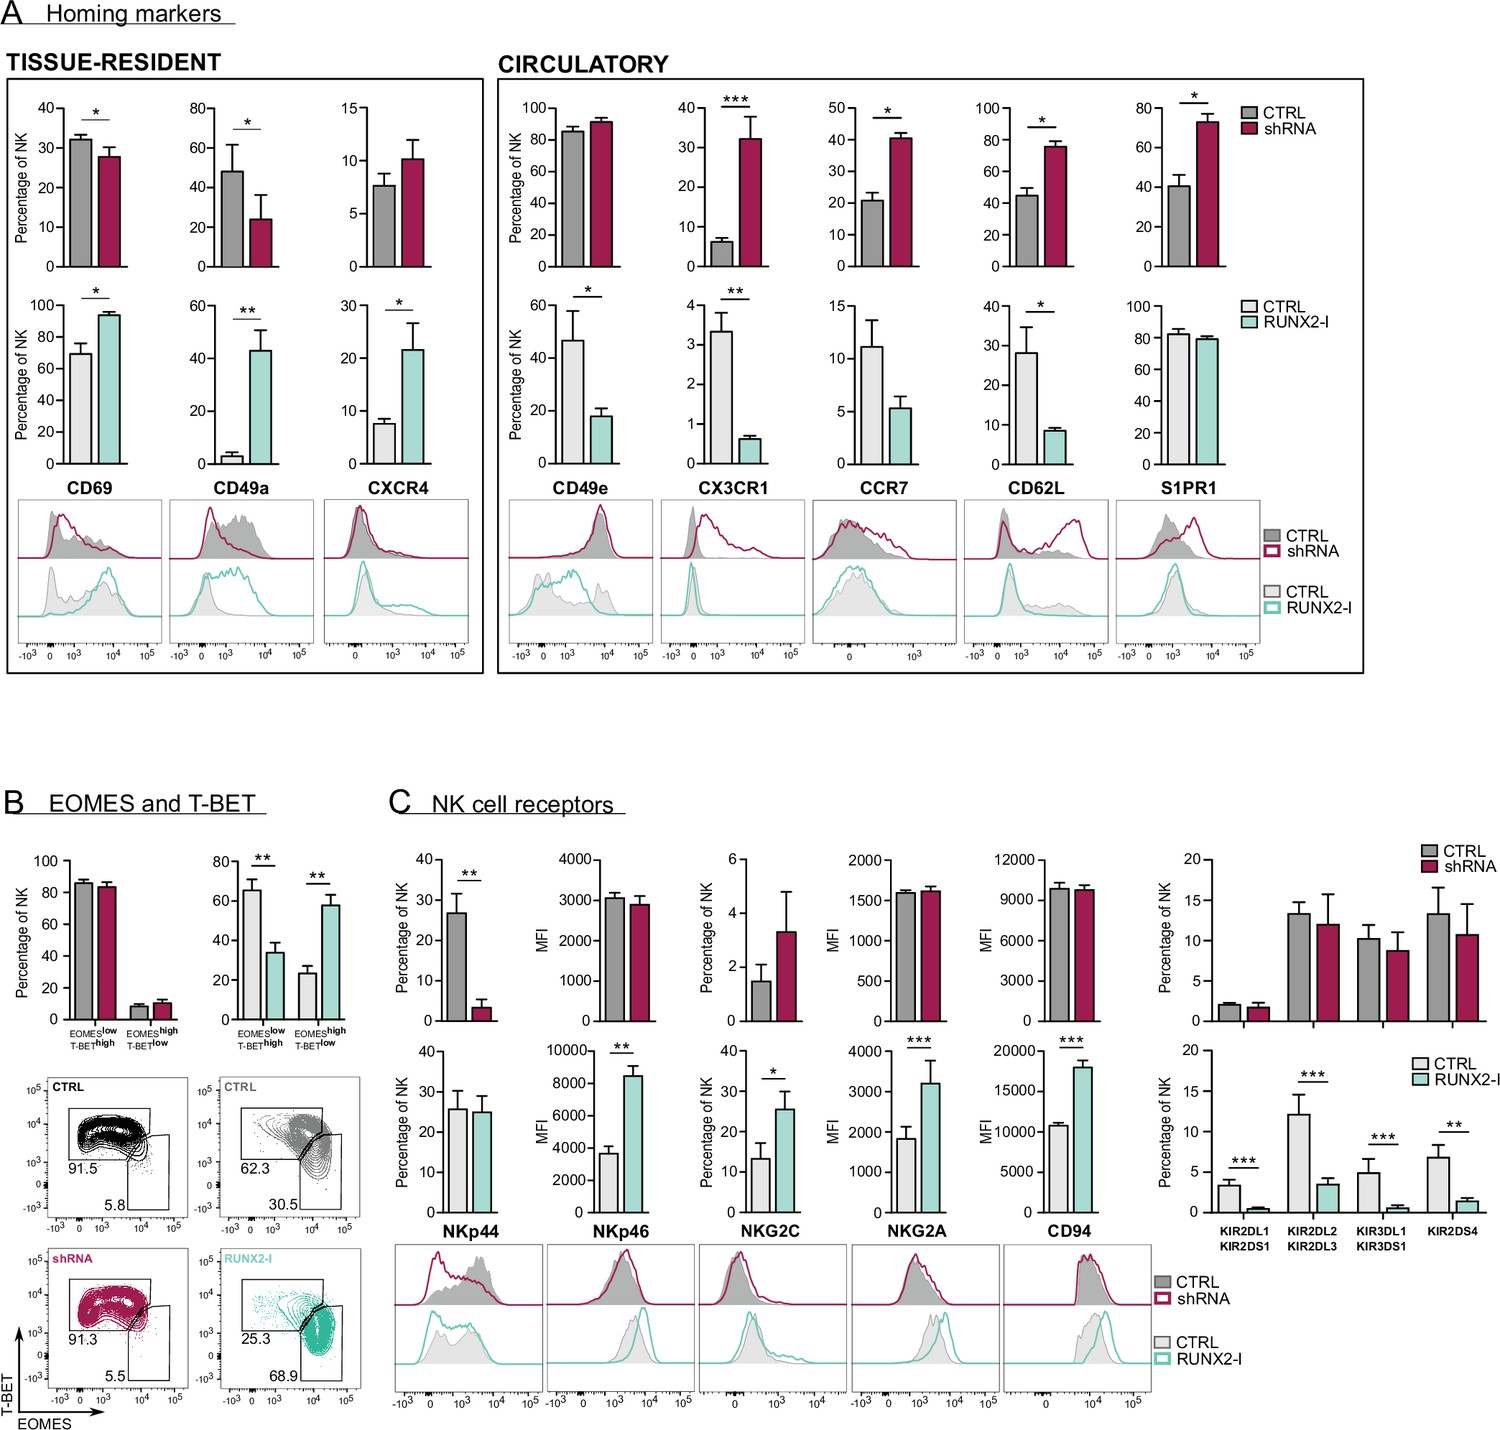
RUNX2 promotes a tissue-resident phenotype in human natural killer (NK) cells.
(A) Expression of tissue-resident (CD69, CD49a, CXCR4) and circulation-specific factors (CD49e, CX3CR1, CCR7, CD62L, S1PR1) in NK cells of RUNX2(-I) knockdown and overexpression cultures, was checked with flow cytometry (mean ± SEM; n=4). Histograms display expression of markers in representative donors. (B) Percentage of NK cells with a circulatory (EOMESlowT-BEThigh) or tissue-resident (EOMEShighT-BETlow) phenotype, determined by flow cytometry (mean ± SEM; n=4). Dot plots represent typical samples. (C) The expression of NK cell receptors NKp44, NKp46, NKG2C, NKG2A, CD94, KIR2DL1, KIR2DS1, KIR2DL2, KIR2DL3, KIR3DL1, KIR3DS1, and KIR2DS4 in gated NK cells from RUNX2(-I) knockdown and overexpression cultures was measured with flow cytometry (mean ± SEM; n=3–9). Statistical significance was determined using the paired Student's t-test. *, **, and *** represent statistical significance compared to control-transduced cultures with p<0.05, p<0.01, and p<0.001, respectively.
Figure 4—figure supplement 1
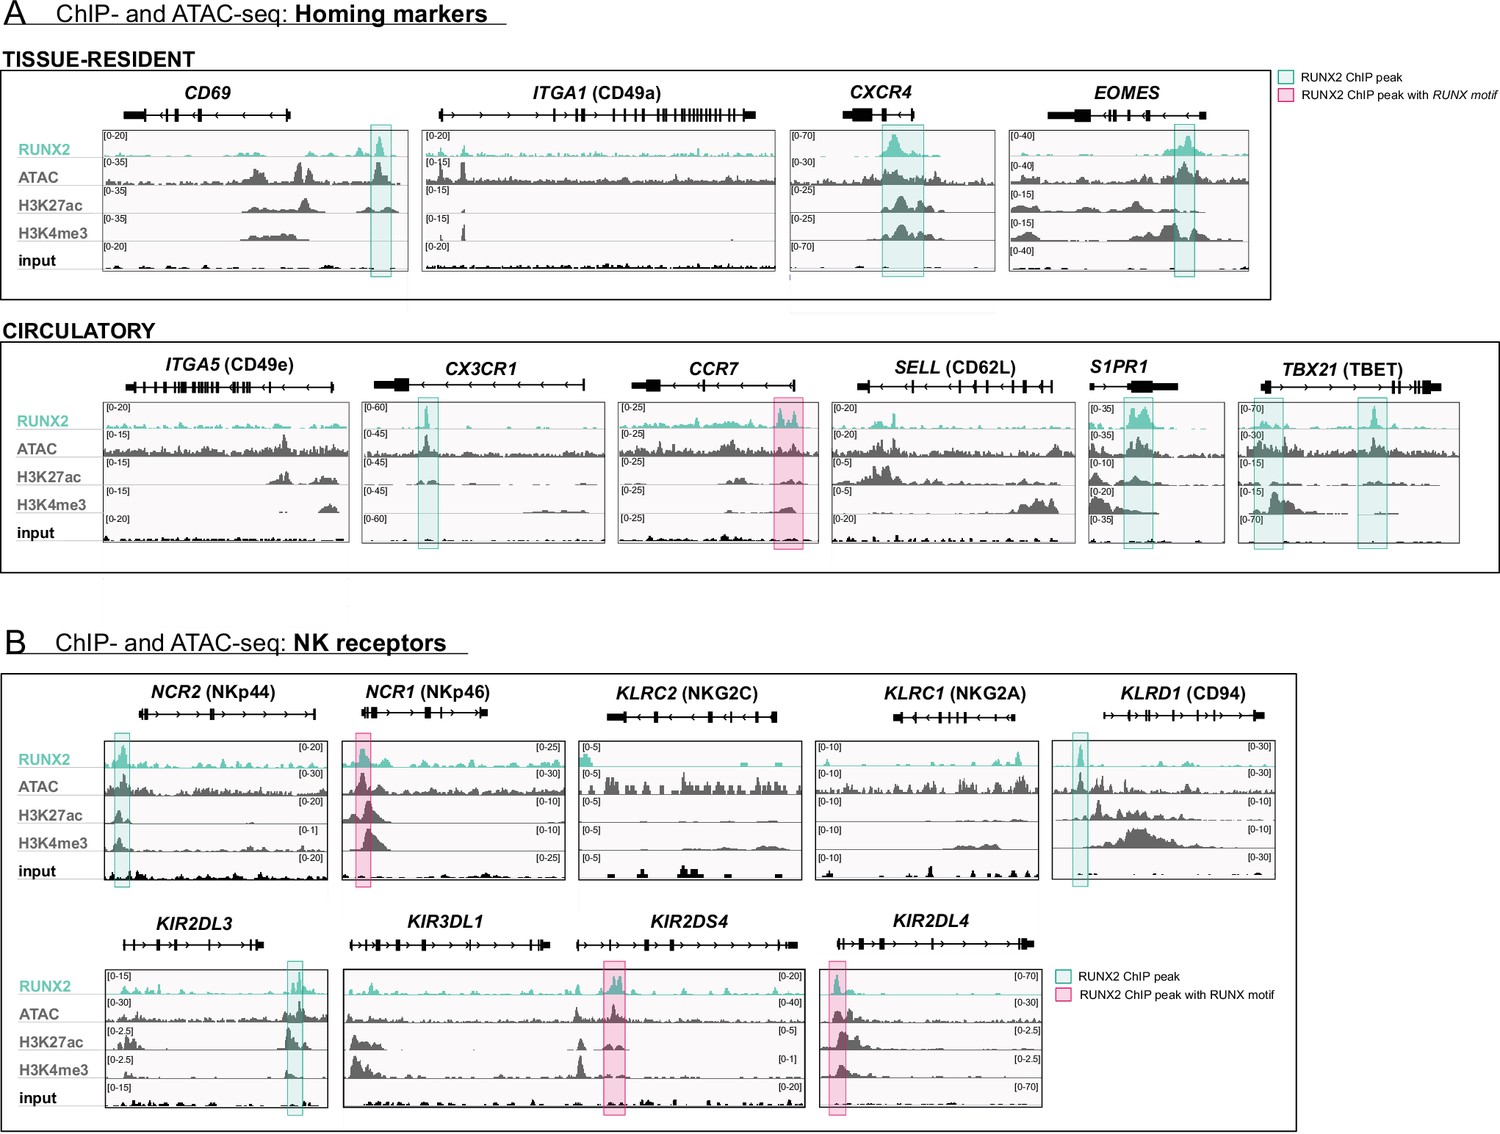
Genome browser tracks of homing molecules, transcription factors, and natural killer (NK) cell receptors associated with tissue residency.
(A) Tracks of gene loci of RUNX2 ChIP-seq, histone (H3K27ac and H3K4me3) ChIP-seq, and ATAC-seq of PB NK cells are presented for gene loci of tissue-resident (top panel) markers and circulatory associated markers (bottom panel). (B) Tracks of gene loci of NK cell receptors NCR2/NKp44, NCR1/NKp46, KLRC2/NKG2C, KIR2DS4, KLRC1/NKG2A, KLRD1/CD94, KIR2DL3, KIR3DL1, and KIR2DL4 are depicted. (A–B) Significant RUNX2 ChIP peaks are marked in green and those that also contain a RUNX2 motif are highlighted in pink.
Figure 5 with 1 supplement

RUNX2 inhibits cytokine and cytotoxic effector molecule production, but has no impact on natural killer (NK) cell killing.
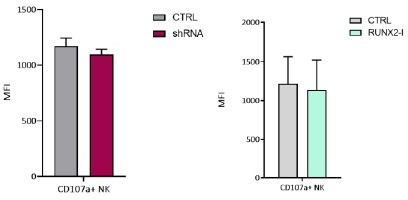
(A–C) Different functional aspects of NK cells of RUNX2(-I) knockdown and overexpression cultures were examined. (A) Sorted NK cells were incubated with K562 target cells in a (Bruno et al., 2014) chromium release killing assay at the indicated effector:target ratios for 4 hr, and the percentage of specific lysis was determined (mean ± SEM; n=6–7). (B) Percentage CD107a+ cells of NK cells as detected by flow cytometry after 2-hr co-culture with K562 cells (mean ± SEM; n=6–8). (C) Expression of cytotoxic effector molecules granzyme B (GZMB) and perforin (PRF). The mean fluorescence intensity was determined using flow cytometry (mean ± SEM; n=10). Histograms present expression of markers in representative donors. (D) Cells were stimulated in bulk with either phorbol myristate acetate (PMA)/ionomycin (6 hr), IL-12/IL-18, or IL-12/IL18/IL-15 (24 hr). IFN-γ and TNF-α production were analysed with flow cytometry (mean ± SEM; n=4–11). (E) Sorted NK cells were stimulated for 24 hr with either PMA/ionomycin, IL-12/IL-18, or IL-12/IL-18/IL-15. The supernatant was collected and the secretion of IFN-γ was analysed with ELISA (mean ± SEM; n=6). Statistical significance was determined using the paired Student's t-test. *, **, and *** represent statistical significance compared to control-transduced cultures with p<0.05, p<0.01, and p<0.001, respectively.
Figure 5—figure supplement 1
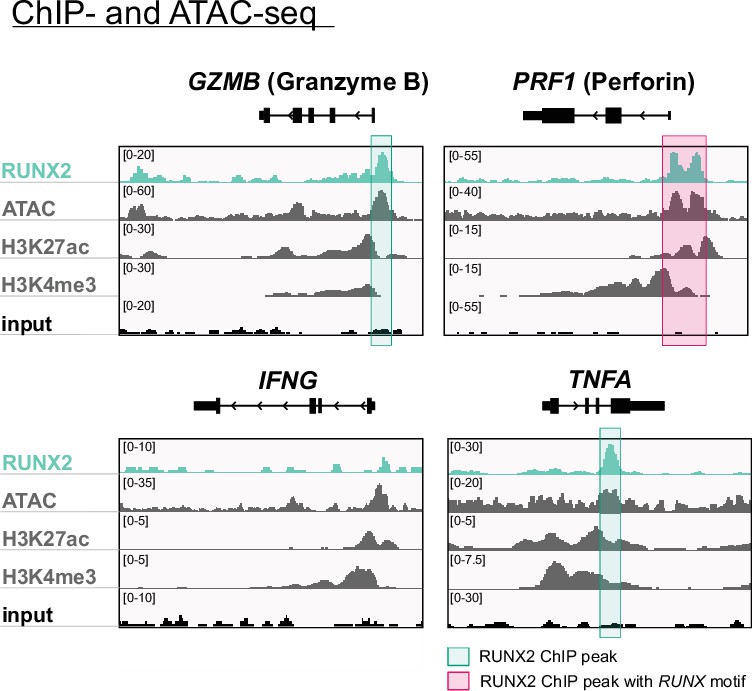
Genome browser tracks of effector molecule and cytokines.
Tracks of gene loci of RUNX2 ChIP-seq, histone (H3K27ac and H3K4me3) ChIP-seq, and ATAC-seq of PB NK cells are presented for GZMB (granzyme B), PRF1 (perforin), IFNG (IFN-γ), and TNFA (TNF-α). Significant RUNX2- ChIP peaks are marked in green, and those that also contain a RUNX motif are highlighted in pink.
Figure 6 with 1 supplement
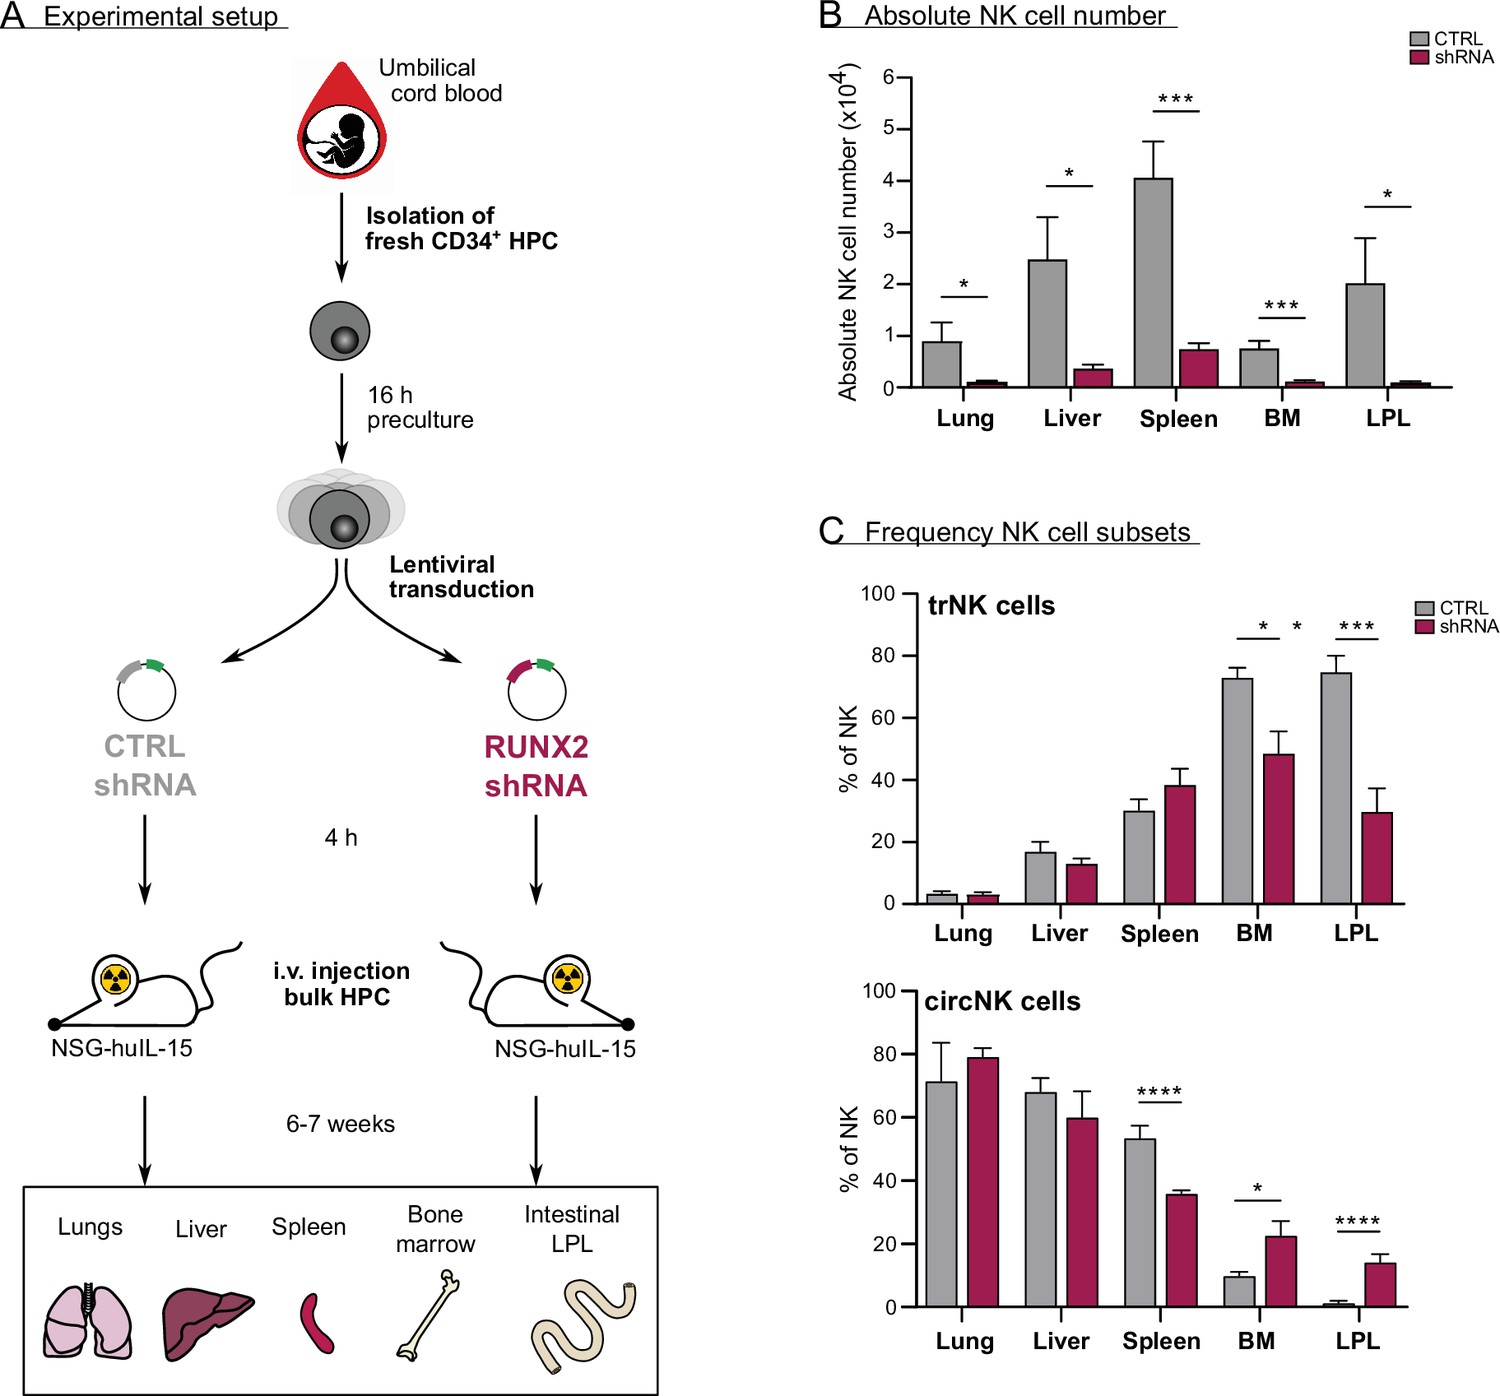
In vivo evidence for the role of RUNX2 in human natural killer (NK) cells tissue residency.
(A–C) CD34+ HPC were isolated from fresh cord blood (CB) and cultured in preculture medium for 16 hr before lentiviral transduction with either control or RUNX2 shRNA virus. Approximately 4 hr later, the control- or RUNX2 shRNA-transduced HPC were intravenously injected in NSG-huIL-15 mice, which were lethally irradiated. After 6–7 weeks, the presence of eGFP+ human NK cells (CD45+CD56+CD94+) (B) and the frequency of tissue-resident (CD69+CD49e−) and (C) circulating (CD69−CD49e+) NK cells were determined using flow cytometry (mean ± SEM; n=7). Statistical significance was determined using the unpaired Student's t-test. *, **, ***, and **** represent statistical significance compared to control mice with p<0.05, p<0.01, p<0.001, and p<0.0001, respectively. BM, bone marrow; HPC, haematopoietic progenitor cells; i.v., intravenous; LPL, lamina propria lymphocytes.
Figure 6—figure supplement 1
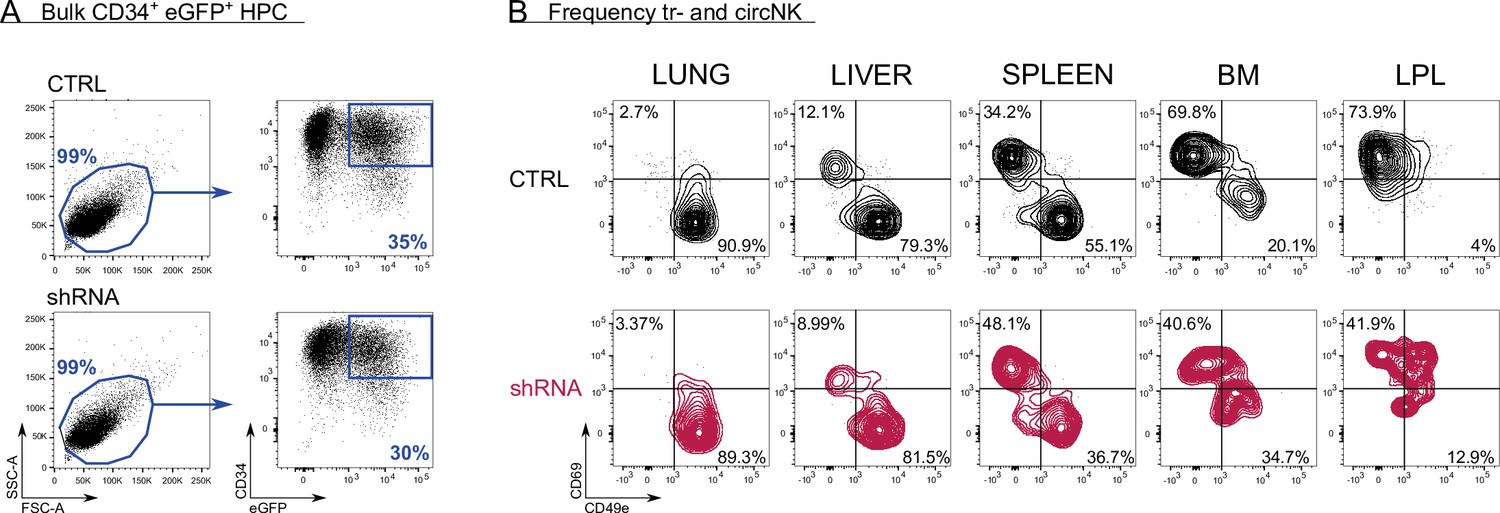
Control versus RUNX2 shRNA humanised mouse model.
(A) After isolating CD34+ haematopoietic progenitor cells (HPC) from fresh cord blood (CB), the cells were precultured for 16 hr, after which they were transduced with either control (top plots) or RUNX2 shRNA (bottom plots) lentivirus. The percentage of eGFP+CD34+ HPC was determined 48 hr later and is indicated. (B) At 6–7 weeks post-injection of HPC, mice (NSG-huIL-15) were sacrificed and the frequency of tissue-resident (CD69+CD49e−) and circulating (CD69−CD49e+) eGFP+ NK cells (CD45+CD56+CD94+) in lung, liver, spleen, bone marrow (BM), and intestinal lamina propria (LPL) was determined. The FACS plots of two representative mice are depicted (control top row, black; RUNX2 shRNA bottom row, red).
Author response image 1
Author response image 2
Tables
Table 1
Antibodies and kits used in flow cytometric analysis.
| ANTIBODIES | ||||
|---|---|---|---|---|
| Marker | Alternative | Fluorochrome | Clone | Supplier |
| Fc blocking agent (human) | / | / | / | Miltenyi Biotec, Leiden, The Netherlands |
| Anti-mouse FcγII/III | / | Unconjugated | 2.4G2 | Kindly provided by Dr. J. Unkeless, Mount Sinai School of Medicine, NY |
| CD34 | CD34 | Phycoerythrin (PE), Pacific Blue (PB) | AC136 | Miltenyi Biotec, Leiden, The Netherlands |
| CD45RA | CD45RA | Allophycocyanin (APC) | HI100 | Biolegend, San Diego, CA |
| CD45 | CD45 | Allophycocyanin/Fire 750 (APC-Fire) | 2D1 | Biolegend, San Diego, CA |
| CD117 | KIT | Phycoerythrin-Cyanin7 (PECy7) | 104D2 | Thermo Fischer Scientific, Waltham, MA |
| CD94 | KLRD1 | Peridinin Chlorophyll Protein-Cyanin5.5 (PerCP-Cy5,5) | DX22 | Biolegend, San Diego, CA |
| CD56 | NCAM1 | VioBlue (VB), Allophycocyanin (APC) | 5.1H11 | Biolegend, San Diego, CA |
| CD16 | FcγRIIIA | Phycoerythrin (PE), Allophycocyanin (APC) | B73.1 | Biolegend, San Diego, CA |
| CD3 | CD3 | Allophycocyanin (APC) | SK7 | BD Biosciences, San Jose, CA |
| CD14 | CD14 | Allophycocyanin (APC) | REA599 | Miltenyi Biotec, Leiden, The Netherlands |
| HLA-DR | HLA-DR | eFluor780 | LN3 | Thermo Fischer Scientific, Waltham, MA |
| NKp44 | CD336;NCR2 | eFluor450, Allophycocyanin (APC) | 44.189 | Thermo Fischer Scientific, Waltham, MA |
| CD19 | CD19 | Allophycocyanin (APC) | SJ25C1 | Thermo Fischer Scientific, Waltham, MA |
| CD122 | IL2RB | Phycoerythrin (PE) | MIKβ3 | BD Biosciences, San Jose, CA |
| EOMES | EOMES | Phycoerythrin (PE), Allophycocyanin (APC) | WD1928 | Thermo Fischer Scientific, Waltham, MA |
| T-BET | T-BET | Phycoerythrin (PE) | 4B10 | Thermo Fischer Scientific, Waltham, MA |
| HELIOS | IKZF2 | Allophycocyanin (APC) | 22F6 | Biolegend, San Diego, CA |
| PLZF | ZBTB16 | Phycoerythrin (PE) | R17-809 | BD Biosciences, San Jose, CA |
| CD107a | LAMP1 | Phycoerythrin (PE) | H4A3 | BD Biosciences, San Jose, CA |
| Granzyme B | Granzyme B | Phycoerythrin (PE) | GB11 | Thermo Fischer Scientific, Waltham, MA |
| Perforin | Perforin | Phycoerythrin (PE) | dG9 | Thermo Fischer Scientific, Waltham, MA |
| IFN-γ | IFN-γ | eFluor 660 | 4 S.B3 | Thermo Fischer Scientific, Waltham, MA |
| TNF-α | TNF-α | Phycoerythrin (PE) | Mab11 | Thermo Fischer Scientific, Waltham, MA |
| RUNX1 | AML1, CBFA2 | Phycoerythrin (PE) | RXDMC | Thermo Fischer Scientific, Waltham, MA |
| RUNX2 | AML3, CBFA1 | Phycoerythrin (PE) | D1L7F | Cell Signalling Technologies, Leiden, The Netherlands |
| RUNX3 | AML2, CBFA3 | Phycoerythrin (PE) | R3-5G4 | BD Biosciences, San Jose, CA |
| NKp46 | CD335;NCR1 | Phycoerythrin-Cyanin7 (PECy7) | 9E2 | Biolegend, San Diego, CA |
| NKG2C | CD159c | Phycoerythrin (PE) | FAB138P | R&D systems, Minneapolis MN |
| NKG2A | CD159a | Allophycocyanin (APC) | REA110 | Miltenyi Biotec, Leiden, The Netherlands |
| CD158a,h | KIR2DL1/KIR2DS1 | Phycoerythrin (PE) | 3B6.B | Beckman Coulter, Brea, CA |
| CD158b1/b2 | KIR2DL2/KIR2DL3 | Phycoerythrin (PE) | GL183 | Beckman Coulter, Brea, CA |
| CD158i | KIR4DS1 | Phycoerythrin (PE) | FES172 | Beckman Coulter, Brea, CA |
| CD158e1/e2 | KIR3DL1/KIR3DS1 | Phycoerythrin (PE) | Z27.3.7 | Beckman Coulter, Brea, CA |
| CD69 | CD69 | Phycoerythrin (PE) | FN50 | Biolegend, San Diego, CA |
| CD49a | ITGA1 | Alexa Fluor 647 | TS2/7 | Biolegend, San Diego, CA |
| CD49e | ITGA5 | Allophycocyanin (APC) | IlA1 | BD Biosciences, San Jose, CA |
| CX3CR1 | V28, GPR13 | Phycoerythrin (PE) | 2A9-1 | Biolegend, San Diego, CA |
| CCR7 | CD197 | Allophycocyanin/Fire 750 (APC-Fire) | G043H7 | Biolegend, San Diego, CA |
| CD62L | L-selectin | Allophycocyanin (APC) | DREG-56 | Biolegend, San Diego, CA |
| S1PR1 | CD363 | eFluor660 | SW4GYPP | Thermo Fischer Scientific, Waltham, MA |
| CXCR4 | CD184 | Phycoerythrin (PE) | 12G5 | BD Biosciences, San Jose, CA |
| Ki67 | Ki67 | Phycoerythrin (PE) | SolA15 | Thermo Fischer Scientific, Waltham, MA |
| Streptavidin | Streptavidin | Allophycocyanin (APC) | / | BD Biosciences, San Jose, CA |
| Fixable viability dye | Fixable viability dye | eFluor506 | / | Thermo Fischer Scientific, Waltham, MA |
| KITS | ||||
| AnnexinV apoptosis detection kit | Allophycocyanin (APC) | / | Thermo Fischer Scientific, Waltham, MA | |
| FoxP3/Transcription Factor Staining Buffer set | / | / | Thermo Fischer Scientific, Waltham, MA | |
Table 2
qPCR primers.
| Gene | Sense | Sequence (5’ → 3’) |
|---|---|---|
| RUNX2-I | Sense | ATGCGTATTCCCGTAGATCC |
| Antisense | GGGCTCACGTCGCTCATTT | |
| RUNX2-II | Sense | AGGAGGGACTATGGCATCAAAC |
| Antisense | GGGCTCACGTCGCTCATTT | |
| RUNX2 (flanking shRNA binding site) | Sense | CACCACTCACTACCACACCT |
| Antisense | AGCATTCTGGAAGGAGACCG | |
| GAPDH | Sense | TCCTCTGACTTCAACAGCGACA |
| Antisense | GTGGTCGTTGAGGGCAATG | |
| TBP | Sense | CACGAACCACGGCACTGATT |
| Antisense | TTTTCTTGCTGCCAGTCTGGAC | |
| ACTB | Sense | ATGACCCAGATCATGTTTGAGA |
| Antisense | AGAGGCGTACAGGGATAGCA |
Table 3
gBlock sequences of RUNX2 isoforms.
| gBlock | Sequence |
|---|---|
| RUNX2-I | GTCTCGCCTTCACCCCCCCAATTTCCTCCTTGCCCCTCATTTCCACCCTCCTCCCCCTCCCCCGGCCACTTCGCTAACTTGTGGCTGTTGTGATGCGTATTCCCGTAGATCCGAGCACCAGCCGGCGCTTCAGCCCCCCCTCCAGCAGCCTGCAGCCCGGCAAAATGAGCGACGTGAGCCCGGTGGTGGCTGCG |
| RUNX2-II | CAAACTTTCTCCAGGAGGACAGCAAGAAGTCTCTGGTTTTTAAATGGTTAATCTCCGCAGGTCACTACCAGCCACCGAGACCAACAGAGTCAGTGAGTGCTCTCTAACCACAGTCTATGCAGTAATAGTAGGTCCTTCAAATATTTGCTCATTCTCTTTTTGTTTTGTTTCTTTGCTTTTCACATGTTACCAGCTACATAATTTCTTGACAGAAAAAAATAAATATAAAGTCTATGTACTCCAGGCATACTGTAAAACTAAAACAAGGTTTGGGTATGGTTTGTATTTTCAGTTTAAGGCTGCAAGCAGTATTTACAACAGAGGGTACAAGTTCTATCTGAAAAAAAAAGGAGGGACTATGGCATCAAACAGCCTCTTCAGCACAGTGACACCATGTCAGCAAAACTTCTTTTGGGATCCGAGCACCAGCCGGCGCTTCAGCCCCCCCTCCAGCAGCCTGCAGCCCGGCAAAATGAGCGACGTGAGCCCGGTGGTGGCTG |
Additional files
-
MDAR checklist
- https://cdn.elifesciences.org/articles/80320/elife-80320-mdarchecklist1-v1.pdf
-
Supplementary file 1
RUNX2-specific ChIP-seq data of human peripheral blood NK cells.
- https://cdn.elifesciences.org/articles/80320/elife-80320-supp1-v1.xlsx
-
Supplementary file 2
RNA-seq data of sorted human NK cells from RUNX2 knockdown cultures.
- https://cdn.elifesciences.org/articles/80320/elife-80320-supp2-v1.xlsx
-
Supplementary file 3
RNA-seq data of sorted human NK cells from RUNX2-I overexpression cultures.
- https://cdn.elifesciences.org/articles/80320/elife-80320-supp3-v1.xlsx
-
Supplementary file 4
Overlap of RNA-seq and ChIP-seq data sets.
- https://cdn.elifesciences.org/articles/80320/elife-80320-supp4-v1.xlsx
-
Supplementary file 5
GSEA analysis leading edge genes.
- https://cdn.elifesciences.org/articles/80320/elife-80320-supp5-v1.xlsx
Download links
A two-part list of links to download the article, or parts of the article, in various formats.
Downloads (link to download the article as PDF)
Open citations (links to open the citations from this article in various online reference manager services)
Cite this article (links to download the citations from this article in formats compatible with various reference manager tools)
The transcription factor RUNX2 drives the generation of human NK cells and promotes tissue residency
eLife 11:e80320.
https://doi.org/10.7554/eLife.80320


