Mature parvalbumin interneuron function in prefrontal cortex requires activity during a postnatal sensitive period
- Department of Psychiatry, Columbia University Medical Center, United States
- Division of Developmental Neuroscience, New York State Psychiatric Institute, United States
- Division of Molecular Therapeutics, New York Psychiatric Institute, United States
- Department of Biostatistics, Mailman School of Public Health, Columbia University Medical Center, United States
- Division of Integrative Neuroscience, New York State Psychiatric Institute, United States
- Department of Molecular Pharmacology & Therapeutics, Columbia University Medical Center, United States
Figures
Figure 1 with 1 supplement
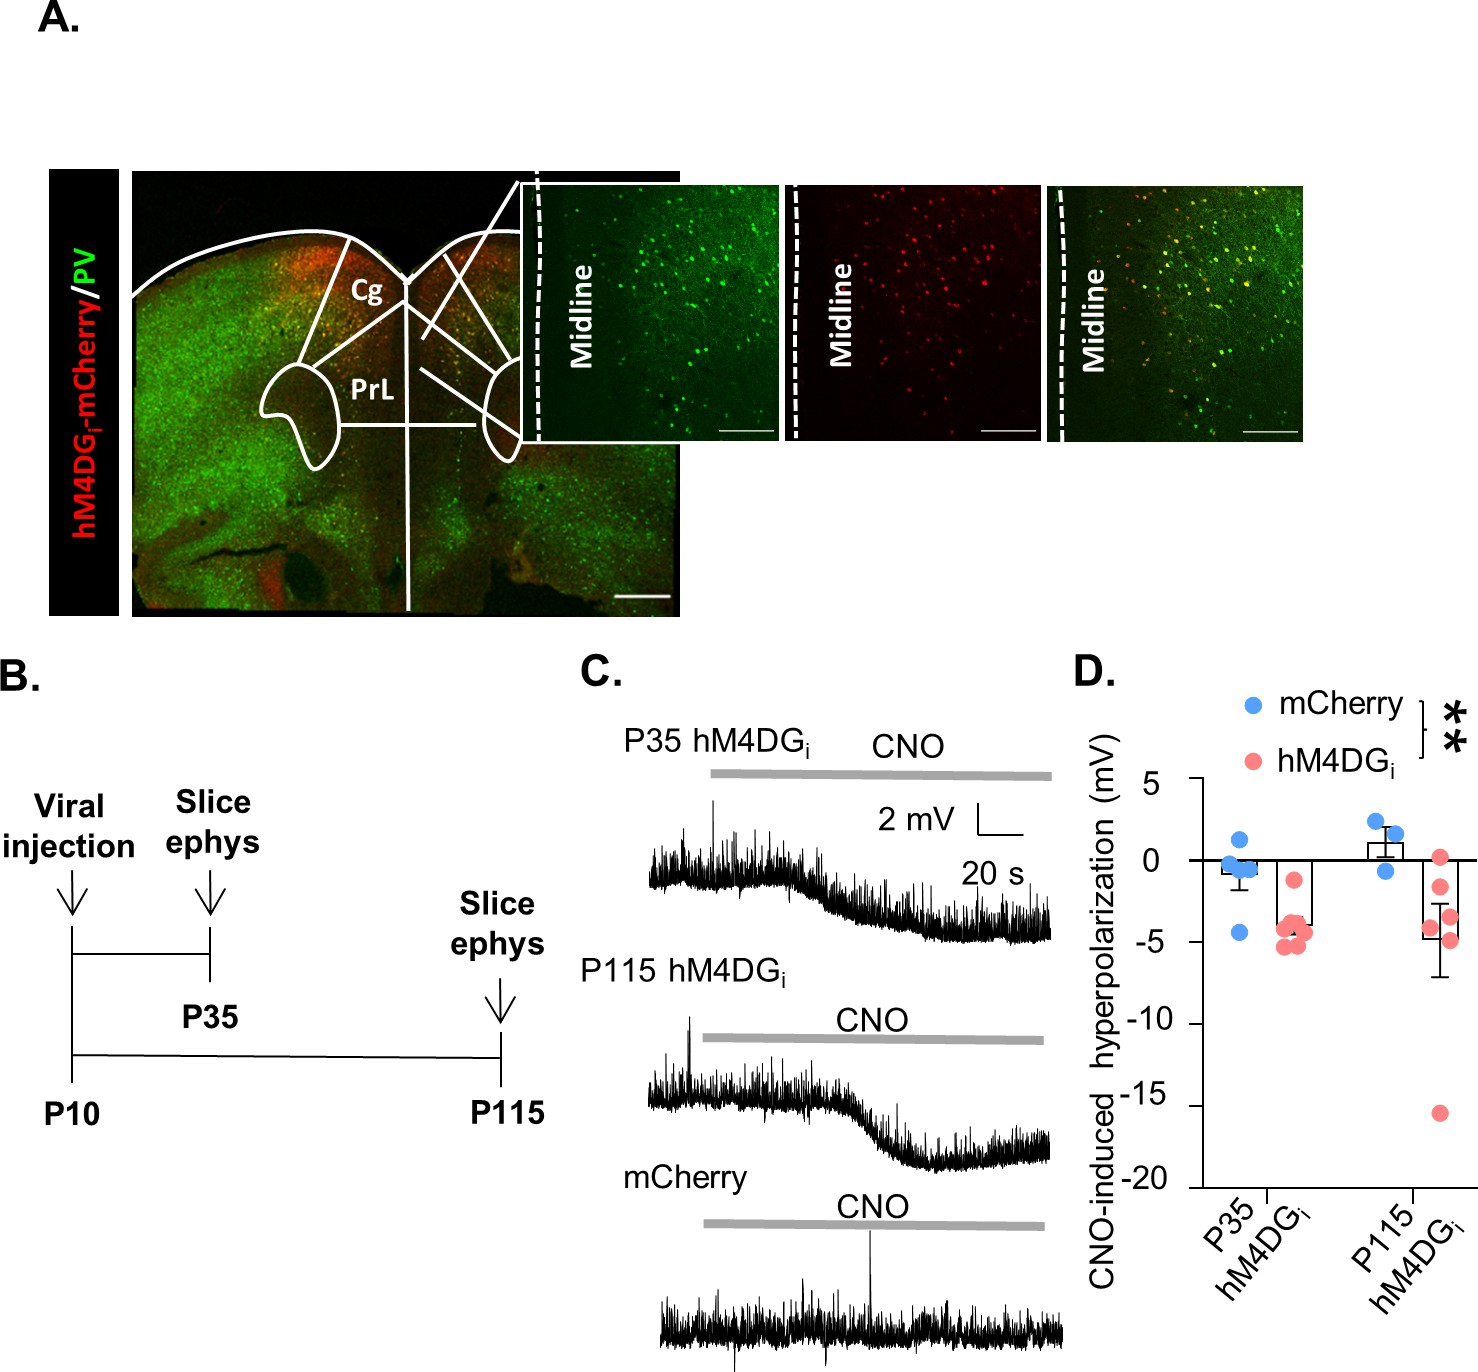
A chemogenetic system to reversibly inhibit medial PFC (mPFC) parvalbumin (PV) interneurons during development or adulthood.
(A) Illustration of hM4DGi-mCherry viral (red) and PV (green) expression in mPFC PV cells (PrL: prelimbic; Cing: cingulate). (B) Timeline of experiments for validating the function of hM4DGi. Mice were injected with virus at P10, and whole-cell patch clamp recordings (slice ephys) were made at P35 and P115 from cells expressing hM4DGi-mCherry or mCherry at baseline and in response to bath application of 10 µM clozapine-n-oxide (CNO). (C) Representative traces illustrating hyperpolarization of the resting membrane potential of hM4DGi-expressing, but not mCherry-expressing, cells following bath application of CNO. (D) Quantification of CNO-induced hyperpolarization. CNO-induced hyperpolarization was significantly greater in hM4DGi-expressing cells than in mCherry-expressing cells, regardless of the age that the measurements were made (n = 5 P35 and 3 P115 mCherry-expressing cells and 7 P35 and 6 P115 hM4DGi-expressing cells). Dots indicate individual cell responses and bars indicate mean ± standard error of the mean (SEM). Significance evaluated by two-way analysis of variance (ANOVA). Scale bars are 250 µm. **p < 0.01.
-
Figure 1—source data 1
Slice electrophysiology data relevant to Figure 1.
- https://cdn.elifesciences.org/articles/80324/elife-80324-fig1-data1-v1.xlsx
Figure 1—figure supplement 1
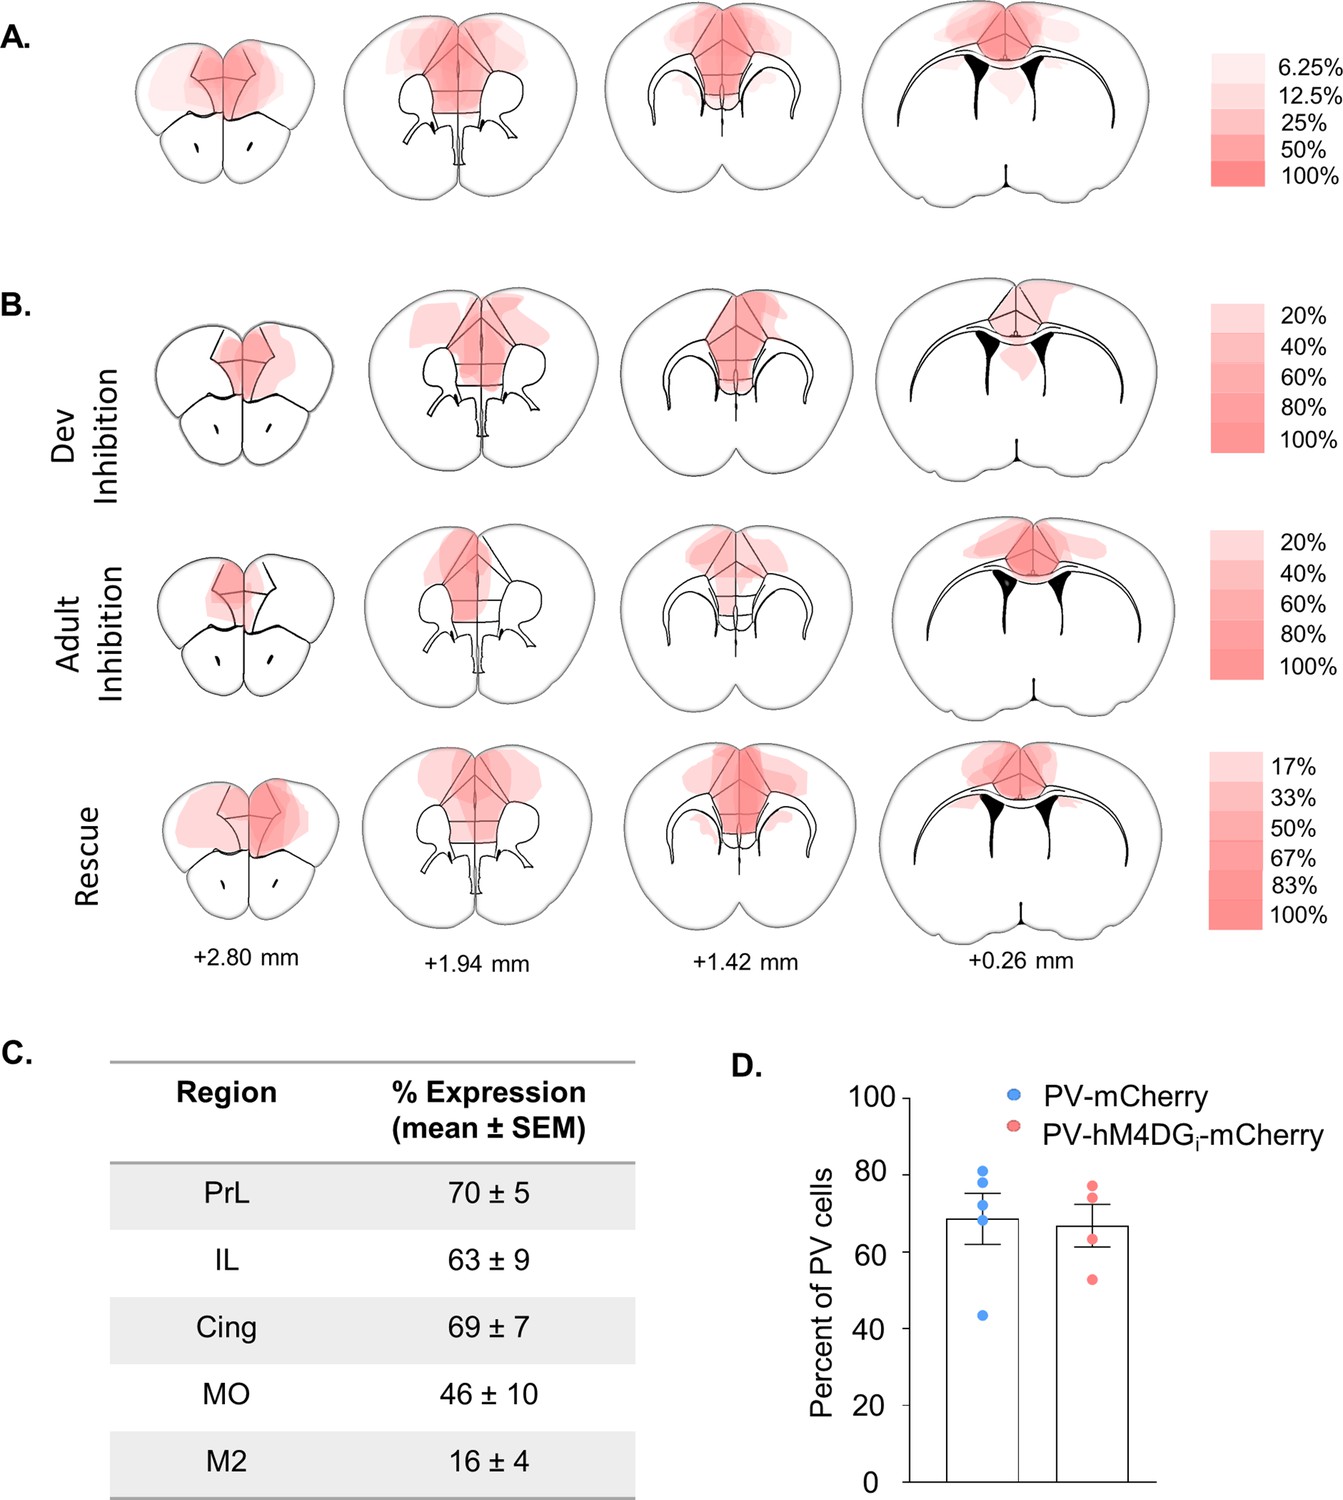
Characterization of viral expression.
(A) Expression profile of all hM4DGi-injected animals (n = 16). Heat index depicts percent of animals with expression in a given region. (B) Expression profile of hM4DGi-injected animals shown separately for Developmental Inhibition (n = 5), Adult Inhibition (n = 5), and Rescue (n = 6) cohorts. Heat index depicts percent of animals with expression in a given region. (C) The percent of the area of each cortical region showing viral expression depicted for all Dev Inhibition/Rescue animals (n = 11). (D) The percent of parvalbumin (PV) cells in prelimbic cortex coexpressing either the mCherry (n = 5) or hM4DGi-mCherry (n = 4) virus was quantified using stereology. Bars show the mean ± standard error of the mean (SEM) and dots show individual animal values.
-
Figure 1—figure supplement 1—source data 1
Viral expression data relevant to Figure 1—figure supplement 1.
- https://cdn.elifesciences.org/articles/80324/elife-80324-fig1-figsupp1-data1-v1.xlsx
Figure 2 with 4 supplements
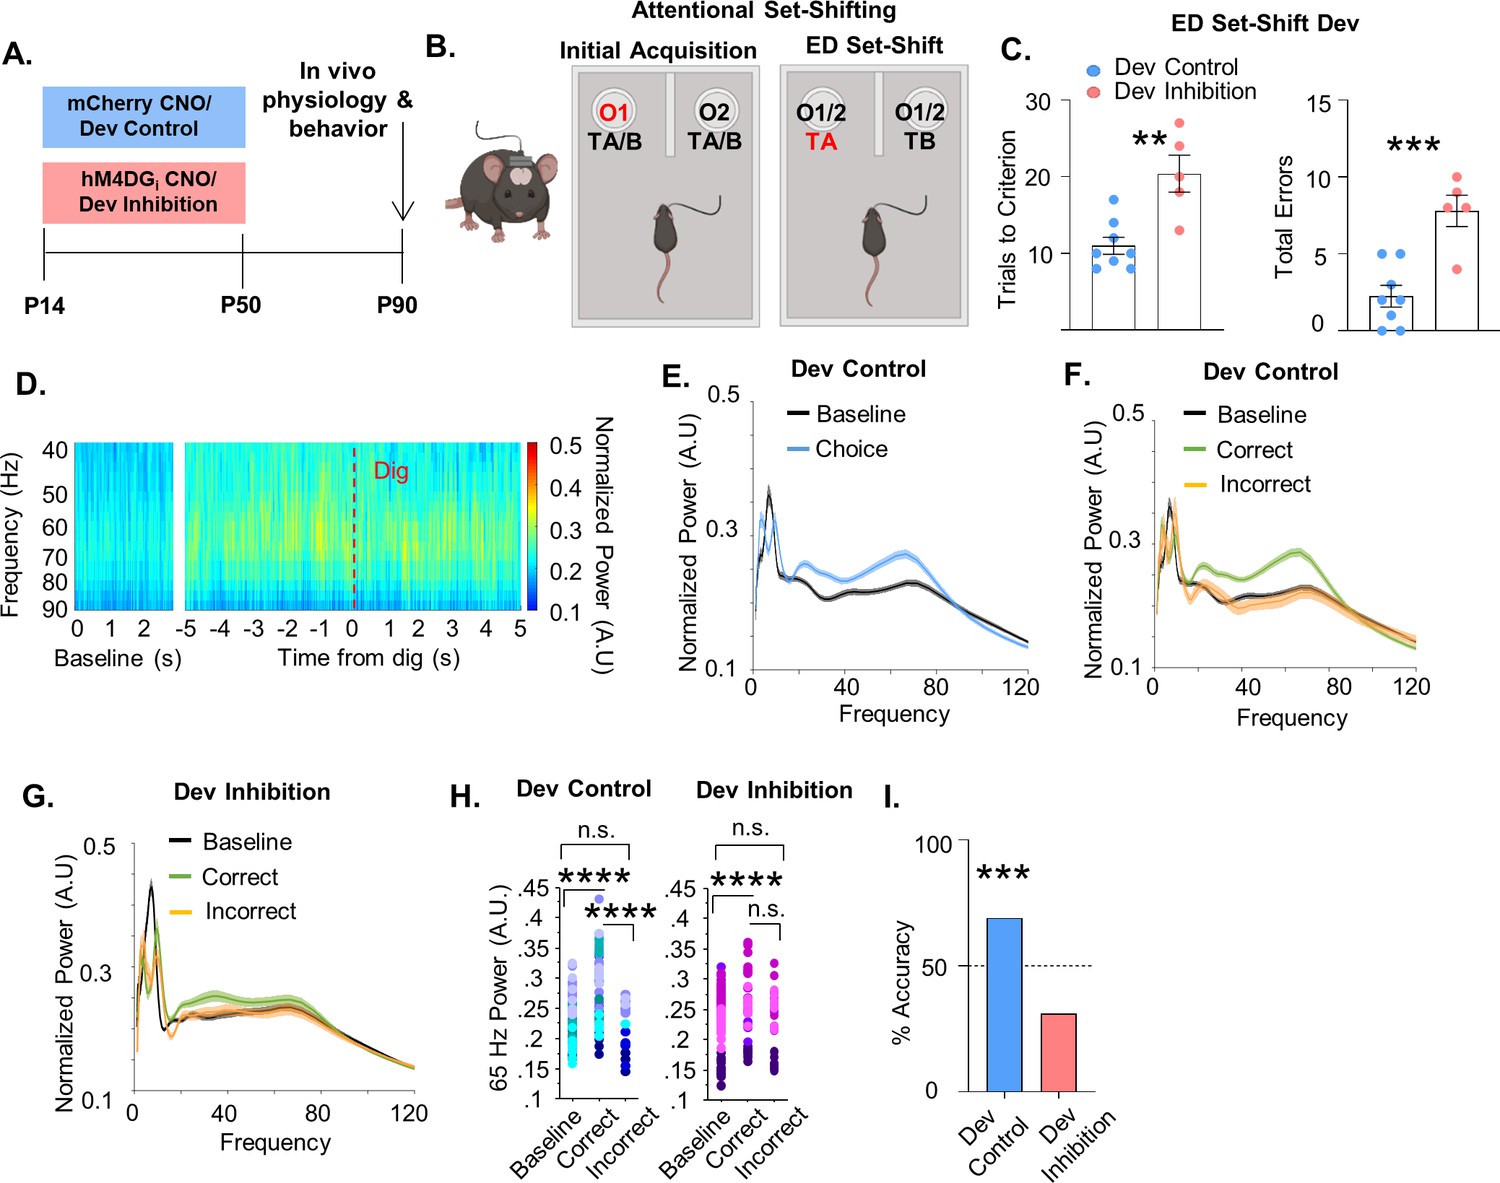
Developmental inhibition of medial PFC (mPFC) parvalbumin (PV) interneurons results in persistent alterations in prefrontal network functioning and behavior in adulthood.
(A) Experimental timeline. Clozapine-n-oxide (CNO) was administered between P14 and P50 to mice-expressing hM4DGi-mCherry or mCherry in mPFC PV interneurons to produce Dev Inhibition or Control mice, respectively. At P90 mice were evaluated in an attentional set-shifting task while local field potentials were simultaneously recorded in the mPFC as illustrated in the schematic in (B). (C) Dev Inhibition mice (n = 5) take significantly more trials to reach criterion (left) and make more errors (right) than Dev Controls (n = 8). Dots indicate individual animal responses and bars indicate mean ± standard error of the mean (SEM). (D) Heat map depicting normalized power (in artificial units, A.U.) as a function of frequency in the first 3 s of the task (baseline) and in a 10-s window centered around when the Dev Control animals make their choice (dig, dotted red line). Gamma frequency activity (here shown between 40 and 90 Hz) increases just prior to choice. (E) Normalized power versus frequency in the 3 s preceding choice (‘choice’, blue line) versus in the first 3 s of the task (‘baseline’, black line) in Dev Control animals (n = 79 baseline and choice trials from 8 mice). (F) Normalized power versus frequency for the choice period prior to correct (green) or incorrect (orange) choices, or in the baseline (black) period for Dev Control (n = 79 baseline/62 correct/17 incorrect trials from 8 mice) or (G) Dev Inhibition animals (n = 69 baseline/41 correct/28 incorrect trials from 4 mice). Lines and shading indicate mean ± SEM. (H) 65-Hz frequency range power is significantly elevated just prior to correct, but not incorrect, choices relative to baseline for both Dev Control (left, blue dots) and Dev Inhibition (right, pink/purple dots) animals. 65-Hz frequency range power is significantly greater in correct versus incorrect choices in Dev Control, but not Dev Inhibition, mice. (I) Choice period 65-Hz frequency range power can predict trial outcome in Dev Control animals (left, blue bar, n = 54 accurately predicted outcomes of 78 tested trials) but not Dev Inhibition animals (right, light red bar, n = 20 accurately predicted outcomes of 64 tested trials). Bar indicates accuracy of model. Dotted line indicates chance level (50%). Significance determined by unpaired t-test (C) mixed-effects linear regression (H), or binomial test (I). **p < 0.01; ***p < 0.001; ****p < 0.0001.
-
Figure 2—source data 1
Behavioral data relevant to Figure 2.
- https://cdn.elifesciences.org/articles/80324/elife-80324-fig2-data1-v1.xlsx
-
Figure 2—source data 2
65-Hz frequency range power for dev control mice relevant to Figure 2.
- https://cdn.elifesciences.org/articles/80324/elife-80324-fig2-data2-v1.xlsx
-
Figure 2—source data 3
65-Hz frequency range power for dev inhibition mice relevant to Figure 2.
- https://cdn.elifesciences.org/articles/80324/elife-80324-fig2-data3-v1.xlsx
-
Figure 2—source data 4
Power predictor accuracy values relevant to Figure 2.
- https://cdn.elifesciences.org/articles/80324/elife-80324-fig2-data4-v1.xlsx
Figure 2—figure supplement 1
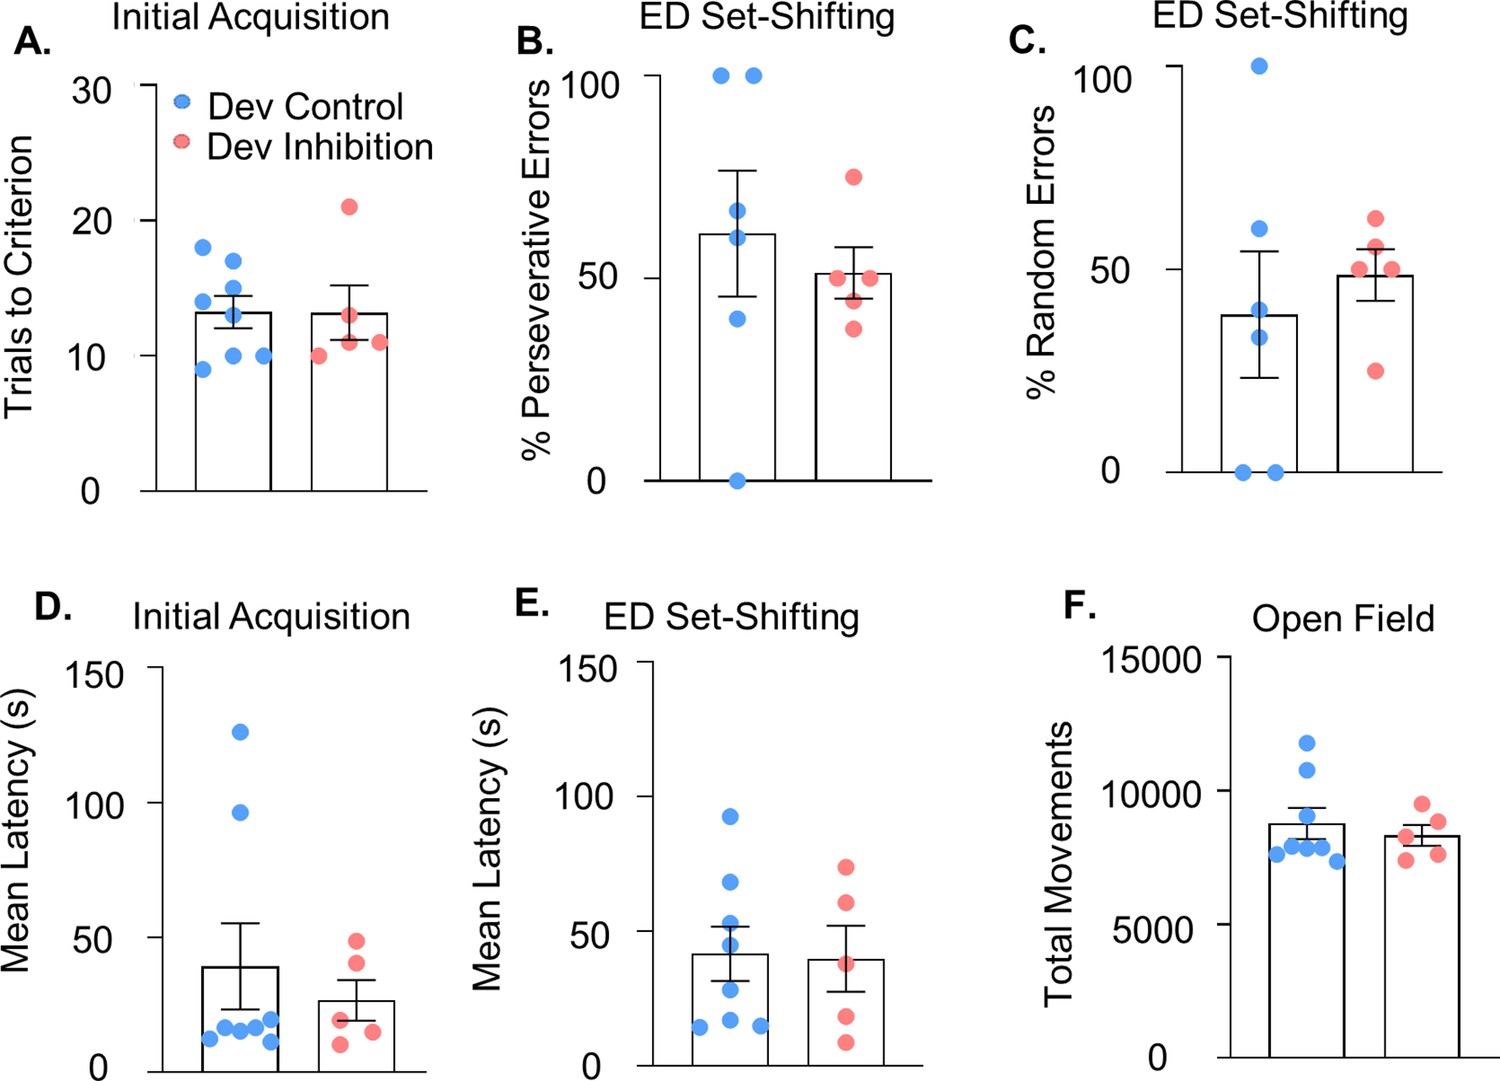
Additional behavioral analysis related to the medial PFC (mPFC) parvalbumin (PV) interneuron developmental inhibition.
(A) Trials to reach criterion in the initial acquisition phase of the set-shifting task are not affected by developmental inhibition of mPFC PV interneurons (n = 8 Dev Control and 5 Dev Inhibition mice). (B) There is no difference in the percentage of perseverative or (C) random errors made by Dev Inhibition relative to Control mice (n = 6 Dev Control and 5 Dev Inhibition mice; Note: Two Dev Control animals did not make any errors). Dev Inhibition (n = 5) and Control (n = 8) animals have a comparable mean latency to make a choice in both the initial acquisition (D) and extradimensional phase (E) of the set-shifting task. (F) Dev Inhibition (n = 5) and control mice (n = 8) make a comparable number of movements in the open field task. In all graphs, dots show individual animal values and bars show the mean ± standard error of the mean (SEM). Statistical analysis performed using unpaired t-tests (A–E) or Mann–Whitney (F).
-
Figure 2—figure supplement 1—source data 1
Behavioral data relevant to Figure 2—figure supplement 1.
- https://cdn.elifesciences.org/articles/80324/elife-80324-fig2-figsupp1-data1-v1.xlsx
Figure 2—figure supplement 2
Additional in vivo electrophysiological analysis related to the selection of the frequency range for analysis.
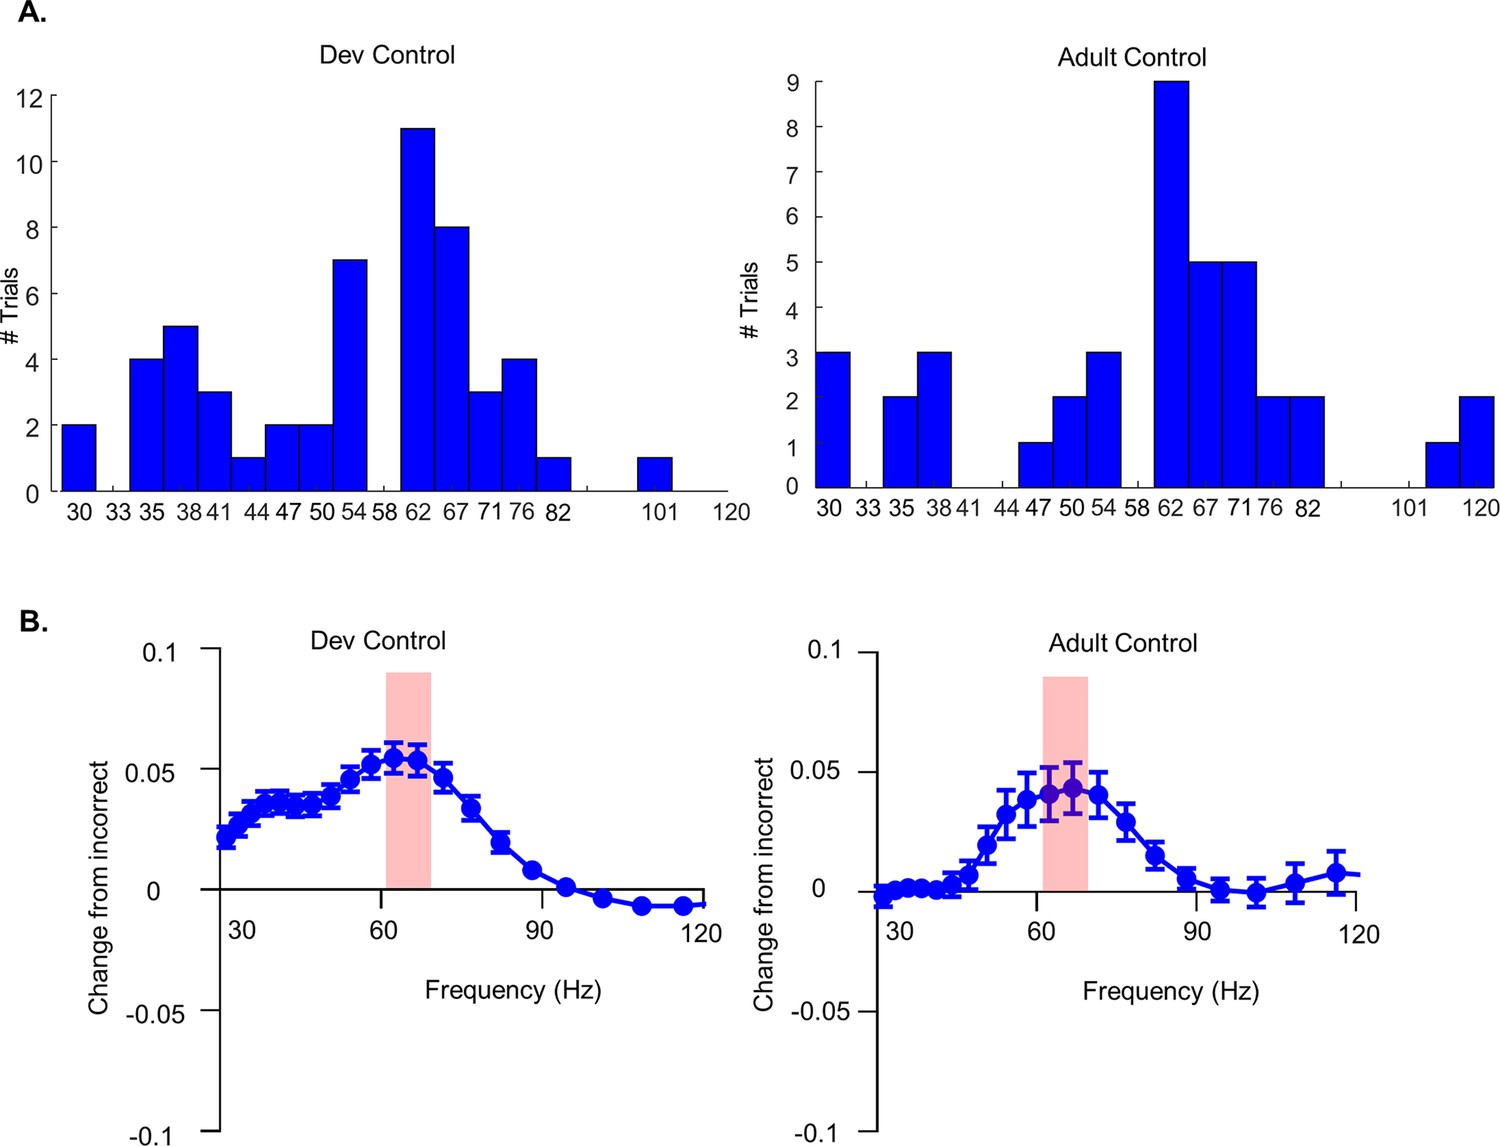
(A) Histogram for the number of correct trials per frequency for which the difference in power between correct and incorrect trials is larger than the difference in power in all other frequencies for Dev Control mice (left, n = 54 trials from 6 Dev Control mice) and Adult Control mice (right, n = 40 trials from 5 Adult Control mice). Data were not included for the two Dev Control animals that had no incorrect trials. Although a number of trials also showed a maximal difference at 58 Hz, these data were omitted to avoid encompassing 60 Hz in our range of assessment. (B) The difference in LFP power across frequencies in the choice period for each correct trial versus the mean power across frequencies for all incorrect trials for a given mouse for the Dev Control cohort (left; n = 54 trials from 6 Dev Control mice) and Adult Control cohort (right; n = 40 trials from 5 Adult Control mice). Dots show mean values and bars show the standard error of the mean (SEM). Red shading indicates 62–67 Hz where this correct versus incorrect difference is maximal.
-
Figure 2—figure supplement 2—source data 1
Data to select frequency range for LFP analysis relevant to Figure 2—figure supplement 2.
- https://cdn.elifesciences.org/articles/80324/elife-80324-fig2-figsupp2-data1-v1.xlsx
Figure 2—figure supplement 3

Accuracy of trial outcome prediction based on the power of different frequencies for Dev Inhibition and Control Mice.
1–4, 4–12, 90–120, and 120–200 Hz mean power cannot predict trial outcome in Dev Control (n = 78 trials from 8 Dev Control mice) or Dev Inhibition animals (n = 64 trials from 4 Dev Inhibition mice) with an accuracy significantly greater than chance (blue bars). While 12–40 Hz power can accurately predict outcome for both Dev Control (blue) and Dev Inhibition (light red) mice, 65-Hz frequency range (62–67 Hz) power only accurately predicts power for Dev Control animals. 65–80 Hz power also accurately predicts power for Dev Control and not Inhibition mice. Bars indicate accuracy of the model. Dotted line indicates chance level (50%). Statistical analysis calculated using a binomial test. *p < 0.05; **p < 0.01; ***p < 0.001.
-
Figure 2—figure supplement 3—source data 1
Data for LFP power predictor accuracy analysis relevant to Figure 2—figure supplement 3.
- https://cdn.elifesciences.org/articles/80324/elife-80324-fig2-figsupp3-data1-v1.xlsx
Figure 2—figure supplement 4
Additional analyses of gamma power during the set-shifting task.
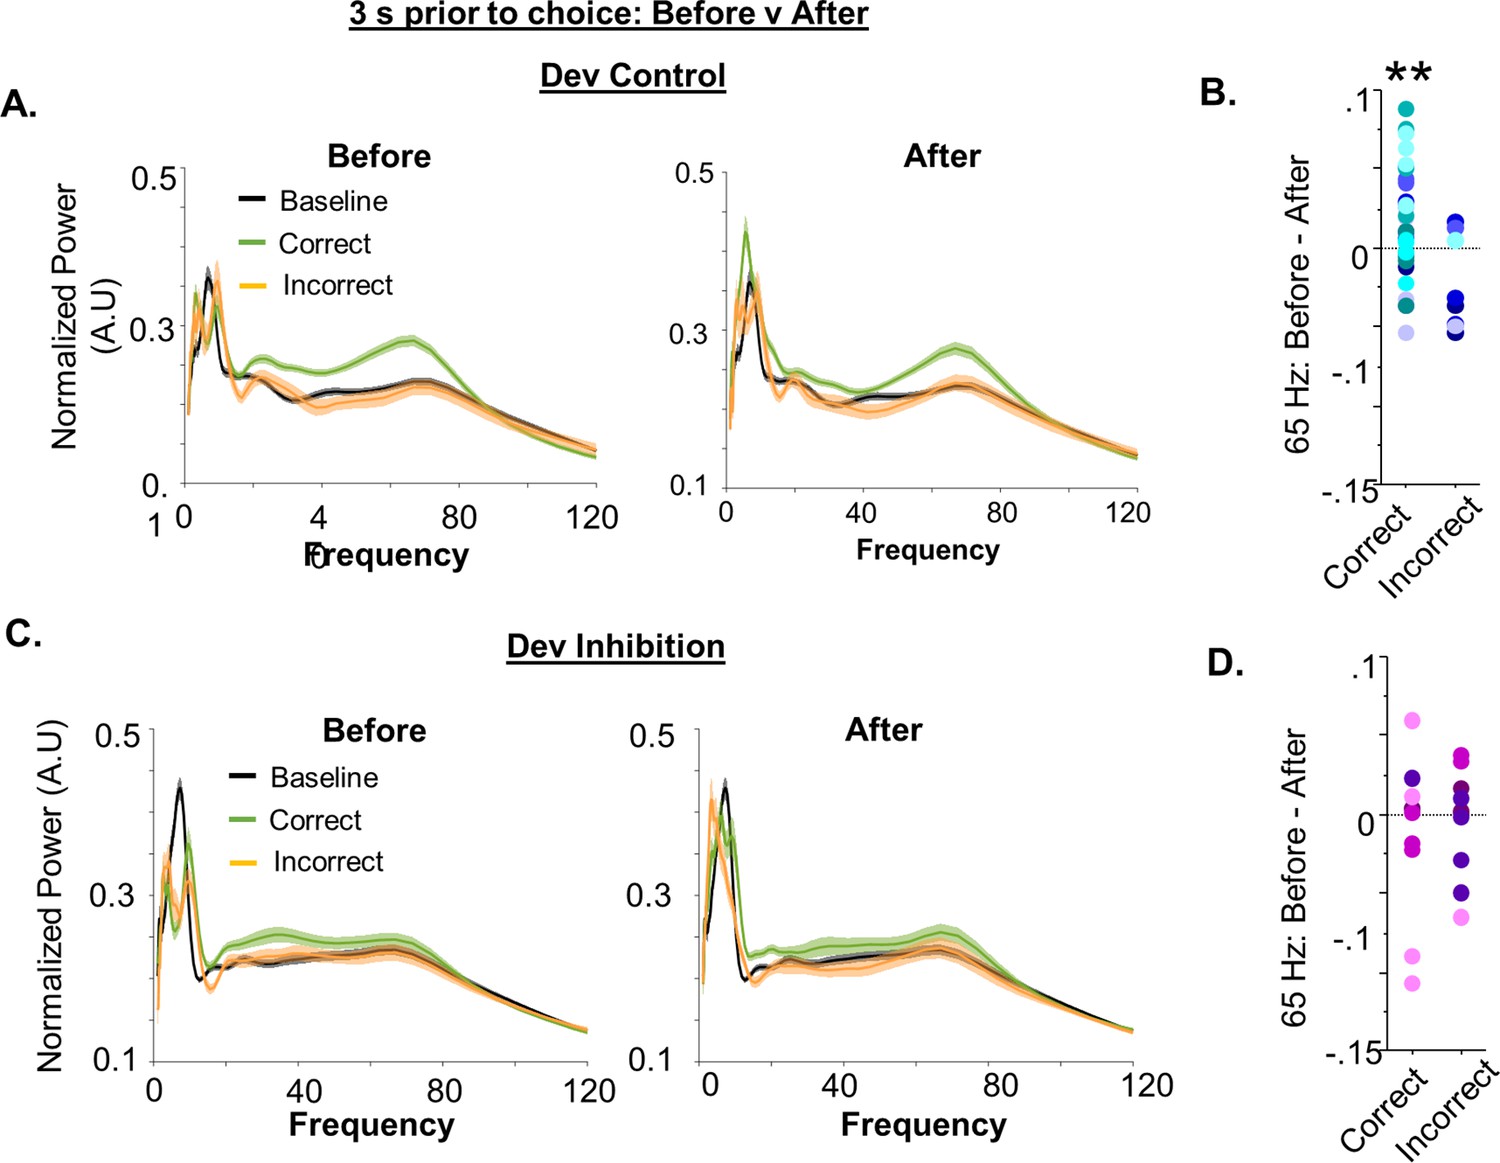
(A) Power as a function of frequency during the baseline (black) and in a 3-s window before (left) or after (right) choice in the set-shifting task, split by whether the choice was correct (green) or incorrect (orange) for Dev Control mice (n = 79 baseline/62 correct/17 incorrect trials from 8 animals). (B) Quantification of the difference in 65-Hz frequency range power in the period before versus after a correct or incorrect choice. 65-Hz frequency range power was significantly greater before versus after making a correct choice for the first 5 trials for each mouse (before–after mean ± standard error of the mean [SEM]: 0.02067 ± 0.007246, n = 31 trials from 8 Dev Control mice; p = 0.0078) but did not change for incorrect trials (before–after mean ± SEM: −0.02337 ± 0.01052, n = 8 trials from 6 Dev Control mice; p = 0.0618). (C-D) Same data as in (A-B) but for Dev Inhibition mice (n = 69 baseline/41 correct/28 incorrect trials from 4 animals). 65-Hz frequency range power did not change before versus after making either a correct (before–after mean ± SEM: −0.01359 ± 0.01594, n = 10 trials from 4 Dev Control mice; p = 0.4160), or incorrect (before–after mean ± SEM: −0.004430 ± 0.01071, n = 10 trials from 4 Dev Control mice; p = 0.6889), choice in the first 5 trials for each mouse. Dots indicate data for individual trials color coded by animal. Statistical analysis performed one-sample t-test compared to hypothetical mean of 0. **p < 0.05.
-
Figure 2—figure supplement 4—source data 1
65-Hz frequency range power for dev inhibition and control animals relevant to Figure 2—figure supplement 4.
- https://cdn.elifesciences.org/articles/80324/elife-80324-fig2-figsupp4-data1-v1.xlsx
Figure 3 with 1 supplement
Adult inhibition of medial PFC (mPFC) parvalbumin (PV) interneurons does not result in persistent alterations in prefrontal network functioning and behavior in adulthood.
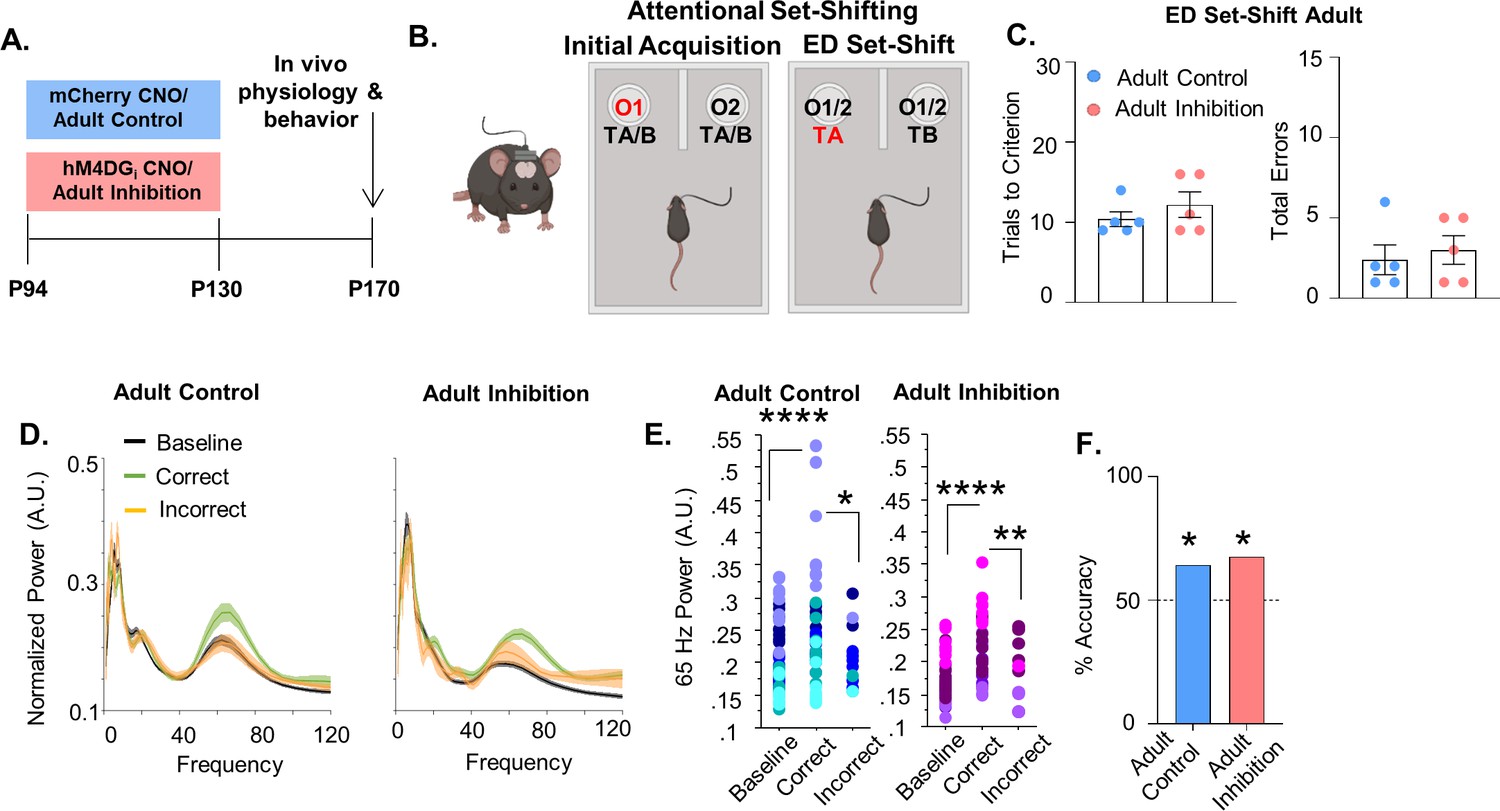
(A) Clozapine-n-oxide (CNO) was administered between P94 and P130 to mice-expressing hM4DGi-mCherry or mCherry in mPFC PV interneurons to produce Adult Inhibition or Control mice, respectively. At P170, mice were evaluated in an attentional set-shifting task while local field potentials were simultaneously recorded in the mPFC as illustrated in the schematic in (B). (C) Adult Inhibition (n = 5) and Control (n = 5) mice take a comparable number of trials to reach criterion (left) and make a comparable number of errors (right) during extradimensional (ED) set-shifting. Dots indicate individual animal responses and bars indicate mean ± standard error of the mean (SEM). (D) Normalized power (artificial units, A.U.) as a function of frequency in the 3 s prior to when the Adult Control (left, n = 51 baseline/39 correct/12 incorrect trials from 5 mice) or Adult Inhibition mice (right, n = 44 baseline/34 correct/10 incorrect trials from 4 animals) make a correct (green) or an incorrect (orange) choice relative to baseline (black). Lines and shading indicate mean ± SEM. (E) 65-Hz frequency range power is significantly increased prior to correct choices relative to both the baseline period and the choice period prior to incorrect choices in Adult Control (left) and Adult Inhibition mice (right). (F) Choice period 65-Hz frequency range power can predict trial outcome in both Adult Control (n = 27 out of 42 accurately predicted trial outcomes from 5 mice) and Inhibition animals (n = 23 out of 34 accurately predicted outcomes from 4 mice) with an accuracy significantly greater than chance. Bars indicate accuracy of the models. Dotted line indicates chance level (50%). Significance evaluated by unpaired t-test (C), mixed-effects linear regression (E) and binomial test (F). *p < 0.05, **p < 0.01, ****p < 0.0001.
-
Figure 3—source data 1
Behavioral data relevant to Figure 3.
- https://cdn.elifesciences.org/articles/80324/elife-80324-fig3-data1-v1.xlsx
-
Figure 3—source data 2
65-Hz frequency range power for adult control mice relevant to Figure 3.
- https://cdn.elifesciences.org/articles/80324/elife-80324-fig3-data2-v1.xlsx
-
Figure 3—source data 3
65-Hz frequency range power for adult inhibition mice relevant to Figure 3.
- https://cdn.elifesciences.org/articles/80324/elife-80324-fig3-data3-v1.xlsx
-
Figure 3—source data 4
Power predictor accuracy values relevant to Figure 3.
- https://cdn.elifesciences.org/articles/80324/elife-80324-fig3-data4-v1.xlsx
Figure 3—figure supplement 1
Additional behavioral analysis related to medial PFC (mPFC) parvalbumin (PV) adult inhibition.
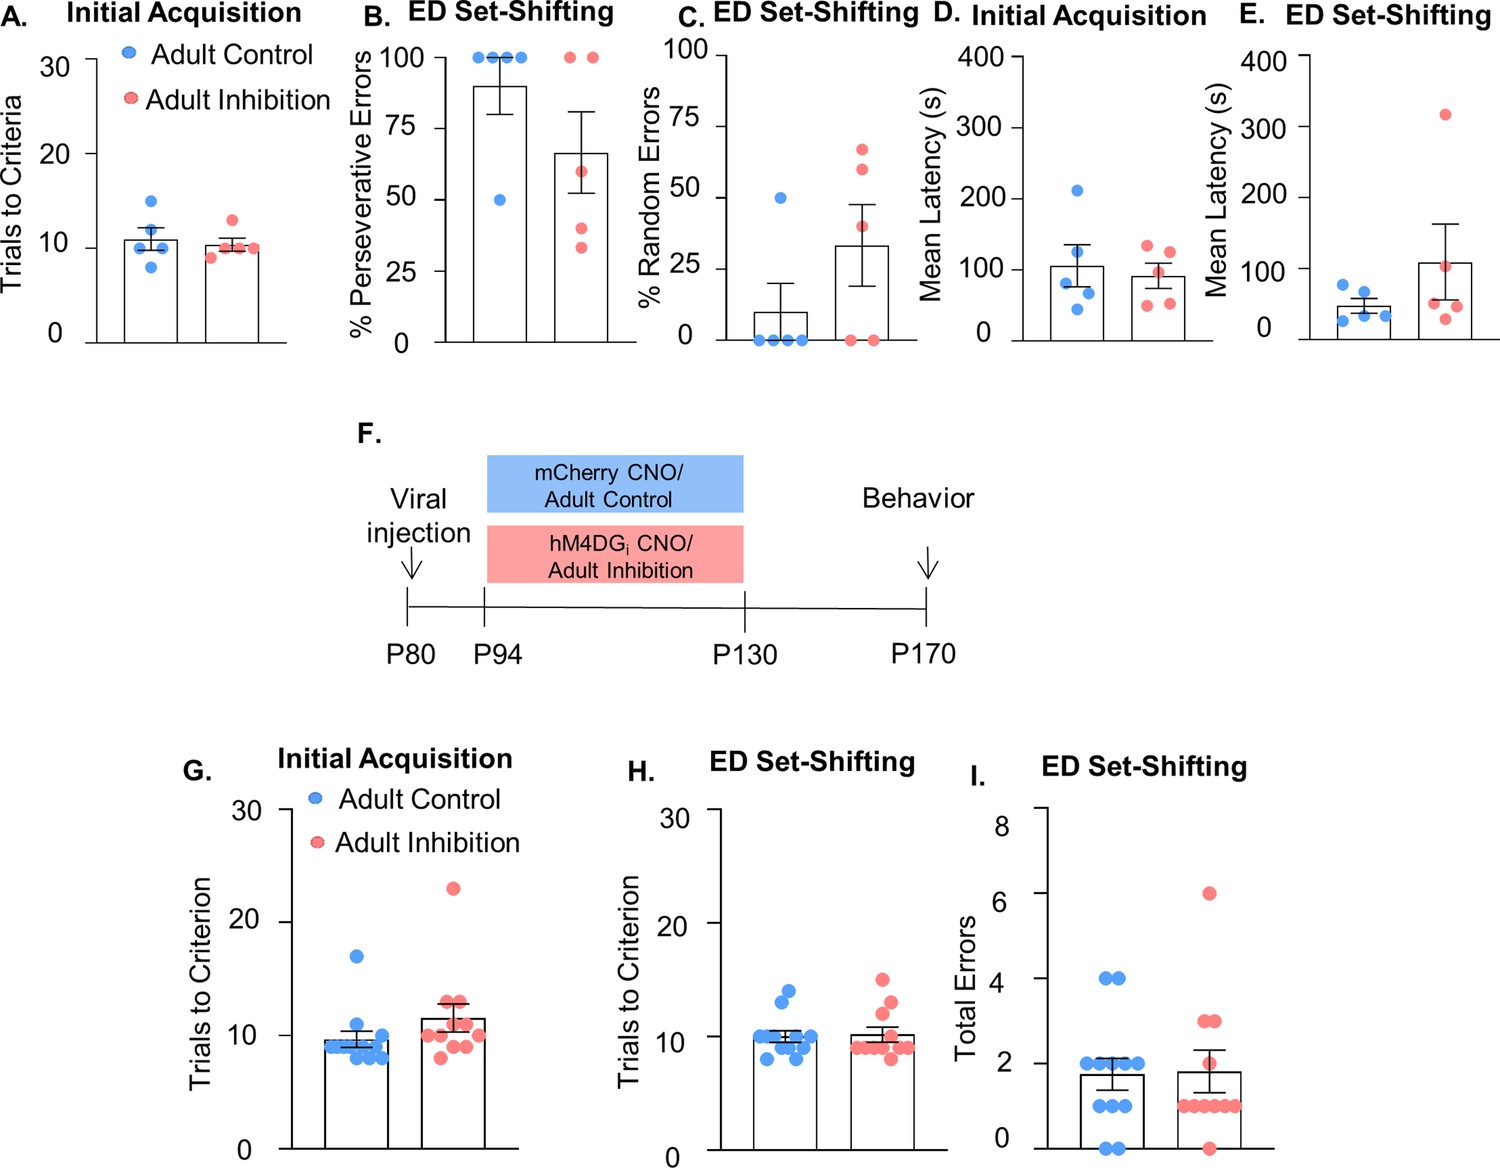
(A) Trials to reach criterion in the initial acquisition phase of the set-shifting task is not affected by adult inhibition of mPFC PV interneurons (n = 5 Adult Control and Inhibition mice). There is no difference in the percentage of perseverative (B) or random (C) errors made by Adult Inhibition (n = 5) and Control mice (n = 5). Adult Inhibition and Control animals have a comparable mean latency to make a choice in both the initial acquisition (D) and extradimensional (ED) phase (E) of the set-shifting task. (F) Schematic illustrating timeline for adult inhibition experiment where the virus is injected at P80 rather than P10. Clozapine-n-oxide (CNO) was administered between P94 and P130 and behavior was assessed from P170 onwards. (G) Adult Inhibition animals (n = 11) with virus injected at P80 rather than P10 still take a comparable number of trials to reach criterion in both the initial acquisition and ED phase (H) of the set-shifting task as Adult Controls (n = 12). (I) They also make a comparable number of errors during ED set-shifting. In all graphs, dots show individual animal values and bars show the mean ± standard error of the mean (SEM). Statistical analysis performed with unpaired t-tests.
-
Figure 3—figure supplement 1—source data 1
Behavioral data relevant to Figure 3—figure supplement 1.
- https://cdn.elifesciences.org/articles/80324/elife-80324-fig3-figsupp1-data1-v1.xlsx
Figure 4 with 2 supplements
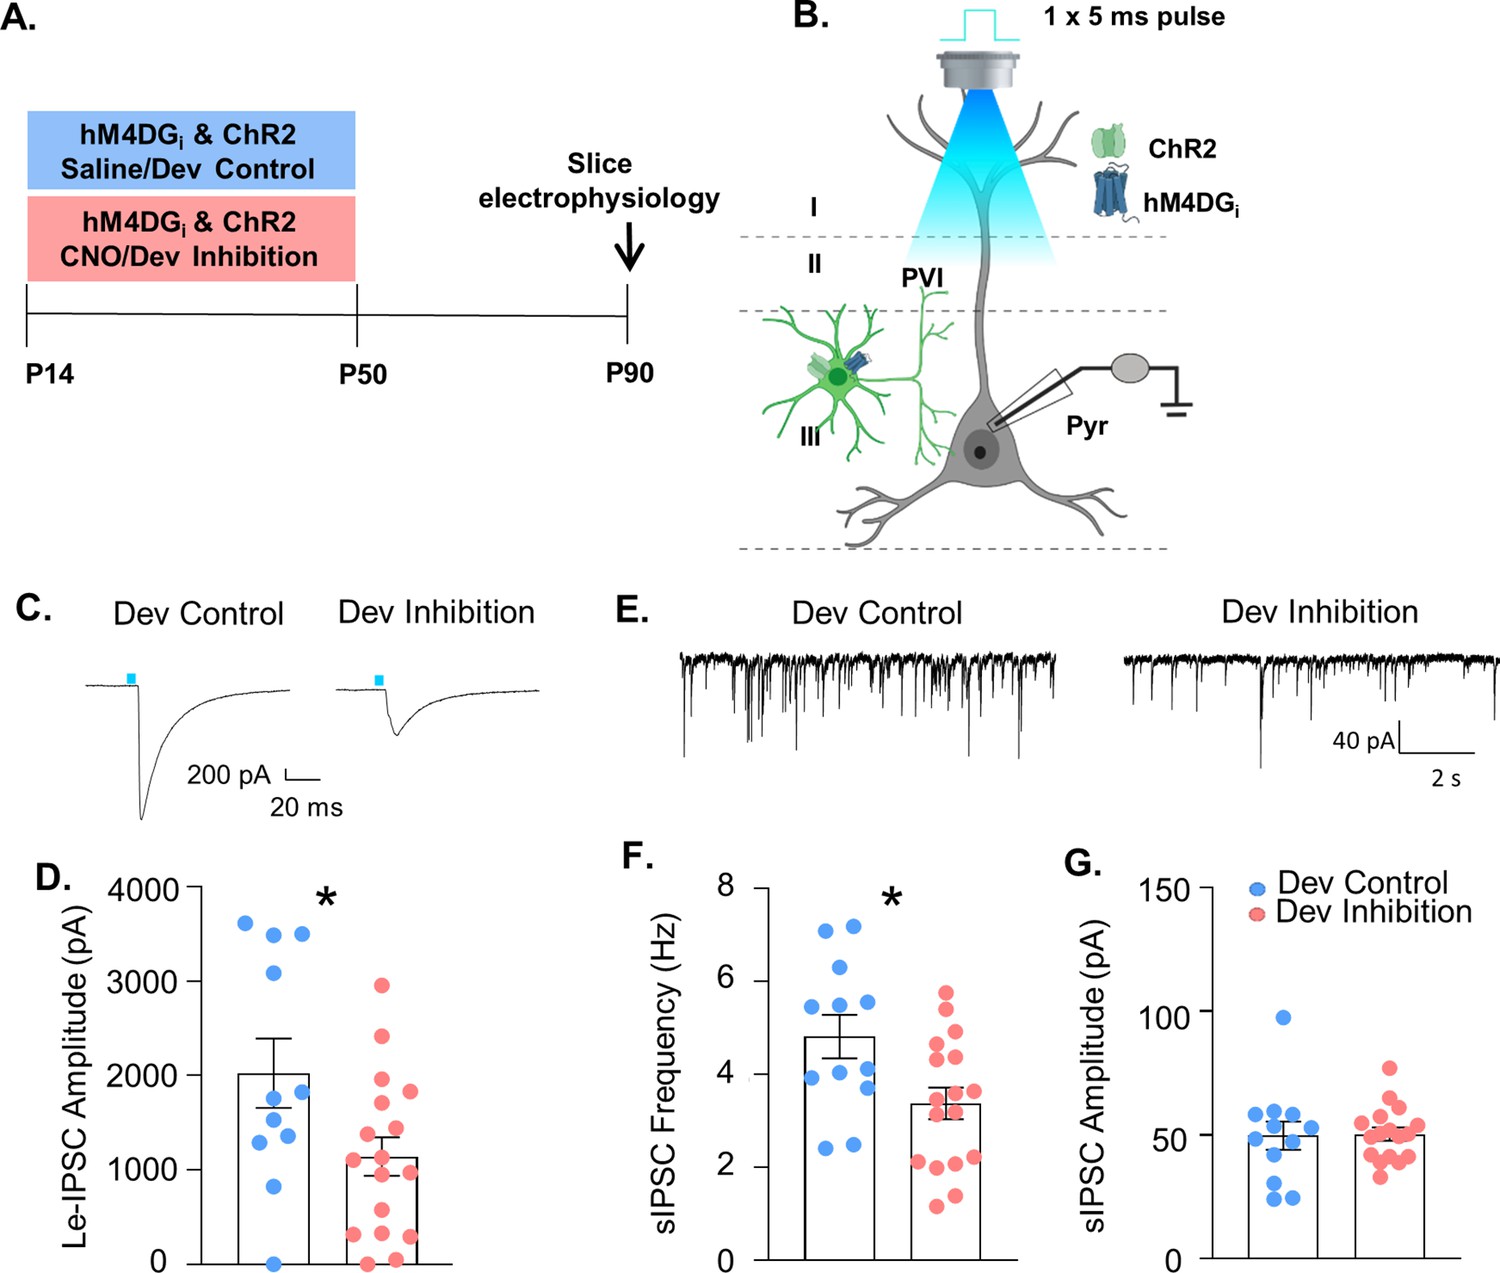
Developmental inhibition of medial PFC (mPFC) parvalbumin (PV) interneurons results in persistent reductions in their functional inhibition of glutamatergic pyramidal cells in adulthood.
(A) Experimental timeline. Mice-expressing channelrhodopsin2 (ChR2) and hM4DGi in PV cells were administered either clozapine-n-oxide (CNO, Dev Inhibition) or Saline (Dev Control) from P14 to P50. At P90 mice were used for slice electrophysiology. (B) Experimental schematic. Whole-cell patch clamp recordings were made from pyramidal cells in layer II/III of mPFC from Dev Inhibition and Control mice. The strength of GABAergic transmission from PV cells onto pyramidal cells was measured by evoking neurotransmitter release from mPFC PV cells by delivering a 5-ms pulse of 473 nm blue light via the ×40 objective and recording the amplitude of the resulting light-evoked inhibitory post-synaptic currents (Le-IPSCs). Spontaneous inhibitory post-synaptic currents (sIPSCs) were also recorded. (C) Representative traces showing Le-IPSCs from cells recorded from Dev Inhibition and Control mice. (D) Le-IPSC amplitudes were significantly reduced in Dev Inhibition mice (n = 17 cells from 4 mice) relative to Dev controls (n = 11 cells from 3 mice). Dots indicate individual cell responses and bars indicate mean ± standard error of the mean (SEM). (E) Representative traces showing sIPSCs from cells recorded from Dev Inhibition and Control mice. (F) sIPSC frequency is significantly reduced in Dev Inhibition mice (n = 17 cells from 4 mice) relative to Control mice (n = 12 cells from 3 mice). Dots indicate individual cell responses and bars indicate mean ± SEM. (G) sIPSC amplitude is unchanged (n’s indicated in F). Dots indicate individual cell responses and bars indicate mean ± SEM. Significance evaluated with unpaired t-tests. *p < 0.05.
-
Figure 4—source data 1
Slice electrophysiology data relevant to Figure 4.
- https://cdn.elifesciences.org/articles/80324/elife-80324-fig4-data1-v1.xlsx
Figure 4—figure supplement 1

Adult medial PFC (mPFC) parvalbumin (PV) inhibition does not lead to long-lasting effects on their functional inhibition of glutamatergic pyramidal cells.
(A) Experimental schematic. PV-hM4DGi-mCherry- or PV-mCherry-expressing mice were injected with clozapine-n-oxide (CNO) from P94 to 130. Slice electrophysiological recordings of spontaneously occurring inhibitory post-synaptic currents (sIPSCs) were made at P170. (B) Example current traces from Adult Control (left) and Adult Inhibition (right) mice. (C) There is no difference in the frequency or (D) amplitude of sIPSCs recorded from Adult Inhibition (n = 10 cells from 2 mice) or Control animals (n = 9 cells from 2 mice). Statistical analysis performed with unpaired t-tests.
-
Figure 4—figure supplement 1—source data 1
Slice electrophysiology data relevant to Figure 4—figure supplement 1.
- https://cdn.elifesciences.org/articles/80324/elife-80324-fig4-figsupp1-data1-v1.xlsx
Figure 4—figure supplement 2
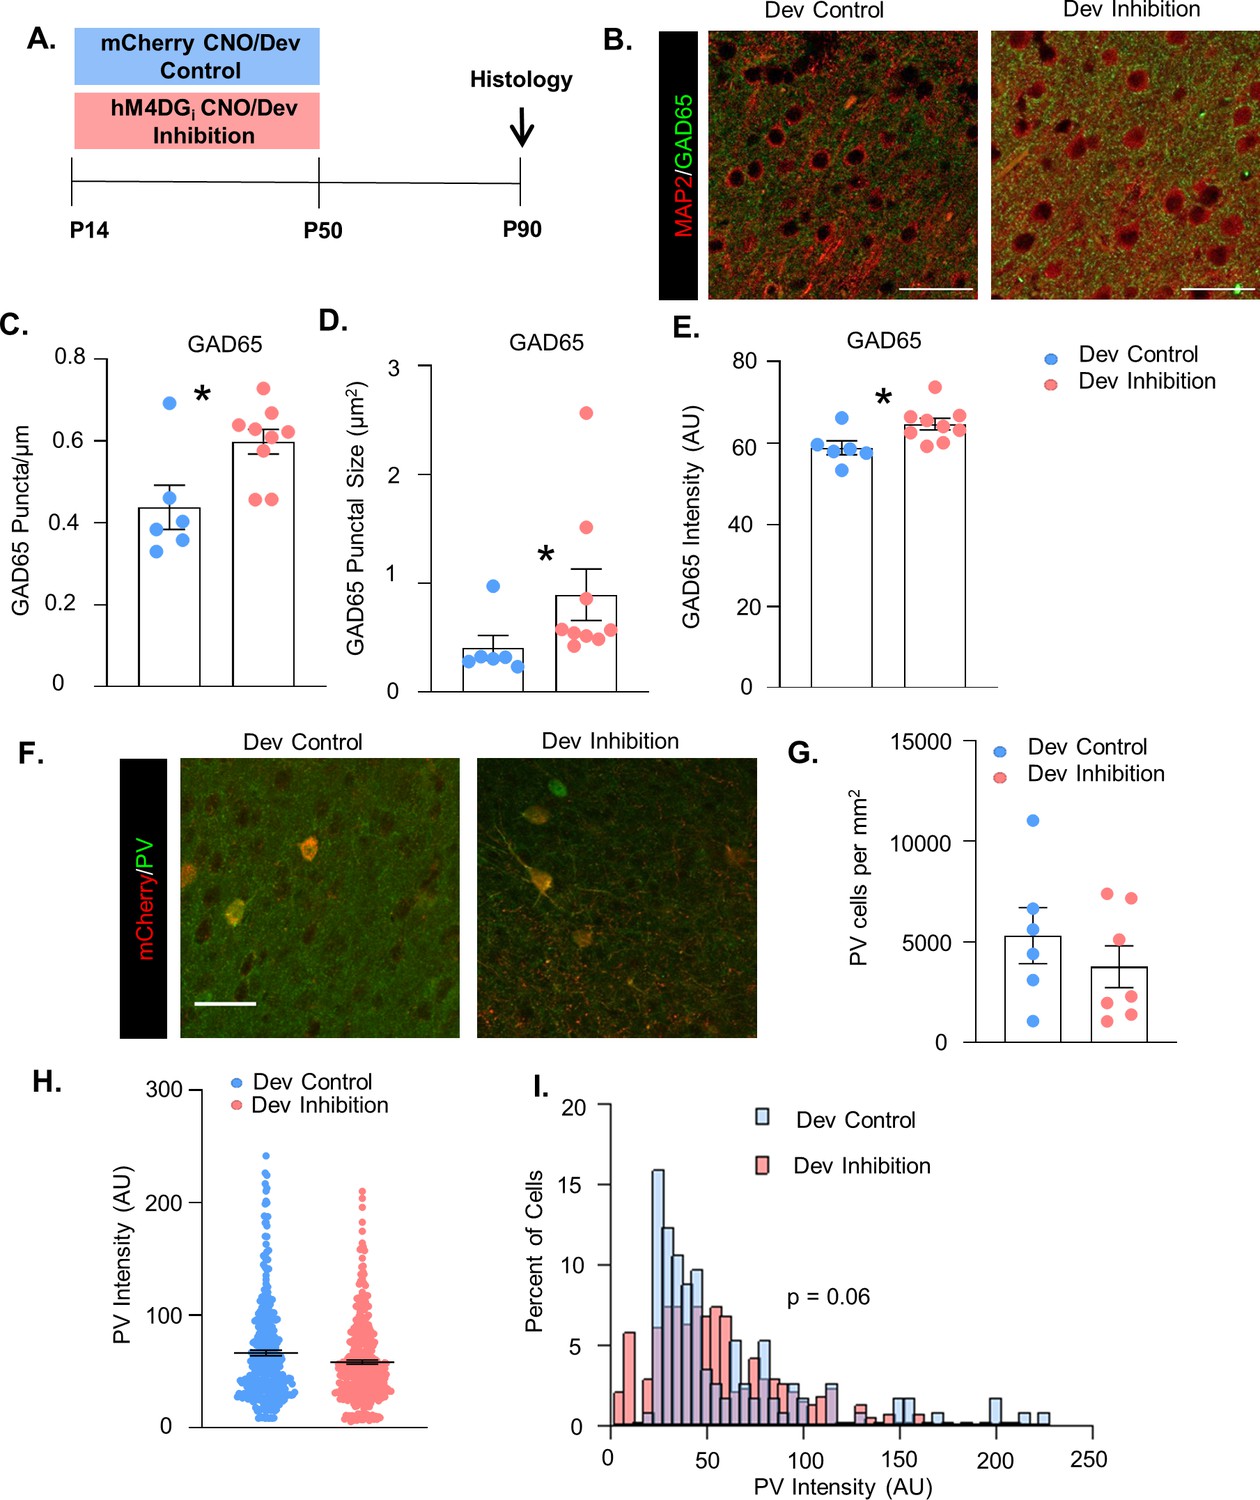
Developmental inhibition of medial PFC (mPFC) parvalbumin (PV) interneurons increases GAD65 + puncta but does not alter PV cell number or somatic PV levels.
(A) Experimental schematic. P10 PV-Cre mice were injected with either AAV5-hSyn-DIO-hM4DGi-mCherry or AAV5-hSyn-DIO-mCherry in the mPFC. Clozapine-n-oxide (CNO) was administered between P14 and P50 for the Dev Inhibition and Dev Control mice. At >40 days following the end of inhibition, mice were processed for histology. (B) Example image of MAP2 (red) and GAD65 (green) staining from a Dev Control (left) and Dev Inhibition (right) mouse. (C) The density, (D) size, and (E) intensity of GAD65-expressing perisomatic puncta were significantly greater in Dev Inhibition mice (n = 9) than Dev Controls (n = 6). (F) Example image of mCherry (red) and PV (green) staining from Dev Control (left) and Dev Inhibition (right) mice. (G) Stereological counts of PV-expressing cells in the mPFC of Dev Control (n = 6) and Dev Inhibition mice (n = 7). The number of PV-expressing cells did not differ between these two groups. (H) The overall mean intensity of PV in virus-infected cells did not differ between Dev Control (n = 113 cells from 7 mice) and Dev Inhibition mice (377 cells from 10 mice). (I) There was a no statistically significant difference in the distribution of the intensity of PV expression in virus-infected cells in Dev Control and Dev Inhibition mice. In graphs (C), (D), (E), and (G), dots show individual animal values and bars show the mean ± standard error of the mean (SEM). In graph (H), dots show individual cell values and bars show the mean ± SEM. Statistical analysis conducted with unpaired t-tests (C, E, G), Mann–Whitney (D), mixed effects linear regression (H), and Kolmogorov–Smirnov test (I). Scale bars are 50 µm. *p<0.05.
-
Figure 4—figure supplement 2—source data 1
Histology data relevant to Figure 4—figure supplement 2.
- https://cdn.elifesciences.org/articles/80324/elife-80324-fig4-figsupp2-data1-v1.xlsx
Figure 5
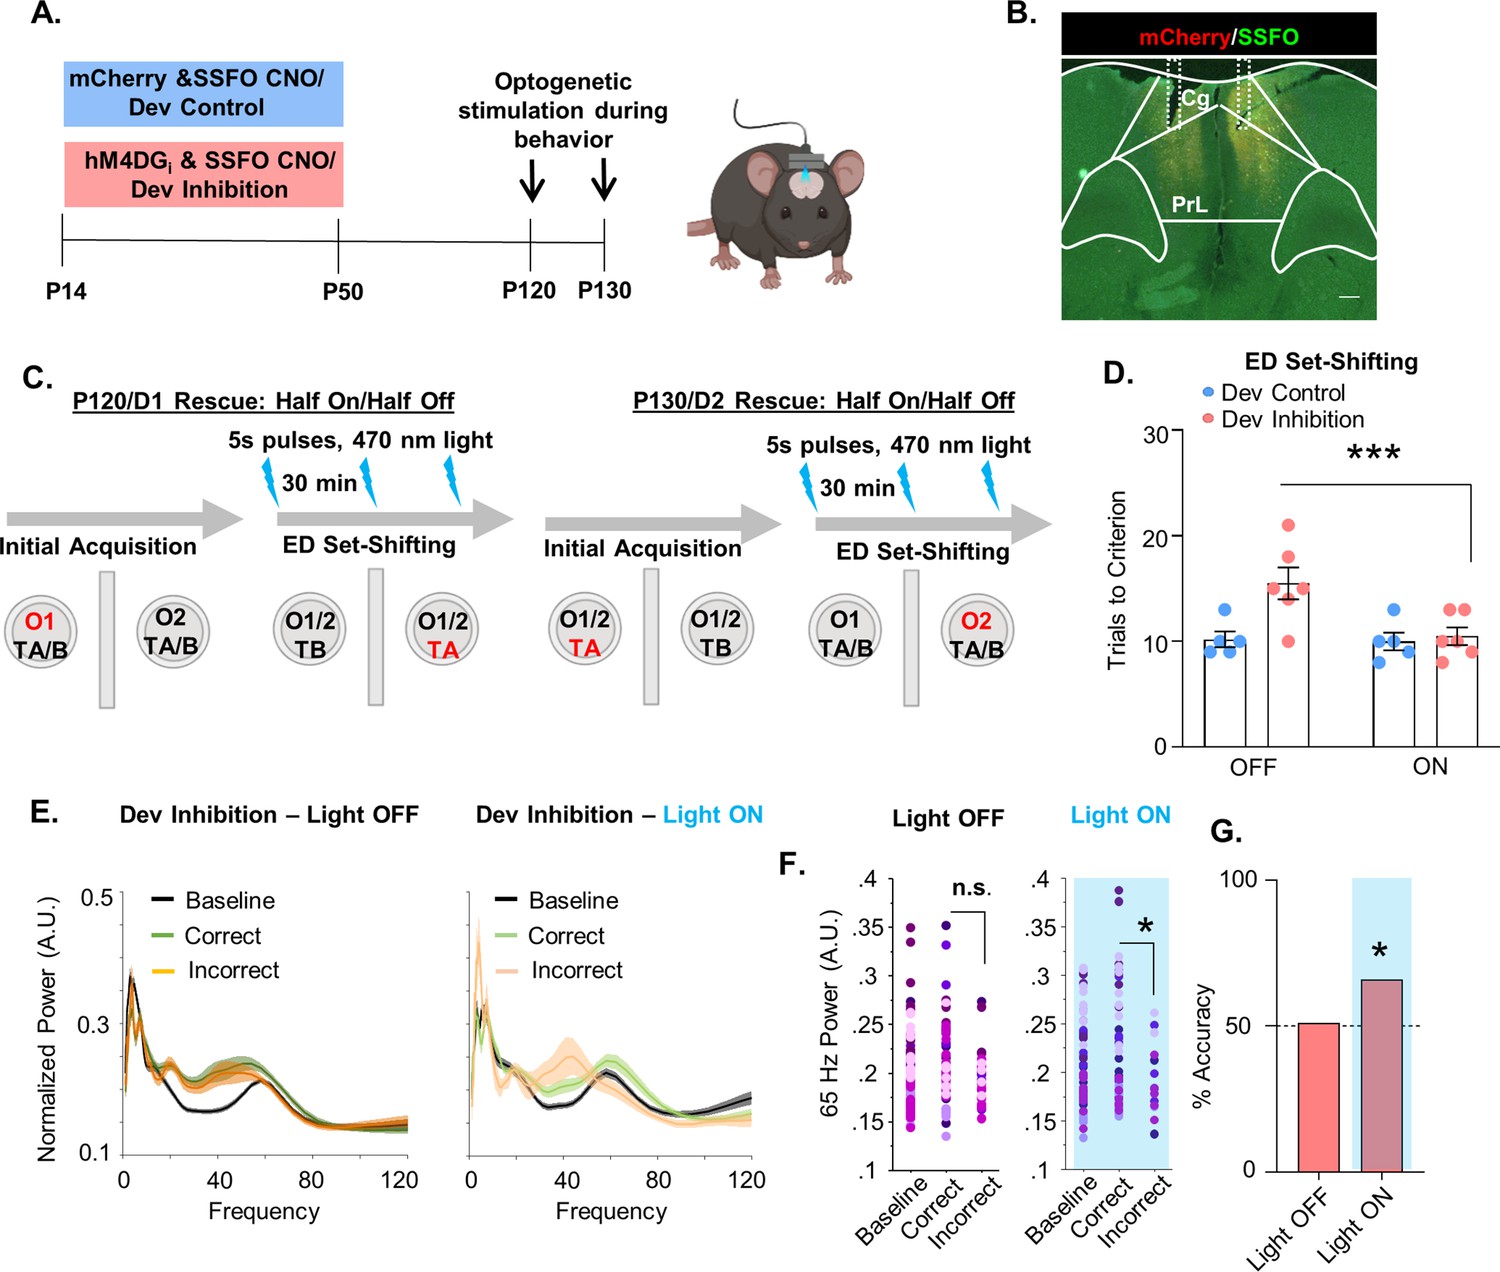
Enhancing medial PFC (mPFC) parvalbumin (PV) interneuron activity in adulthood with a stabilized step-function opsin (SSFO) can rescue behavioral deficits following developmental inhibition of mPFC PV interneurons.
(A) Experimental timeline. Mice expressing an SSFO in combination with hM4DGi-mCherry or mCherry in mPFC PV cells were administered clozapine-n-oxide (CNO) between P14 and P50. In adulthood, optical fibers were bilaterally implanted over the mPFC and mice were evaluated in an attentional set-shifting task with and without optical activation of their PV interneurons. (B) Example histology. hM4DGi-mCherry or mCherry (red) and SSFO-EYFP (green) were expressed in PV cells in the mPFC. Dotted lines denote bilateral placement of the fiberoptic implants. (C) Schematic illustrating the details of the cross-over experiment. Half the animals had the SSFO activated by administration of 473 nm light via bilaterally implanted optical fibers during extradimensional (ED) set-shifting on testing day 1 with the other half of the animals in the light off condition. Ten days later, testing was repeated with those animals that originally were in the light off condition receiving SSFO activation and vice versa. (D) Following light activation of mPFC PV cells, there was a significant reduction in the number of trials it took the Dev Inhibition animals (n = 6) to reach criterion in ED set-shifting but no change in Dev Controls (n = 5). (E) Power versus frequency for the choice period prior to correct (green) or incorrect (orange) choices, or in the baseline (black) period for Dev Inhibition animals when the light was OFF (left, n = 92 baseline/61 correct/31 incorrect trials from 6 mice) or ON (right, n = 63 baseline/49 correct/14 incorrect trials from 6 mice). (F) Choice period 65-Hz frequency range power is not statistically larger in correct versus incorrect trials in Dev Inhibition animals when the light is OFF (left) but when the light is ON choice period 65-Hz frequency range power is statistically greater in correct versus incorrect trials. (G) Choice period 65-Hz frequency range power can predict trial outcome in Dev Inhibition animals with an accuracy significantly greater than chance only when the light is ON (n = 35 out of 53 accurately predicted outcomes from 6 mice), but not when it is OFF (n = 42 out of 82 accurately predicted outcomes from 6 mice). Significance assessed by two-way analysis of variance (ANOVA) followed by post hoc comparison (D), mixed effects linear regression (F), and binomial test (G). *p < 0.05, ***p < 0.001. Scale bar is 250 µm.
-
Figure 5—source data 1
Behavioral data relevant to Figure 5.
- https://cdn.elifesciences.org/articles/80324/elife-80324-fig5-data1-v1.xlsx
-
Figure 5—source data 2
65-Hz frequency range power for dev inhibition mice with the light OFF relevant to Figure 5.
- https://cdn.elifesciences.org/articles/80324/elife-80324-fig5-data2-v1.xlsx
-
Figure 5—source data 3
65-Hz frequency range power for dev inhibition mice with the light ON relevant to Figure 5.
- https://cdn.elifesciences.org/articles/80324/elife-80324-fig5-data3-v1.xlsx
Author response image 1

Additional files
-
MDAR checklist
- https://cdn.elifesciences.org/articles/80324/elife-80324-mdarchecklist1-v1.pdf
-
Source code 1
R script used to analyze 65-Hz freqency range power relevant to Figures 2 and 3F.
This code is designed provide a linear mixed model analysis of 65-Hz frequency range power, with a fixed effect of trial type (baseline, correct choice, and incorrect choice) and a random effect of animal. It provides comparisons of whether 65-Hz frequency range power varies significantly between trial types (baseline versus correct or incorrect choice as well as correct versus incorrect choice) for the different data sets.
- https://cdn.elifesciences.org/articles/80324/elife-80324-code1-v1.zip
Download links
A two-part list of links to download the article, or parts of the article, in various formats.
Downloads (link to download the article as PDF)
Open citations (links to open the citations from this article in various online reference manager services)
Cite this article (links to download the citations from this article in formats compatible with various reference manager tools)
Mature parvalbumin interneuron function in prefrontal cortex requires activity during a postnatal sensitive period
eLife 11:e80324.
https://doi.org/10.7554/eLife.80324


