Microglia shape the embryonic development of mammalian respiratory networks
- Institut de Neurosciences Cognitives et Intégratives d’Aquitaine, CNRS, Université de Bordeaux, France
- MeLis INSERM U1314-CNRS UMR 5284, Faculté Rockefeller, France
Figures
Figure 1
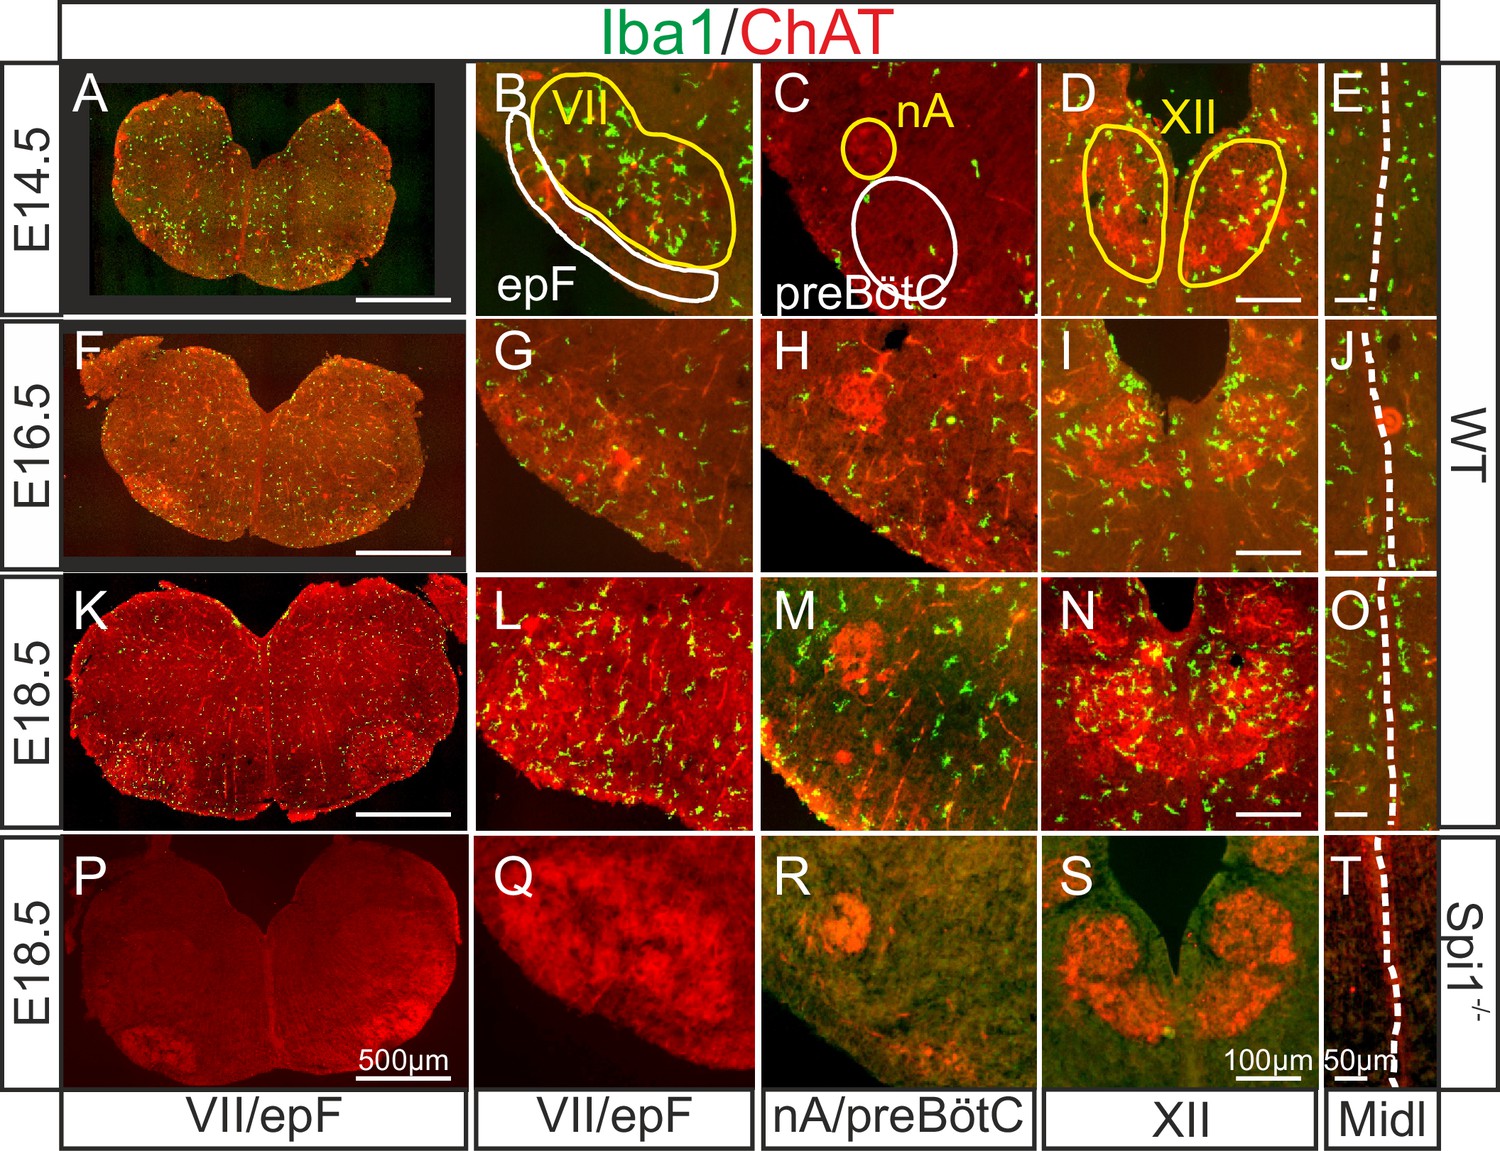
Immunodetection of microglia in the mouse hindbrain during embryonic development.
Immunostaining for Iba1 (green) and ChAT (red) in transverse, 30 µm thick brainstem frozen sections obtained from three wild-type embryos (WT, upper three horizontal rows) and one Spi1−/− embryo (bottom row) at different embryonic ages (indicated on left) and at different axial levels (indicated at bottom). (A, F, K, P) Whole transverse brainstem slices shown at higher magnification at the level of the VII nucleus/epF (B, G, L, Q), the nucleus ambiguus/preBötzinger complex (C, H, M, R), the hypoglossal nucleus (D, I, N, S), and the midline (E, J, O, T). Yellow lines delineate brainstem motor nuclei, white lines delimit areas encompassing the respiratory networks of the epF and the preBötC. Note a preferential distribution of microglia in motor nuclei and along the midline, and the complete absence of Iba1 labeling in the Spi1−/− mutant. epF: embryonic parafacial respiratory group; Midl: midline; nA: nucleus ambiguus; preBötC: preBötzinger complex; VII: facial motor nucleus; XII: hypoglossal nucleus.
Figure 2
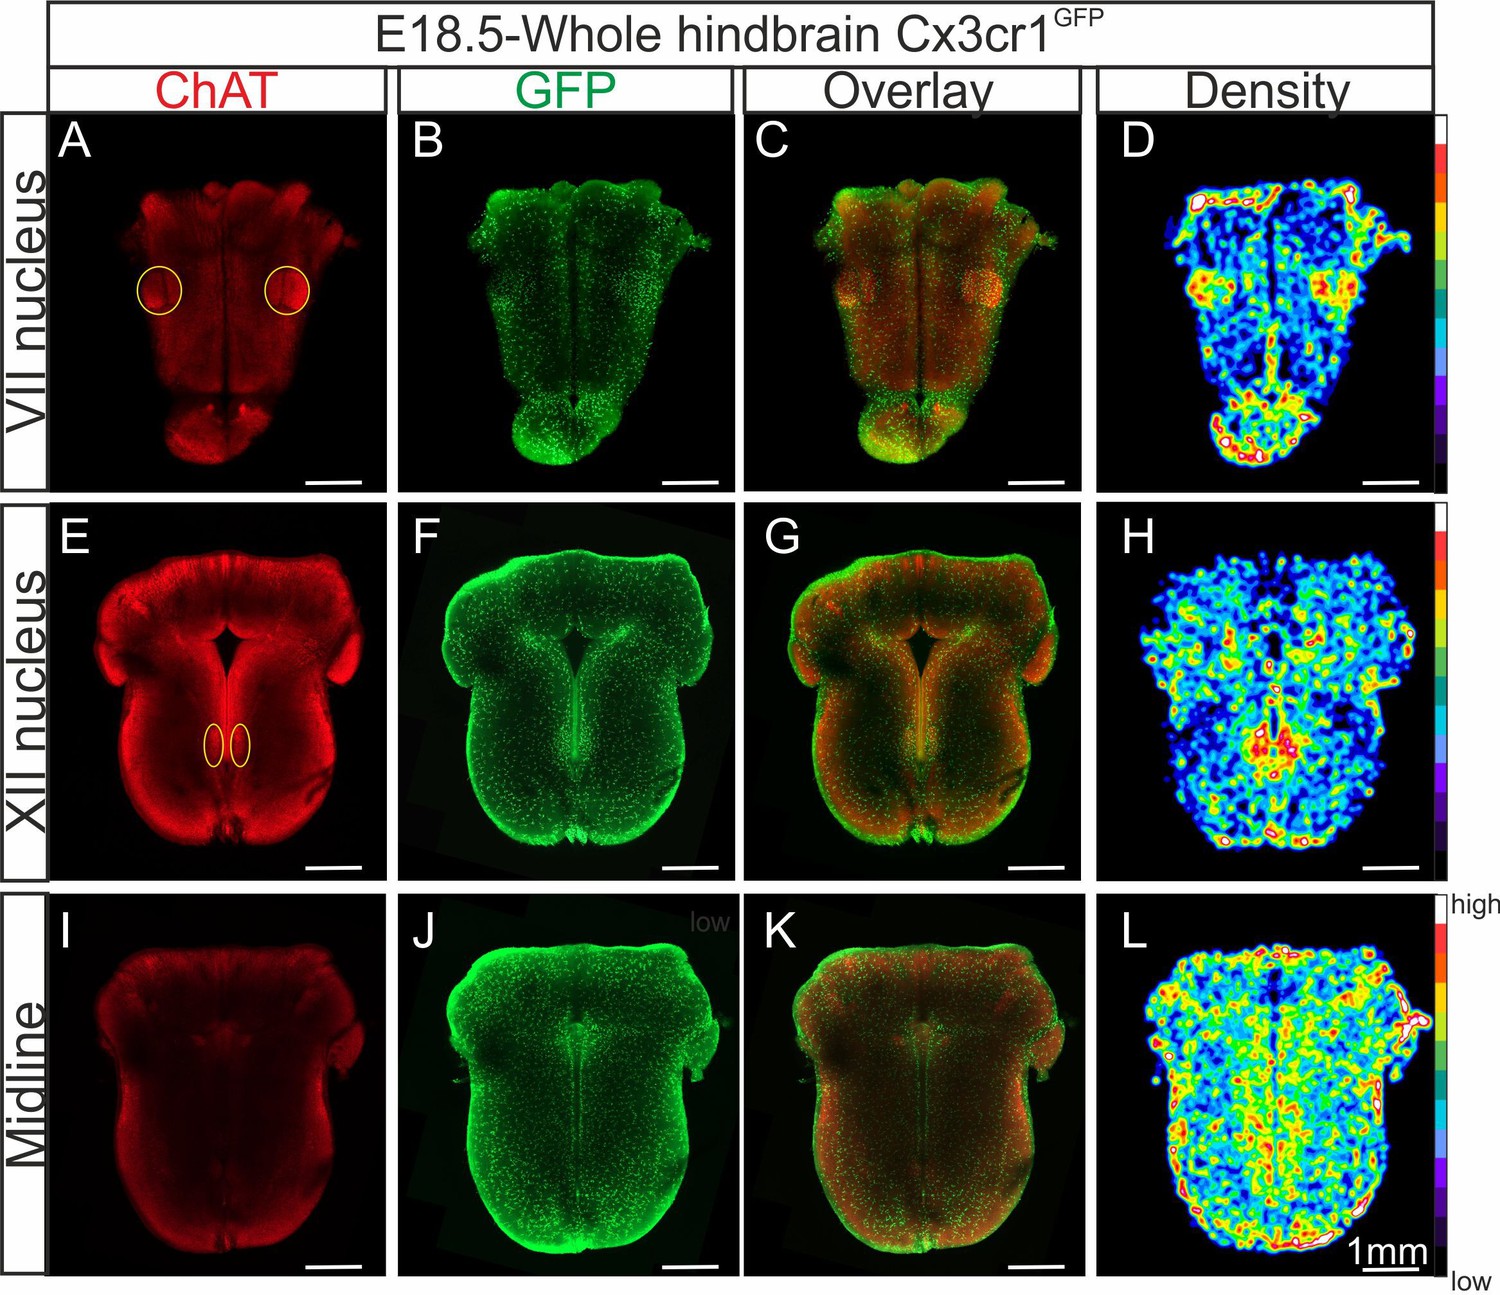
Distribution of microglia in a CLARITY-based cleared whole hindbrain obtained from aCX3CR-1GFP embryo at E18.5.
Immunostaining for ChAT (red; A, E, I) and GFP (green; B, F, J) performed on hindbrain tissue with microglia endogenously expressing GFP. Images are orthogonal projections of optical sections stacks taken with a confocal microscope at the level of the facial nucleus (n = 18 images; top horizontal row), the hypoglossal nucleus (n = 12 images; middle row), and of the midline (n = 25 images; bottom row). (C, G, K) Overlay of ChAT and GFP labeling. (D, H, L) Density maps obtained from the GFP image stacks (see Materials and methods). Note the higher microglial cell densities in the region of the facial and hypoglossal nuclei and the midline. Yellow ovals highlight the positions of motor nuclei (facial nucleus in A and hypoglossal nucleus in E).
Figure 3

Anatomical and functional anomalies of the epF in Spi1−/− embryos at E14.5.
(A) Partial ventral view of a whole-hindbrain preparations obtained from wild-type (WT, left panel) and Spi1−/− (right panel) embryos at E14.5 after triple immunolabeling with antibodies specific to Phox2b (red), Islet1,2 (green), and NK1R (blue). Cells of the epF express Phox2b and are located in a NK1R-positive region, ventral and lateral to facial cells that express Phox2b and Islet1,2. (B) Single sagittal slices from WT and Spi1−/− embryos at E14.5 after immunolabeling against Phox2b and Islet1,2. Insets in left A and B are schematic representations of hindbrain preparations in the orientation illustrated in the photographs. (C) Quantification of the total number of epF cells (Phox2b+/islet1,2−) in WT (unfilled bar) and Spi1−/− (black bar) preparations. The epF network in the mutant contains a significantly lower number (p < 0.01) of constituent neurons compared to WT. (D) Rostro-caudal extension of the VII nucleus in WT (unfilled bar) and Spi1−/− (black bar) preparations. (E) Images of Calcium Green 1AM-loaded whole-hindbrain preparations taken in DIC (left panels) and fluorescence (right panels) modes showing epF cells located lateral to the facial nucleus. Sample recording traces below illustrate repetitive fluorescent changes occurring simultaneously in individual epF cells. (F) Bar graphs quantifying the frequency of the fluorescent transients in WT and Spi1−/− preparations in control pH 7.4 (unfilled and black bars, respectively) and after acidification (pH 7.2) (dashed bars). Values are given as mean ± SEM. Numbers in bars indicate numbers of preparations analyzed. Student's t test and Mann-Whitney Rank Sum test have been performed. Asterisks indicate p < 0.01. epF: embryonic parafacial respiratory group; VII: facial nucleus. The epF network in the Spi1−/− mutant is composed of fewer cells that generate a slower rhythm compared to WT, although the network’s chemosensitivity is maintained.
Figure 4
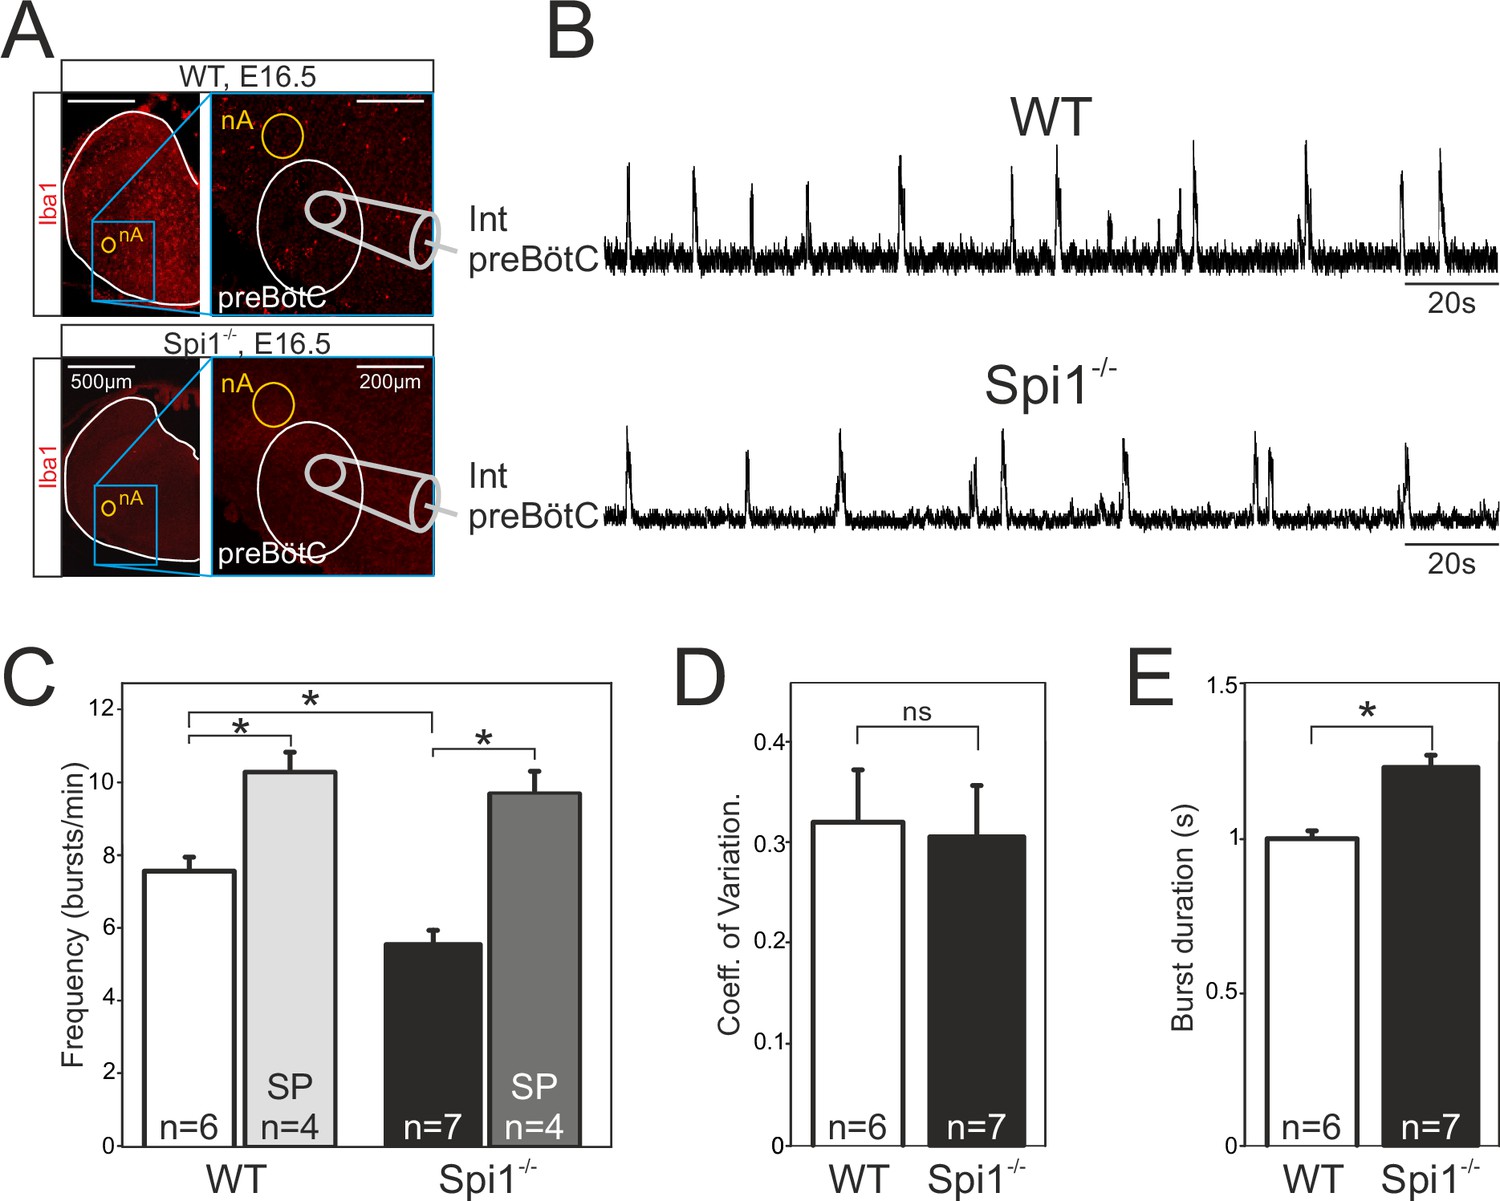
The preBötzinger complex (preBötC) network generates a slow rhythm with longer inspiratory bursts in the Spi1−/− embryo at E16.5.
(A) Photomicrographs at two different magnifications of E16.5 transverse medullary slices from wild-type (WT) (top) and Spi1−/− (bottom) isolating the preBötC network and immunostained with the antibody against Iba to detect microglial cells. Note the complete absence of labeling in the Spi1−/− preparation. Also schematically represented is the position of the electrode used for population recording from the preBötC. (B) Integrated neurogram recordings from the preBötC network in a WT (top) and a Spi1−/− (bottom) slice preparation. (C) Quantification of the mean frequency of burst activity in the preBötC networks of WT (unfilled bars) and Spi1−/− (black bars) in control conditions and in the presence of 0.5 µM Substance P (gray bars). Same group recordings as analyzed in C showing mean coefficients of variation of the timing of bursts (D) and mean burst durations (E) of preBötC activity in WT and Spi1−/− embryos. Values are given as mean ± SEM. Student's t test have been performed. Asterisks indicate a p < 0.001. n, number of slices analyzed; nA: nucleus ambiguus; SP: Substance P. In the Spi1−/− the preBötC network generates respiratory activity at a lower frequency with longer bursts.
Figure 5
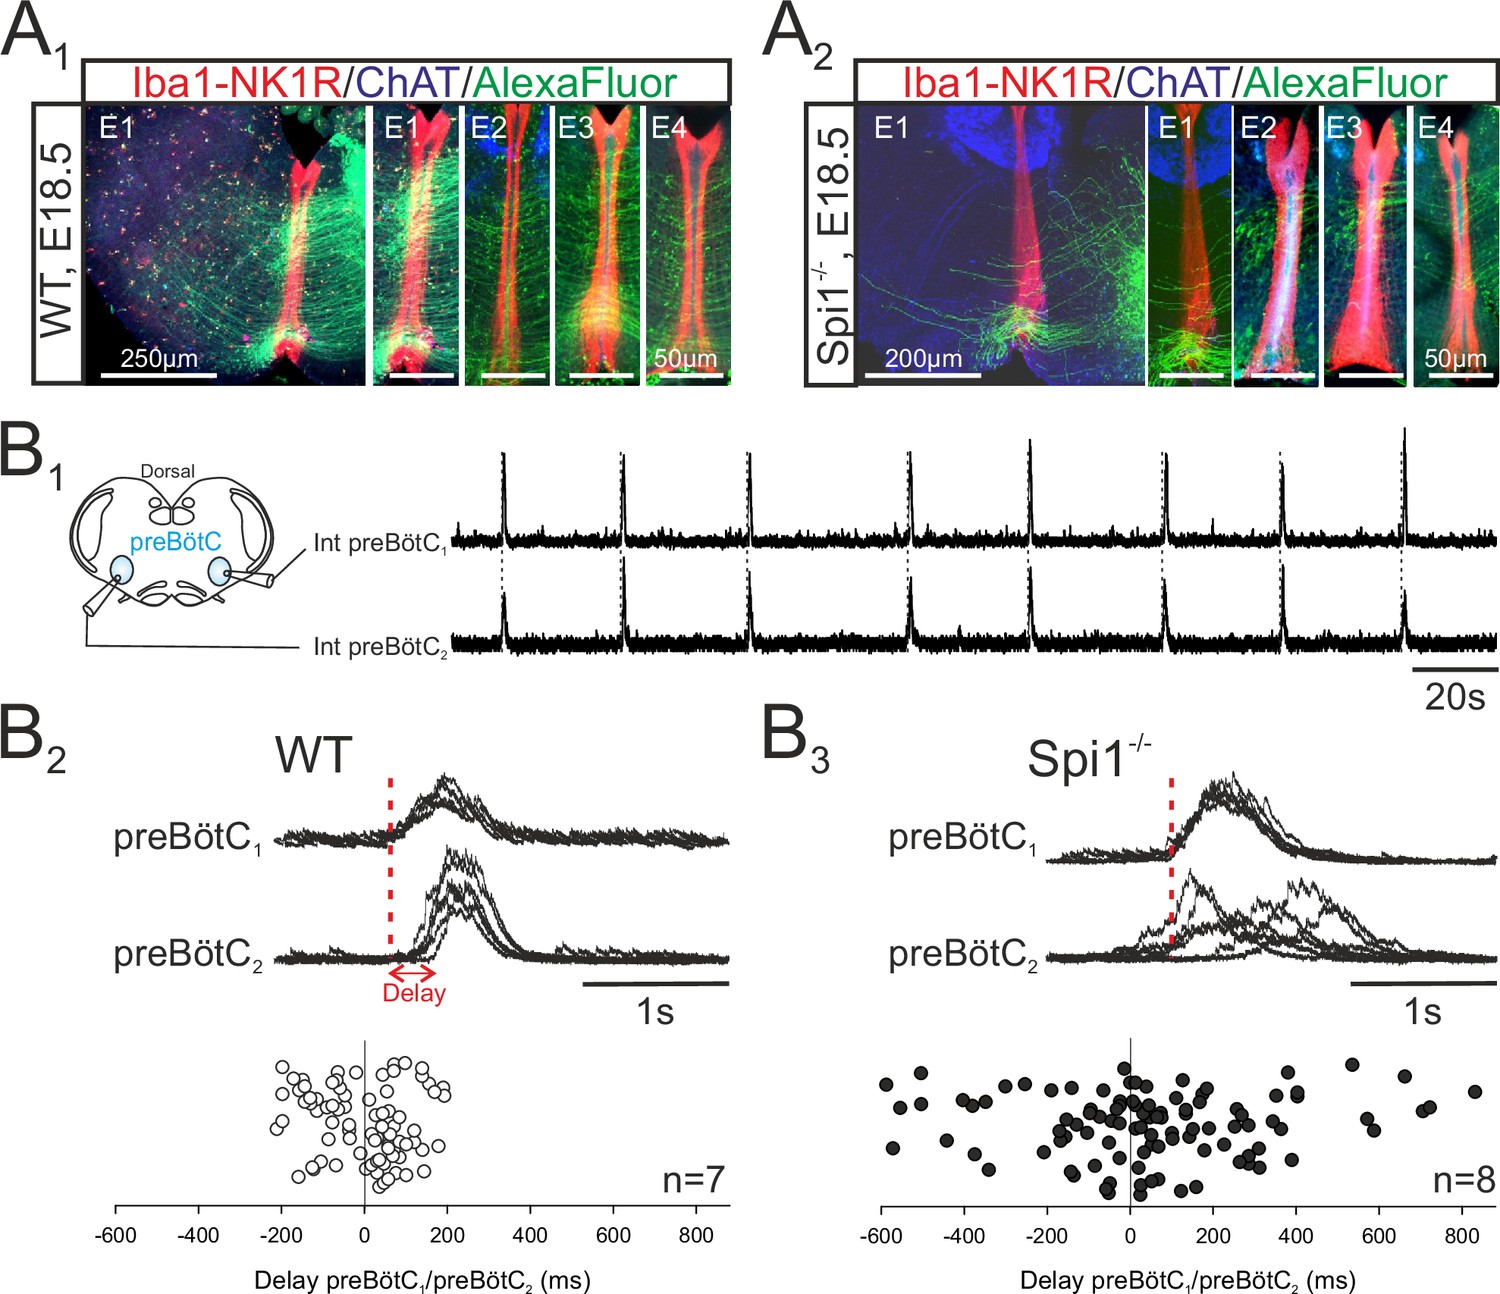
The bilateral preBötzinger complex (preBötC) networks exhibit abnormal commissural projections and diminished inter-network synchronization in the Spi1−/− embryo at E16.5–E18.5.
(A) Photomicrographs of transverse brainstem slice preparations immunolabeled for Iba1 and NK1R (red), ChAT (blue), and with commissural projections from one preBötC network to its contralateral partner labeled with Alexa Fluor 488 (green) for wild-type (WT) (A1) and Spi1−/− (A2) preparations. Commissures crossing the midline are illustrated at a higher magnification for four different preparations (E1–E4) for each genotype. (B1) Simultaneous integrated recordings of bursting activity in bilateral preBötC networks of a transverse brainstem slice from a WT preparation (schematically represented at left) at E16.5. Dashed lines indicate time-related bilateral bursts. (B2) Superimposed integrated traces (n = 7) of recordings of burst activity occurring simultaneously in the two preBötC networks of a WT preparation. The red dashed line indicates the onset of bursts in preBötC1 to which the superimposed traces were aligned. Bottom: Distribution of the delays between the onsets of bursts in the preBötC1 and preBötC2 networks. Values were obtained from 15 consecutive bursts in each of seven different preparations. (B3) Same arrangement as in B2 for Spi1−/− preparations (n = 8). Bursts on both sides are strictly time-locked in the WT but much less synchronized in Spi1−/− embryos at E16.5–E18.5.
Figure 6
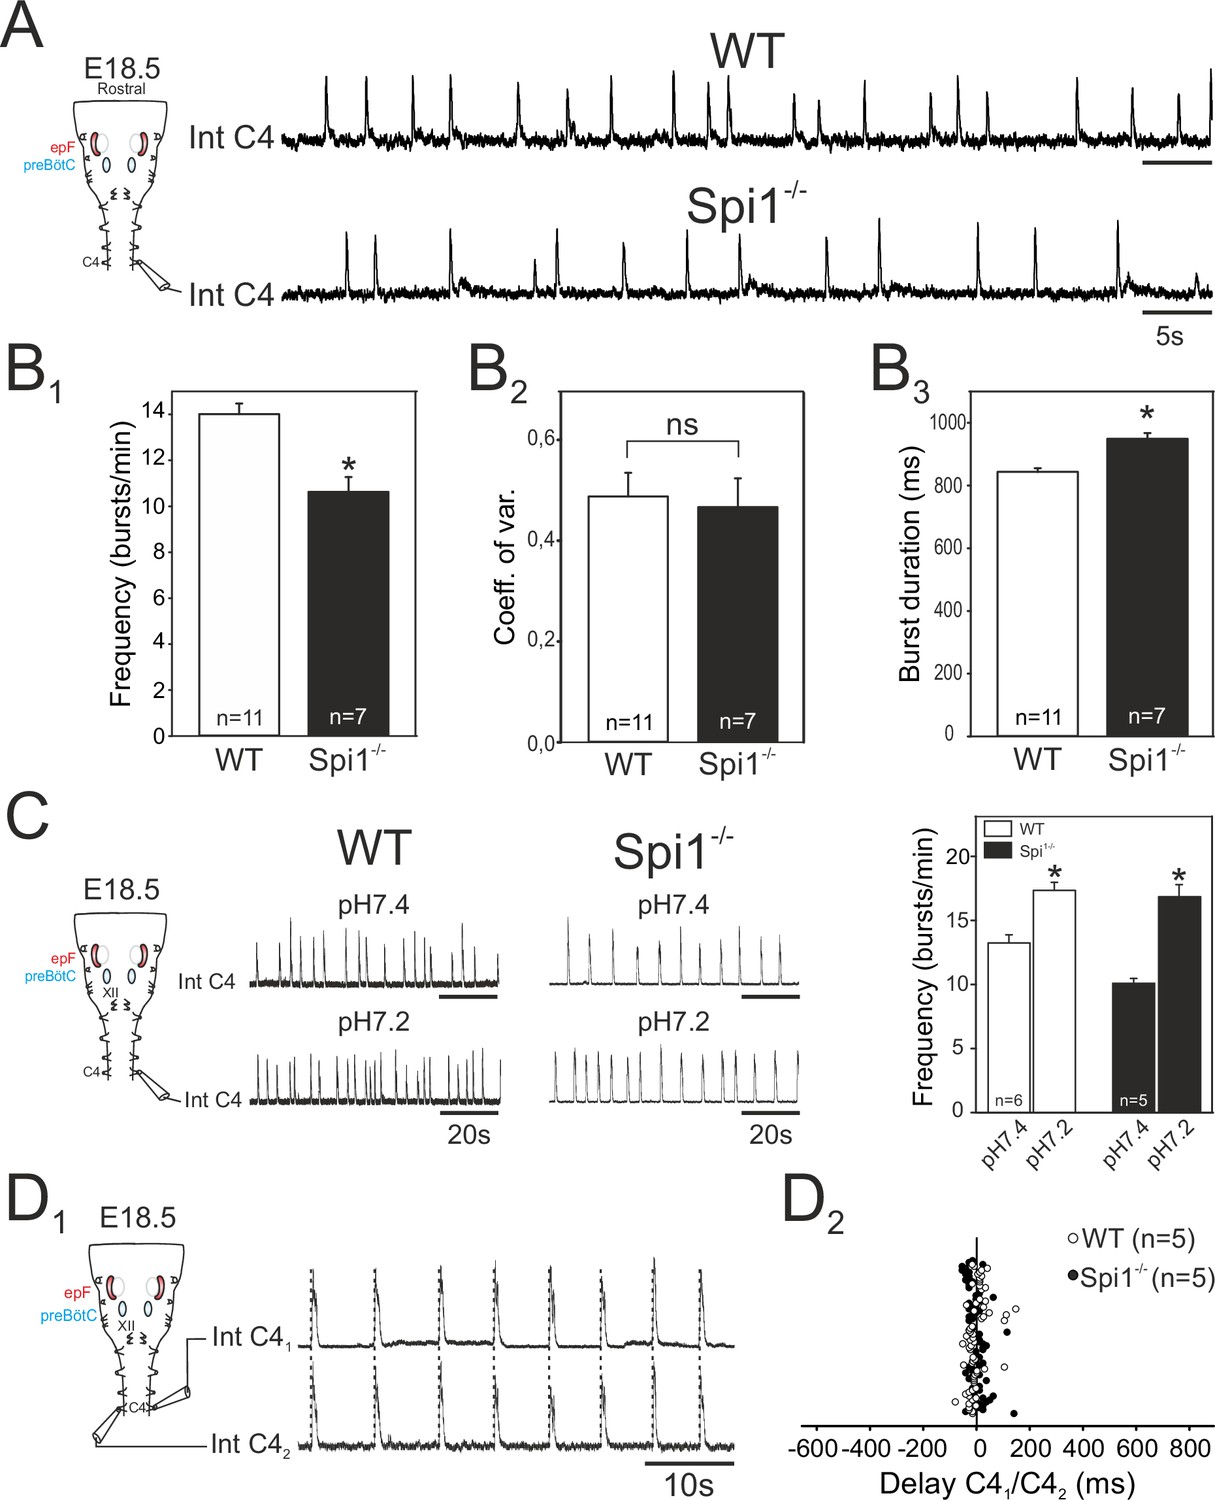
Characterization of respiratory-related activity generated by the isolated hindbrain of Spi1−/− embryos at E18.5.
(A) Left: Schematic representation of the isolated brainstem preparation showing the position of the electrode used to monitor respiratory-related motor activity in the C4 phrenic motor root. Right: Integrated phrenic nerve discharge (Int C4) obtained in a preparation from wild-type (WT) (top) and Spi1−/− (bottom) embryos at E18.5. (B) Quantification of mean phrenic burst frequency (B1), coefficient of variation (B2), and burst duration (B3) for 11 WT (unfilled bars) and 7 Spi1−/− (black bars) preparations. (C) Same layout as in A for activities recorded under artificial cerebrospinal fluid (aCSF) at pH 7.4 (top traces) and at pH 7.2 (bottom traces) for WT (left traces) and Spi1−/− (right traces) preparations. Right: Quantification of mean phrenic burst frequency in pH 7.4 and pH 7.2 for six WT (unfilled bars) and five Spi1−/− (black bars) preparations. (D1) Integrated phrenic neurograms (IntC4) recorded simultaneously from the right and left C4 roots of an isolated hindbrain preparation at E18.5. Vertical dashed lines highlight the left/right synchrony of timely related bursts. (D2) Distribution of the delays between the onsets of bursts recorded simultaneously in the bilateral phrenic roots obtained from 15 consecutive bursts in five WT (unfilled dots) and five Spi1−/− (black dots) preparations. Left and right phrenic bursts are strictly time-coupled in both genotypes. Values are given as mean ± SEM. Student's t test have been performed. Asterisks indicate p < 0.001; ns: p > 0.1; n, number of preparations analyzed. epF: embryonic parafacial respiratory group. The motor output of the central respiratory command recorded from C4 roots was generated at a lower frequency and with longer bursts in the Spi1−/− mutant compared to WT, but remained chemosensitive and bilaterally coordinated.
Figure 7
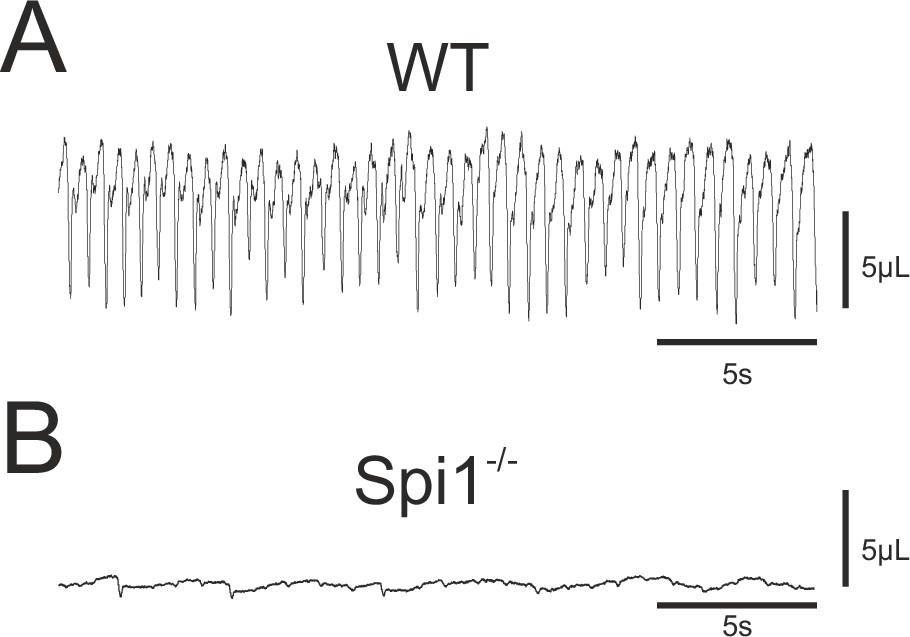
Breathing phenotype of Spi1−/− embryos at E18.5.
Whole-body plethysmographic recordings of breathing behavior by wild-type (WT) (A) and mutant (Spi1−/−) (B) embryos at E18.5. Note a complete absence of breathing activity in B despite a detectable low-amplitude signal representing heartbeat activity.
Additional files
Download links
A two-part list of links to download the article, or parts of the article, in various formats.
Downloads (link to download the article as PDF)
Open citations (links to open the citations from this article in various online reference manager services)
Cite this article (links to download the citations from this article in formats compatible with various reference manager tools)
Microglia shape the embryonic development of mammalian respiratory networks
eLife 11:e80352.
https://doi.org/10.7554/eLife.80352


