Visual experience has opposing influences on the quality of stimulus representation in adult primary visual cortex
- Department of Biomedical Engineering, Carnegie Mellon University, United States
- Center for the Neural Basis of Cognition, Carnegie Mellon University, United States
- Neuroscience Institute, Carnegie Mellon University, United States
- Department of Biological Sciences, Carnegie Mellon University, United States
Figures
Figure 1 with 2 supplements
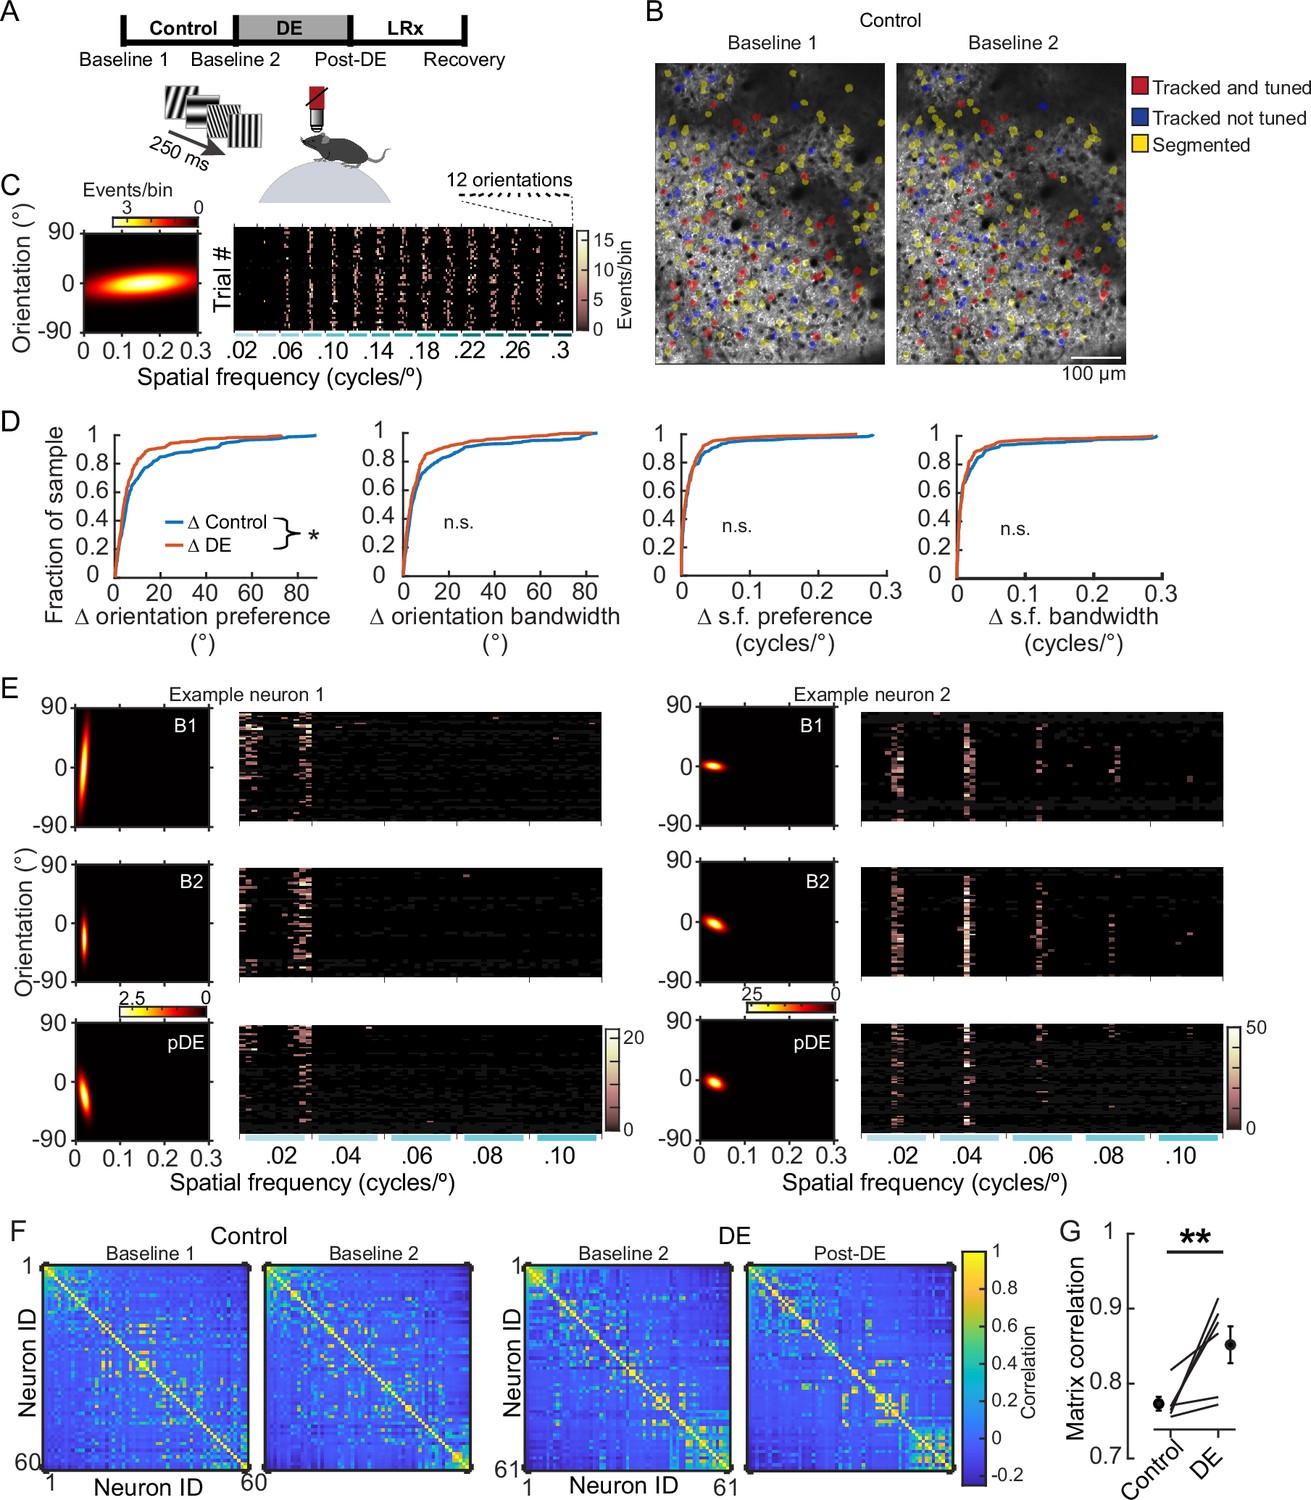
8 days of dark exposure (DE) stabilized orientation preference in V1 neurons.
(A) Experimental design; three conditions were studied: control, DE, and light reintroduction (LRx), bounded by four imaging sessions, as indicated. Imaging sessions were acquired, while static gratings were presented to awake, head-fixed mice, 8±1 days apart. 12 orientations and 15 spatial frequencies, ranging from 0.02 to 0.3 cycles/°, were presented. (B) Example of longitudinal imaging across two sessions. (C) Example neuron tuning curve (left) and trial responses to 180 stimuli (right). Stimulus presentations were sorted post-hoc. (D) The change in four features, as indicated, is plotted for individual neurons and pooled across six animals. Orientation preference was significantly less stable in the control condition (Wilcoxon rank-sum test corrected for four multiple comparisons [z: 2.467], p=0.032; approximately 30% of the population is shifted leftward in the DE condition) in the control condition (n=249 neurons) compared to the DE condition (n=230 neurons). All neurons that were tracked and tuned to grating stimuli on both sessions were included in the analysis. The same set of neurons was used for a given condition but could differ across conditions to maximize the number of neurons tracked. Statistics for the other three parameters, left to right: Wilcoxon rank-sum test corrected for four multiple comparisons (z: 2.213, 1.478, and 0.5596, powere: 0.711, 0.317, and 0.255), p=0.0538, 0.186, and 0.576. (E) Response profiles of two example neurons (tuning curves, left, and trial responses cropped to 0.1 cycles/°, right) are shown for the Baseline 1 (B1), Baseline 2 (B2), and post-DE (pDE) imaging sessions. (F) Example of signal correlation matrices from one animal comparing the B1 and B2 imaging sessions, and the B2 and Post-DE imaging sessions. For visualization of correlation structure, neuron #1 was randomly selected, and the remaining neurons were sorted in descending order. The same sort-matrix was applied to both sessions. (G) Similarity of signal correlation matrices for a given animal (computed as the Pearson’s correlation coefficient between the two signal correlation matrices) was significantly higher in the DE condition compared to the control condition (Wilcoxon rank-sum test [ranksum: 23], p=0.009, n=6 animals). All tracked and tuned neurons were included, as in ‘D’. * p<0.05 and **p<0.01.
Figure 1—figure supplement 1
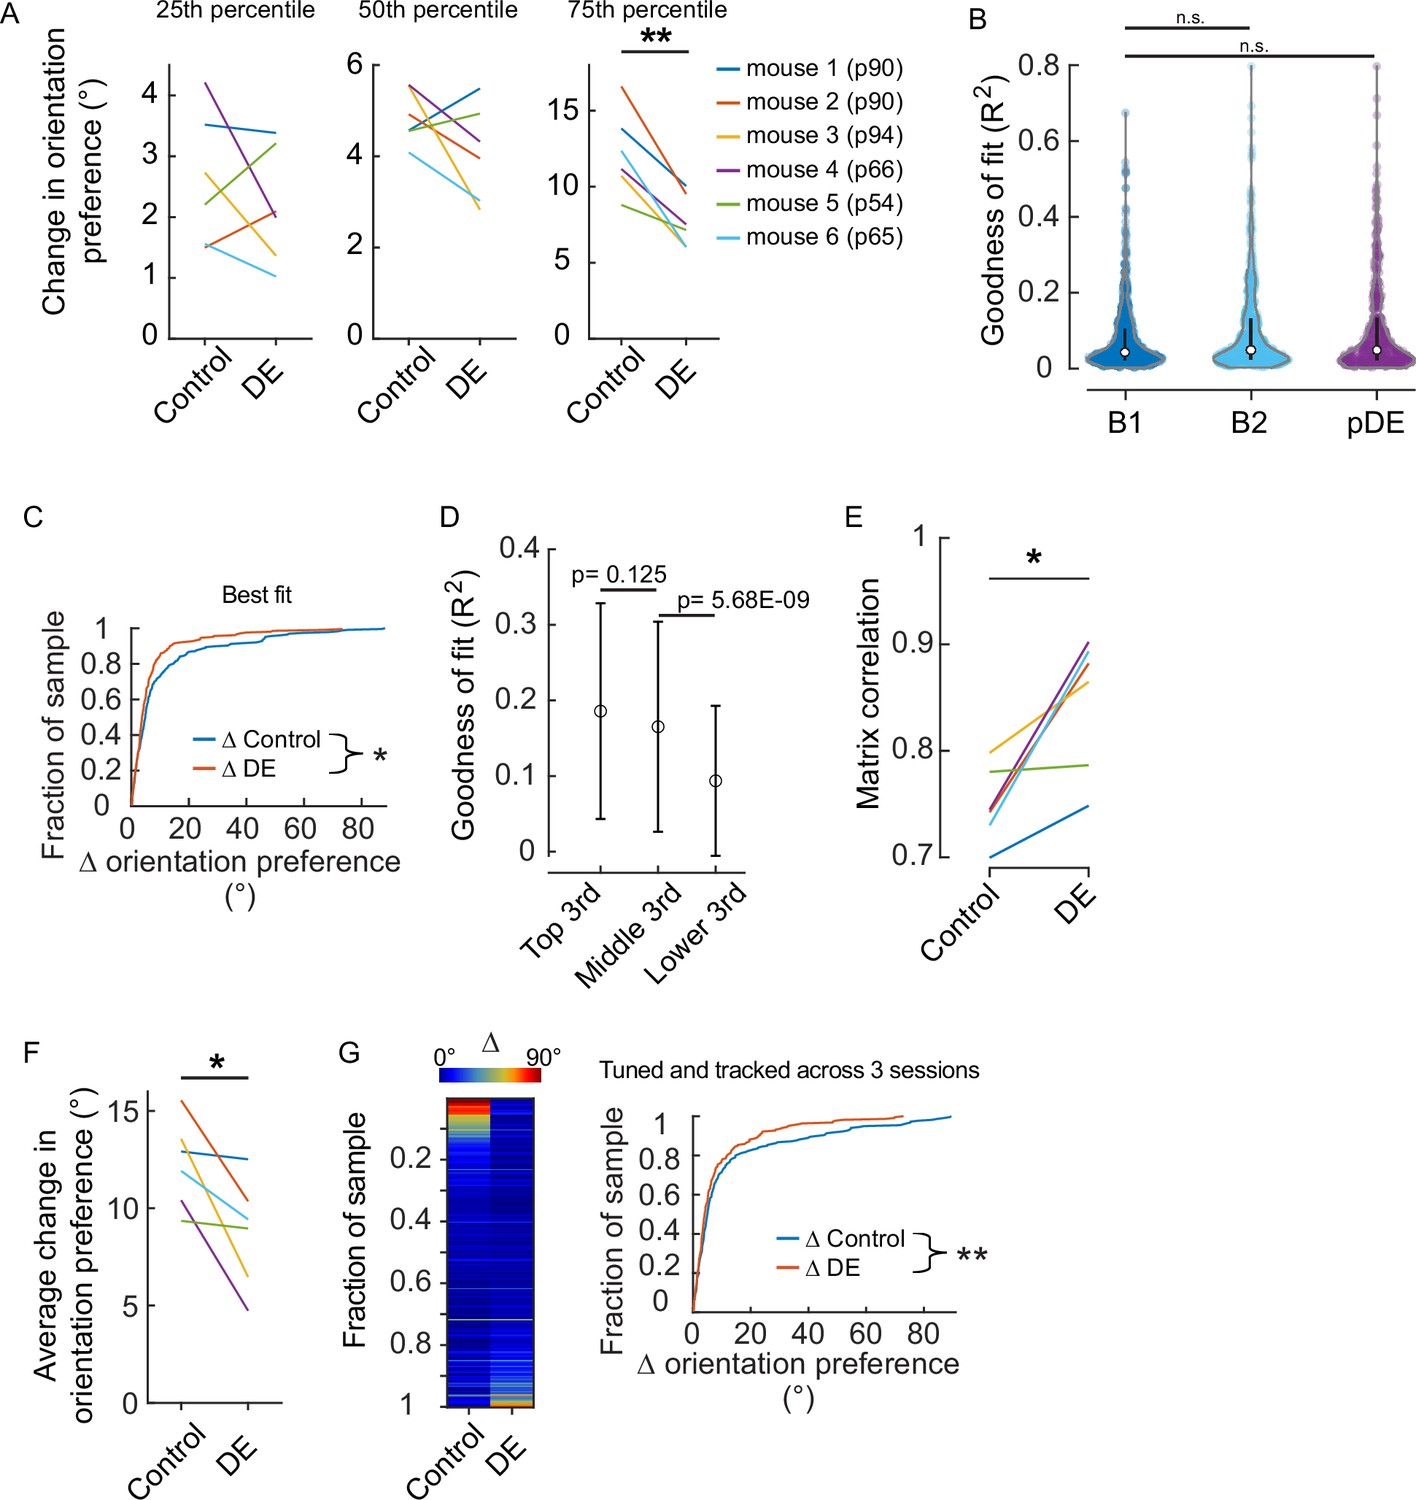
Assessment of the effect of dark exposure (DE) on response stability was not influenced by how well individual neurons were fit by the two-dimensional Gaussian function.
(A) Quartile values of the change in orientation preference for the individual animals shown in Figure 1D. All animals except mouse #5 had a distribution similar to the pooled distribution. Age at the time the animals entered the dark, which was immediately after the ‘Baseline 2’ (B2) imaging session was acquired, is shown in parentheses. Paired t-test values from left to right corrected for three multiple comparisons (df: 5, t: 0.897, 1.484, and 5.63): p=0.411, 0.297, and 0.007. (B) There was not a systematic difference in the quality of fits across the two conditions in which a difference was detected (Figure 1D). Tuning curve fits were not different between baseline 1 (B1, n=601 neurons) and B2 (n=532 neurons) nor between B1 and post-DE (pDE, n=419 neurons) imaging sessions (Wilcoxon rank-sum test corrected for two multiple comparisons [z: –2.0304 and –1.3794, powere: 0.972 and 0.999], p=0.0846 and 0.1678, respectively). (C) The difference in the stability of orientation preference between baseline and DE conditions was detected in the case that the worst-fit neurons were removed from analysis. Goodness of fit R2 values was ranked for all neurons that were determined to be significantly tuned (e.g. included in Figure 1D), and the neurons in the bottom 10% were removed from analysis. Orientation preference was significantly less stable in the baseline condition (Wilcoxon rank-sum test [z: 2.0748], p=0.038; n=266 and n=205 neurons for baseline and DE conditions, respectively). (D) To determine whether the quality of tuning fits was related to the stability of orientation preference, the change in orientation preference for all neurons included in Figure 1D was sorted and divided into three equal groups (n=159 neurons, ‘top,’ ‘middle,’ and ‘lower’), and the two corresponding R square values generated from the two-dimentional Gaussian fits for each neuron were averaged to give one value per neuron. The mean and SD of the R square values are plotted; the values are largely overlapping. p Values are calculated using the Wilcoxon rank-sum test (z: 1.54, –5.83) and are not corrected for multiple comparisons. Importantly, the analysis presented in ‘B’ indicates that the distribution of R square values was similar across conditions, thus this association is unlikely to contribute to the differences observed in Figure 1D. (E) The difference in the stability of signal correlation between baseline and DE conditions was detected when tuning was not included as a criterion. All neurons that were tracked and responsive were included. Similarity of signal correlation matrices for a given animal (computed as the Pearson’s correlation coefficient between the two signal correlation matrices) was significantly higher (Wilcoxon rank-sum test [ranksum: 24], p=0.015) in the DE condition compared to the control condition (n=6 animals). (F) All neurons that were tracked and tuned on sessions B1, B2, and pDE were analyzed by animal. The change in orientation preference was smaller in the DE condition compared to the control condition (paired t-test [df: 5, t:3.036], p=0.0289, n=6 animals). The number of neurons included, by animal: 28, 59, 45, 30, 27, and 30. (G) Same pool of neurons as in ‘E’. Left, neurons were sorted from maximum to minimum change in orientation preference across the two conditions, for all animals. Each row is a single neuron. The change in orientation preference was significantly lower in the DE condition compared to control (paired t-test [df: 218, t:2.751], p=0.00644, n=219 neurons from six animals). Note, qualitatively the fraction of neurons showing large changes in orientation preference was higher in the baseline condition compared to the DE condition. Right, the same data plotted as a cumulative distribution. *p<0.05 and ** <0.01.
Figure 1—figure supplement 2
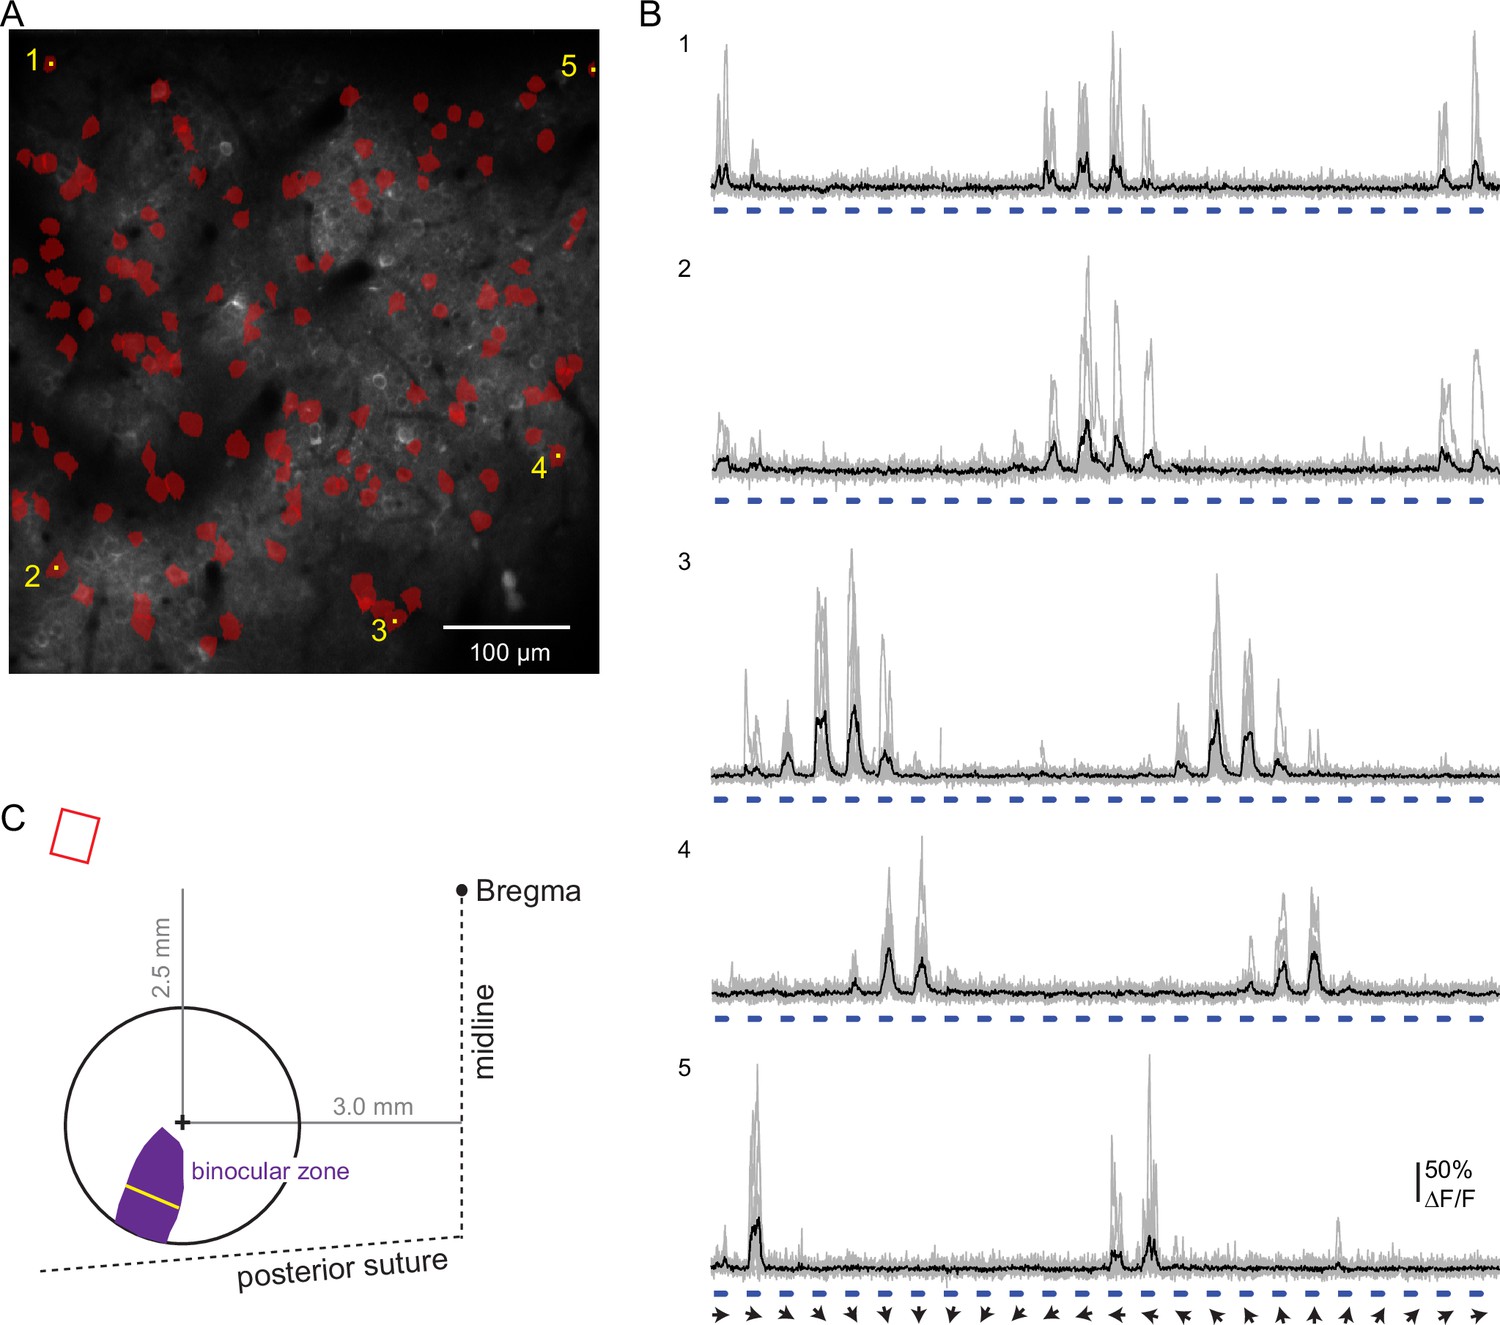
Strategy to target the imaging field of view to binocular V1.
(A) Size and position of the binocular zone in V1 (purple) in the left hemisphere relative to the center of the chronic window (+). At the widest, the binocular zone is 737 microns (yellow line), calculated based on data from Wagor et al., 1980; Kalatsky and Stryker, 2003; Samonds et al., 2019. The distance of the window center from Bregma is indicated. Upper left, relative angle and scaled size of the imaging field of view (red). (B) Imaging field of view contains binocular neurons extending across the entire field. Neurons responsive to ipsilateral pathway stimulation (red) were identified in a pilot experiment (one animal). (C) Example ipsilateral-driven activity in response to full field drifting gratings (0.02 cycles/°, 1 Hz). Individual trials (gray) and the mean (black) are shown. Angle of the stimulus drift is indicated (arrows). Stimulus duration, 1.5 s, is indicated in blue. Calcium indicator was expressed using AAV virus (pAAV.Syn.GCaMP6f.WPRE.SV40) in this case. Scale bar: 100 microns.
Figure 2
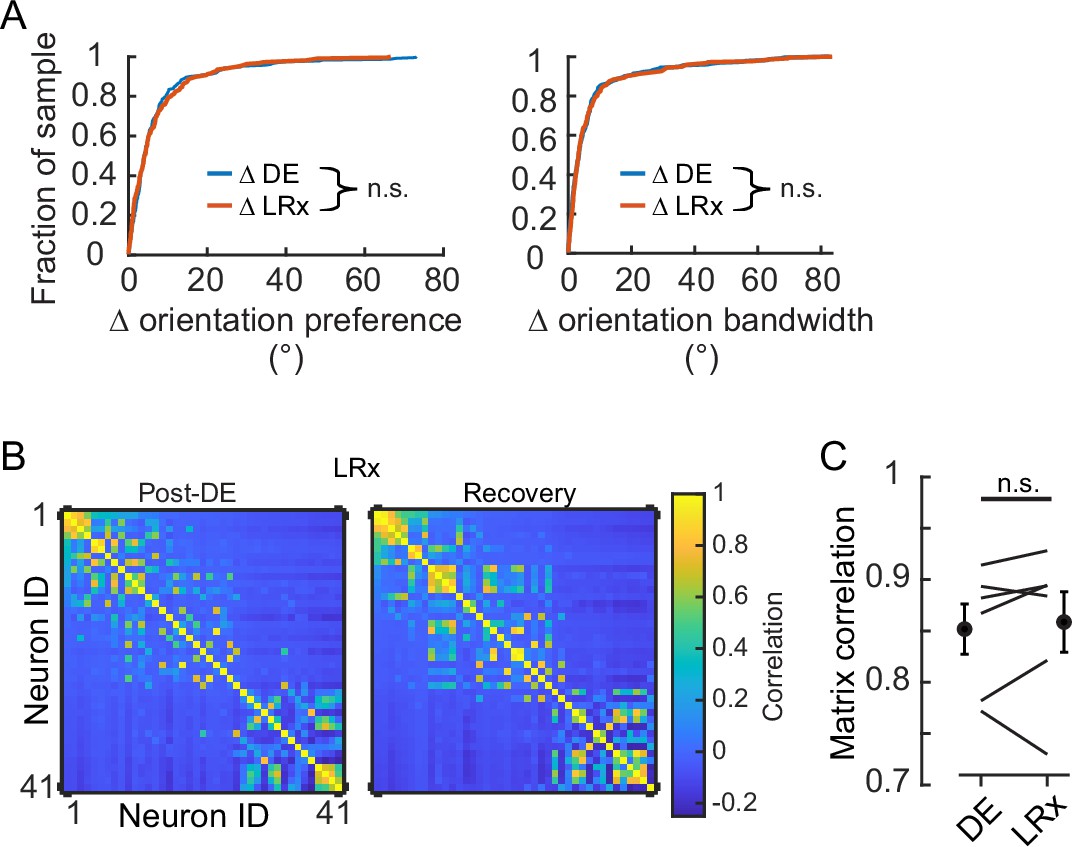
Light reintroduction (LRx) did not disrupt tuning in V1 neurons.
(A) Neither the change in orientation preference or bandwidth was different between dark exposure (DE) and LRx conditions (Wilcoxon rank-sum test corrected for two multiple comparisons [z:–0.3098 and 0.2599, powere: 0.110 and 0.100], p=0.795 and p=0.999, respectively; n=230 and n=216, respectively). All tracked and tuned neurons were included. (B) Example of signal correlation matrices from one animal comparing the post-DE (pDE) and recovery (Rec) imaging sessions. For visualization of correlation structure, neuron #1 was randomly selected, and the remaining neurons were sorted in descending order. The same sort-matrix was applied to both sessions. (C) Similarity of signal correlation matrices for a given animal (computed as the Pearson’s correlation coefficient) was not different across the DE condition compared to the Rec condition (Wilcoxon rank-sum test [ranksum: 35, powere: 0.999], p=0.589, n=6 animals). All tracked and tuned neurons were included.
Figure 3 with 1 supplement
Dark exposure transiently decreased neural discriminability.
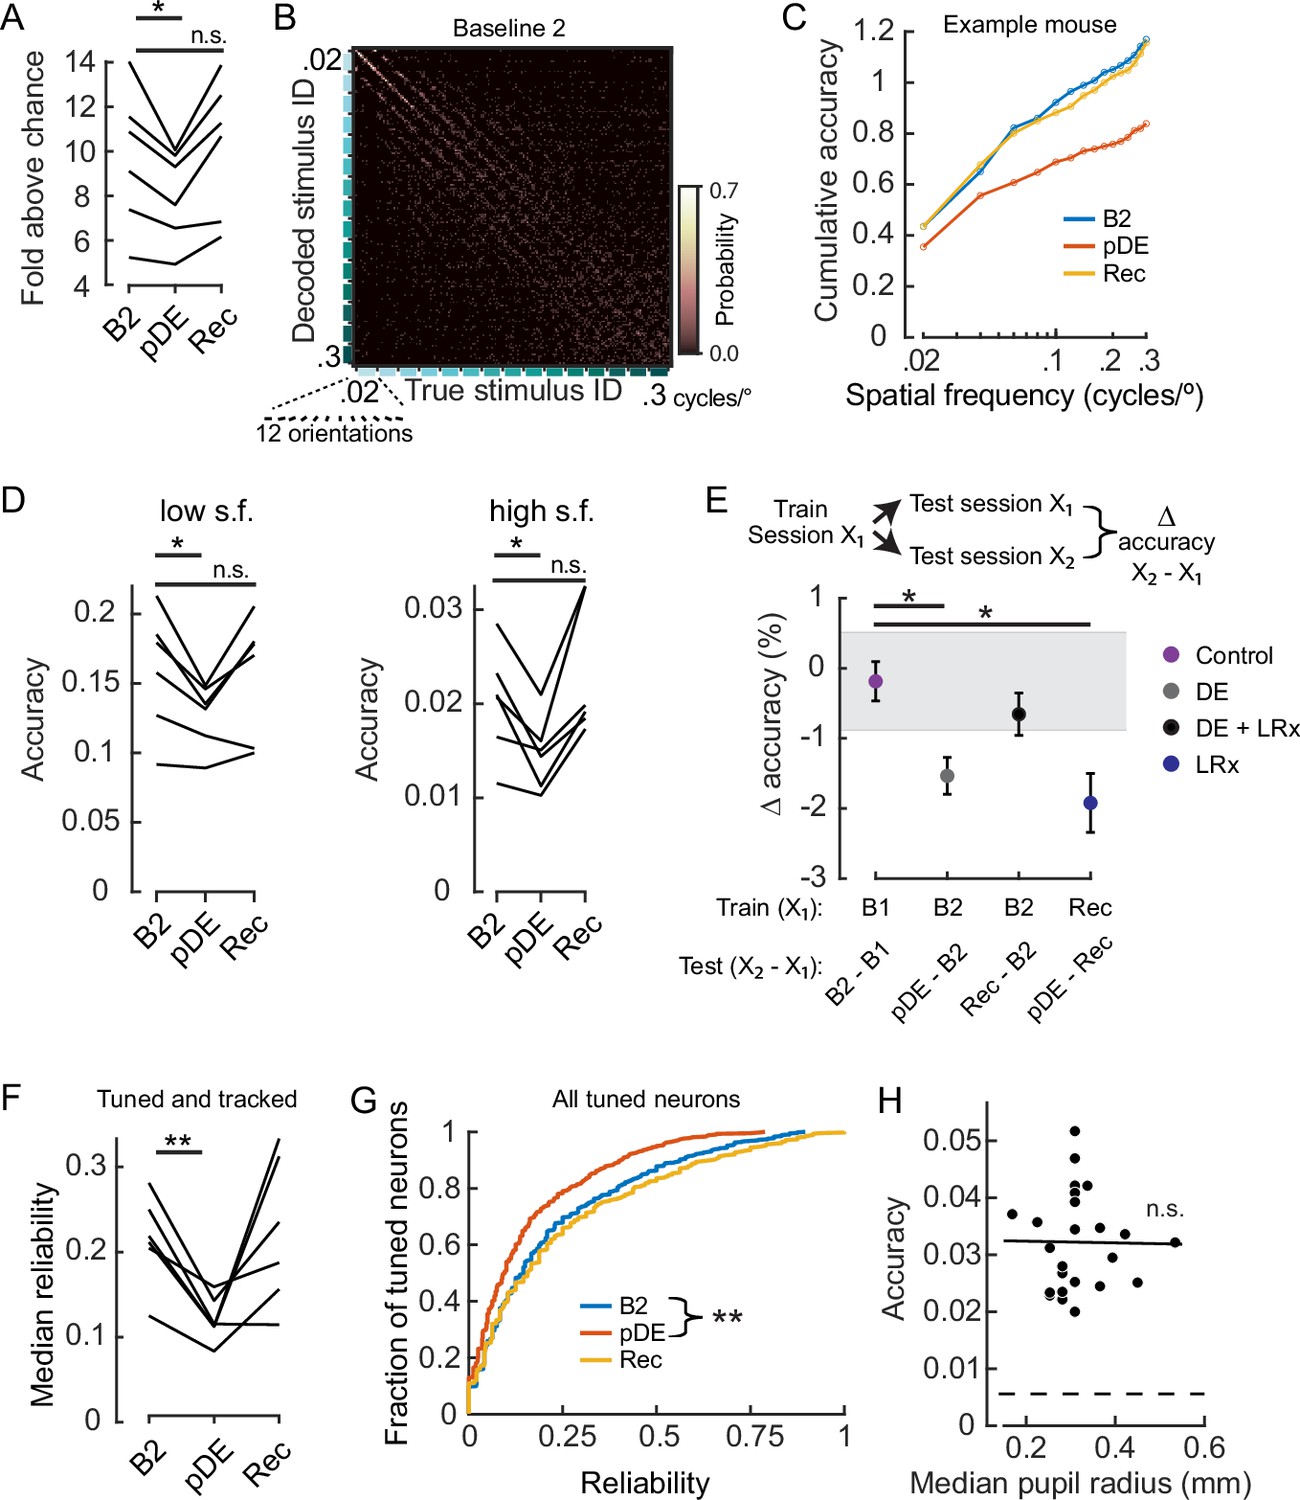
(A) Classification accuracy was significantly lower during the post dark exposure (pDE) imaging session compared to the Baseline 2 imaging session (B2), and recovered within 8 days of light reintroduction (LRx; paired t-test corrected for two multiple comparisons [df: 5, t: 3.234], p=0.046 and 0.16; n=6 animals). All neurons that were tracked across the B2, pDE and Recovery (Rec) sessions were included. See Methods for number of neurons and trials. Chance was 0.0056. (B) Example of a confusion matrix from one animal during the B2 imaging session. (C) Cumulative sum of classifier accuracy, same mouse as in ‘B.’ The classification accuracies of the 12 orientations for a given spatial frequency were averaged to produce 15 data points. (D) Classifiers using only low (≤0.1 cycles/°, 60 stimuli) and high (>0.1 cycles/°, 120 stimuli) spatial frequency stimuli were decoded separately. In both cases, accuracy decreased during the pDE imaging session compared to the B2 session (paired t-test corrected for two multiple comparisons [df: 5, t: 3.434 and 3.687], p=0.037 and p=0.028, respectively), and recovered within 8 days of LRx (paired t-test corrected for two multiple comparisons [df: 5, t: 0.417 and –1.286, power: 0.063 and 0.188], p=0.69 and p=0.25, respectively). Chance was 0.0167 and 0.0083, respectively. (E) Fixed classifiers were used to quantify representational drift (n=6 animals, the mean ± SEM). The session used to train the classifier is indicated, as well as the specific sessions tested and the condition label. Note, the rate of drift between the Rec and B2 imaging sessions was comparable to ±1 STD of the baseline drift (gray). In contrast, the rate of drift was significantly higher during the DE and LRx conditions compared to the control condition (paired t-test, corrected for three multiple comparisons, values left to right [df: 5,t: 4.056, 1.086, and 3.280], p=0.0293, 0.327, and 0.0329). All neurons that were tracked for a given tested session pair were included. (F) The median reliability of responses to the preferred stimulus for a given animal was significantly lower during the pDE imaging session compared to the B2 imaging session (paired t-test corrected for two multiple comparisons [df: 5, t: 5.474 and –0.2081], p=0.006 and 0.843); n=6 animals. All tracked and tuned neurons for a given session were included. (G) Reliability of individual neuron responses to the preferred stimulus, pooled across animals, was significantly reduced during the pDE imaging session and recovered within 8 days of light reintroduction (Wilcoxon rank-sum corrected for two multiple comparisons [z: 4.670 and –0.9493], p=6.0E-06 and 0.343). All tuned neurons were included, n=532 B2, n=419 pDE, and n=450 Rec. (H) Decoding accuracy was not correlated with pupil radius (Pearson’s correlation [r: –0.013], p=0.951). All imaging sessions from six animals were included. Least-squared line indicated. Neuron number (36) was set to the minimum number of tuned neurons among all animals and sessions; trial number (25) was set to the minimum number of trials among all animals and sessions. * p<0.05 and **<0.01.
Figure 3—figure supplement 1
Extended reliability and basal activity analysis.
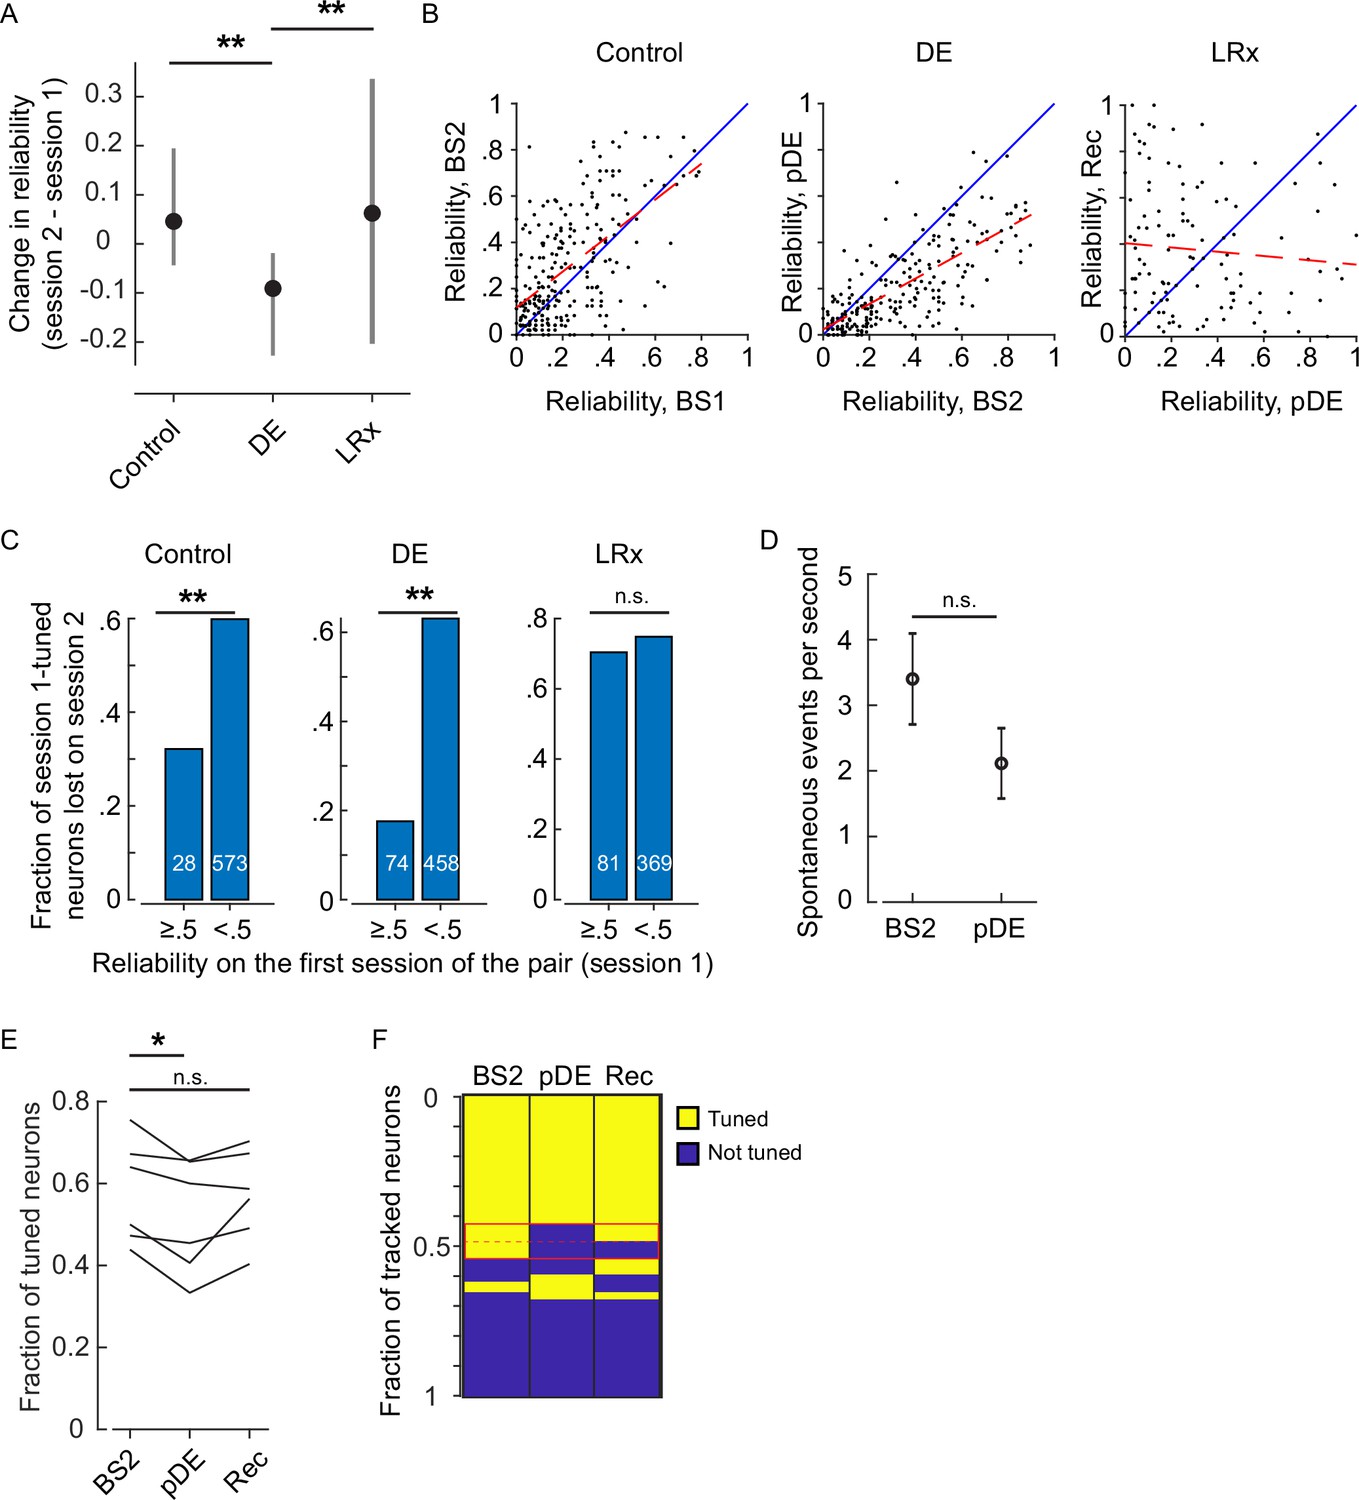
(A) The within-neuron change in reliability was lowest in the dark exposure (DE) condition (Wilcoxon rank-sum corrected for three multiple comparisons, control versus DE, and DE versus light reintroduction [LRx] [z: 10.832 and 5.4766], p=7.286E-27 and p=6.502E-8, n=249 neurons control, n=230 neurons DE, and n=117 neurons LRx). All neurons that were tracked and tuned for both of the imaging sessions comprising the condition were included. Furthermore, the change in reliability was skewed in the positive direction in the control and LRx conditions and negatively skewed in the DE condition (single-sample KS-test corrected for three multiple comparisons, control, DE, and LRx values: [k: 0.3638, 0.4242, and0.2350], p=2.993E-29, 2.138E-36, and 3.705E-6). (B) In the control and DE conditions, reliability was significantly correlated across sessions (Pearson’s correlation [r: 0.598, 0.7430, and –0.0901], p=1.53e-25, 1.25e-41, and 0.334, n=249 neurons control, n=230 neurons DE, and n=117 neurons LRx). This correlation was not present in the LRx condition, as might be expected given reliability was higher in the recovery imaging session compared to the post-DE (pDE) imaging session. The least-squares fit (dashed red) and unity line (blue) are shown. (C) Neurons were categorized as either have high (≥0.5) or low (<0.5) reliability in the first imaging session for a given condition (control, DE, or LRx) and then scored as either tuned or untuned in the second session. The fraction of previously tuned neurons that became untuned was significantly lower in the high reliability category for the control and DE condition (two-sample proportions Z-test corrected for three multiple comparisons [z: 2.907, 7.336, and 0.8224], p=0.0054, 6.6015e-13, and 0.4108, number of tracked neurons in each category that were tuned on the first session indicated in white). (D) Basal activity during gray screen presentation is not higher in the imaging session immediately following DE (t-test [df: 949, t: –1.4068, power: 0.311], p=0.1598, n=532 neurons BS2, n=419 neurons pDE). (E) Considering the three-session tracked pool of neurons, on average, there was a 11% decrease in the fraction of tuned neurons across the six mice on the pDE session compared to the BS2 session (paired t-test corrected for two multiple comparisons, [df: 5, t: 3.600 and –2.235], p=0.0311 and p=0.6867). (F) Neurons tracked for the three sessions were pooled and scored as either tuned or untuned. Each row is a single tracked neuron. The red box highlights the neurons that lost tuning on the pDE imaging session. Note, roughly half of those neurons re-gained tuning on the recovery imaging session. Additionally, some neurons that were not previously tuned became tuned (plotted immediately below the red box). *p<0.05 and ** p<0.01.
Author response image 1

Analysis of R squared values.
The change in orientation preference for all neurons included in Figure 1D were sorted and divided into three equal groups (n = 159 neurons, ‘Top’, ‘Middle’, and ‘Lower’) and the two corresponding R square values generated from the 2-dimentional Gaussian fits for each neuron were averaged to give one value per neuron. The mean and standard deviation of the R square values are plotted; the values are largely overlapping. P values are calculated using the Wilcoxon rank-sum test and are not corrected for multiple comparisons. As expected, there is a correlation between orientation stability and the R square value. Importantly, the analysis presented in Figure 1 —figure supplement 1B indicates that the distribution of R square values is similar across conditions.
Author response image 2
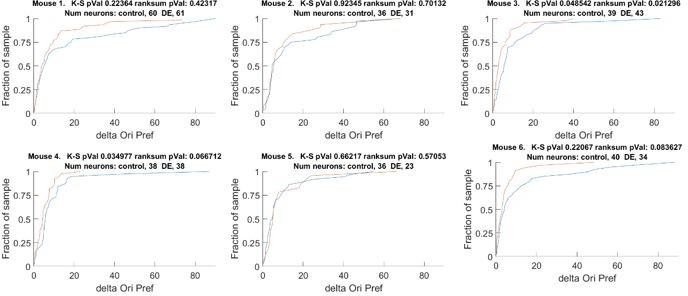
The change orientation preference of individual animals that comprises Figure 1D.
Blue line Δ Control, Red line Δ DE. The number of neurons on an individual animal basis is too small to make statistical inferences. Note, the trend is present in 5 of 6 mice. See also Figure 1 —figure supplement 1A.
Tables
Table 1
Animal information including age at each imaging session.
| Animal ID | Animal label | Sex | Age at time of imaging, days old(days in between sessions) | |||
|---|---|---|---|---|---|---|
| Baseline 1 | Baseline 2 | Post-DE | Recovery | |||
| 2452_1R | Mouse 1 | M | 83 | 90 (7) | 98 (8) | 106 (8) |
| 2452_1R1L | Mouse 2 | M | 83 | 90 (7) | 98 (8) | 106 (8) |
| 2454_1R | Mouse 3 | M | 86 | 94 (8) | 102 (8) | 110 (8) |
| 2472_1L | Mouse 4 | F | 59 | 66 (7) | 74 (8) | 82 (8) |
| 2473_1R | Mouse 5 | M | 45 | 54 (9) | 62 (8) | 70 (8) |
| 2474_1R1L | Mouse 6 | F | 56 | 65 (9) | 73 (8) | 81 (8) |
Additional files
-
Supplementary file 1
Fraction of neurons included, organized by figure.
(A) Fraction of responsive neurons: Data are normalized to the number of neurons segmented in a given session. The SEM was non-overlapping between Baseline 1 (B1) and post dark exposure (pDE), therefore one STD is included. The fraction of responsive neurons in B1 versus pDE was not significantly different (paired t-test [df: 5, t: 2.213, power: 0.433], p=0.078; n=6 animals). (B) Fraction of neurons included in Figures 1 and 2: Data are normalized to the number of neurons segmented in a given session. The SEM was overlapping in all cases. (C) Fraction of neurons included in Figure 3: Data are normalized to the number of neurons segmented in a given session. In Figure 3A and D, the SEM was non-overlapping between Baseline 2 (B2), pDE, and Rec, therefore one STD is included; the fraction of included neurons in B2 versus pDE and B2 versus Rec was not significantly different (paired t-test [df: 5, t: −2.458,–2.685, power: 0.509, 0.580], adjusted for two multiple comparisons, p=0.0574 and p=0.0871, respectively; n=6 animals). In Figure 3E, the SEM was non-overlapping between B1 and B2 (pDE-B2), therefore one STD is included; the fraction of included neurons in B1 versus B2 (pDE-B2) was not significantly different (paired t-test [df: 5, t: 2.50, power: 0.523], p=0.0545; n=6 animals). (D) Fraction of neurons included in Figure 1—figure supplement 1: Data are normalized to the number of neurons segmented in a given session. The SEM was overlapping in all cases.
- https://cdn.elifesciences.org/articles/80361/elife-80361-supp1-v1.docx
-
MDAR checklist
- https://cdn.elifesciences.org/articles/80361/elife-80361-mdarchecklist1-v1.docx
-
Source data 1
Two-dimensional Gaussian tuning curve fits.
Tuning curves for all neurons scored as significantly tuned and tracked, for each of the three conditions: control, dark exposure (DE), and light reintroduction (LRx).
- https://cdn.elifesciences.org/articles/80361/elife-80361-data1-v1.zip
Download links
A two-part list of links to download the article, or parts of the article, in various formats.
Downloads (link to download the article as PDF)
Open citations (links to open the citations from this article in various online reference manager services)
Cite this article (links to download the citations from this article in formats compatible with various reference manager tools)
Visual experience has opposing influences on the quality of stimulus representation in adult primary visual cortex
eLife 11:e80361.
https://doi.org/10.7554/eLife.80361


