Flexing the principal gradient of the cerebral cortex to suit changing semantic task demands
- Department of Psychology, University of York, United Kingdom
- Department of Psychology, University of Arizona, United States
- MRC Cognition and Brain Sciences Unit, University of Cambridge, United Kingdom
- Integrative Neuroscience and Cognition Center (UMR 8002), Centre National de la Recherche Scientifique, France
- Department of Psychology, Queens University, Canada
Figures
Figure 1
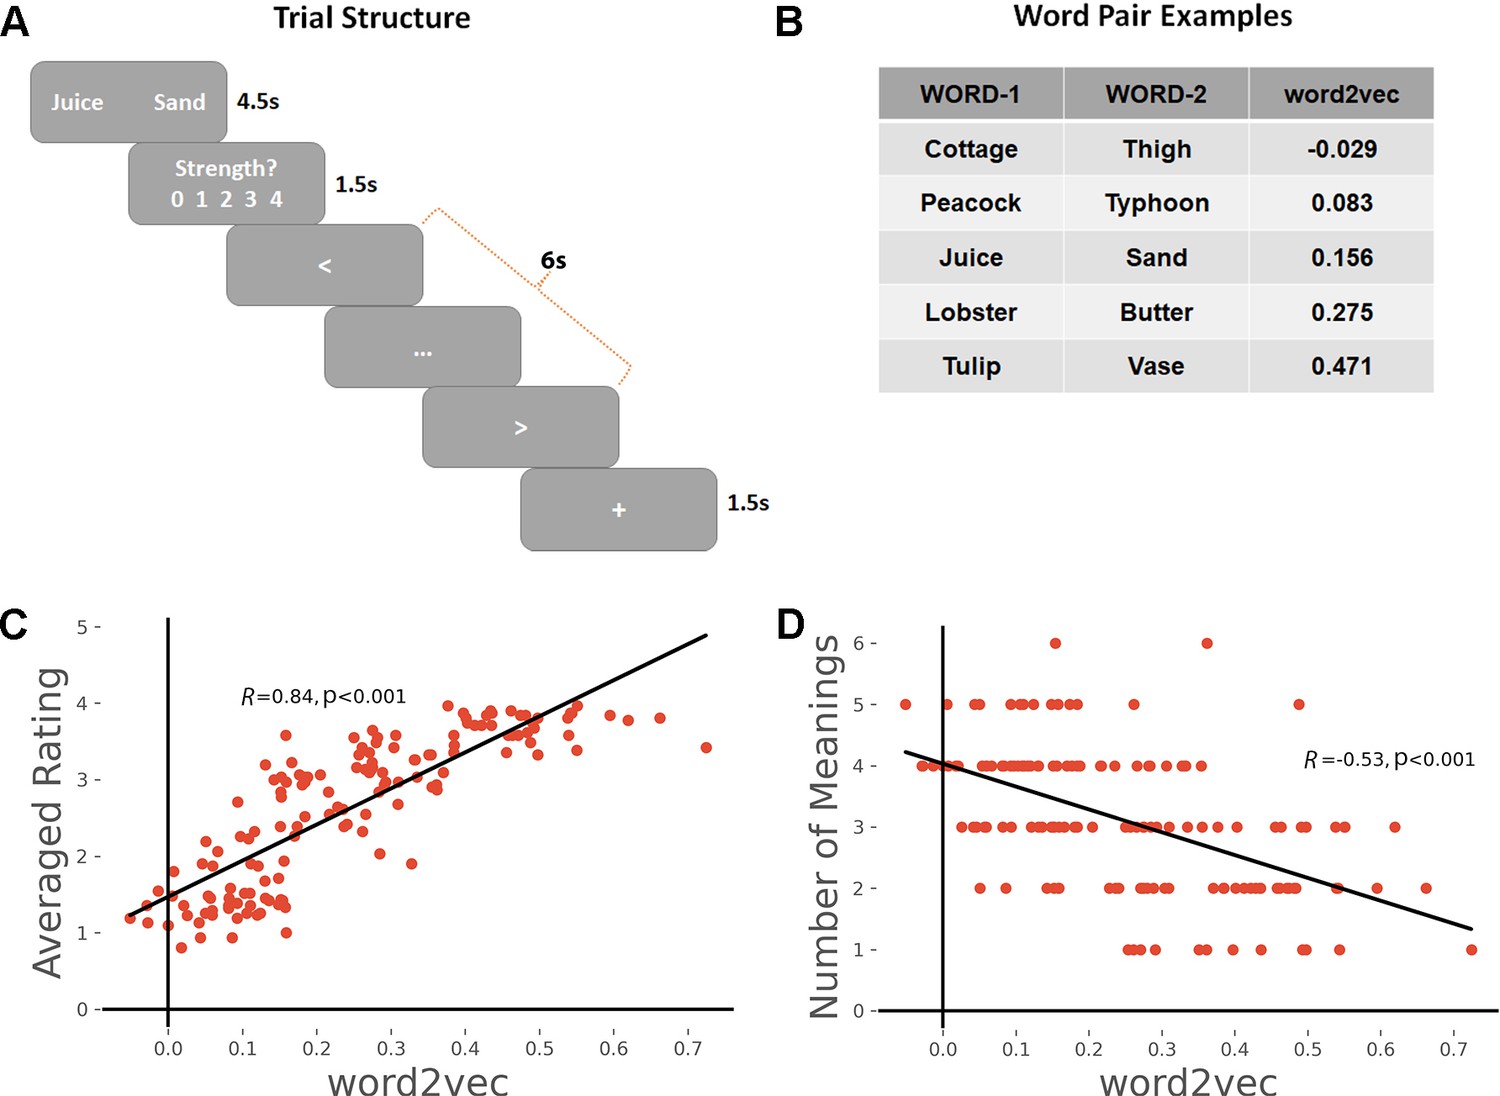
(A) Task schematic; participants were asked to produce a link between the words and rate the strength of the link.
(B) Word-pair examples with association strength ranging from weak to strong, based on word2vec scores. (C) The average rating of link strength for each word-pair was positively associated with its word2vec score. (D) The number of meanings produced by the group of participants for each word-pair was negatively associated with the word2vec score. All data reflect n = 31 independent participants.
Figure 2 with 5 supplements
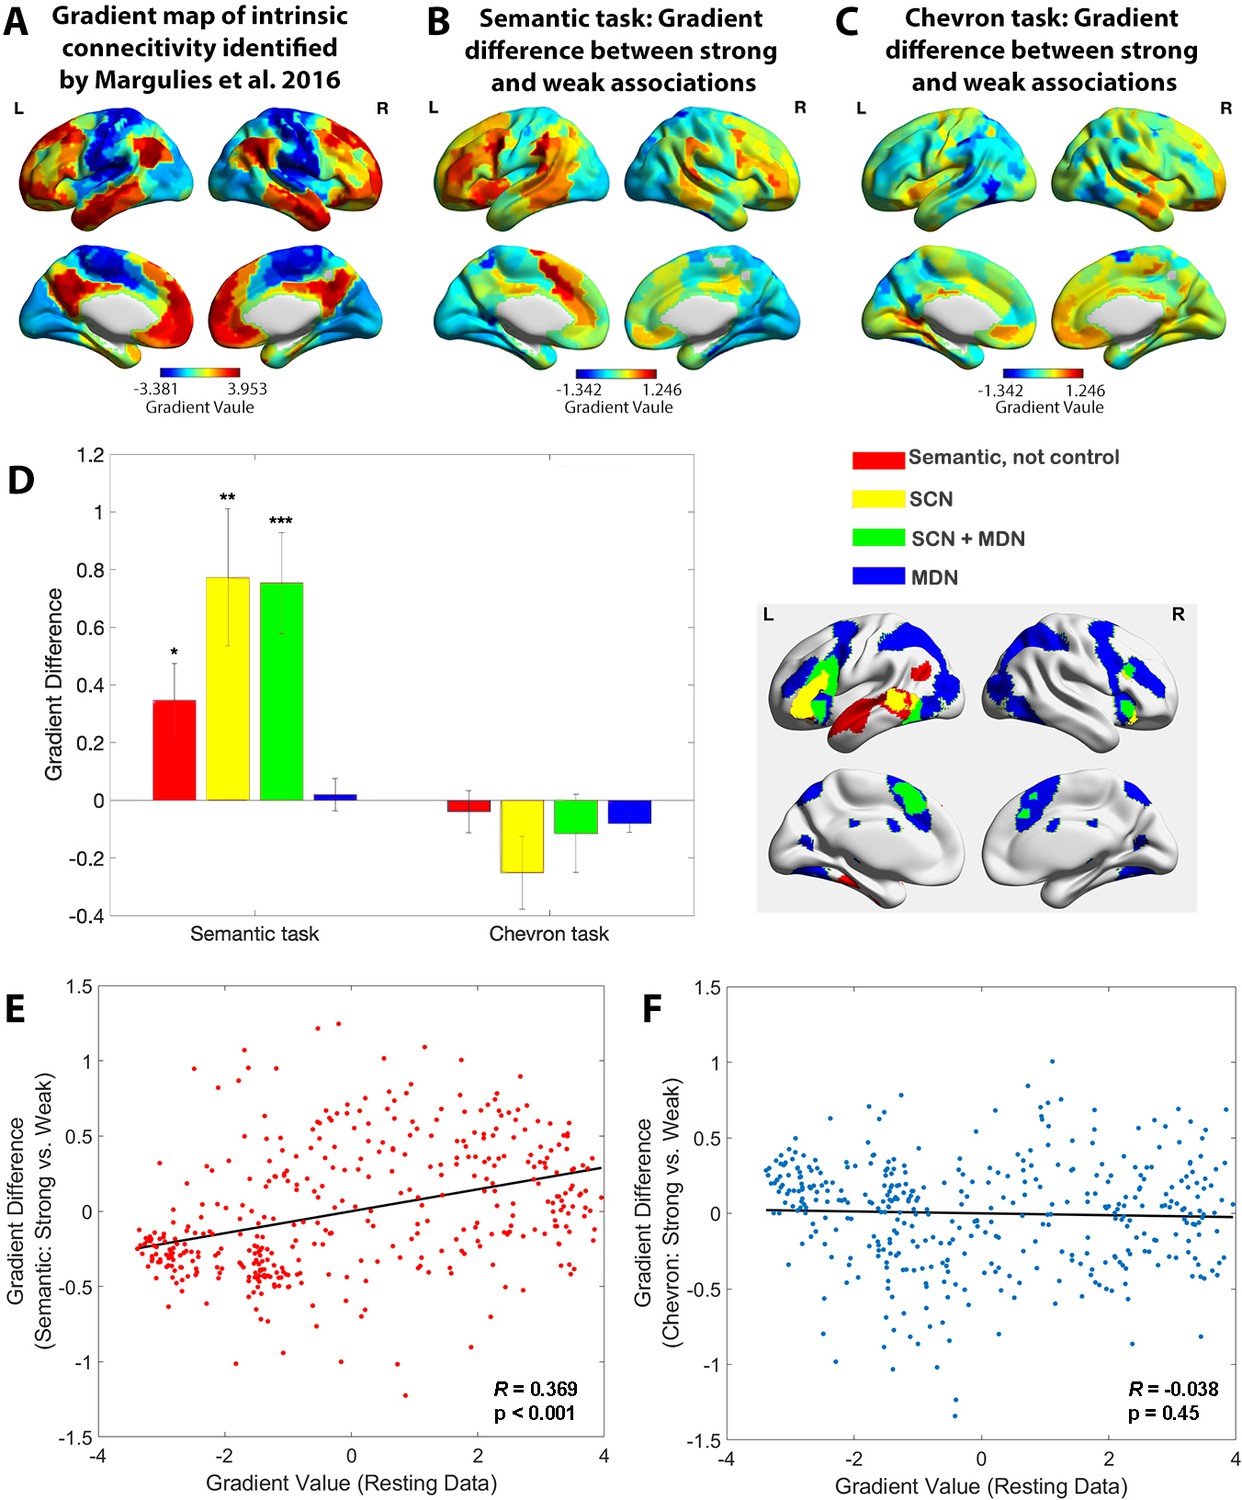
The principal gradient of cortical organisation was modulated by strength of association.
(A) The principal gradient map identified from intrinsic connectivity reported by Margulies et al., 2016. (B) The difference map of principal gradient values during the semantic task comparing strong and weak associations estimated using the informational connectivity approach and brain responses in TR 4–6. (C) The difference map of principal gradient values during the chevron task, comparing time points that followed strong and weak associations, estimated using the informational connectivity approach and brain responses in TR 9–10. (D) Left panel. The difference in principal gradient values between strong and weak association trials showed a significant interaction effect between functional networks and tasks (F(2.53, 75.887) = 8.345, p < 0.001, η2p = 0.218). Error bars represent the standard error of gradient difference across parcels within each network. Right panel. Functional networks: (i) semantic not control, (ii) within the semantic control network (SCN) but outside multiple-demand cortex (DMN), (iii) within both SCN and multiple-demand network (MDN), and (iv) falling in MDN regions not implicated in semantic cognition. (E) Using Schaefer’s 400 parcellation, gradient difference values in each parcel for strong and weak associations in the semantic task were positively associated with the principal gradient values of these parcels, estimated from independent resting data. (F) No correlation between informational connectivity differences per parcel and principal gradient values estimated from resting-state fMRI data was observed for the chevron task when comparing timepoints that followed strong and weak semantic associations. *p < 0.05, **p < 0.01, ***p < 0.001. All data reflect n = 31 independent participants.
Figure 2—figure supplement 1
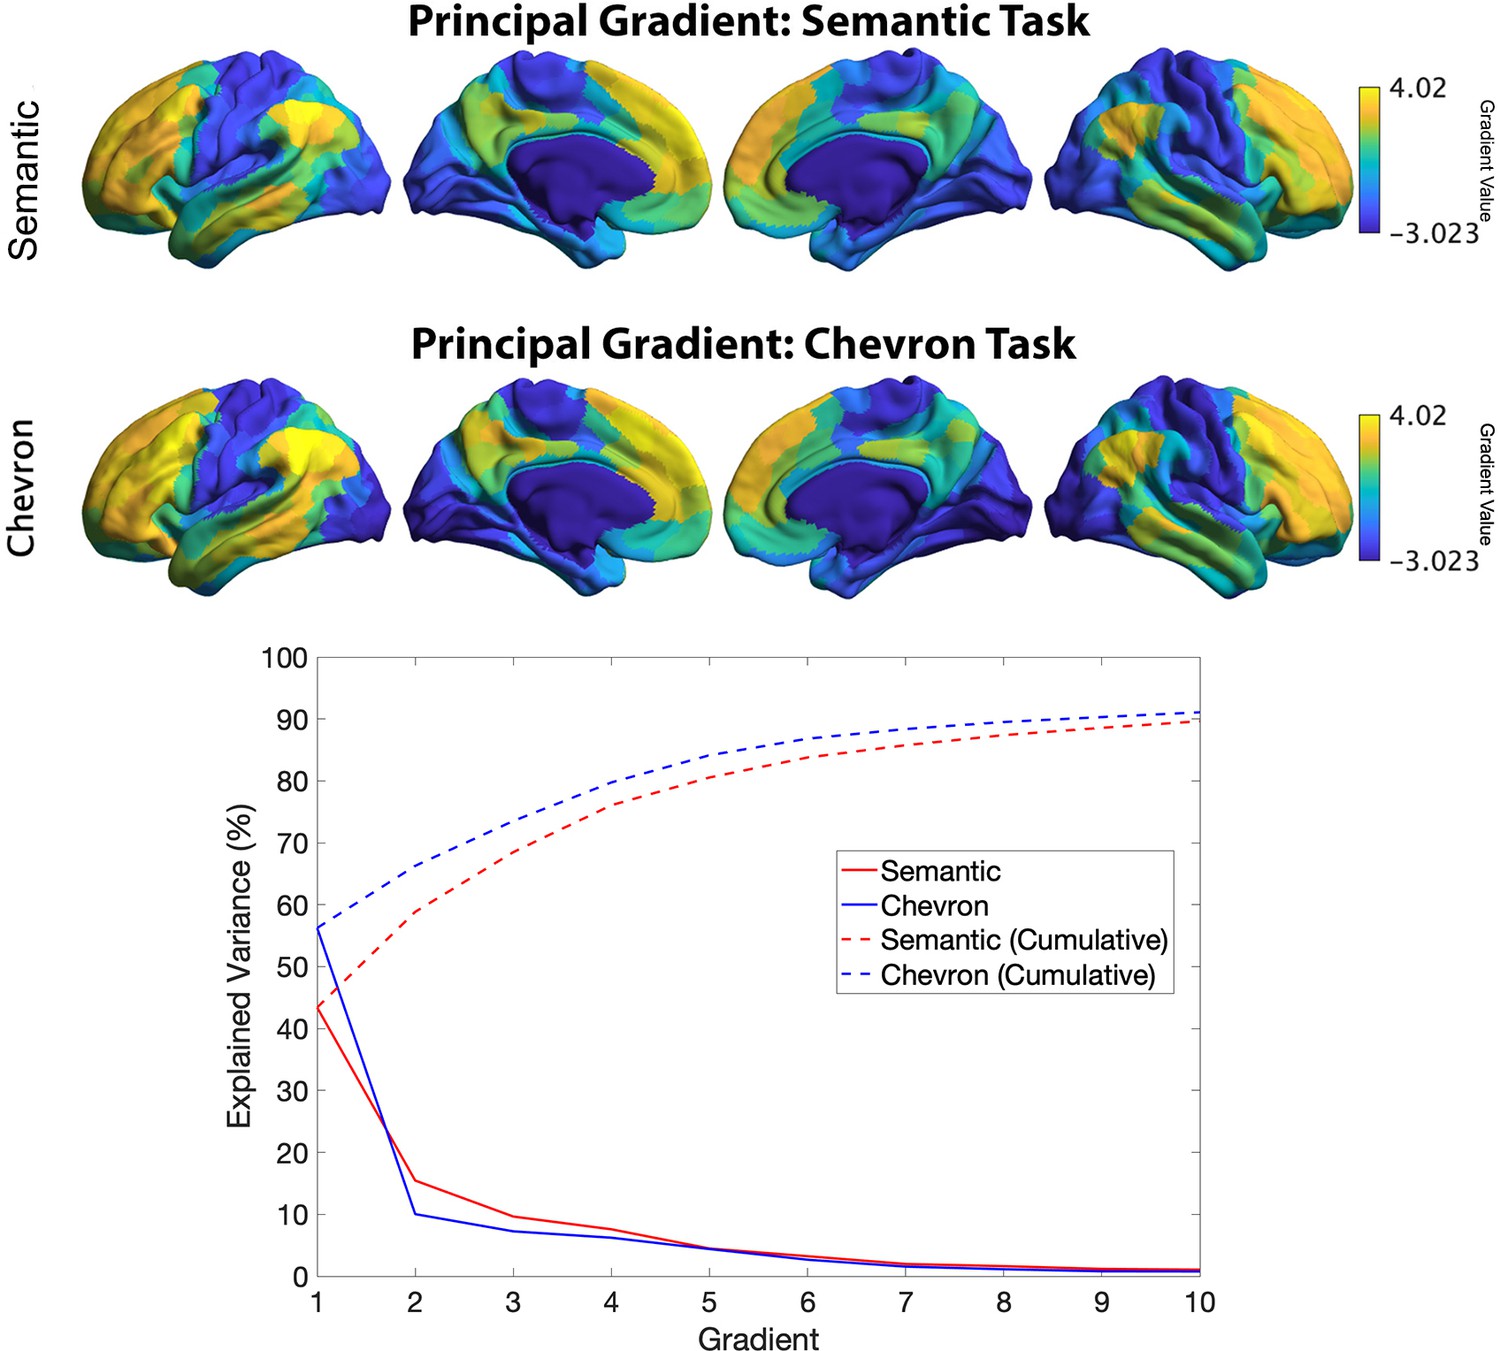
The principal gradient identified by informational connectivity using semantic neural responses and chevron neural responses (upper panel).
Variance explained by top 10 gradients in each task: dashed line refers to cumulative explained variance; solid line refers to variance explained by each gradient.
Figure 2—figure supplement 2
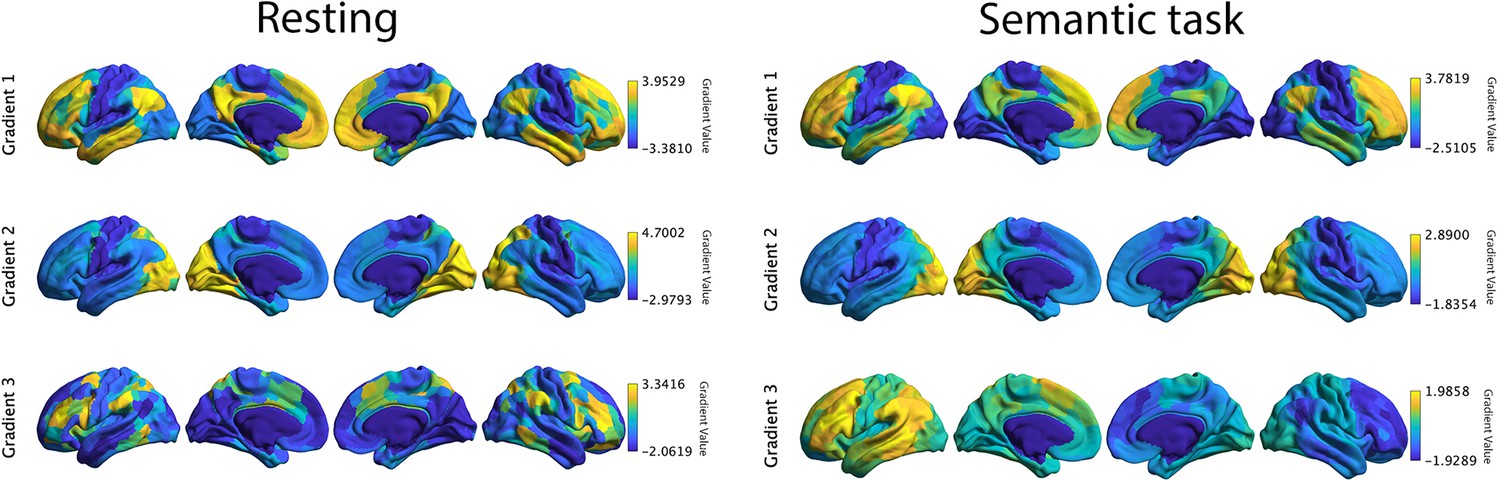
Top 3 gradients which explained most variance derived from resting connectivity data reported by Margulies et al., 2016 (left panel) and from informational connectivity data from a semantic task (right panel).
There were significant correlations for corresponding gradients across these methods. Gradients 1 and 2 showed strong positive correlations, suggesting these dimensions of connectivity are present both during rest and semantic judgements: gradient 1: r = 0.871, pspin < 0.001; gradient 2: r = 0.425, pspin < 0.001. In contrast, gradient 3 showed a negative correlation: r = −0.05, pspin < 0.001.
Figure 2—figure supplement 3
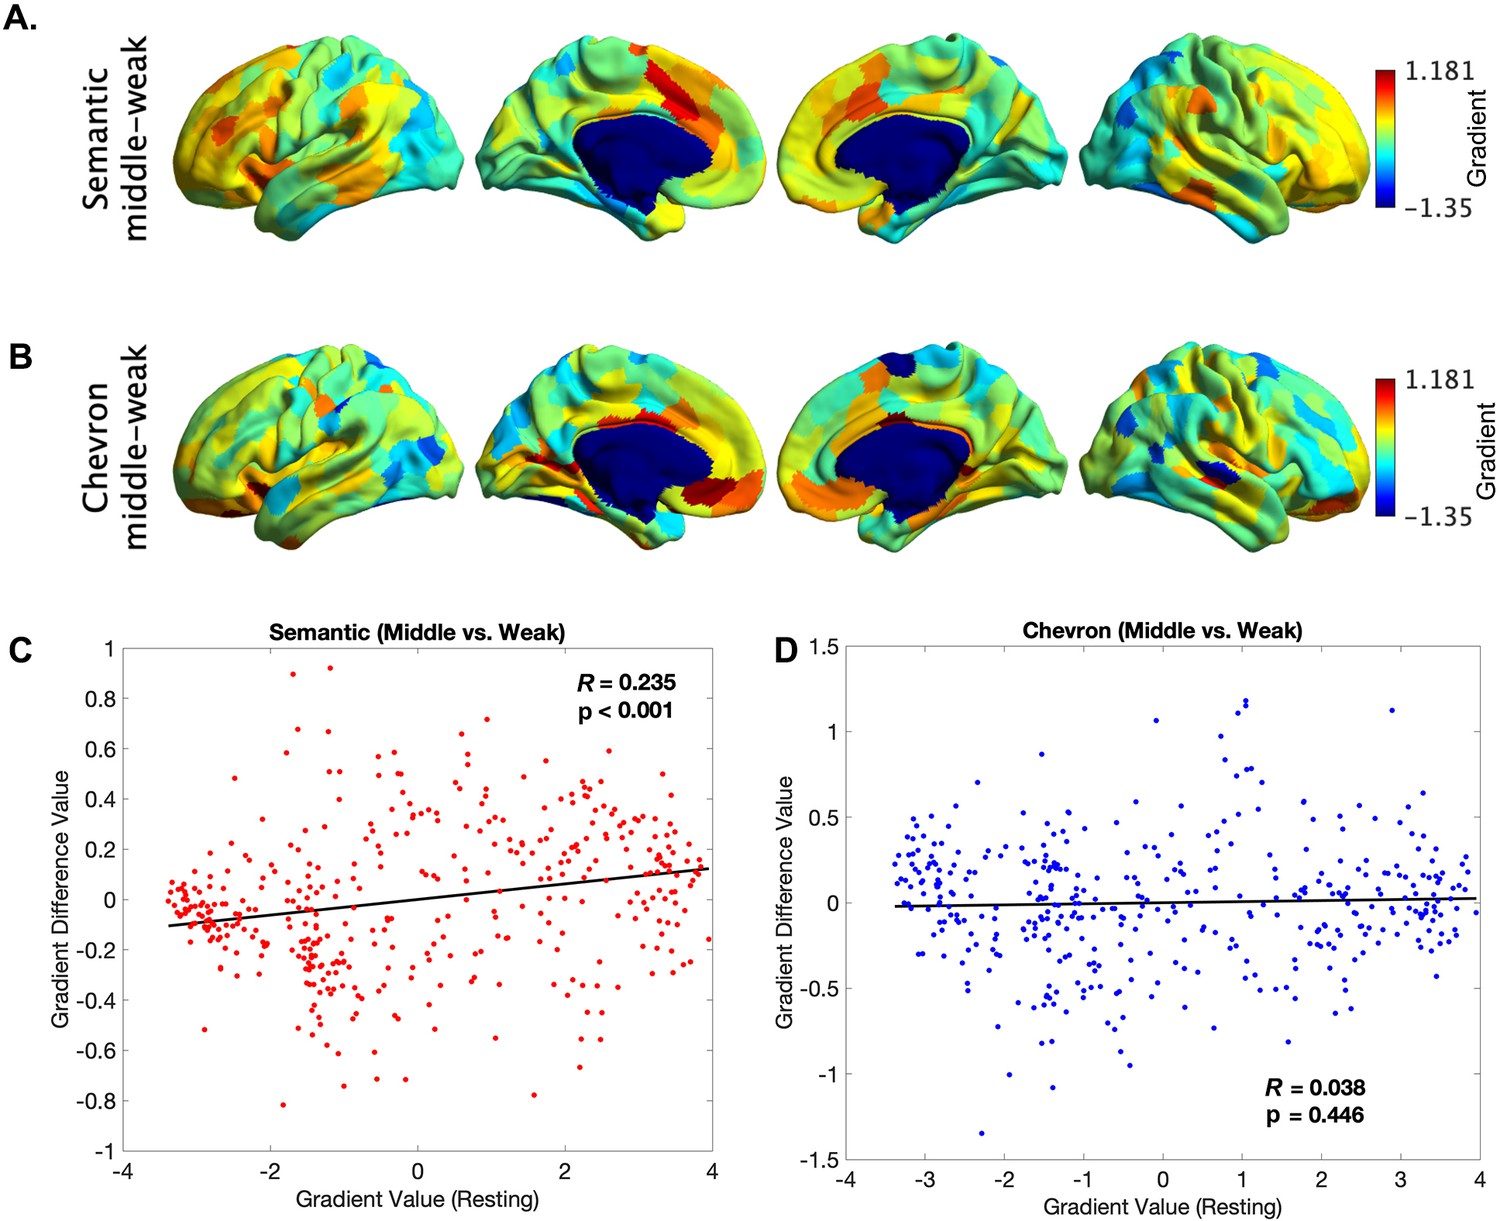
The principal gradient difference between middle 1/3 and bottom 1/3 trials for the semantic neural responses (A) and for chevron task signals (B).
The principle gradient difference derived from (A) was positively associated with principle gradient value derived from resting-state data (C, r = 0.235, p < 0.001), but no such relationship was found for chevron task (D).
Figure 2—figure supplement 4
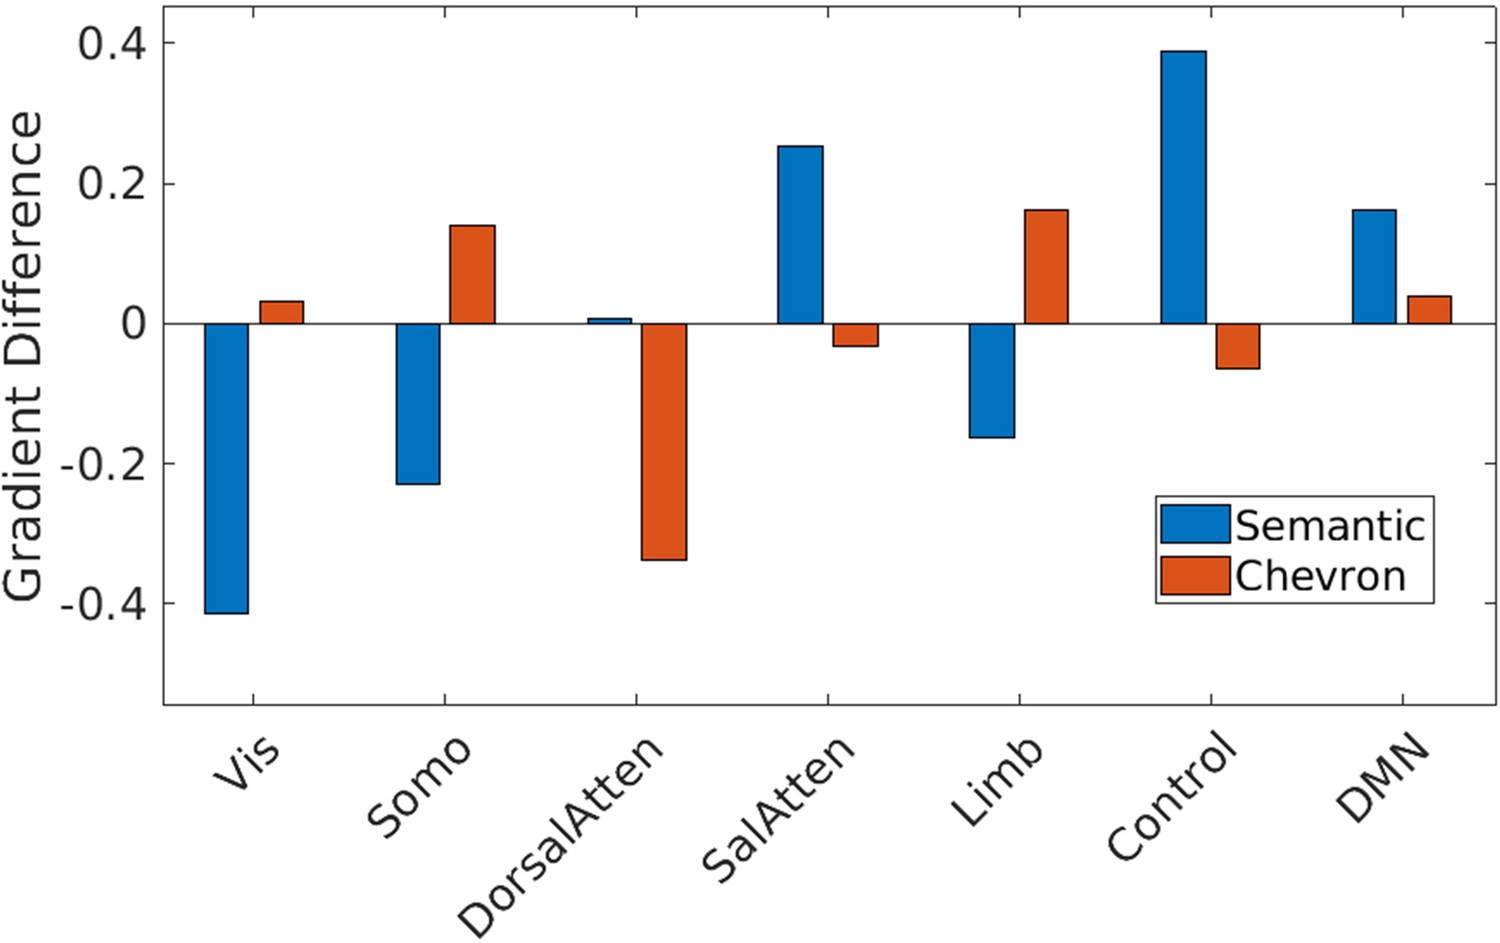
Gradient 1 differences between strong and weak associations in Yeo et al., 2011 7 networks for semantic and chevron task separately.
Vis: visual; Somo: sensorimotor; DorsalAtten: dorsal attention; SalAtten: salience/ventral attention; Limb: limbic; control: frontoparietal; DMN: default mode network.
Figure 2—figure supplement 5
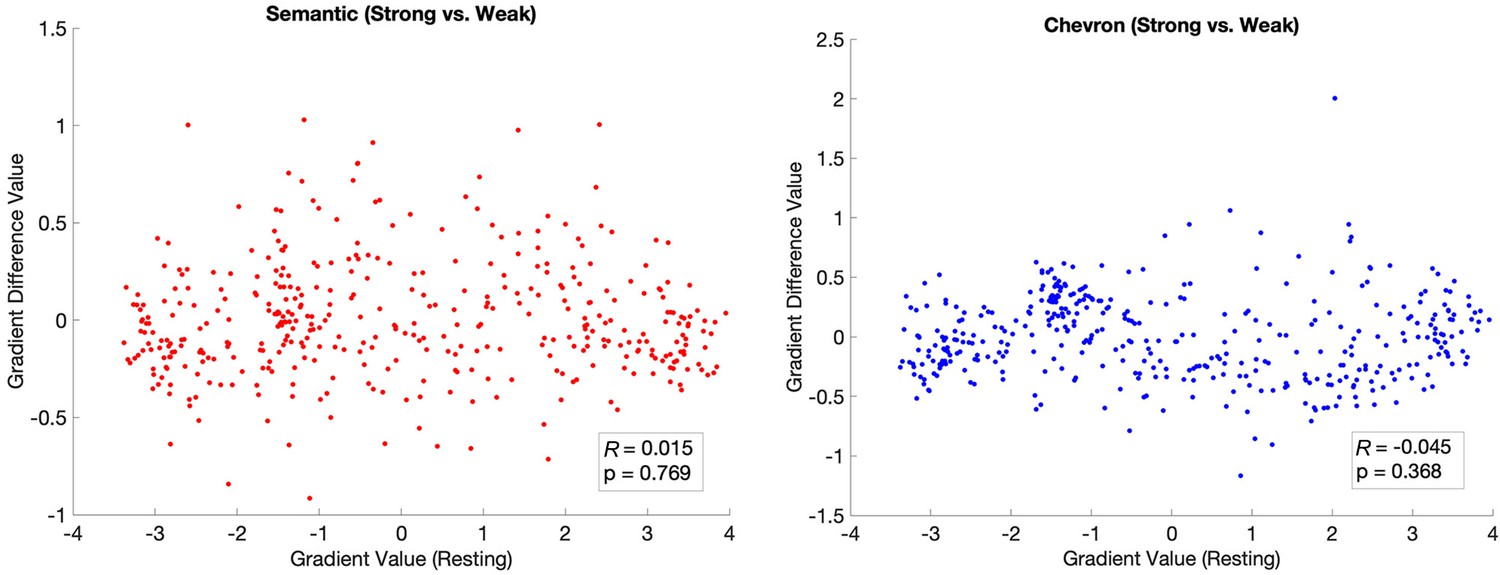
The principal gradient estimated by using traditional functional connectivity (Pearson correlation of averaged time series between any pair of ROIs) was insensitive to the association strength in the semantic task.
This principal gradient difference between strong and weak conditions did not show a significant correlation with the principal gradient identified by resting state for both the semantic task (left) and the chevron task (right).
Figure 3 with 3 supplements
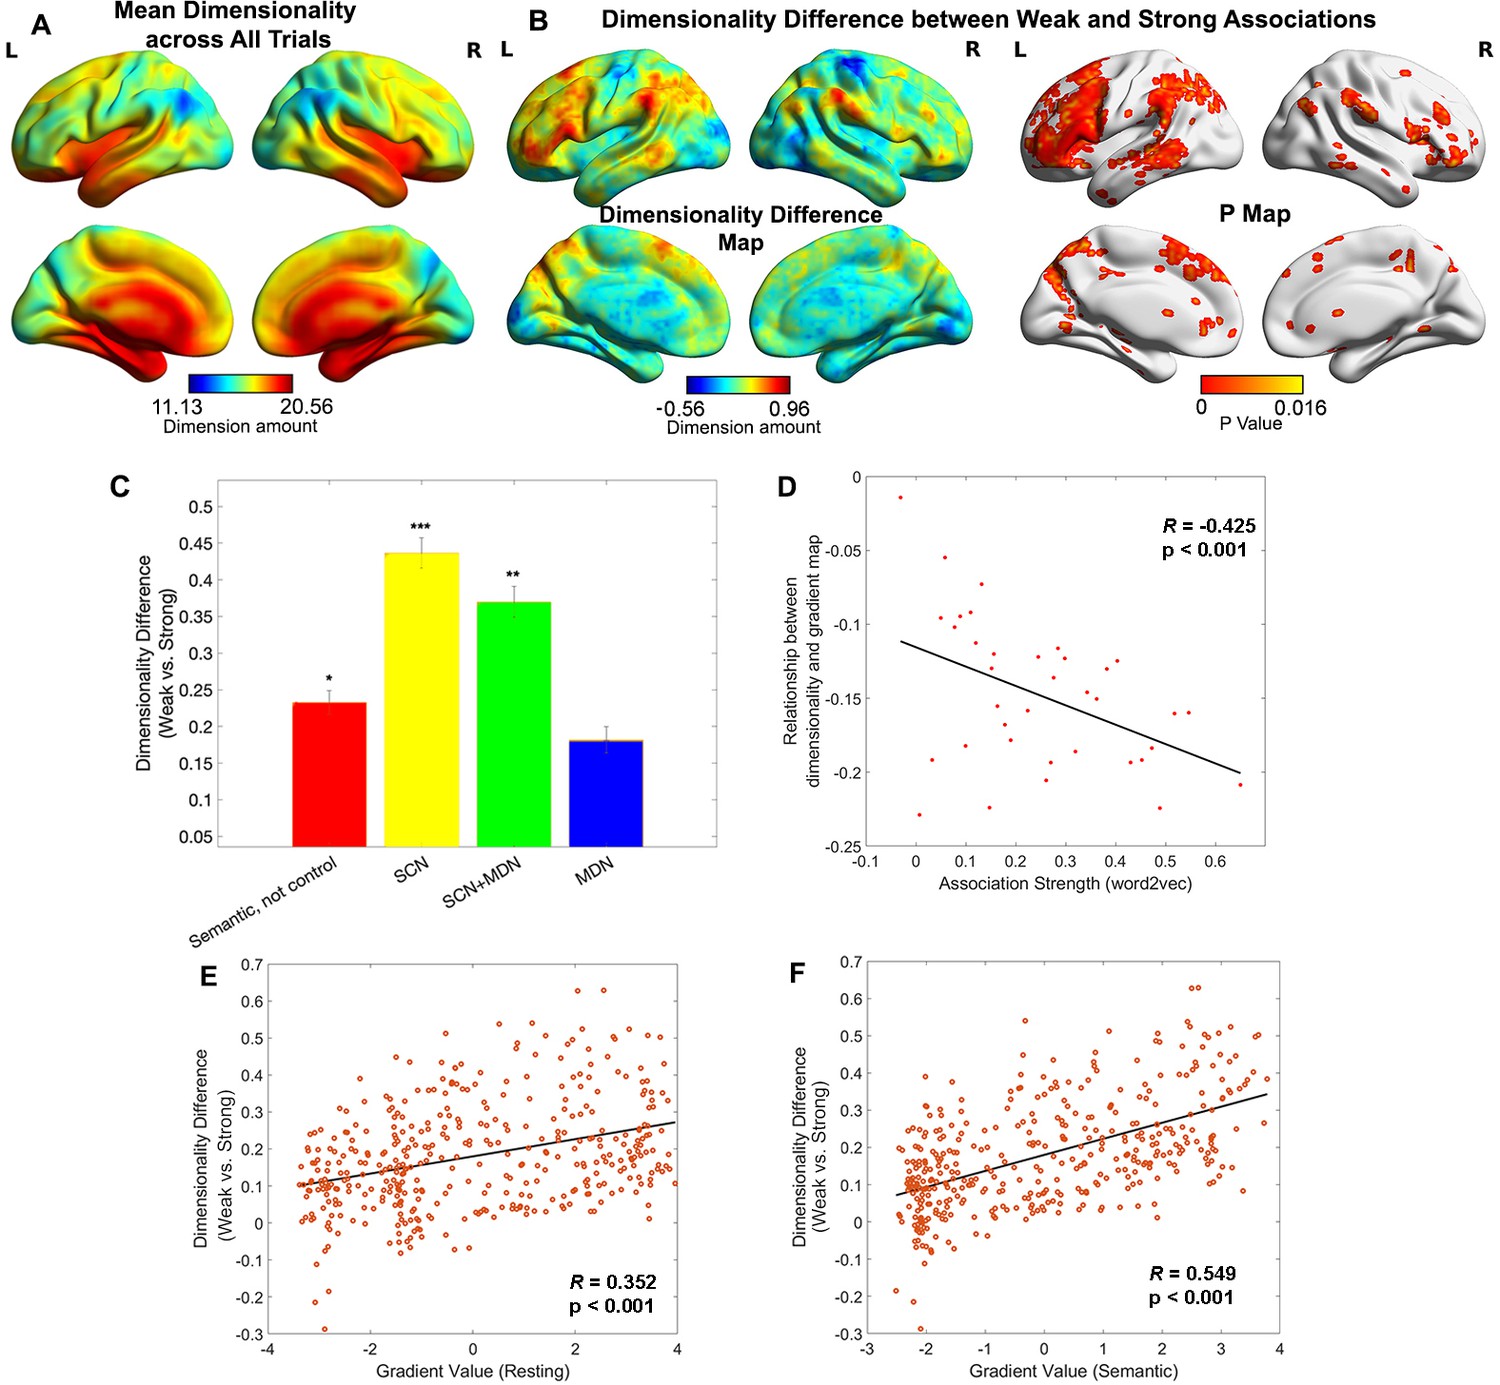
Representational space changed along the principal gradient.
(A) Dimensionality map averaged across all trials. (B) Dimensionality difference between weak and strong associations (left panel) and the corresponding p map (right panel), with FDR correction applied, q = 0.05. (C) Dimensionality difference between weak and strong in functional networks implicated in semantic representation and control demands (Semantic, not control: p = 0.017, semantic control network (SCN): p < 0.0001, SCN + multiple-demand network (MDN): p = 0.002, MDN: p = 0.245, Wilcoxon rank sum test was conducted and p values were adjusted using Bonferroni correction). Error bars represent the standard error of dimensionality differences across parcels within each network. (D) The relationship between dimensionality and the principal gradient was generally negative (all data points are below 0) and negatively correlated with the associative strength between word-pairs. We averaged the dimensionality map for every four trials arranged in order from weak to strong according to their word2vec values for this analysis. (E, F) The dimensionality difference between weak and strong trials was positively correlated with the location of each parcel on the principal gradient estimated from resting-state fMRI (in E) and informational connectivity during the semantic task (in F). Each data point represents a parcel from the Schaffer 400 parcellation. Note: the dimensionality difference was examined by subtracting strong from weak associations; this contrast is in the opposite to the gradient difference analysis, since we anticipate higher gradient values and fewer neural dimensions for strong associations in similar brain regions. *p < 0.05, **p < 0.01, ***p < 0.001. All data reflect n = 31 independent participants.
Figure 3—figure supplement 1
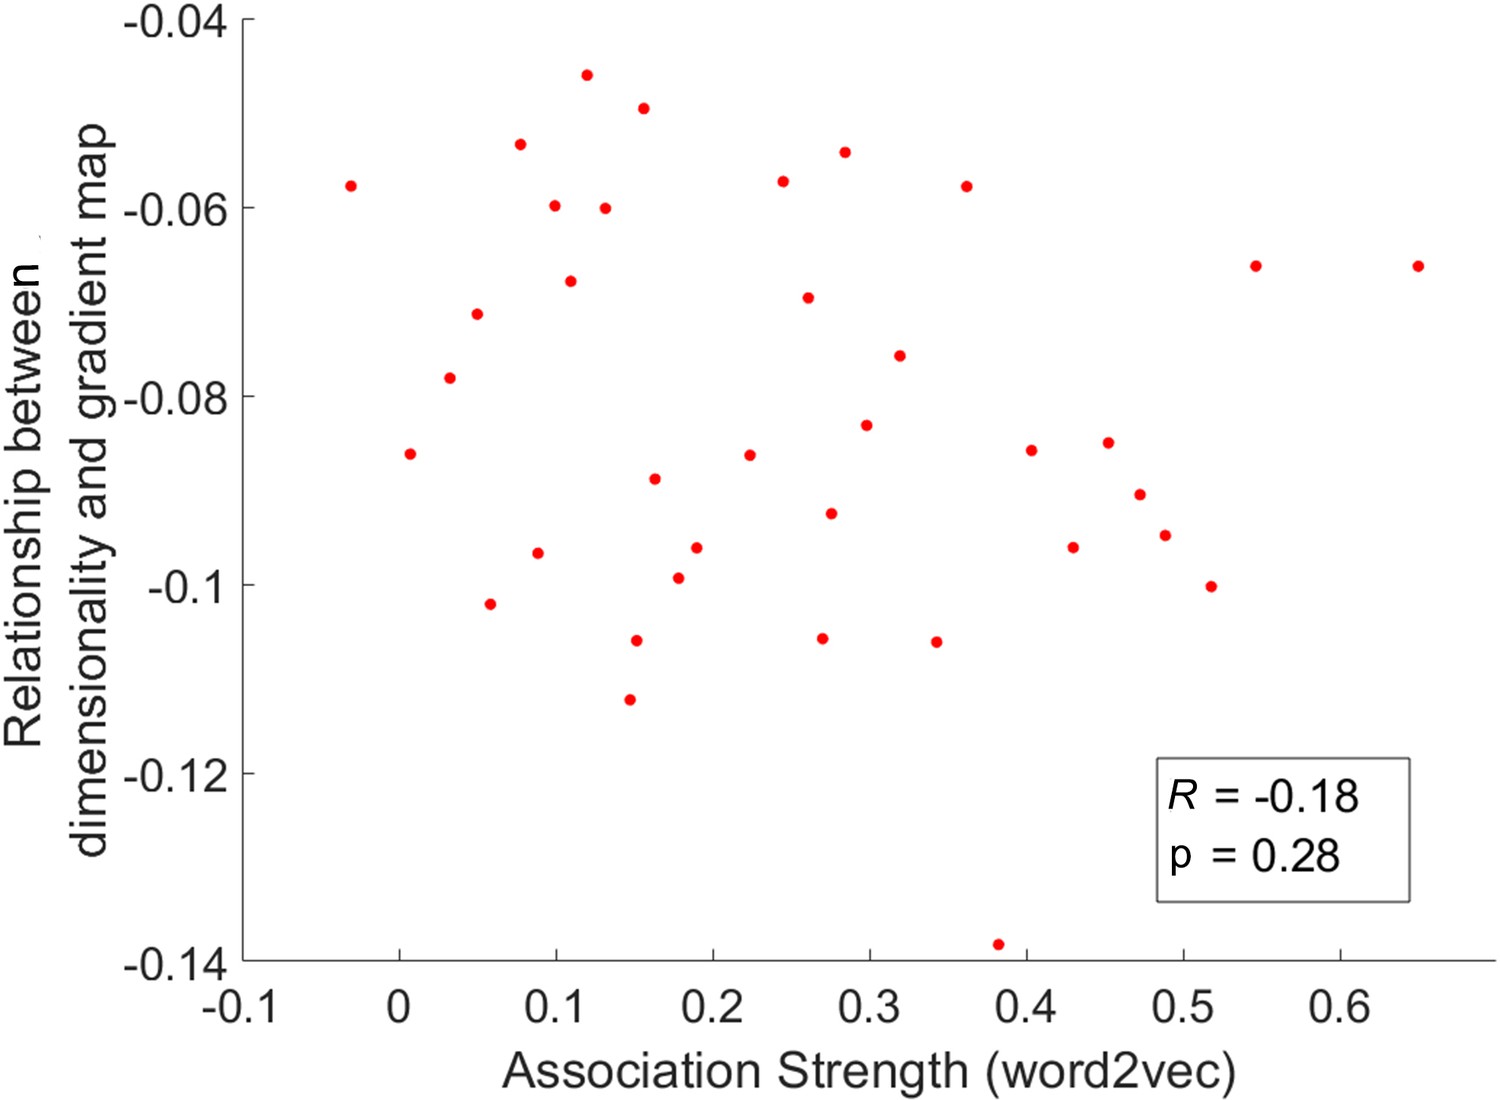
We averaged the dimensionality map in the chevron task for every four trials arranged in order of the word2vec values for the preceding semantic task from weak to strong for this analysis.
The relationship between dimensionality and the principal gradient was insensitive to the associative strength of the preceding semantic trial (p = 0.28).
Figure 3—figure supplement 2
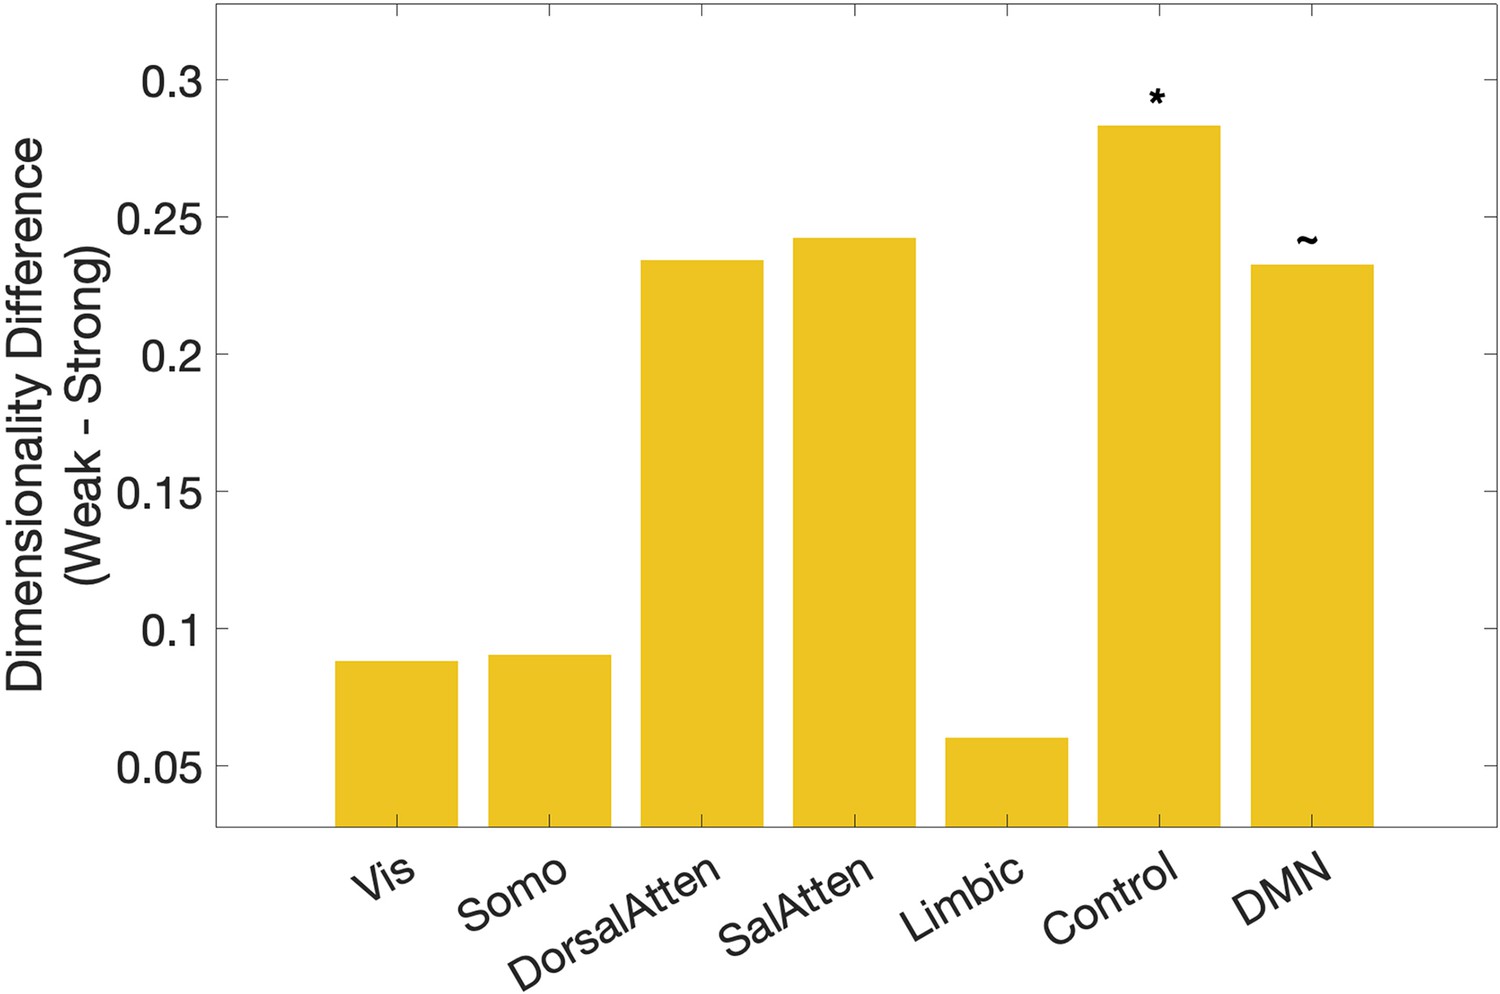
Dimensionality differences between weak and strong association trials in classical resting networks (right) (Yeo et al., 2011).
*p < 0.05, ~p < 0.1.
Figure 3—figure supplement 3
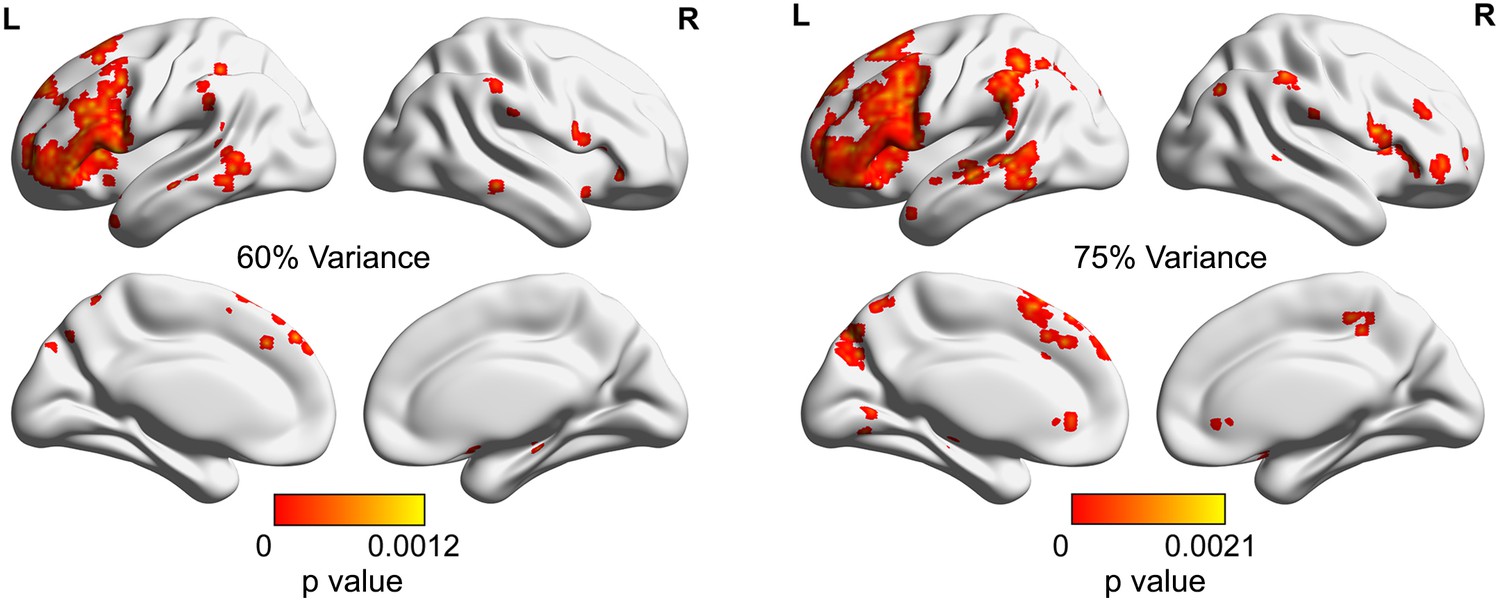
The significance p map of dimensionality differences between weak and strong associations in which the dimensions of the activation pattern were determined using different criteria (explaining 60% [left panel] or 75% [right panel] of the variance), with FDR correction applied, q = 0.05.
Figure 4 with 2 supplements
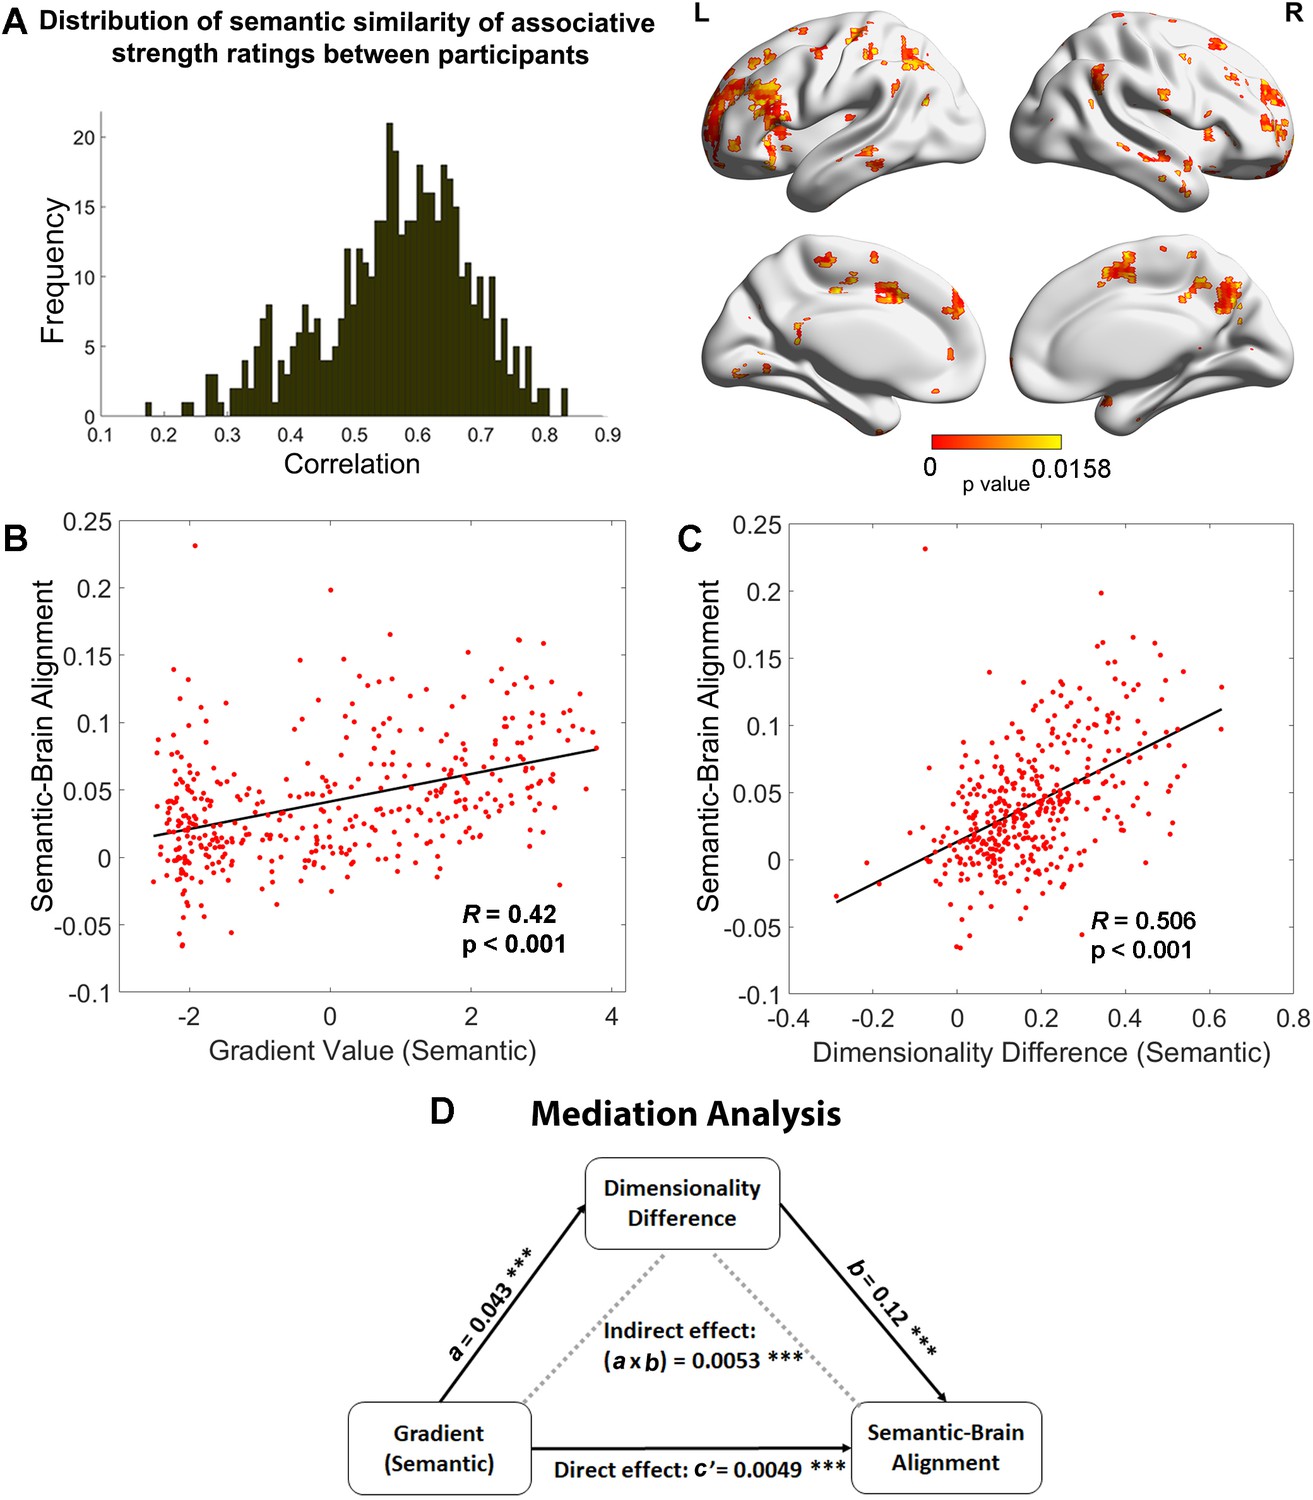
Relationships between the principal gradient, representational dimensionality, and semantic cognition.
(A) Left: The distribution of similarity in associative strength ratings between participants. We measured the semantic similarity by correlating the rating patterns of associative strength between any pair of participants (x-axis: correlation) and plotted the distribution of semantic similarity (y-axis: frequency). Right: More similar neural patterns between participants and trials were positively associated with similarity in semantic ratings; FDR correction was applied, q = 0.05. (B) The semantic task principal gradient was positively associated with semantic-brain alignment shown in the right side of (A); each point represents one parcel. (C) The difference in the dimensionality of the neural response between weak and strong associations (weak–strong) was also positively associated with the semantic-brain alignment estimated from Figure 4; each point represents one parcel. (D) Mediation analysis. The semantic task principal gradient was the independent variable, the dimensionality difference between weak and strong associations was the moderator and semantic-brain alignment was the dependent variable. This analysis revealed that the relationship between the semantic task principal gradient and semantic-brain alignment could be partially explained by the difference in dimensionality of the neural representational space between strong and weak trials (explained 51.7% variance), ps < 0.001. ***p < 0.001. All data reflect n = 31 independent participants.
Figure 4—figure supplement 1
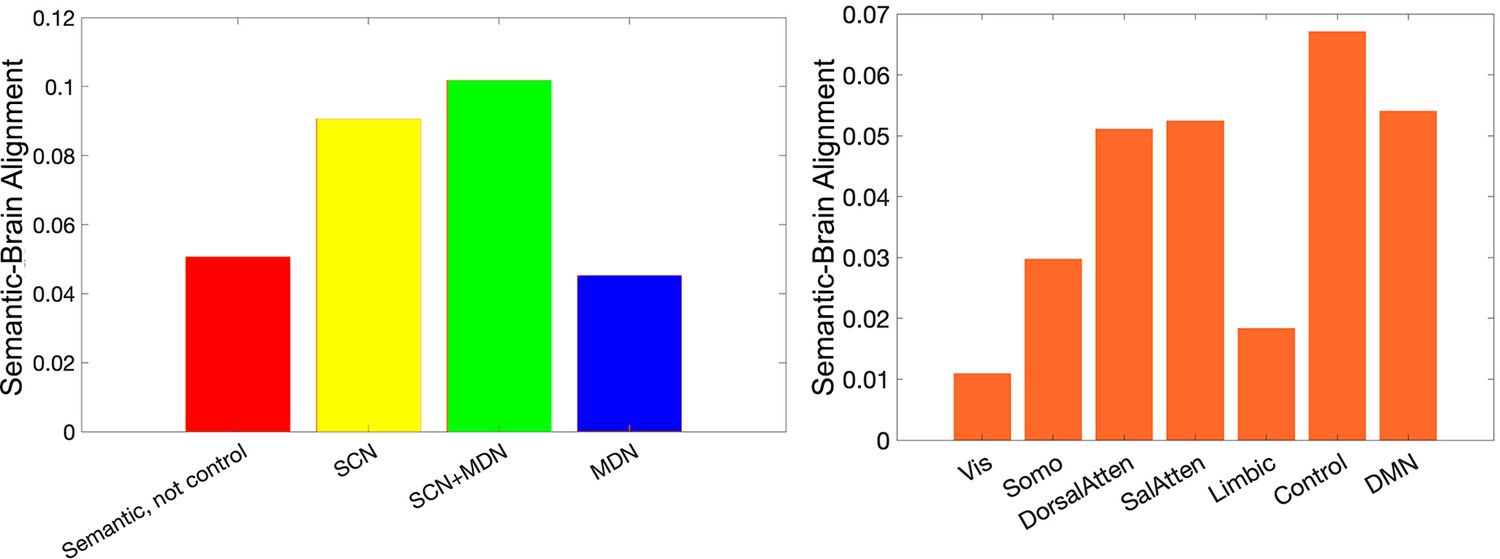
The semantic-brain alignment estimated using second-order RSA in functional networks implicated in semantic representation and control demands (left) or in resting networks (right) (Yeo et al., 2011).
The strongest semantic-brain alignment effects were found in control-relevant areas in both analyses.
Figure 4—figure supplement 2
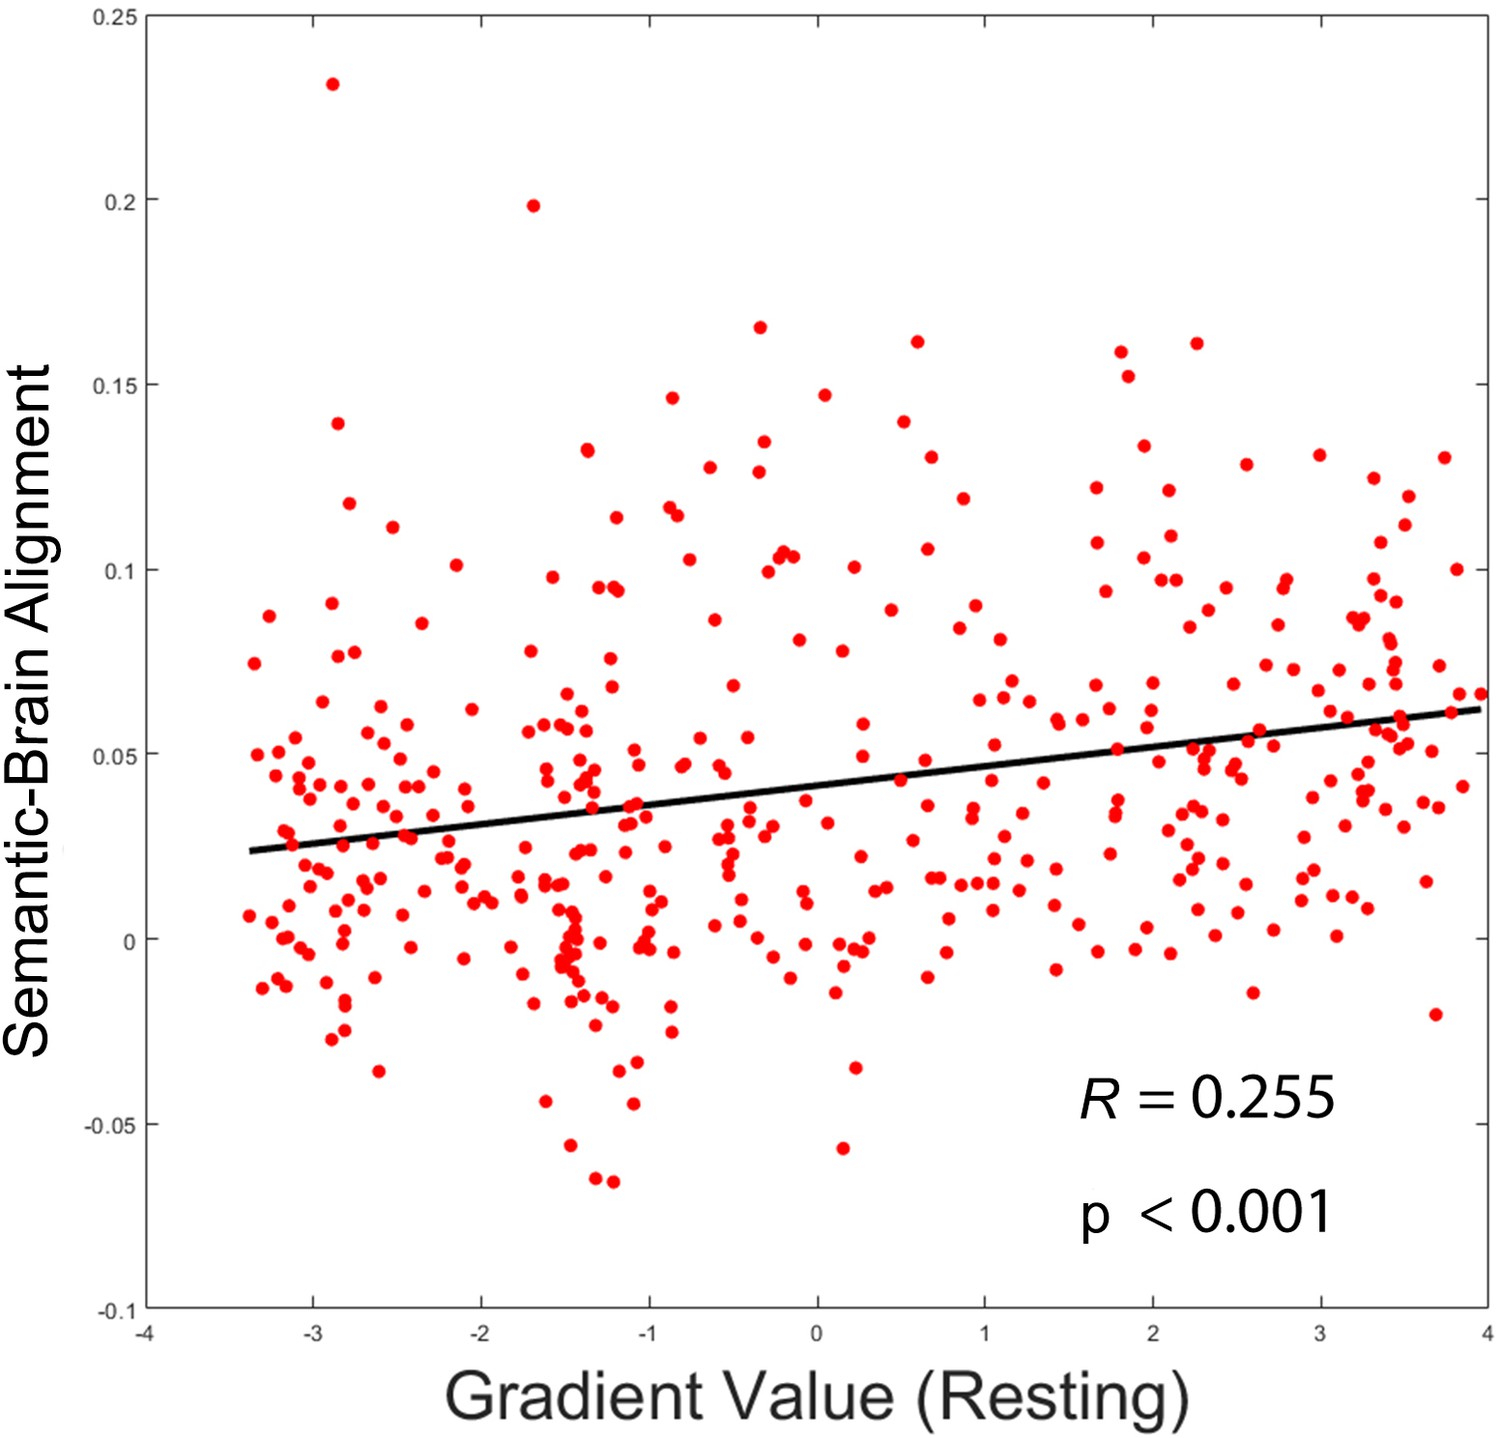
The principal gradient derived from resting data (1) was positively associated with semantic-brain alignment (r = 0.255, p < 0.001).
Additional files
-
Transparent reporting form
- https://cdn.elifesciences.org/articles/80368/elife-80368-transrepform1-v2.docx
-
Supplementary file 1
Spin correlation between gradients estimated by traditional connectivity using resting state data and informational connectivity using semantic and chevron neural responses in each hemisphere.
- https://cdn.elifesciences.org/articles/80368/elife-80368-supp1-v2.docx
Download links
A two-part list of links to download the article, or parts of the article, in various formats.
Downloads (link to download the article as PDF)
Open citations (links to open the citations from this article in various online reference manager services)
Cite this article (links to download the citations from this article in formats compatible with various reference manager tools)
Flexing the principal gradient of the cerebral cortex to suit changing semantic task demands
eLife 11:e80368.
https://doi.org/10.7554/eLife.80368


