CCR4 and CCR7 differentially regulate thymocyte localization with distinct outcomes for central tolerance
- Department of Molecular Biosciences, The University of Texas at Austin, United States
- Department of Pathology, Duke University, United States
- Department of Oncology, LIVESTRONG Cancer Institutes, The University of Texas at Austin Dell Medical School, United States
Figures
Figure 1 with 2 supplements
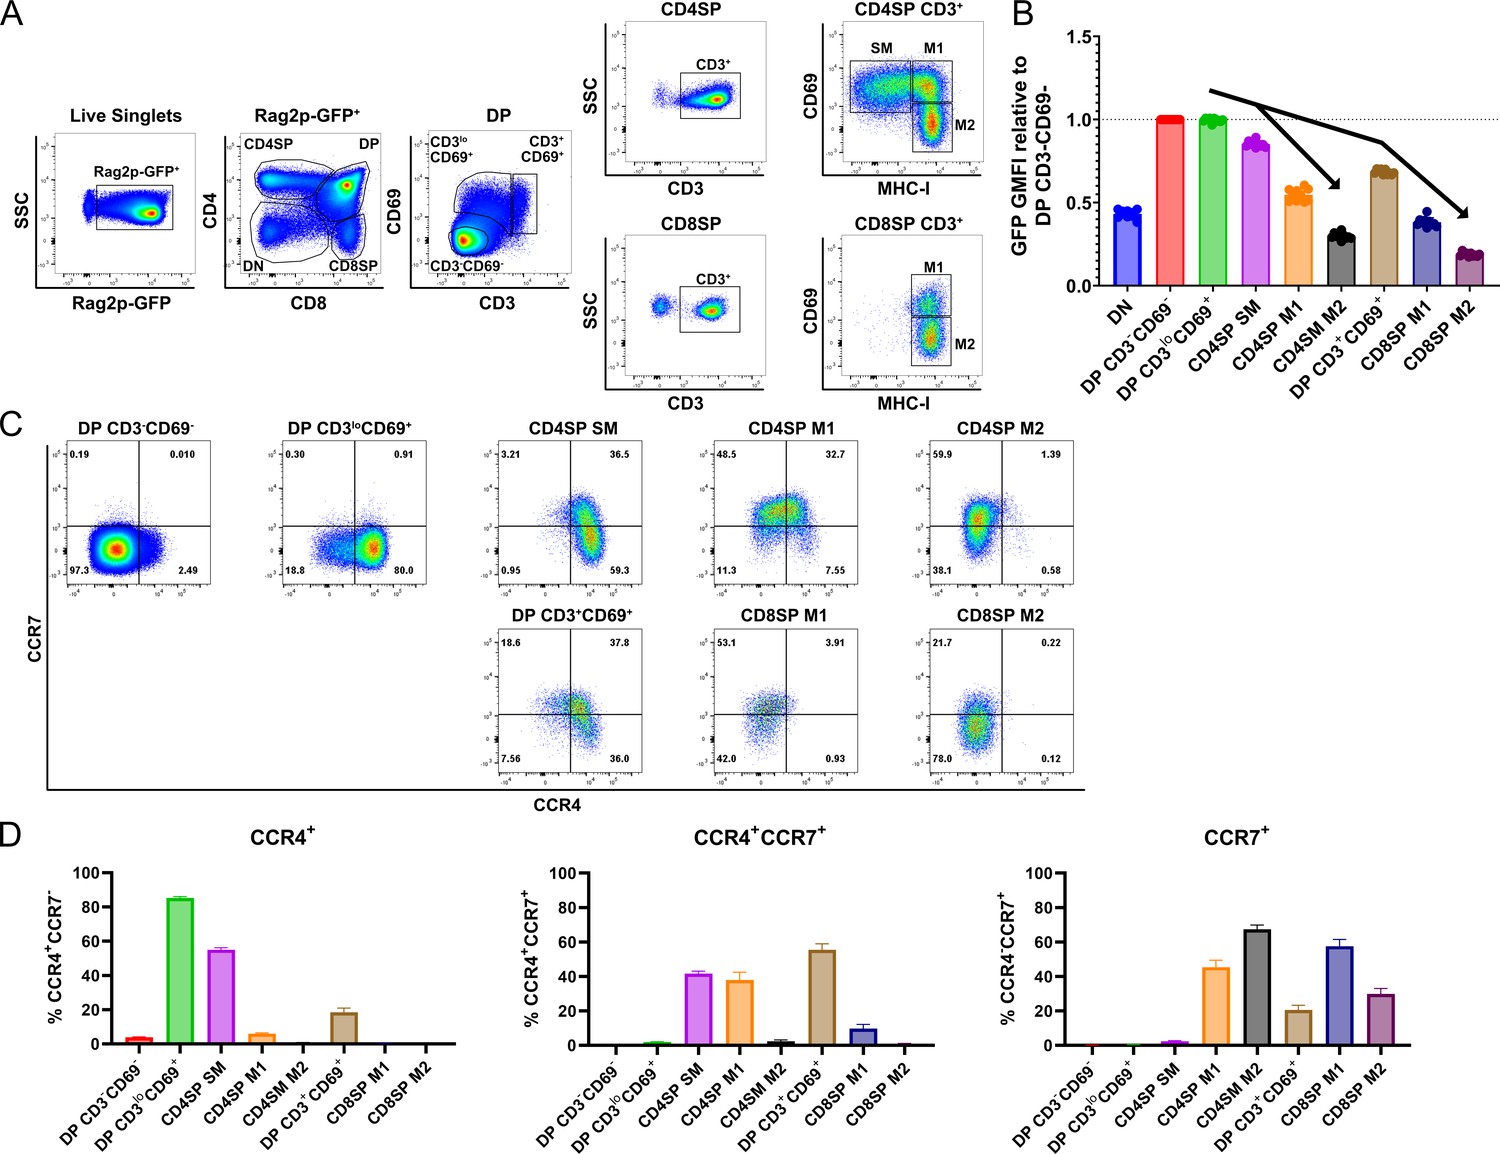
CCR4 and CCR7 are expressed by immature and mature subsets of post-positive selection thymocytes, respectively.
(A) Flow cytometry gating scheme to delineate thymocyte subsets in Rag2p-GFP mice. Post-positive selection DP (CD3loCD69+ and CD3+CD69+), CD4SP (SM, M1, and M2), and CD8SP (M1 and M2) subsets are annotated. (B) Relative Rag2p-GFP Geometric Mean Fluorescent Intensity (GMFI) of each subset normalized to pre-positive selection DP CD3−CD69− cells. Individual data points represent average GFP GMFI of the indicated subset from each mouse. (C) Representative flow cytometry plots showing CCR4 and CCR7 expression by post-positive selection thymocyte subsets. (D) Quantification of the percentage of cells of the indicated subset that express CCR4, CCR7, or both chemokine receptors. For (B) and (D), data were compiled from four independent experiments (mean ± standard error of the mean [SEM]; N = 10 mice).
Figure 1—figure supplement 1
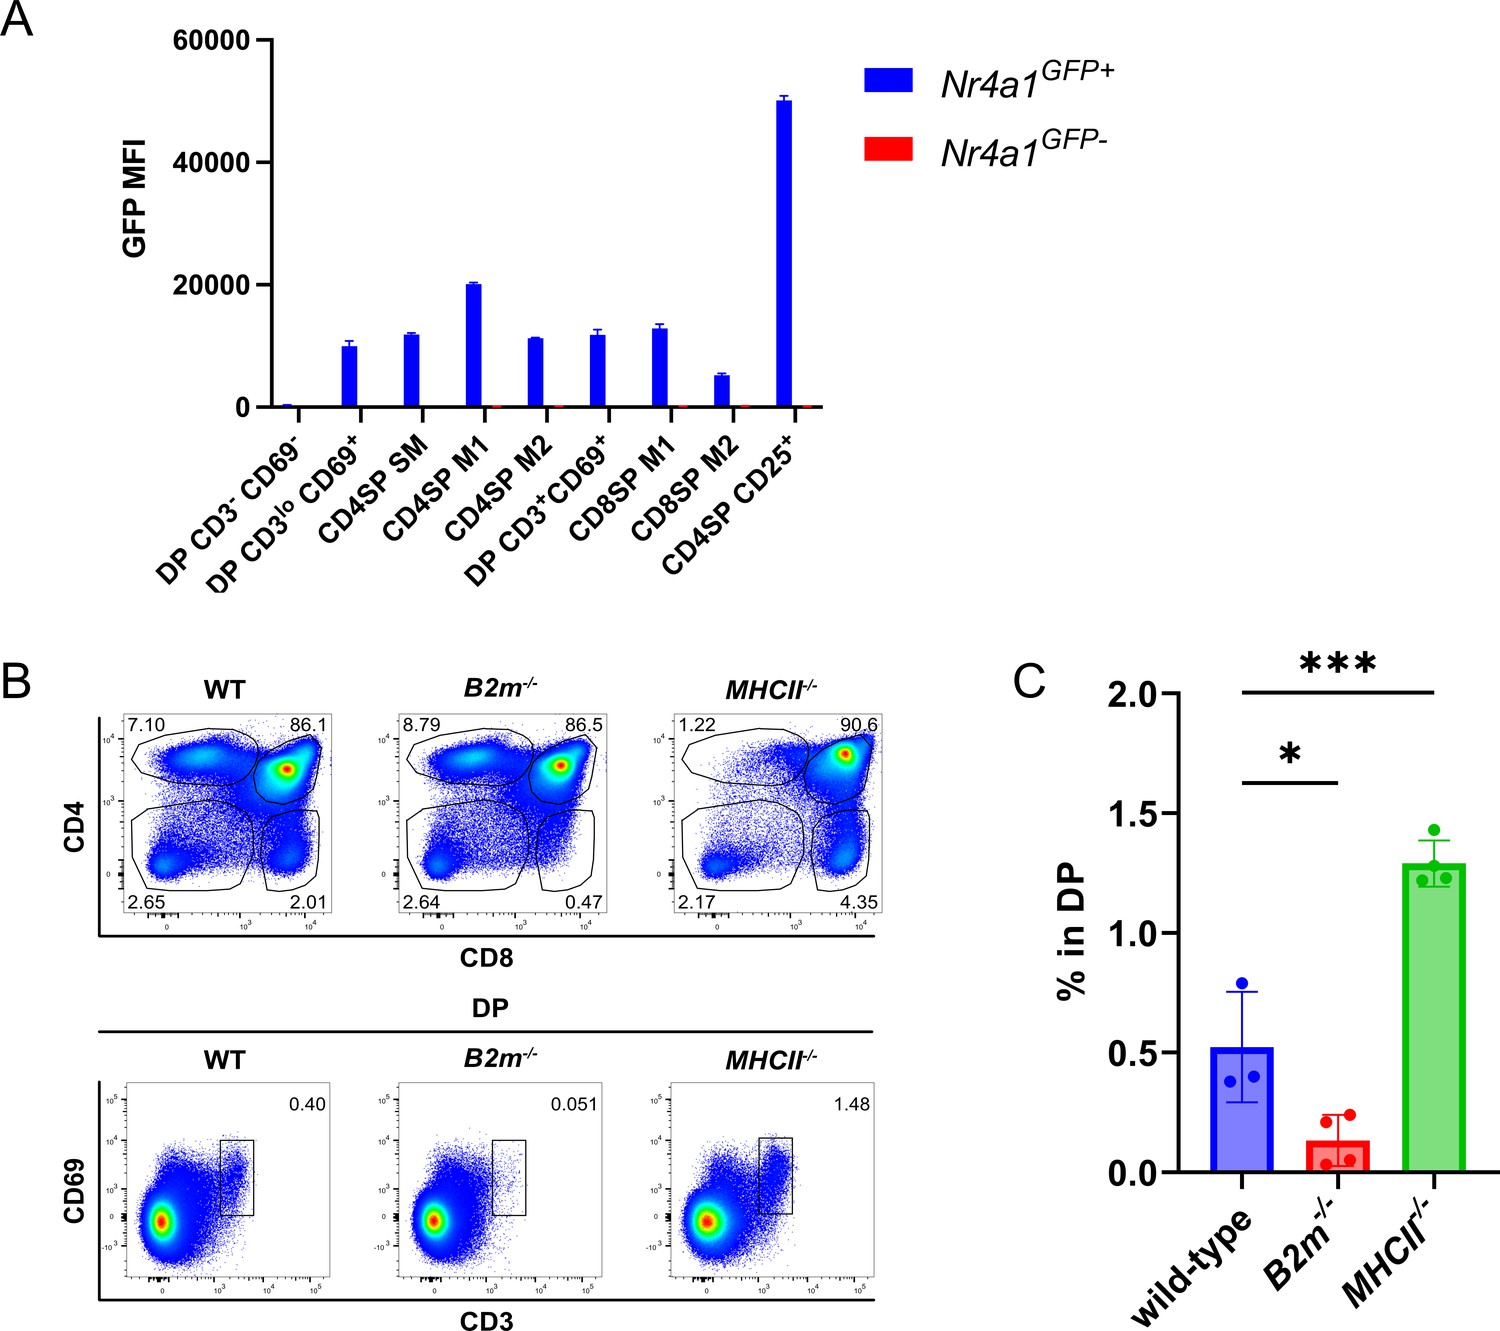
DP CD3loCD69+ cells are consistent with post-positive selection DPs and DP CD3+CD69+ cells represent co-receptor reversing MHCI-restricted thymocytes.
(A) Quantification of the GFP mean fluorescence intensity (MFI) of the indicated thymocyte subsets from Nr4a1GFP mice. Data were compiled from three independent experiments (mean ± SEM; Nr4a1GFP+ N = 4 mice, Nr4a1GFP− N = 3 mice). (B) Flow cytometry plots showing the absence of DP CD3+CD69+ thymocytes in B2m−/−, but not MHCII−/− mice. (C) Quantification of the frequency of DP CD3+CD69+ in all DP thymocytes from wild-type, B2m−/−, and MHCII−/− mice. One-way analysis of variance (ANOVA) with Dunnett’s multiple comparisons correction was used for statistical analysis (mean ± SEM; *p < 0.05, ***p < 0.001).
Figure 1—figure supplement 2
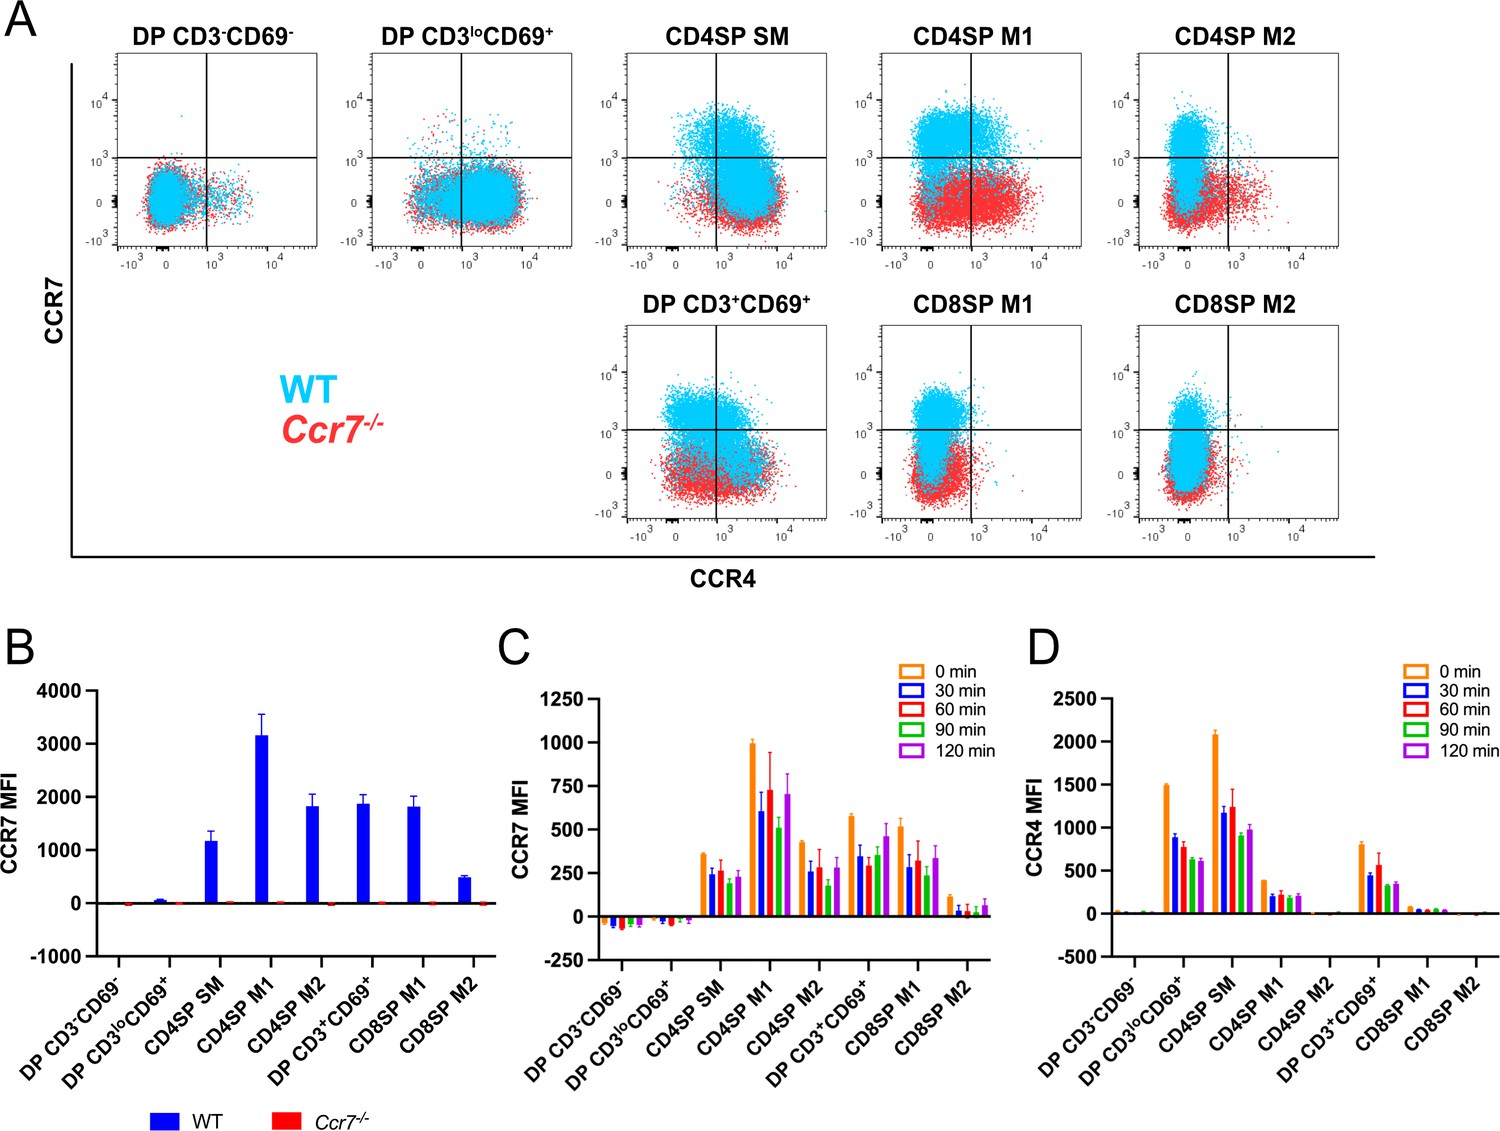
CCR7 expression on developing thymocytes begin at the CD4SP SM stage.
(A) Representative flow cytometry overlays showing CCR4 and CCR7 expression by post-positive selection thymocyte subsets from WT and Ccr7−/− mice, respectively. (B) Quantification of the CCR7 MFI within each subset from data in A (mean ± SEM; N = 4 mice of each genotype). (C, D) Quantification of CCR7 and CCR4 MFIs for each thymocyte subset after incubation at 37°C for the indicated times, prior to antibody staining at 4°C. Data were compiled from two independent experiments (mean ± SEM; N = 4 mice).
Figure 2 with 2 supplements
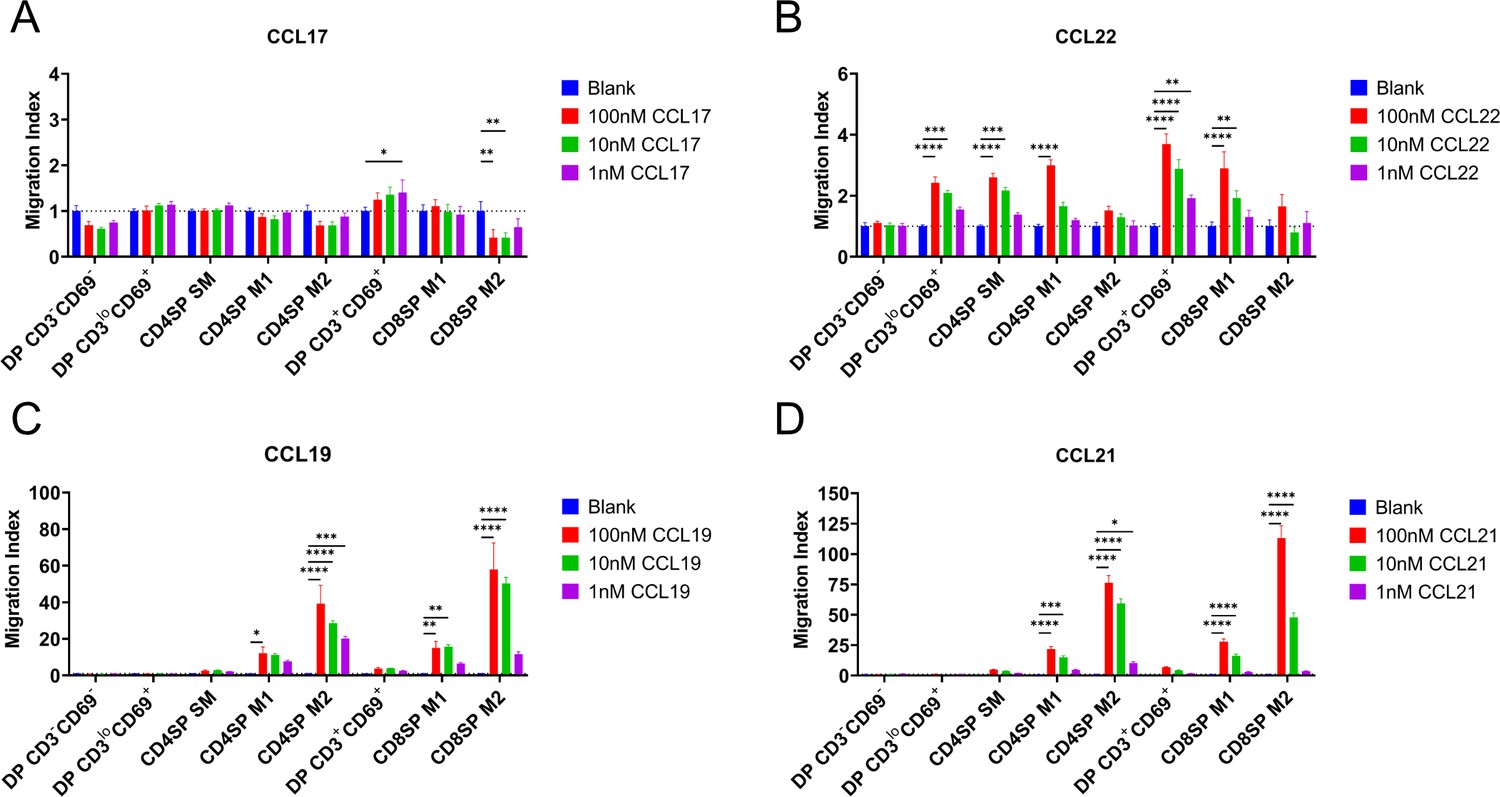
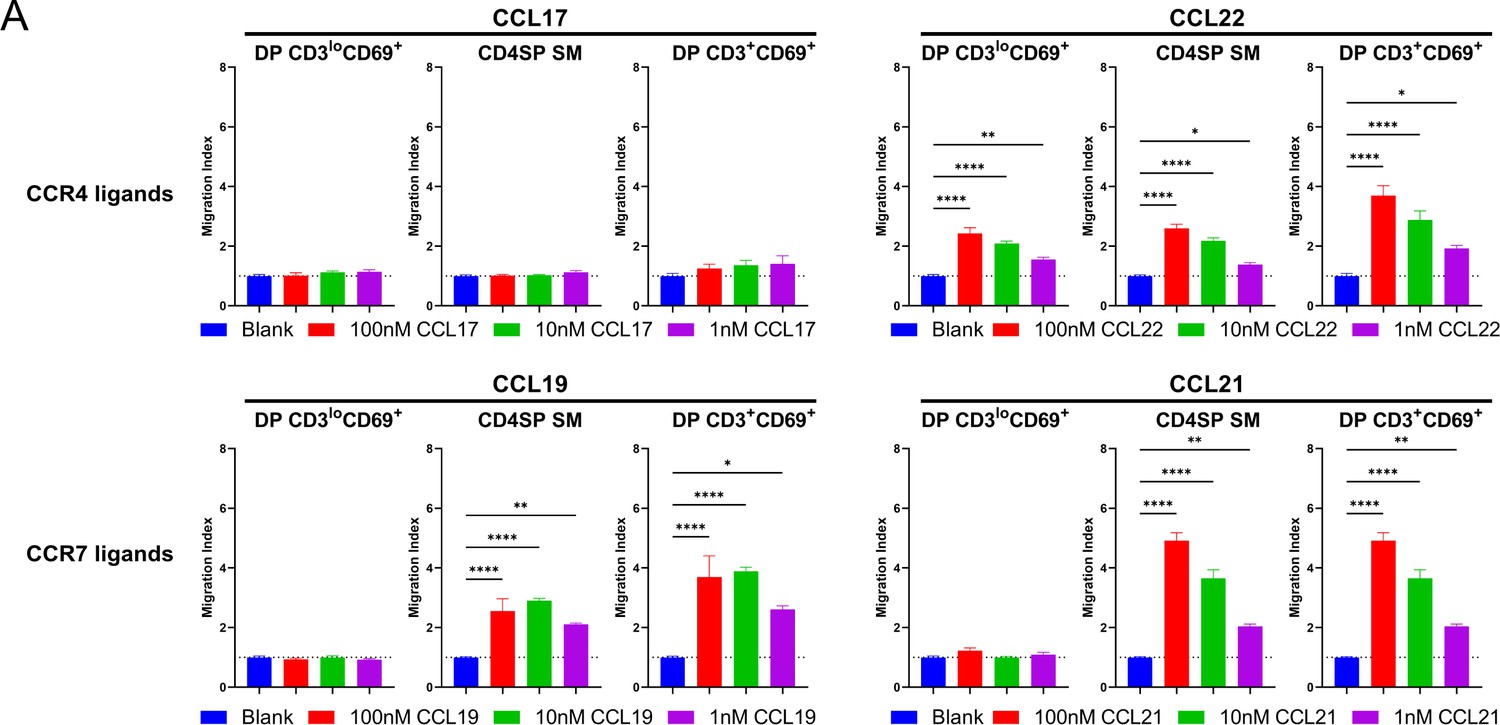
CCR4 and CCR7 promote chemotaxis of immature and mature post-positive selection thymocyte subsets, respectively.
Transwell assays were used to quantify chemotaxis of thymocyte subsets to the indicated concentrations of the CCR4 ligands CCL17 (A) and CCL22 (B) and the CCR7 ligands CCL19 (C) and CCL21 (D). Migration index was calculated as the frequency of input cells of each subset that migrated toward the chemokine relative to the frequency of input cells that migrated in the absence of chemokine (Blank). Data were compiled from three independent experiments with triplicate wells per assay. Two-way ANOVA with Dunnett’s multiple comparisons correction was used for statistical analysis (mean ± SEM; *p < 0.05, **p < 0.01, ***p < 0.001, ****p < 0.0001).
Figure 2—figure supplement 1
Chemokine signaling is not diminished in CD4SP SM thymocytes.
(A) Migration indices from data in Figure 2 for DP CD3loCD69+, CD4SP SM, and DP CD3loCD69+ were analyzed separately to compare the relative efficiency of CCR4 and CCR7 ligands at inducing chemotaxis of each subset. Ordinary one-way ANOVA with Dunnett’s multiple comparisons corrections was used for statistical analysis (mean ± SEM; *p < 0.05, **p < 0.01, ****p < 0.0001).
Figure 2—figure supplement 2
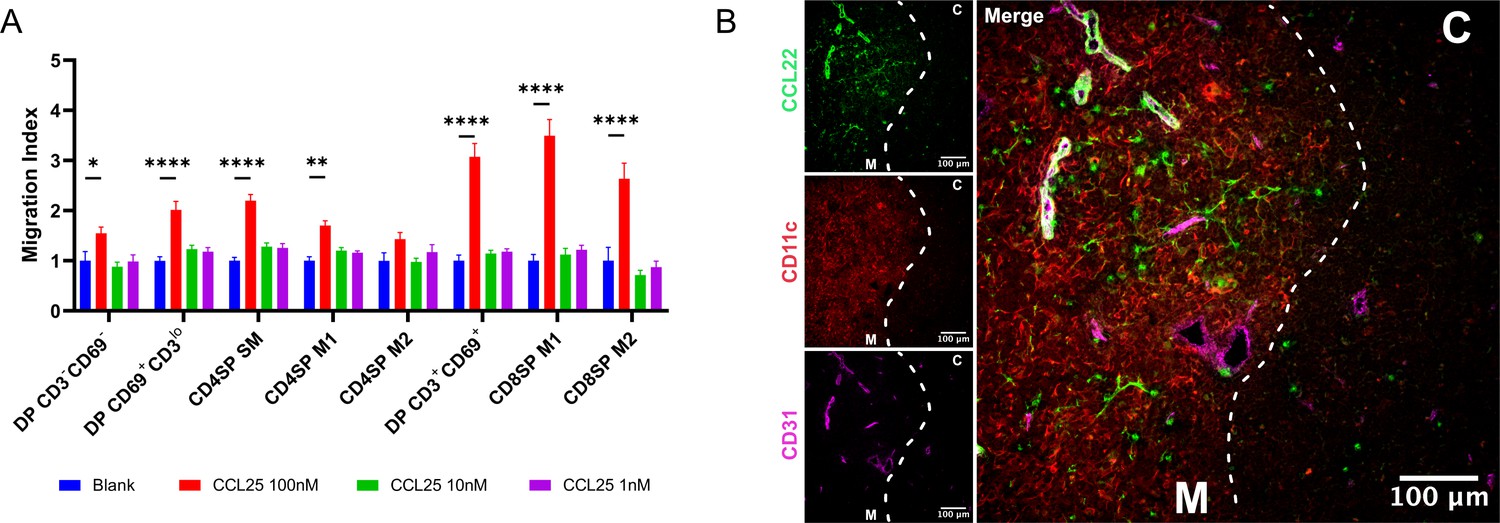
CD4SP SM thymocytes migrate toward CCL25 and CCL22 is localized in the medulla.
(A) Transwell assays were used to quantify chemotaxis of thymocyte subsets to the indicated concentrations of the CCR9 ligand, CCL25. Migration index was calculated as the frequency of input cells of each subset that migrated toward the chemokine relative to the frequency of input cells that migrated in the absence of chemokine (Blank). Data were compiled from three independent experiments with triplicate wells per assay. Two-way ANOVA with Dunnett’s multiple comparisons correction was used for statistical analysis (mean ± SEM; *p < 0.05, **p < 0.01, ****p < 0.0001). (B) Representative confocal images of CCL22 (green), CD11c (red), and CD31 (purple) on immunostained cryosections from WT thymus. The cortex (C) and medulla (M) are demarcated by white dotted lines. Bars, 100 µm.
Figure 3
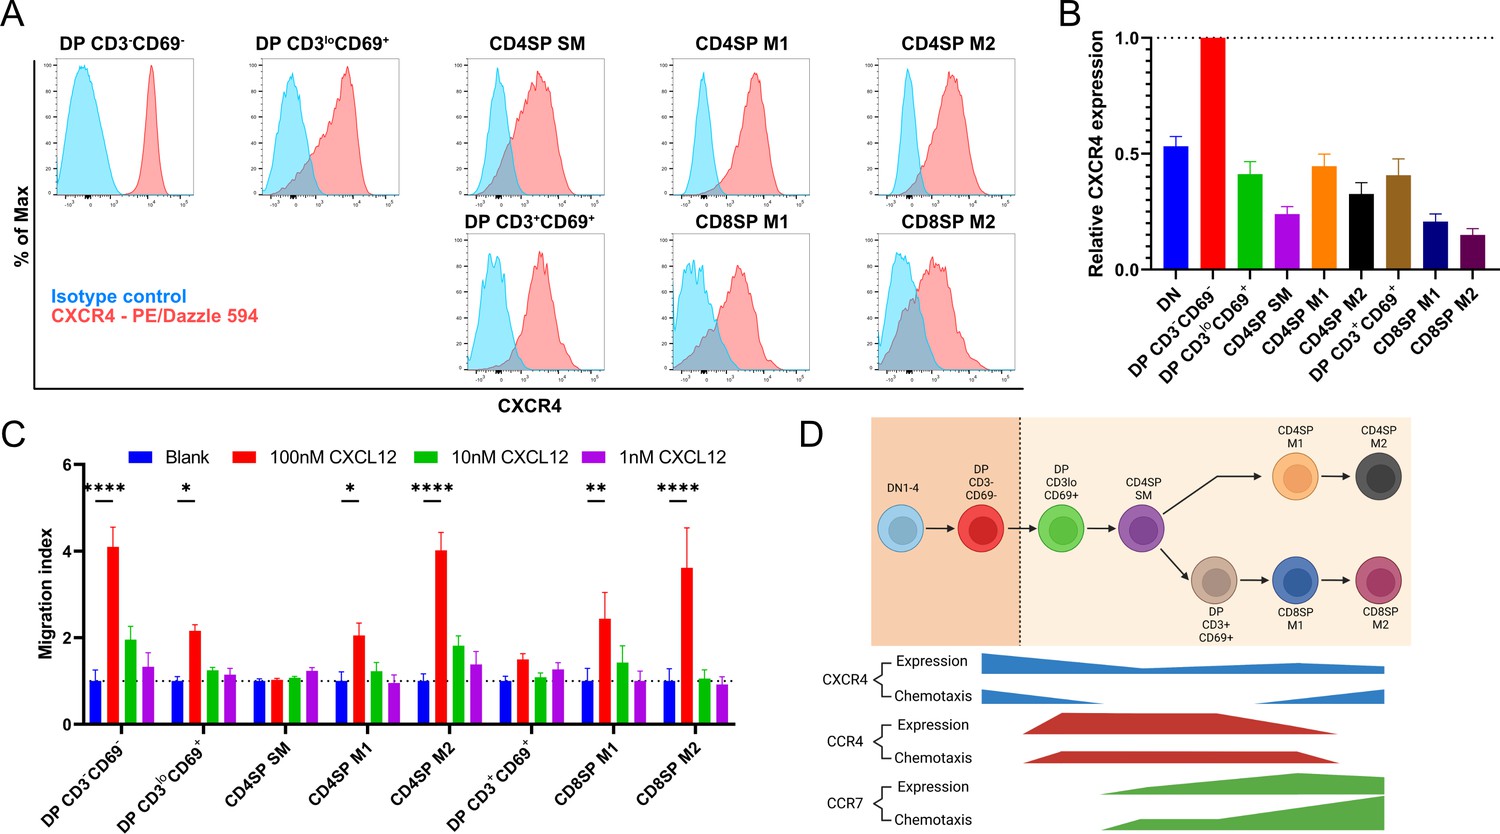
Persistent CXCR4 expression was detected on post-positive selection thymocytes, and CXCR4 activity declines only in intermediate subsets.
(A) Representative flow cytometry plots showing CXCR4 surface expression by the indicated thymocyte subsets, compared to isotype control stains. (B) Quantification of relative GMFI of CXCR4 for the indicated thymocyte subsets (mean ± SEM; N = 10). (C) Transwell assays were used to quantify chemotaxis of thymocyte subsets to the indicated concentrations of CXCL12. Migration index was calculated as the frequency of input cells of each subset that migrated toward the chemokine relative to the frequency of input cells that migrated in the absence of chemokine (Blank). Data were compiled from three independent experiments with triplicate wells per assay. Two-way ANOVA with Dunnett’s multiple comparisons correction was used for statistical analysis (mean ± SEM; *p < 0.05, **p < 0.01, ****p < 0.0001). (D) Graphical summary showing relative expression and chemotactic activity of CXCR4, CCR4, and CCR7 on post-positive selection thymocyte subsets based on data in Figures 1—3.
Figure 4 with 1 supplement
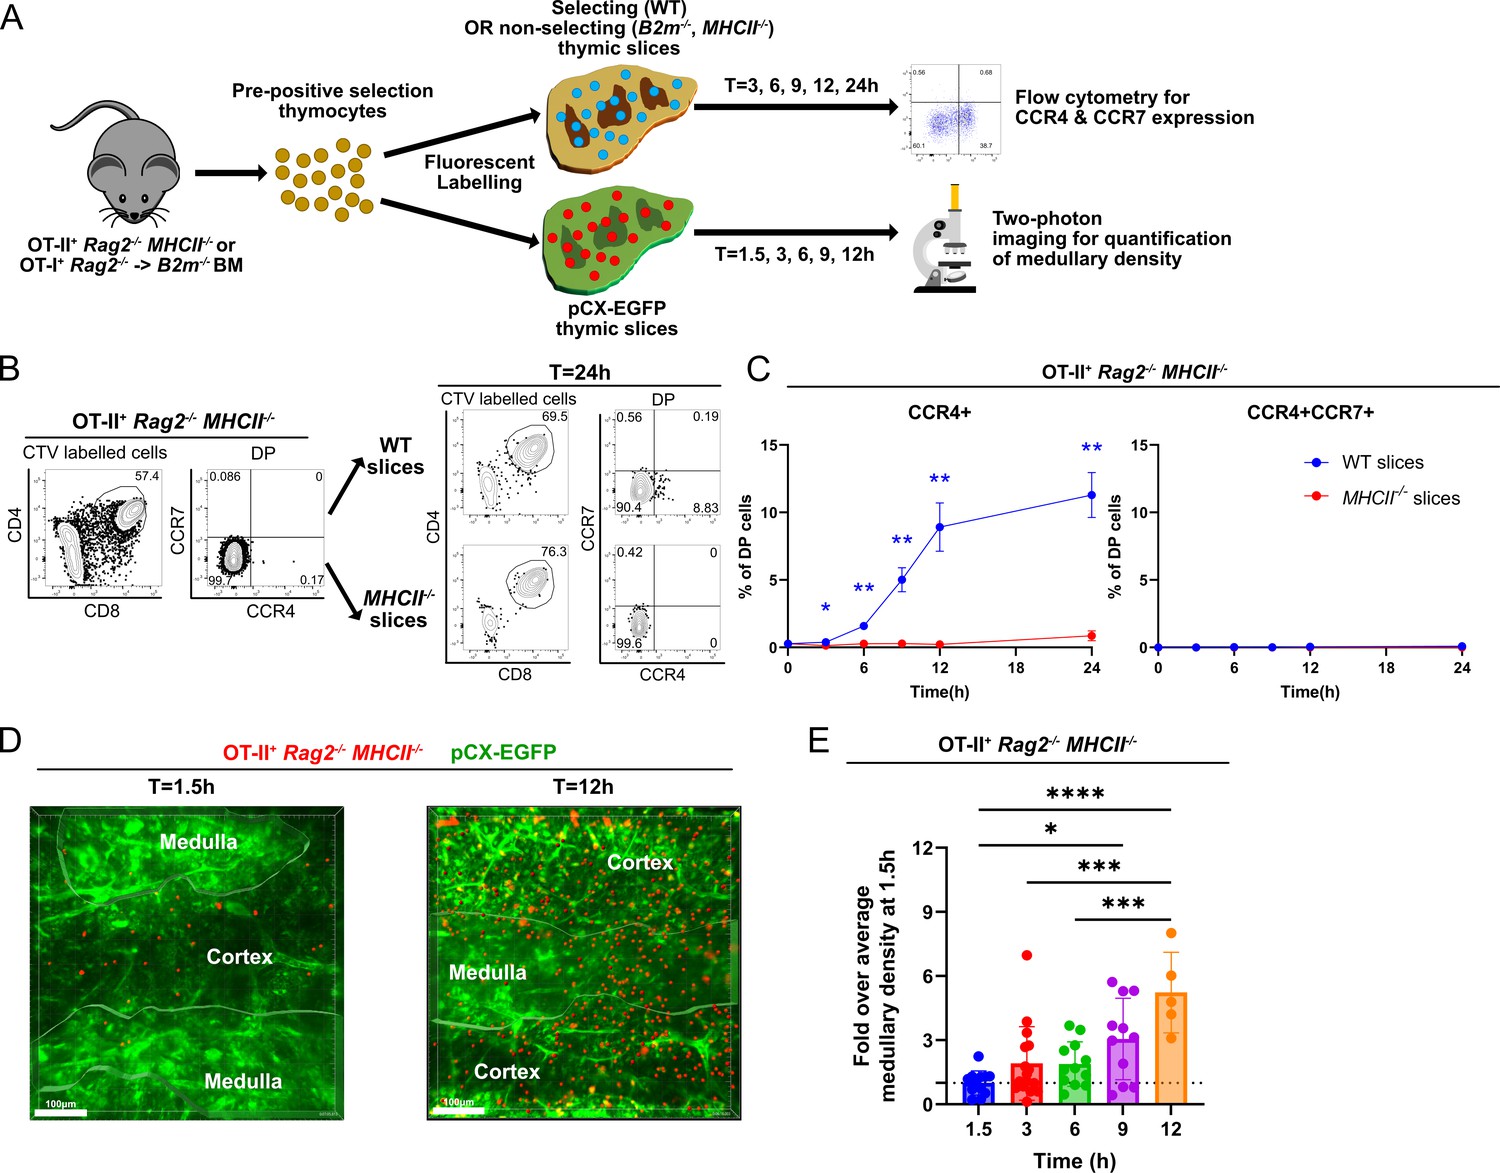
Rapid upregulation of CCR4 following positive selection of OT-II thymocytes correlates with medullary entry.
(A) Experimental schematic of synchronized thymic slice positive selection assays to determine the timing of CCR4 and CCR7 expression by flow cytometry and medullary entry by two-photon microscopy. (B) Representative flow cytometry plots showing CCR4 and CCR7 expression of OT-II+ Rag2−/−MHCII−/− thymocytes added to thymic slices (left) and analyzed 24 hr after incubation in WT or MHCII−/− slices, as indicated (right). (C) Percentages of CCR4+ and CCR4+CCR7+ OT-II+ thymocytes in thymic slices of the indicated genotypes at the indicated time points. Data were compiled from three experiments with triplicate slices each. Mixed-effect analysis with Šídák’s multiple comparisons correction was used for statistical analysis (mean ± SEM; *p < 0.05, **p < 0.01). (D) Representative maximum intensity projections of two-photon imaging data showing a pCX-EGFP thymic slice (green) containing CMTPX-labeled OT-II+ Rag2−/− MHCII−/− thymocytes (red) at 1.5 and 12 hr after thymocytes were added to the slices. Medullary and cortical volumes were demarcated as indicated by the masked regions. Bars, 100 µm. (E) Quantification of medullary density of OT-II+ Rag2−/− MHCII−/− thymocytes at indicated time points after incubation on pCX-EGFP thymic slices. Individual data points represent relative medullary input cell densities from each video compared to the average of medullary densities from all 1.5 hr videos. Data were compiled from four time-course experiments. One-way ANOVA with Tukey’s multiple comparison correction was used for statistical analysis (mean ± SEM; *p < 0.05, **p < 0.01, ***p < 0.001, ****p < 0.0001).
Figure 4—figure supplement 1
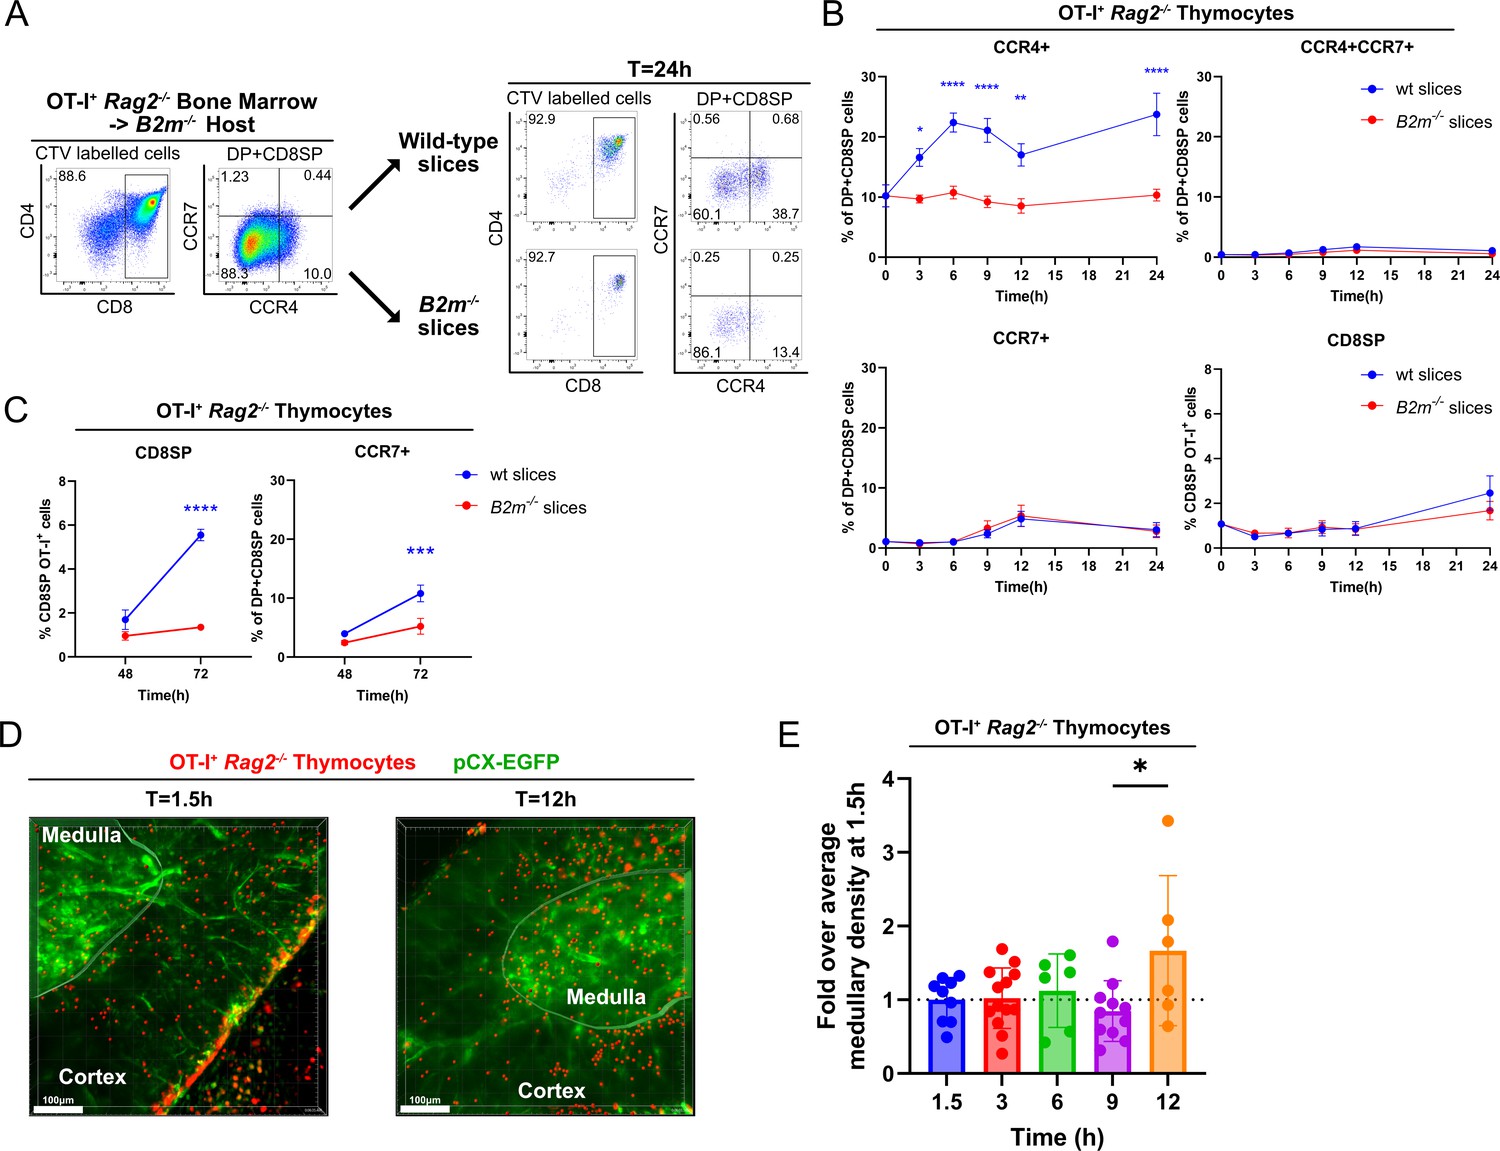
Rapid upregulation of CCR4 following positive selection of OT-I thymocytes correlates with medullary entry.
(A) Representative flow cytometry plots of CCR4 and CCR7 expression by pre-positive selection OT-I+ Rag2−/− thymocytes from B2m−/− hosts that were added to thymic slices (left) or analyzed 24 hr after incubation in WT or B2m−/− slices, as indicated (right). (B) Percentages of CCR4+, CCR4+CCR7+, CCR7+, or CD8SP OT-I+ Rag2−/− thymocyte after incubation on thymic slices of the indicated genotypes for the indicated time period up to 24 hr. (C) Percentages of CD8SP or CCR7+ OT-I+ Rag2−/− thymocytes at 48 and 72 hr time points after incubation on thymic slices of the indicated genotypes. Data for B and C were compiled from three OT-I+ Rag2−/− BM -> B2m−/− experiments, with triplicate slices per experiment. Mixed-effect analysis with Šídák’s multiple comparisons correction were used for statistical analysis (mean ± SEM; *p < 0.05, **p < 0.01, ***p<0.001, ****p < 0.0001). (D) Representative maximum intensity projections of two-photon imaging data showing a pCX-EGFP thymic slice (green) containing CMTPX-labeled OT-I+ Rag2−/− BM -> B2m−/− thymocytes (red) at 1.5 and 12 hr after thymocytes were added to the slices. Medullary and cortical volumes were demarcated as indicated by the masked regions. Bars, 100 µm. (E) Quantification of medullary density of OT-I+ Rag2−/− cells at the indicated time points. Individual data points represent medullary density calculated from each video, relative to the average medullary density of all videos taken at 1.5 hr. Data were compiled from three time-course experiments. One-way ANOVA with Tukey’s multiple comparisons correction was used for statistical analysis (mean ± SEM; *p < 0.05).
Figure 5 with 1 supplement

CCR4 and CCR7 are required for medullary accumulation of distinct post-positive selection thymocyte subsets.
(A) Representative maximum intensity projections of two-photon imaging data showing pCX-EGFP thymic slices (green) containing CMTPX (red)- and Indo-1 AM (blue)-labeled FACS sorted DP CD3loCD69+, CD4SP SM, or CD4SP M1 + M2 cells from WT or Ccr4−/− mice, as indicated, imaged 1–4 hr after slice entry. The cortex and medulla are demarcated by white dotted lines, and cell tracks are color encoded for elapsed imaging time. Bars, 100 µm. (B) Medullary-to-cortical thymocyte density ratios were quantified from two-photon imaging data as in (A), with individual data points representing ratios from individual videos. (C) Paired analysis of medullary-to-cortical density ratios of WT versus Ccr4−/−, WT versus Ccr7−/−, or Ccr7−/− versus DKO thymocyte subsets imaged simultaneously within the same slices, with individual data points representing ratios from single videos. Paired datasets are taken from the same data shown in (B), and paired t-tests were used for statistical analysis (**p < 0.01, ***p < 0.001). Quantification of (D) average thymocyte track speeds and (E) average track straightness from imaging data reported in (B). Individual data points represent average track speeds or straightness of thymocytes of the indicated genotype in individual videos. For (B), (D), and (E), data were compiled from 19 independent experiments. One-way ANOVA with Tukey’s multiple comparisons correction was used for statistical analysis (mean ± SEM; *p < 0.05, **p < 0.01, ***p < 0.001, ****p <0.0001).
Figure 5—figure supplement 1
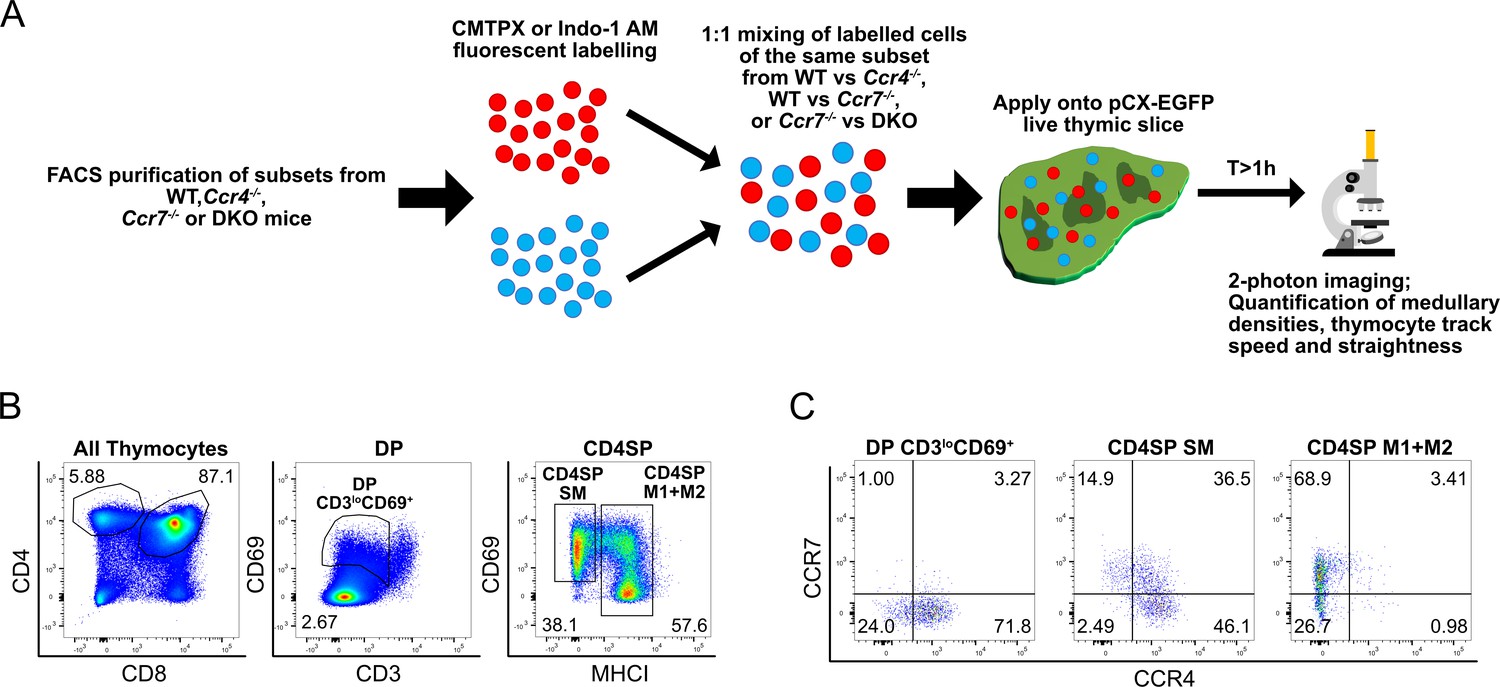
Experimental approach to test if CCR4 and CCR7 are required for medullary entry of distinct FACS purified post-positive selection thymocyte subsets that differentially express CCR4 and CCR7.
(A) Experimental schematic of two-photon imaging of sorted, fluorescently labeled post-positive selection thymocyte subsets. WT cells were imaged in the same slices with Ccr4−/− or Ccr7−/− cells, or Ccr7−/− cells were imaged in the same slices with DKO cells. Dyes were swapped between different experiments, and we did not find that use of CMTPX versus Indo-1 altered the results. Representative flow cytometry plots showing (B) the gating scheme for sorting DP CD3loCD69+, CD4SP SM, and CD4SP M1 + M2 subsets for two-photon imaging, and (C) CCR4 and CCR7 expression of FACS purified thymocyte subsets from a WT mouse.
Figure 6 with 1 supplement

CCR4 and CCR7 contribute to early versus late phases of negative selection, respectively.
(A) Flow cytometric gating scheme to quantify thymocytes undergoing early-phase (DP) or late-phase (CD4SP + CD8SP) negative selection. Representative data from a WT mouse are shown. (B) Representative flow cytometry plots showing CCR4 and CCR7 expression by thymocytes undergoing early- and late-phase negative selection, as gated in (A). (C) Frequencies of total, early-phase (DP), and late-phase (CD4SP + CD8SP) negative selection among all live thymocytes in WT, Ccr4−/−, Ccr7−/−, and DKO mice. (D) Ratio of thymocytes undergoing early- to late-phase negative selection in WT, Ccr4−/−, Ccr7−/−, and DKO mice. For (C) and (D), one-way ANOVA with Dunnett’s multiple comparisons correction was used for statistical analysis (mean ± SEM; N = 22 for WT, N = 20 for Ccr4−/−, N = 14 for Ccr7−/−, N = 24 for DKO; *p < 0.05, **p < 0.01, ***p < 0.001, ****p < 0.0001).
Figure 6—figure supplement 1
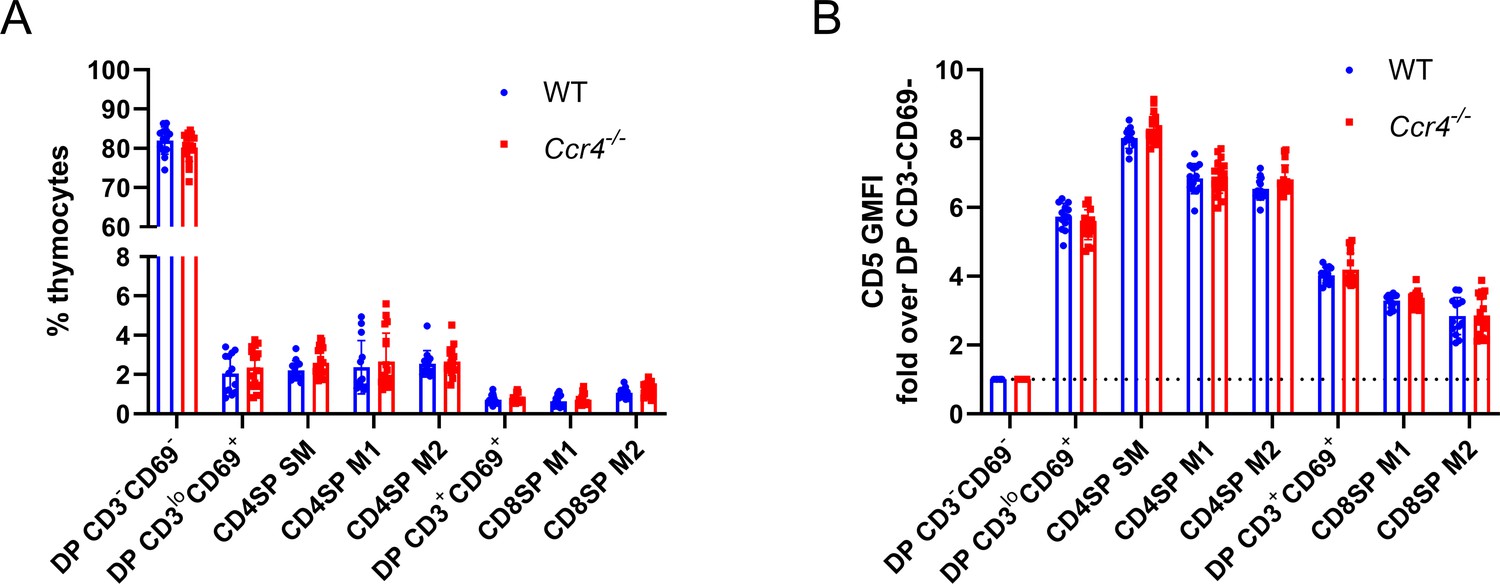
Thymocyte composition and CD5 levels are not altered in Ccr4−/− mice.
(A) Thymocyte subset frequencies in littermate WT and Ccr4−/− mice. (B) CD5 expression levels on the indicated thymocyte subsets from littermate WT and Ccr4−/− mice, normalized to the DP CD3−CD69− subset of each mouse. For (A) and (B), data were compiled from six independent experiments and significance determined using unpaired t-tests with Holm–Šídák’s multiple comparisons correction (mean ± SEM; N = 13 for WT, N = 18 for Ccr4−/−).
Figure 7 with 2 supplements
CCR4 and CCR7 promote tolerance to distinct organs, with CCR4 promoting tolerance to activated antigen-presenting cells.
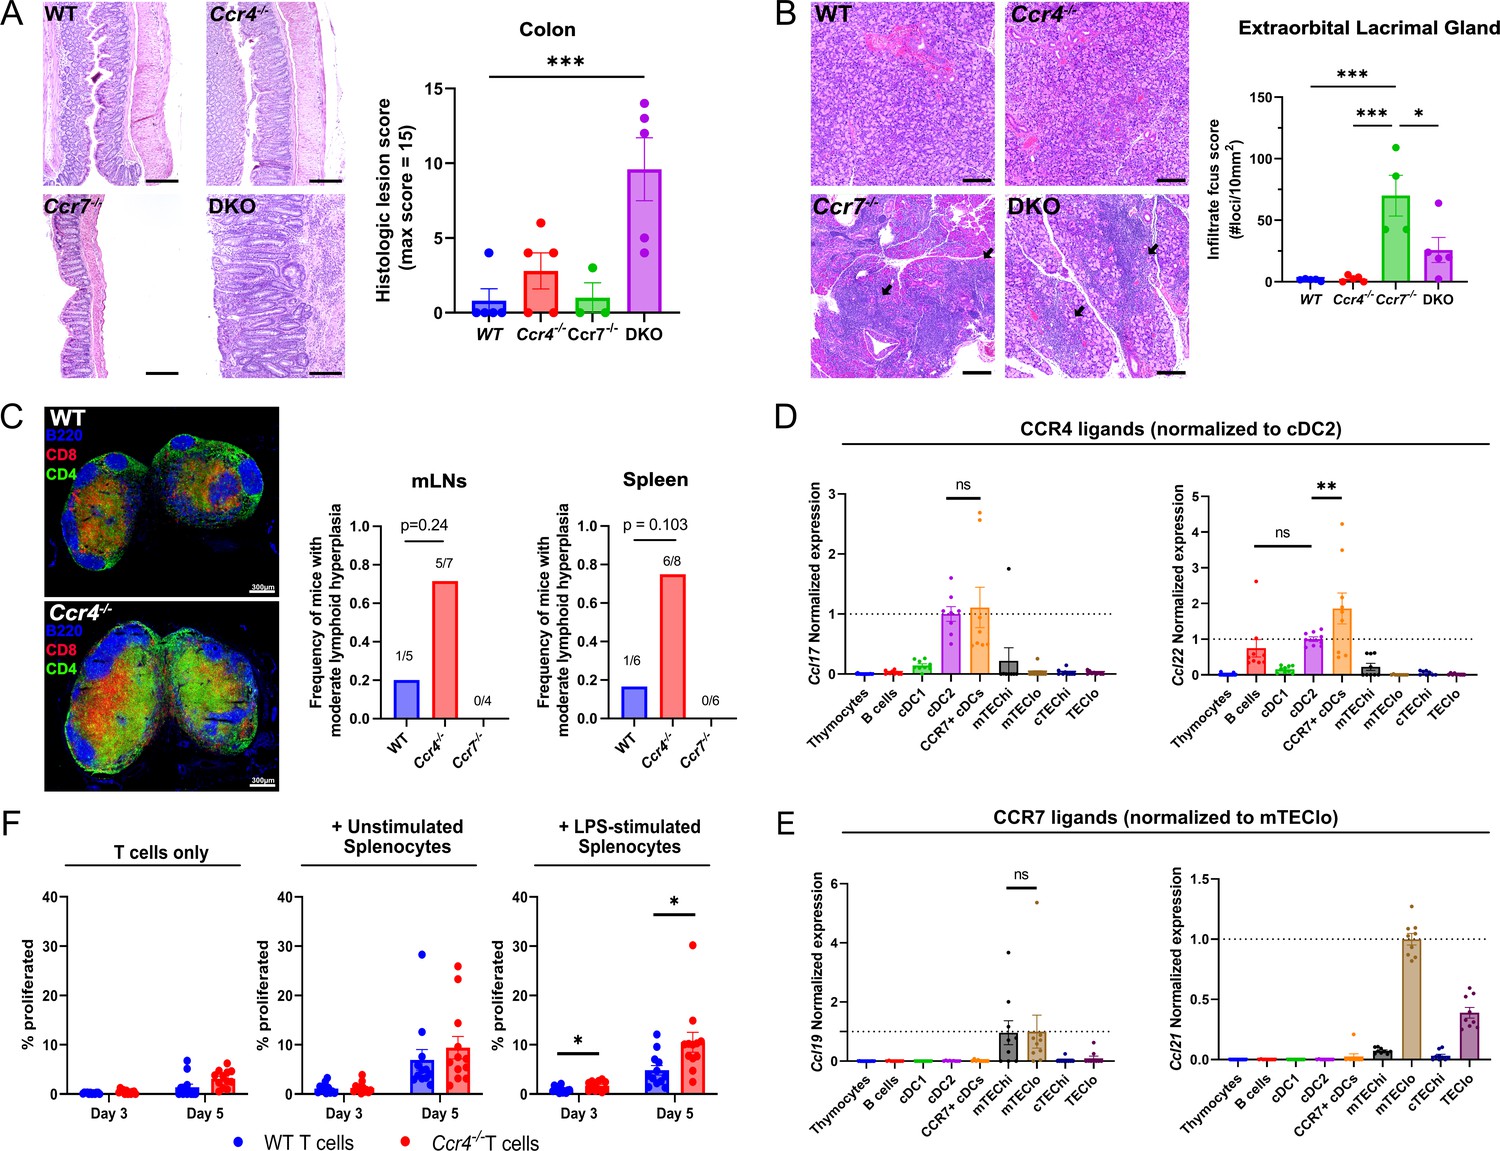
(A) Representative images of H&E stains from the colon of 5- to 6-month-old WT, Ccr4−/−, Ccr7−/−, or DKO mice (left). Bars, 200 µm. Histological lesion score was quantified by a pathologist blinded to genotype (right). One-way ANOVA was used to determine significance between groups (mean ± SEM; ***p < 0.001). (B) Representative images of H&E stains from extraorbital lacrimal glands of 5- to 6-month-old WT, Ccr4−/−, Ccr7−/−, or DKO mice (left). Bars, 500 µm. Arrows indicate lymphocytic infiltrate foci. The number of infiltrate foci per 10 mm2 was quantified (right), and one-way ANOVA was used to test significance between groups (mean ± SEM; *p < 0.05, ***p > 0.001). (C) Representative immunofluorescent images of CD4 (green), CD8 (red), and B220 (blue) on cryosections of inguinal lymph nodes from 5- to 6-month-old WT and Ccr4−/− mice (left). Frequency of moderate lymphoid hyperplasia in mLNs and spleens from 12- to 13-month-old WT, Ccr4−/−, and Ccr7−/− mice, as determined by a veterinary pathologist, blinded to genotype (right). Fisher’s exact test was used to determine significance. Bars, 300µm. Expression of CCR4 ligands (D) and CCR7 ligands (E) by distinct thymic antigen-presenting cell subsets, assessed by quantitative reverse-transcription polymerase chain reaction (qRT-PCR). Expression levels were normalized to subsets previously reported to express the respective ligands: CCL17 and CCL22 expression were normalized to cDC2 (Hu et al., 2015b), and CCL19 and CCL21 expression to mTEClo (Ki et al., 2014; Misslitz et al., 2004). Data were compiled from three independent experiments with triplicates. One-way ANOVA with Dunnett’s multiple comparisons correction was used for statistical analysis (mean ± SEM; ns: p > 0.05, **p < 0.01). (F) The percentage of WT or Ccr4−/− T cells that proliferated at days 3 and 5 when cultured without splenocytes, with unstimulated splenocytes, or with lipopolysaccharide (LPS)-stimulated splenocytes, as indicated. Data were compiled from four independent experiments with triplicate wells, and unpaired t-tests with Holm–Šídák’s multiple comparisons correction was used for statistical analysis (mean ± SEM; *p < 0.05).
Figure 7—figure supplement 1
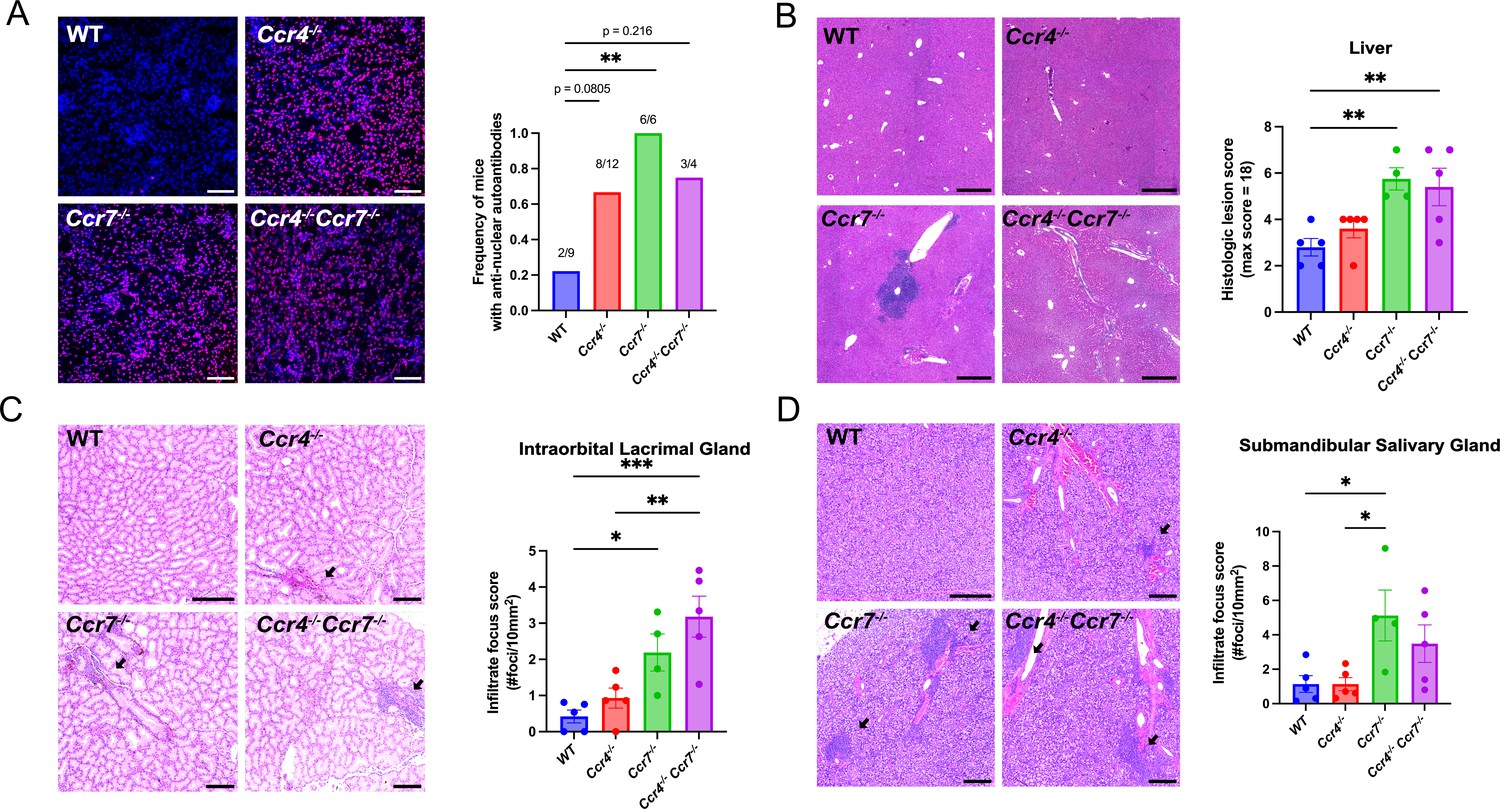
CCR4 and CCR7 support self-tolerance in different organs.
(A) Representative images of Rag2−/− kidney sections immunostained with serum from 5- to 6.5-month-old WT, Ccr4−/−, Ccr7−/−, or DKO mice (left). Anti-nuclear autoantibodies were detected as an overlay of anti-mouse IgG (red) and a nuclear stain (blue). Proportion of mice containing anti-nuclear serum autoantibodies was quantified (right). Fisher’s exact test was used to determine significance between groups (**p < 0.01).Bars, 200 µm. (B) Representative images of H&E stains from the liver of 5- to 6-month-old WT, Ccr4−/−, Ccr7−/−, and DKO mice (left). Bars, 500 µm. Histological lesion score was quantified by a veterinary pathologist (right). One-way analysis of variance (ANOVA) was used to test significance between groups (mean ± standard error of the mean [SEM]; **p > 0.01). Representative images of H&E stains from intraorbital lacrimal glands (C) and submandibular salivary glands (D) of 5- to 6-month-old WT, Ccr4−/−, Ccr7−/−, or DKO mice (left). Bars, 500 µm. Arrows indicate lymphocytic infiltrate foci. The number of infiltrate foci per 10 mm2 was quantified (right). One-way ANOVA was used to determine the significant differences between groups (mean ± SEM; *p < 0.05, **p < 0.01, ***p < 0.001).
Figure 7—figure supplement 2
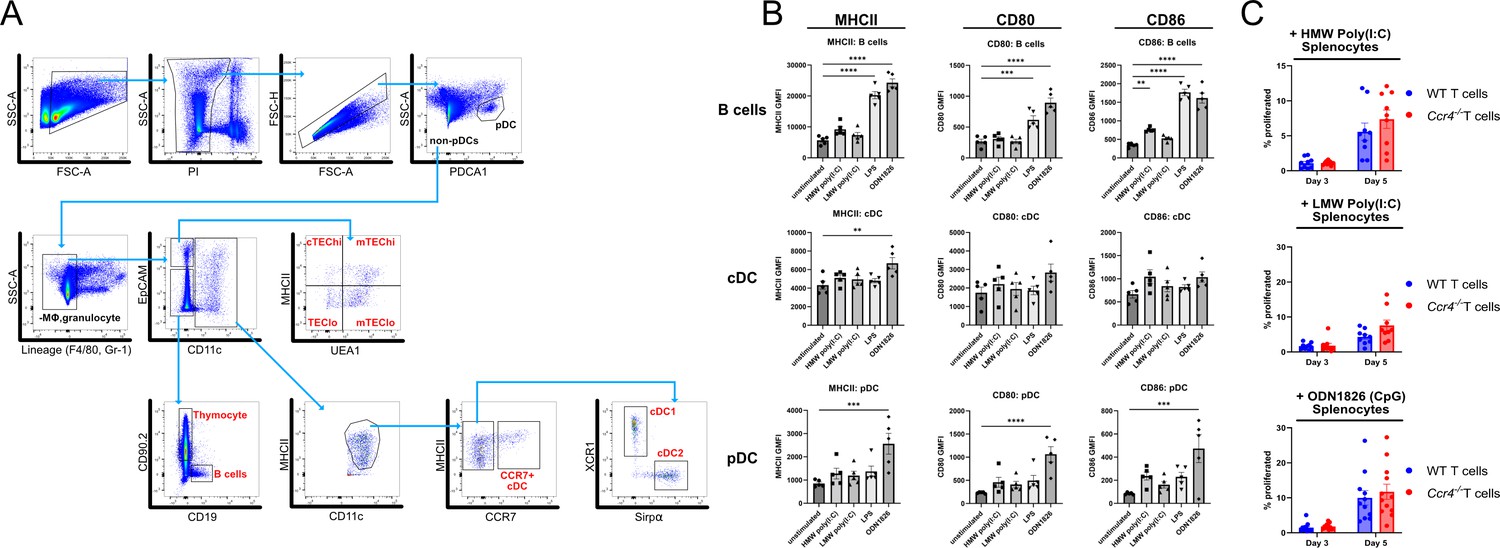
CCR4 promotes tolerance to activated antigen-presenting cells (APCs).
(A) Gating scheme for FACS sorting of thymic APC subsets analyzed by qRT-PCR for expression of CCR4 and CCR7 ligands. (B) Surface expression of MHC-II, CD80, and CD86 on APC subsets from unstimulated or toll-like receptor (TLR) ligand-stimulated splenocytes used in the proliferation assays in Figure 7F. Individual data points represent the GMFI of the indicated markers on each respective APC subset. Data were compiled from five individual experiments. One-way analysis of variance (ANOVA) with Dunnett’s multiple comparisons correction was used for statistical analysis (mean ± SEM; **p < 0.01, ***p < 0.001, ****p < 0.0001). (C) The percentage of WT and Ccr4−/− T cells that proliferated at days 3 and 5 when cultured with high molecular weight (HMW) poly(I:C), low molecular weight (LMW) poly(I:C), or ODN1826 (CpG)-stimulated splenocytes. Data were compiled from three to four independent experiments with triplicate wells, and unpaired t-tests with Holm–Šídák’s multiple comparisons correction was used for statistical analysis (mean ± SEM).
Videos
Video 1
Two-photon live imaging of OT-II+ Rag2−/− MHCII−/− input thymocytes (red) migrating in a pCX-EGFP thymic slice (green) 1.5 hr after addition to positively selecting thymic slices, as shown in Figure 3D.
Images were acquired for 15 min at 15-s time intervals through a depth of 40 µm, and maximum intensity projections are shown.
Video 2
Two-photon live imaging of OT-II+ Rag2−/− MHCII−/− input thymocytes (red) migrating in a pCX-EGFP thymic slice (green) 12 hr after addition to positively selecting thymic slices, as shown in Figure 3D.
Images were acquired for 15 min at 15-s time intervals through a depth of 40 µm, and maximum intensity projections are shown.
Video 3
Two-photon live imaging of OT-I+ Rag2−/− input thymocytes from a B2m−/− bone marrow chimera host (red) migrating in a pCX-EGFP thymic slice (green) 1.5 hr after addition to positively selecting thymic slices, as shown in Figure 4A.
Images were acquired for 15 min at 15-s time intervals through a depth of 40 µm, and maximum intensity projections are shown.
Video 4
Two-photon live imaging of OT-I+ Rag2−/− input thymocytes from a B2m−/− bone marrow chimera host (red) migrating in a pCX-EGFP thymic slice (green) 12 hr after addition to positively selecting thymic slices, as shown in Figure 4A.
Images were acquired for 15 min at 15-s time intervals through a depth of 40 µm, and maximum intensity projections are shown.
Video 5
Two-photon live imaging of WT (red) and Ccr4−/− (blue) FACS sorted DP CD3loCD69+ thymocytes migrating in pCX-EGFP thymic slices (green), as shown in Figure 4A.
Images were acquired for 15 min at 15-s time intervals through a depth of 40 µm, and maximum intensity projections with and without cell tracks, color coded for elapsed imaging time, are shown side by side.
Video 6
Two-photon live imaging of WT (red) and Ccr4−/− (blue) FACS sorted CD4SP SM thymocytes migrating in pCX-EGFP thymic slices (green), as shown in Figure 4A.
Images were acquired for 15 min at 15-s time intervals through a depth of 40 µm, and maximum intensity projections with and without cell tracks, color coded for elapsed imaging time, are shown side by side.
Video 7
Two-photon live imaging of WT (red) and Ccr4−/− (blue) FACS sorted CD4SP M1 + M2 thymocyte subsets, migrating in pCX-EGFP thymic slices (green), as shown in Figure 4A.
Images were acquired for 15 min at 15-s time intervals through a depth of 40 µm, and maximum intensity projections with and without cell tracks, color coded for elapsed imaging time, are shown side by side.
Video 8
Two-photon live imaging of DKO (red) and Ccr7−/− (blue) FACS sorted CD4SP M1 + M2 subsets, migrating in pCX-EGFP thymic slices (green).
Images were acquired for 15 min at 15-s time intervals through a depth of 40 µm, and maximum intensity projections with and without cell tracks, color coded for elapsed imaging time, are shown side by side.
Tables
Key resources table
| Reagent type (species) or resource | Designation | Source or reference | Identifiers | Additional information |
|---|---|---|---|---|
| gene (Mus musculus) | Ccr4 | GenBank | Gene ID: 12773 | |
| gene (Mus musculus) | Ccr7 | GenBank | Gene ID: 12775 | |
| strain, strain background (Mus musculus) | C57BL6/J | Jackson Laboratory | Strain #: 000664 | |
| genetic reagent (Mus musculus) | B6.SJL-Ptprca PepCb/BoyJ (CD45.1) | Jackson Laboratory | Strain #: 002014 | |
| genetic reagent (Mus musculus) | C57BL/6-Tg(TcraTcrb)1100Mjb/J (OT-I) | Jackson Laboratory | Strain #: 003831 | |
| genetic reagent (Mus musculus) | B6.Cg-Tg(TcraTcrb)425Cbn/J (OT-II) | Jackson Laboratory | Strain #: 004194 | |
| genetic reagent (Mus musculus) | B6(Cg)-Rag2tm1.1Cgn/J (Rag2-/-) | Jackson Laboratory | Strain #: 008449 | |
| genetic reagent (Mus musculus) | B6.129P2(C)Ccr7tm1Rfor/J (Ccr7-/-) | Jackson Laboratory | Strain #: 006621 | |
| genetic reagent (Mus musculus) | B6.129S2-H2dlAb1-Ea/J (H2-/-) | Jackson Laboratory | Strain #: 003584 | |
| genetic reagent (Mus musculus) | B6.129P2-B2mtm1Unc/DcrJ (B2m-/-) | Jackson Laboratory | Strain #: 002087 | |
| genetic reagent (Mus musculus) | C57BL/6-Tg(Nr4a1-EGFP/cre)820Khog/J (Nr4a1GFP) | Jackson Laboratory | Strain #: 016617 | |
| genetic reagent (Mus musculus) | Ccr4-/- | Chvatchko et al., 2000 | Generously provided by A.D. Luster (Massachusetts General Hospital, Boston, MA) | |
| genetic reagent (Mus musculus) | pCX-EGFP | Wright et al., 2001 | Generously provided by Irving L. Weissman (Stanford University, Stanford, CA) | |
| genetic reagent (Mus musculus) | Rag2p-GFP | Boursalian et al., 2004 | Generously provided by Ellen R. Richie (the University of Texas MD Anderson Center, Houston, TX) | |
| genetic reagent (Mus musculus) | Ccr4-/-; Ccr7-/-(DKO) | This paper | See Materials and Methods, Section “Mice” | |
| genetic reagent (Mus musculus) | OT-I Rag2-/- | This paper | See Materials and Methods, Section “Mice” | |
| genetic reagent (Mus musculus) | OT-II Rag2-/- H2-/- | This paper | See Materials and Methods, Section “Mice” | |
| antibody | PE/Cyanine 7 Anti-mouse CD3, Rat Monoclonal, clone 17 A2 | BioLegend | Cat # 100220; RRID:AB_1732057 | (1:200) |
| antibody | PE Anti-mouse CCR4, Armenian Hamster Monoclonal, clone 2 G12 | BioLegend | Cat # 131204; RRID:AB_1236367 | (1:200) |
| antibody | APC Anti-mouse CCR7, Rat Monoclonal, clone 4B12 | BioLegend | Cat # 120108; RRID:AB_389234 | (1:200) |
| antibody | Brilliant Violet 510 Anti-mouse CD4, Rat Monoclonal, clone RM4-5 | BioLegend | Cat # 100559; RRID:AB_2562608 | (1:200) |
| antibody | PE/Cyanine7 Anti-mouse CD5, Rat Monoclonal, clone 53–7.3 | BioLegend | Cat # 100622; RRID:AB_2562773 | (1:200) |
| antibody | FITC Anti-mouse CD8a, Rat Monoclonal, clone 53–6.7 | BioLegend | Cat # 100706; RRID:AB_312745 | (1:200) |
| antibody | Alexa Flour 700 Anti-mouse CD11b, Rat Monoclonal, clone M1/70 | BioLegend | Cat # 101222; RRID:AB_493705 | (1:200) |
| antibody | Pacific Blue Anti-mouse CD11c, Armenian Hamster Monoclonal, clone N418 | BioLegend | Cat # 117322; RRID:AB_755988 | (1:200) |
| antibody | PerCP/Cyanine5.5 Anti-mouse CD19, Rat Monoclonal, clone 1D3/CD19 | BioLegend | Cat # 152405; RRID:AB_2629814 | (1:200) |
| antibody | APC Anti-mouse CD25, Rat Monoclonal, clone PC61 | BioLegend | Cat # 102012; RRID:AB_312861 | (1:200) |
| antibody | APC Anti-mouse CD45.1, Mouse (A. SW) monoclonal, clone A20 | BioLegend | Cat # 110714; RRID:AB_313503 | (1:200) |
| antibody | PE Anti-mouse CD45.2, Mouse (SJL) monoclonal, clone 104 | BioLegend | Cat # 109808; RRID:AB_313445 | (1:200) |
| antibody | Biotin Anti-mouse CD69, Armenian Hamster monoclonal, clone H1.2F3 | BioLegend | Cat # 104504; RRID:AB_313107 | (1:200) |
| antibody | Brilliant Violet 510 Anti-mouse CD90.2, Rat monoclonal, clone 30 H12 | BioLegend | Cat # 105335; RRID:AB_2566587 | (1:200) |
| antibody | PE/Dazzle 594 Anti-mouse CXCR4, Rat monoclonal, clone L276F12 | BioLegend | Cat # 146514; RRID:AB_2563683 | (1:200) |
| antibody | Alexa Flour 488 Anti-mouse Cleaved Caspase 3 (Asp175), Rabbit polyclonal | Cell Signaling Technology | Cat # 9669 S | (1:200) |
| antibody | PE Anti-mouse EpCAM, Rat monoclonal, clone G8.8 | BioLegend | Cat # 118206; RRID:AB_1134172 | (1:200) |
| antibody | APC/Cyanine7 Anti-mouse F4/80, Rat monoclonal, clone BM8 | BioLegend | Cat # 123118; RRID:AB_893477 | (1:200) |
| antibody | PE/Cyanine5 Anti-mouse Gr1, Rat monoclonal, clone RB6-8C5 | BioLegend | Cat # 108410; RRID:AB_313375 | (1:200) |
| antibody | PerCP/Cyanine5.5 Anti-mouse H-2Kb (MHCI), Mouse (BALB/c) monoclonal, clone AF6-88.5 | BioLegend | Cat # 116516; RRID:AB_1967133 | (1:200) |
| antibody | PE/Cyanine7 Anti-mouse I-A/I-E (MHCII), Rat Monoclonal, clone M5/114.15.2 | BioLegend | Cat # 107630; RRID:AB_2069376 | (1:200) |
| antibody | Alexa Flour 488 Anti-mouse PDCA1, Rat Monoclonal, clone 927 | BioLegend | Cat # 127012; RRID:AB_1953287 | (1:200) |
| antibody | PE/Cyanine5 Anti-mouse Ter-119, Rat monoclonal, clone TER-119 | BioLegend | Cat # 116209; RRID:AB_313710 | (1:200) |
| antibody | APC Anti-mouse Sirpα, Rat monoclonal, clone P84 | BioLegend | Cat # 144014; RRID:AB_2564061 | (1:200) |
| antibody | Brilliant Violet 650Anti-mouse XCR1, mouse monoclonal, clone ZET | BioLegend | Cat # 148220; RRID:AB_2566410 | (1:200) |
| antibody | Biotin Anti-mouse CD11c, Armenian Hamster monoclonal, clone N418 | BioLegend | Cat # 117303; RRID:AB_313772 | (1:50) |
| antibody | APC Anti-mouse CD4, Rat monoclonal, clone GK1.5 | BioLegend | Cat # 100412; RRID:AB_312696 | (1:100) |
| antibody | APC Anti-mouse CD31, Rat monoclonal, clone 390 | BioLegend | Cat# 102410; RRID:AB_312905 | (1:100) |
| antibody | Biotin anti-mouse/human CD45R/B220, Rat monoclonal, clone RA3-6B2 | BioLegend | Cat # 103204; RRID:AB_312989 | (1:200) |
| antibody | Purified Rat anti-mouse B220, Rat monoclonal, clone RA3.3A1/6.1 | BioXCell | Cat # BE0067 | (1:100) |
| antibody | Purified Rat anti-mouse CD3, Rat monoclonal, clone 17 A2 | BioXCell | Cat # BE0002 | (1:50) |
| antibody | Purified Rat anti-mouse CD8, Rat monoclonal, clone 53.6.72 | BioXCell | Cat # BE0004-1 | (1:100) |
| antibody | Purified Rat anti-mouse CD25, Rat monoclonal, clone PC-61.5.3 | BioXCell | Cat # BE0012 | (1:100) |
| antibody | Purified Rat anti-mouse CD11b, Rat monoclonal, clone M1/70 | BioXCell | Cat # BE0007 | (1:100) |
| antibody | Purified Rat anti-mouse Gr-1, Rat monoclonal, clone RB6-8C5 | BioXCell | Cat # BE0075 | (1:100) |
| antibody | Purified Rat anti-mouse Ter-119, Rat monoclonal, clone TER-119 | BioXCell | Cat # BE0183 | (1:100) |
| antibody | Alexa Fluor 594 AffiniPure Donkey anti-mouse IgG, Donkey polyclonal | Jackson ImmunoResearch | Cat # 715585151; RRID:AB_2340855 | (1:100) |
| antibody | Goat anti-mouse CCL22, Polyclonal, Goat polyclonal | R&D Systems | Cat # AF439; RRID:AB_355360 | (1.2 ug/mL) |
| antibody | Normal Goat IgG control, Goat polyclonal | R&D Systems | Cat # AB-108-C; RRID:AB_354267 | (1:200) |
| antibody | CD8a- Alexa Fluor 594, rat monoclonal, clone 53.6.7 | BioLegend | Cat# 100758 | (1:100) |
| Other flow cytometry reagents | Qdot 605 Streptavidin Conjugate | Invitrogen | Cat # Q10101MP | (1:200) |
| Other immunostaining reagents | Streptavidin-Alexa Fluor 488 | Invitrogen | Cat# S32354 | |
| Other flow cytometry reagents | Ulex Europaeus Agglutinin I (UEAI), Biotinylated | Vector Laboratories | SKU B-1065–2 | (1:1000) |
| sequence-based reagent | CCL17 Forward | Cowan et al., 2014 | qPCR Primer | 5’-AGTGGAGTGTTCCAGGGATG-3’ |
| sequence-based reagent | CCL17 Reverse | Cowan et al., 2014 | qPCR Primer | 5’-CCAATCTGATGGCCTTCTTC-3’ |
| sequence-based reagent | CCL19 Forward | Kurd and Robey, 2016 | qPCR Primer | 5’-GCTAATGATGCGGAAGACTG-3’ |
| sequence-based reagent | CCL19 Reverse | Kurd and Robey, 2016 | qPCR Primer | 5’-ACTCACATCGACTCTCTAGG-3’ |
| sequence-based reagent | CCL21 Forward | Seach et al., 2008 | qPCR Primer | 5’-GCAGTGATGGAGGGGGTCAG-3’ |
| sequence-based reagent | CCL21 Reverse | Seach et al., 2008 | qPCR Primer | 5’-CGGGGTGAGAACAGGATTGC-3’ |
| sequence-based reagent | CCL22 Forward | Hu et al., 2015b | qPCR Primer | 5’-AGGTCCCTATGGTGCCAATGT-3’ |
| sequence-based reagent | CCL22 Reverse | Hu et al., 2015b | qPCR Primer | 5’- CGGCAGGATTTTGAGGTCCA-3’ |
| sequence-based reagent | β-actin Forward | Camara et al., 2019 | qPCR Primer | 5’- CACTGTCGAGTCGCGTCCA-3’ |
| sequence-based reagent | β-actin Reverse | Camara et al., 2019 | qPCR Primer | 5’- CATCCATGGCGAACTGGTGG-3’ |
| peptide, recombinant protein | Recombinant Murine CCL17 | Peprotech | Cat # 250–43 | |
| peptide, recombinant protein | Recombinant Murine CCL19 | Peprotech | Cat # 250-27B | |
| peptide, recombinant protein | Recombinant Murine CCL21 | Peprotech | Cat # 250–13 | |
| peptide, recombinant protein | Recombinant Murine CCL22 | Peprotech | Cat # 250–23 | |
| peptide, recombinant protein | Recombinant Murine CXCL12 | Peprotech | Cat # 250-20B | |
| peptide, recombinant protein | Recombinant Mouse CCL25 | R&D Systems | Cat # 481-TK-025 | |
| commercial assay or kit | Fixation / Permeablization Kit (RUO) | BD | Cat # 554714 | |
| commercial assay or kit | CellTrace Violet cell proliferation kit | Invitrogen | Cat # C34557 | |
| commercial assay or kit | Celltracker Red CMTPX Dye | Invitrogen | Cat # C34552 | |
| commercial assay or kit | eBioscience Indo-1 AM Calcium Sensor Dye | Invitrogen | Cat # 65-0856-39 | |
| commercial assay or kit | TRIzol Reagent | Invitrogen | Cat # 15596026 | |
| commercial assay or kit | SYBR Green PCR Master Mix | Applied Biosystems | Cat # 4309155 | |
| commercial assay or kit | Mouse TLR1-9 Agonist Kit | Invivogen | Cat # tlrl-kit1mw | |
| commercial assay or kit | Dynabeads sheep anti-rat IgG | Invitrogen | Cat # 11035 | |
| commercial assay or kit | ProLong Gold Antifade Mountant | ThermoFisher | Cat # P36930 | |
| software, algorithm | Flowjo v10.8.1 | BD | https://www.flowjo.com/ | |
| software, algorithm | Graphpad PRISM v9.3.1 | Graphpad Software | https://www.graphpad.com/ | |
| software, algorithm | Imaris v9.8.0 | Oxford Instruments | https://imaris.oxinst.com/ | |
| software, algorithm | Biorender | Biorender | https://biorender.com/ | |
| software, algorithm | ImageJ | NIH | https://imagej.nih.gov/ |
Additional files
-
MDAR checklist
- https://cdn.elifesciences.org/articles/80443/elife-80443-mdarchecklist1-v2.docx
-
Source data 1
Compiled data used to generate graphs in all figures and figure supplements.
- https://cdn.elifesciences.org/articles/80443/elife-80443-data1-v2.xlsx
Download links
A two-part list of links to download the article, or parts of the article, in various formats.
Downloads (link to download the article as PDF)
Open citations (links to open the citations from this article in various online reference manager services)
Cite this article (links to download the citations from this article in formats compatible with various reference manager tools)
CCR4 and CCR7 differentially regulate thymocyte localization with distinct outcomes for central tolerance
eLife 12:e80443.
https://doi.org/10.7554/eLife.80443


