Single-cell RNA-seq of heart reveals intercellular communication drivers of myocardial fibrosis in diabetic cardiomyopathy
- Cyrus Tang Hematology Center, Soochow University, China
- Institute of Clinical Medicine Research, Suzhou Science & Technology Town Hospital, Gusu School, Nanjing Medical University, China
- Faculty of Anesthesiology, Suzhou Science & Technology Town Hospital, Gusu School, Nanjing Medical University, China
- Suzhou Polytechnic Institute of Agriculture, China
Figures
Figure 1 with 3 supplements
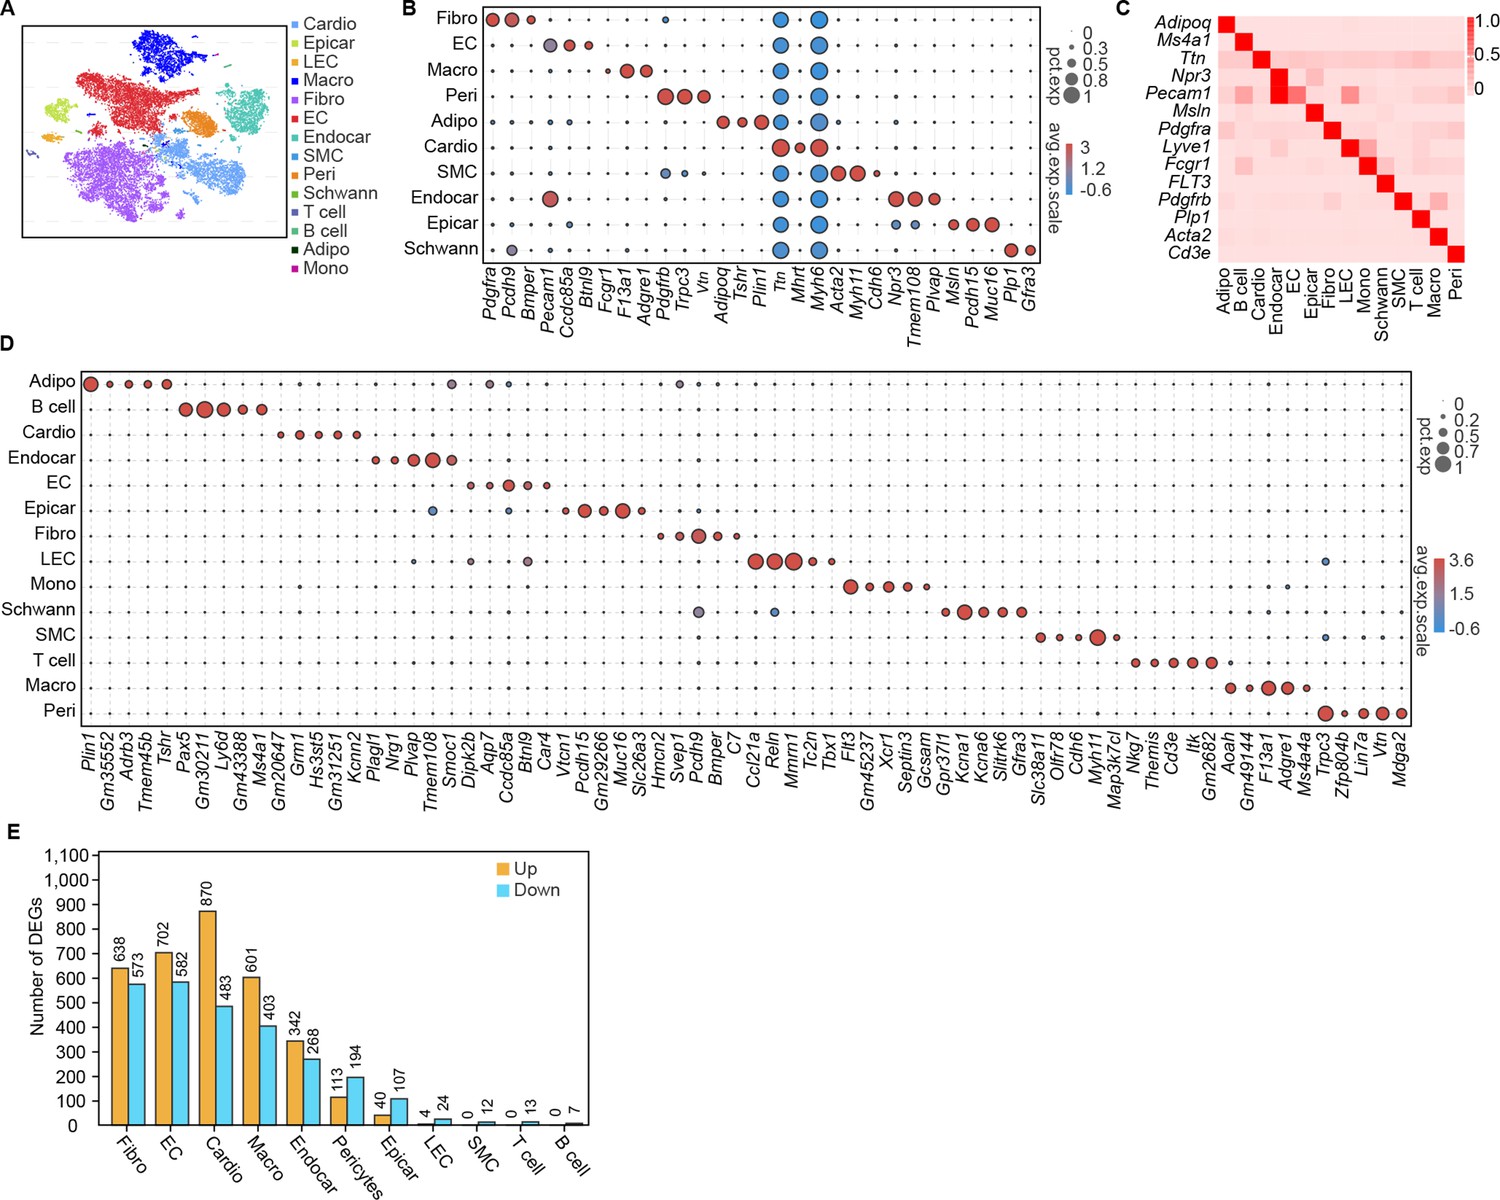
Single-cell profile of heart in diabetic mice.
(A) t-SNE projection of all mouse cardiac cells (n = 16,490 cardiac cells from 6 control mice and n = 16,095 cardiac cells from 6 diabetic mice). (B) The marker genes defining each type of cell cluster in A are listed. (C) Heatmap showings the canonical cell markers of major cardiac cell populations. (D) Dot plot representing the top 5 distinct genes in each cell population. (E) Lollipop plot showing the number of up- and downregulated genes in high-fat diet (HFD)/streptozotocin (STZ)-treated mouse heart cells, compared with the control. Adipo, adipocytes; Cardio, cardiomyocytes; Endocar, endocardial cells; EC, endothelial cells; Epicar, epicardial cells; Fibro, fibroblasts; LEC, lymphatic ECs; Mono, monocytes; Schwann, schwann cells; SMC, smooth muscle cells; Macro, macrophages; Peri, pericytes; Details of the 25 transcriptionally distinct pre-clusters with highly consistent expression patterns across individual mouse heart are listed in Supplementary file 1. Detailed genes with significant transcriptomic changes in cardiac populations are listed in Supplementary file 2. The details of top 10 upregulated genes in cardiac populations are listed in Supplementary file 3.
Figure 1—figure supplement 1
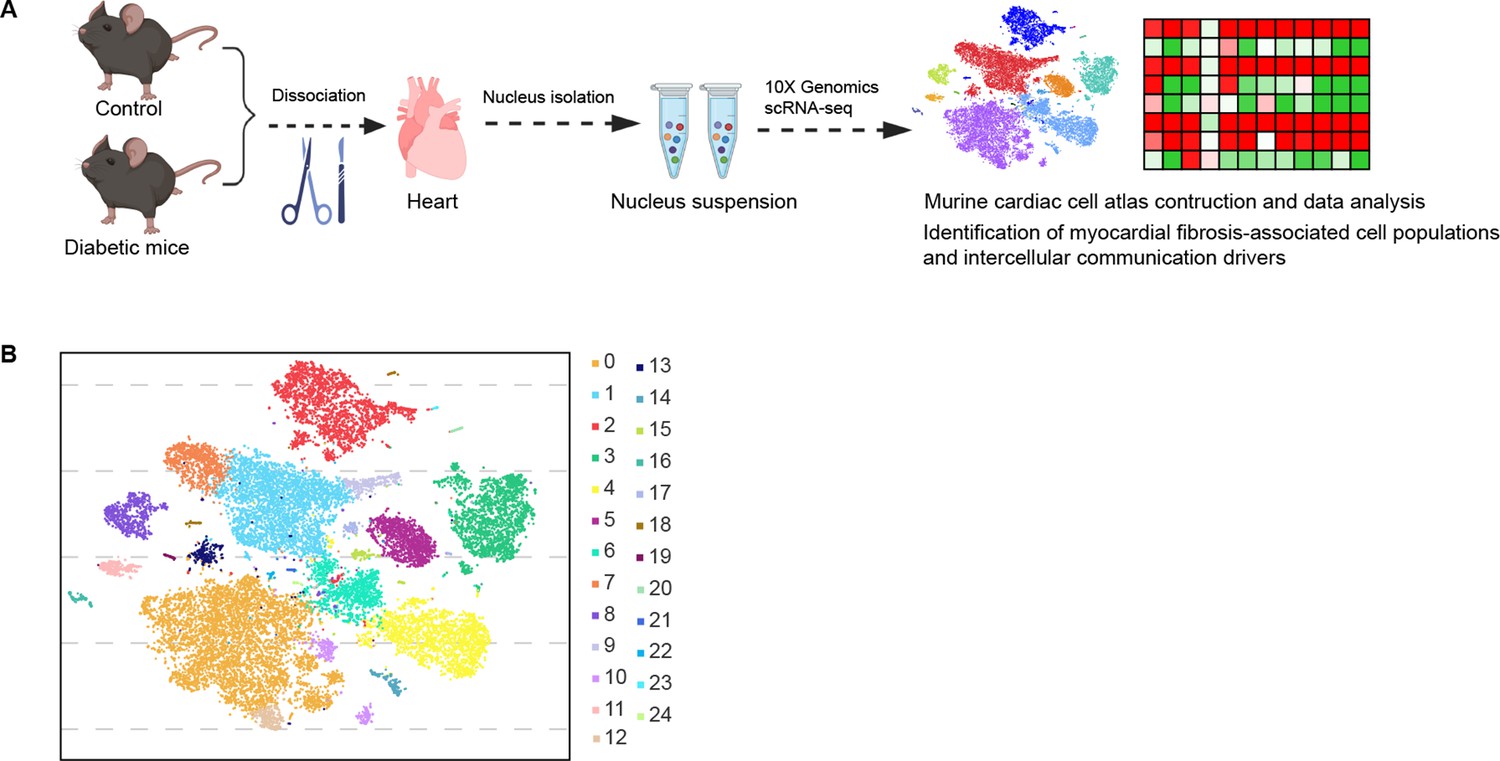
Experimental design and cell type characterization.
(A) Schematic overview of the experimental design. (B) t-SNE projection of all pre-clustered cells (n = 16,490 cardiac cells from 6 control mice and n = 16,095 cardiac cells from 6 diabetic mice).
Figure 1—figure supplement 2
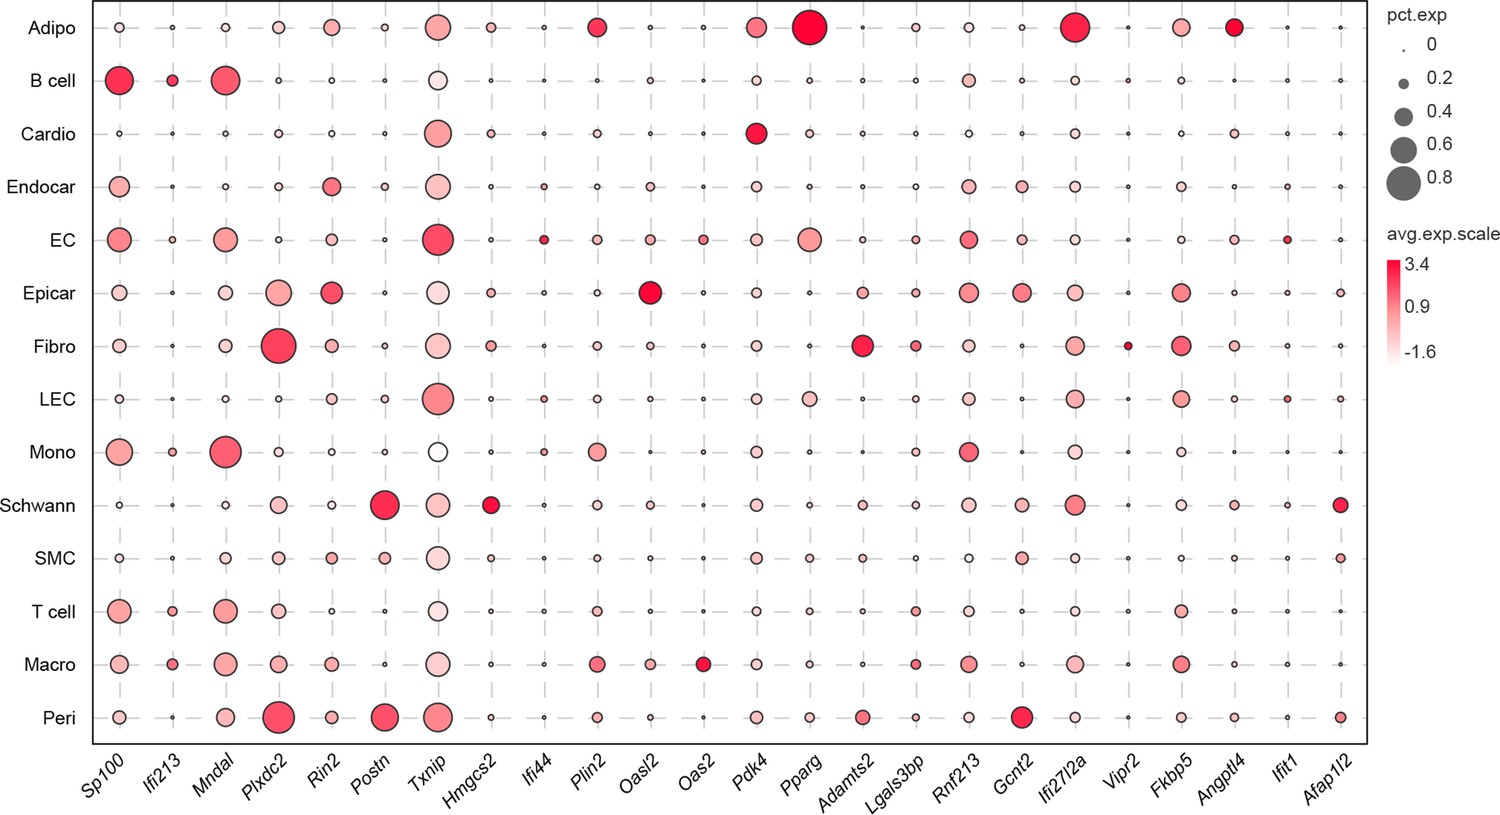
The top 10 upregulated genes during the pathology of high-fat diet (HFD)/streptozotocin (STZ)-induced diabetes within each cell population.
The circle size illustrates the proportion of cells within each transcript, while the dot color indicates the relative average expression level of the gene.
Figure 1—figure supplement 3
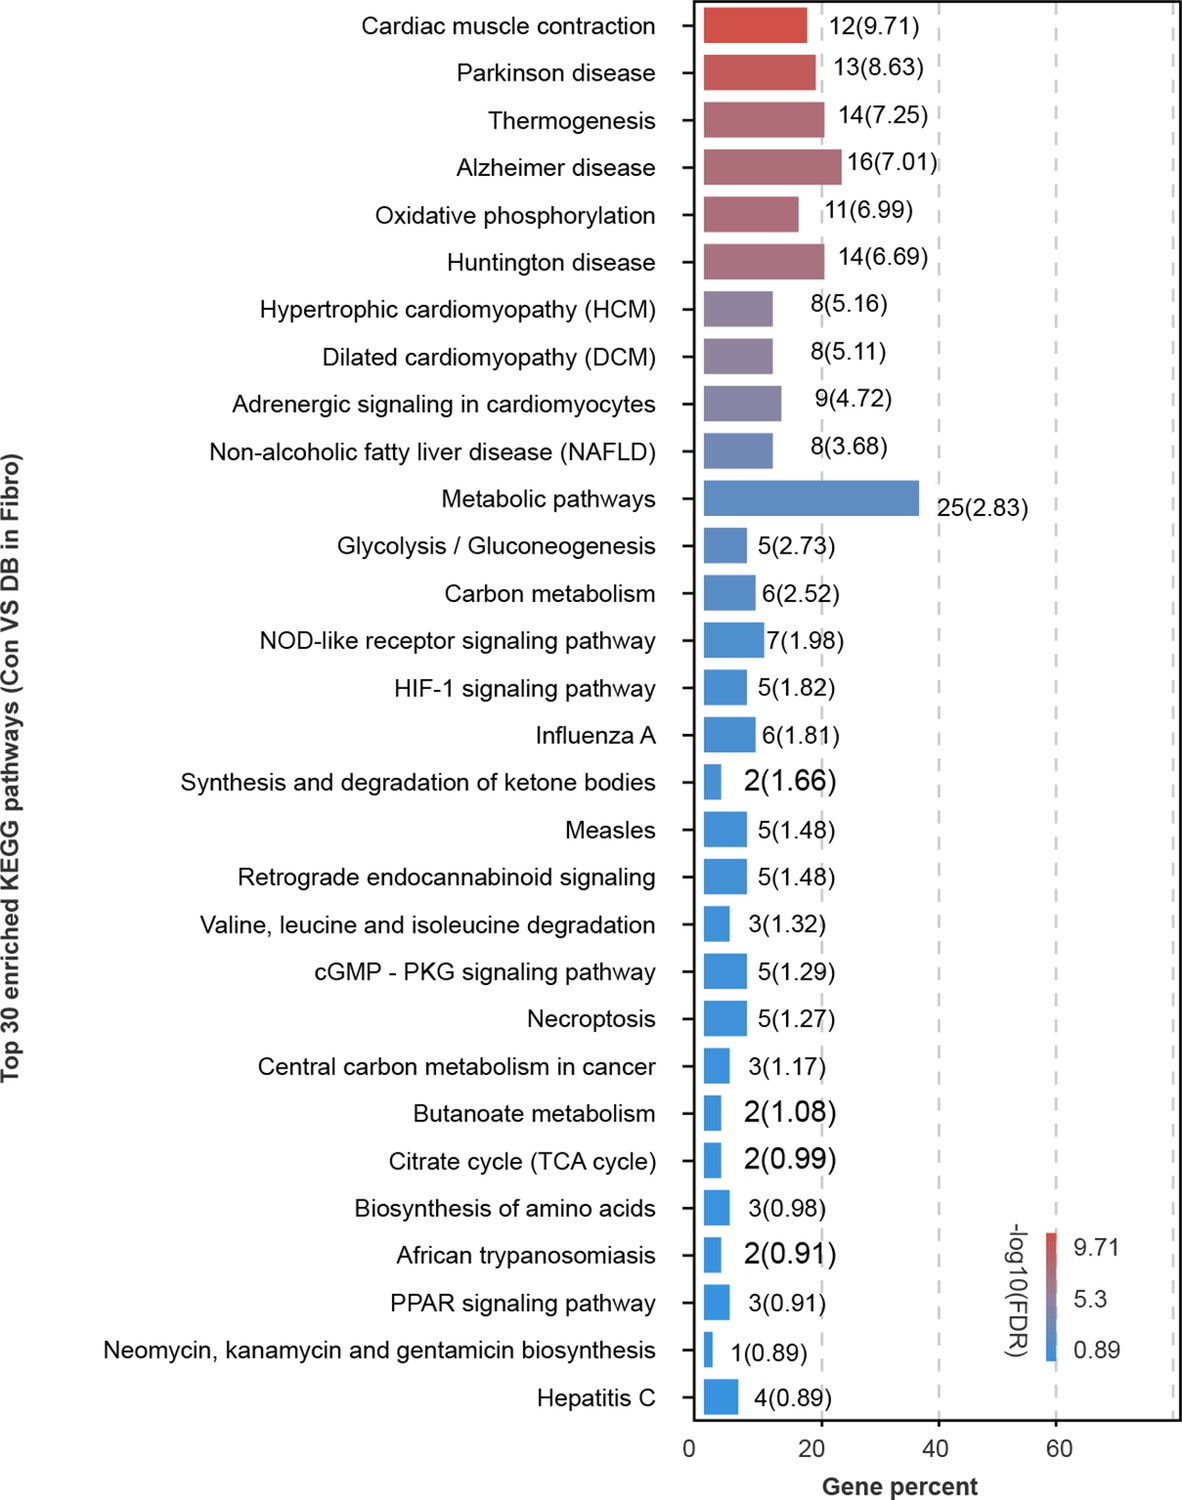
Top 30 enriched Kyoto Encyclopedia of Genes and Genomes (KEGG) pathways in high-fat diet (HFD)/streptozotocin (STZ)-treated mouse fibroblasts.
The plot shows top 30 enriched KEGG pathways in HFD/STZ-treated mouse fibroblasts relative to control (two-sided Wilcoxon rank-sum test, false discovery rate (FDR ≤0.05).
Figure 2 with 1 supplement
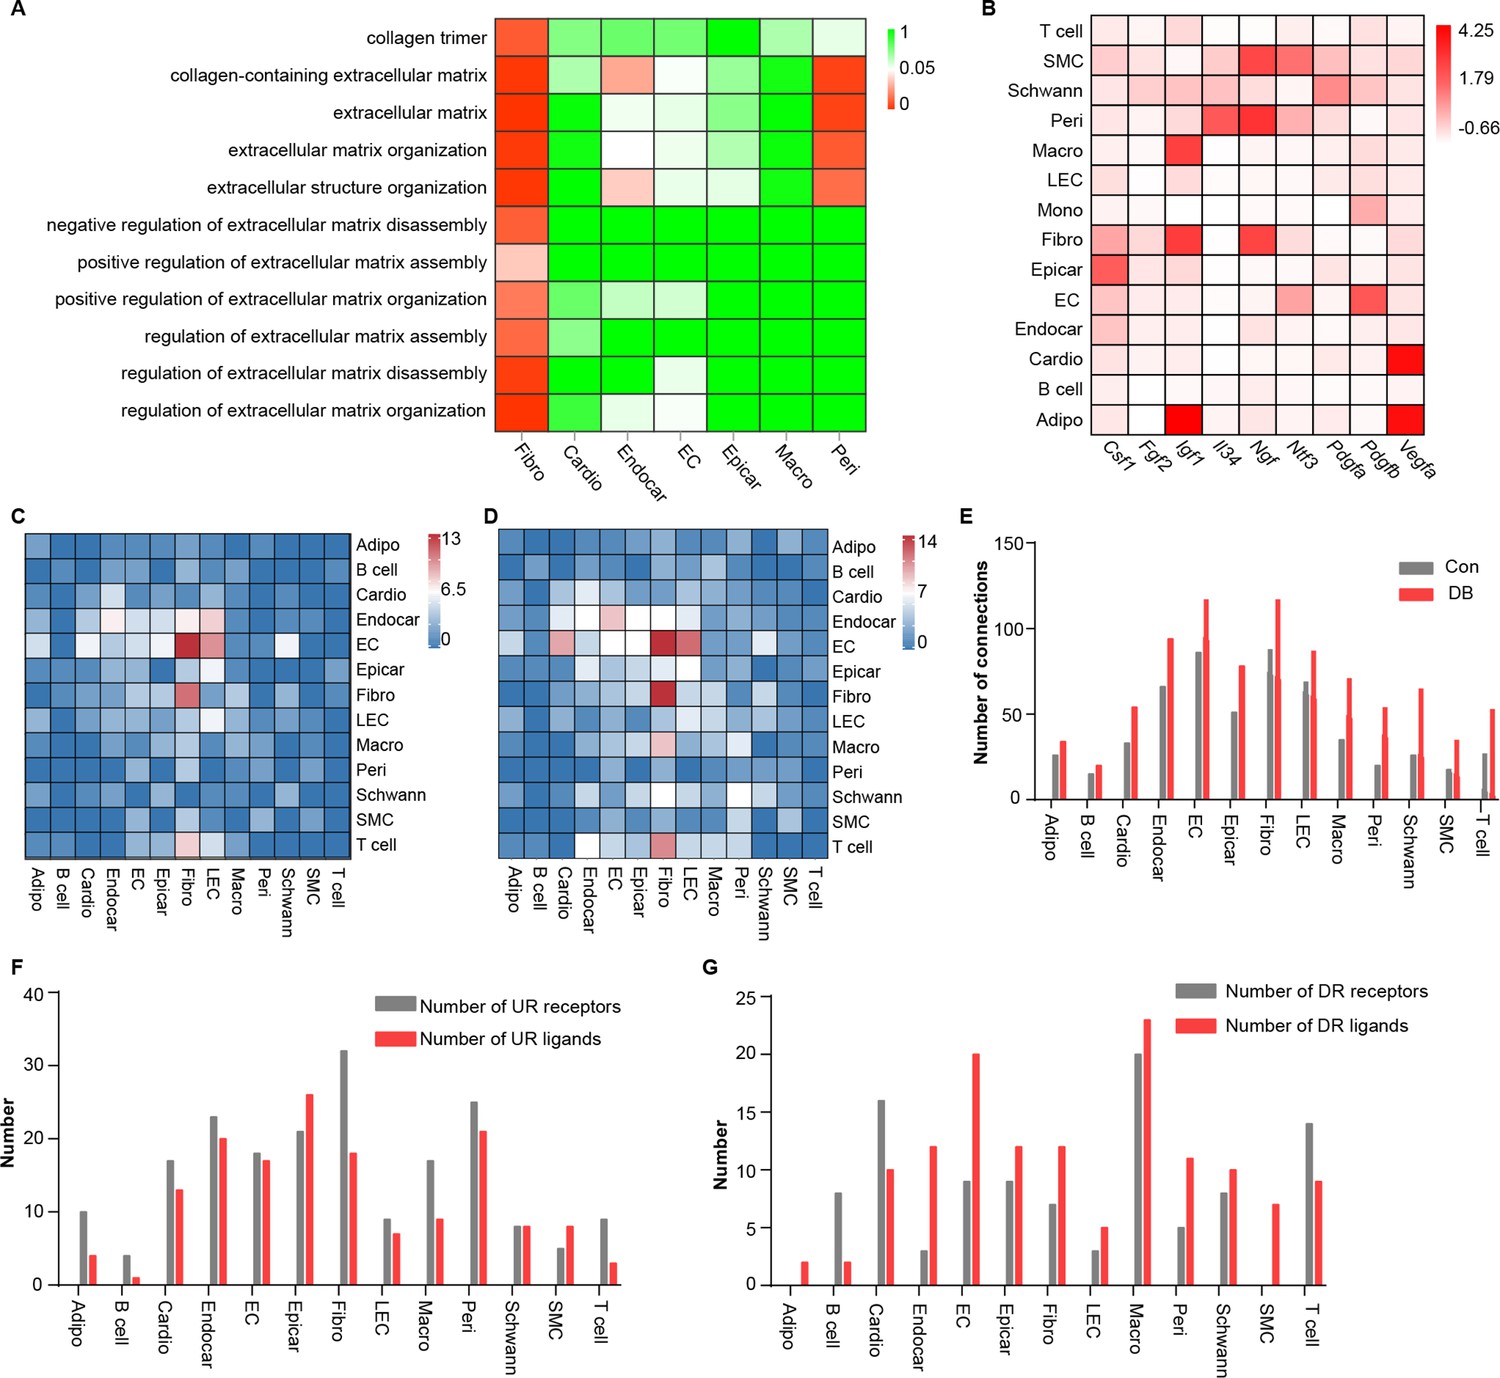
Comparison analysis of the communications between cardiac cells during high-fat diet (HFD)/streptozotocin (STZ)-induced diabetes.
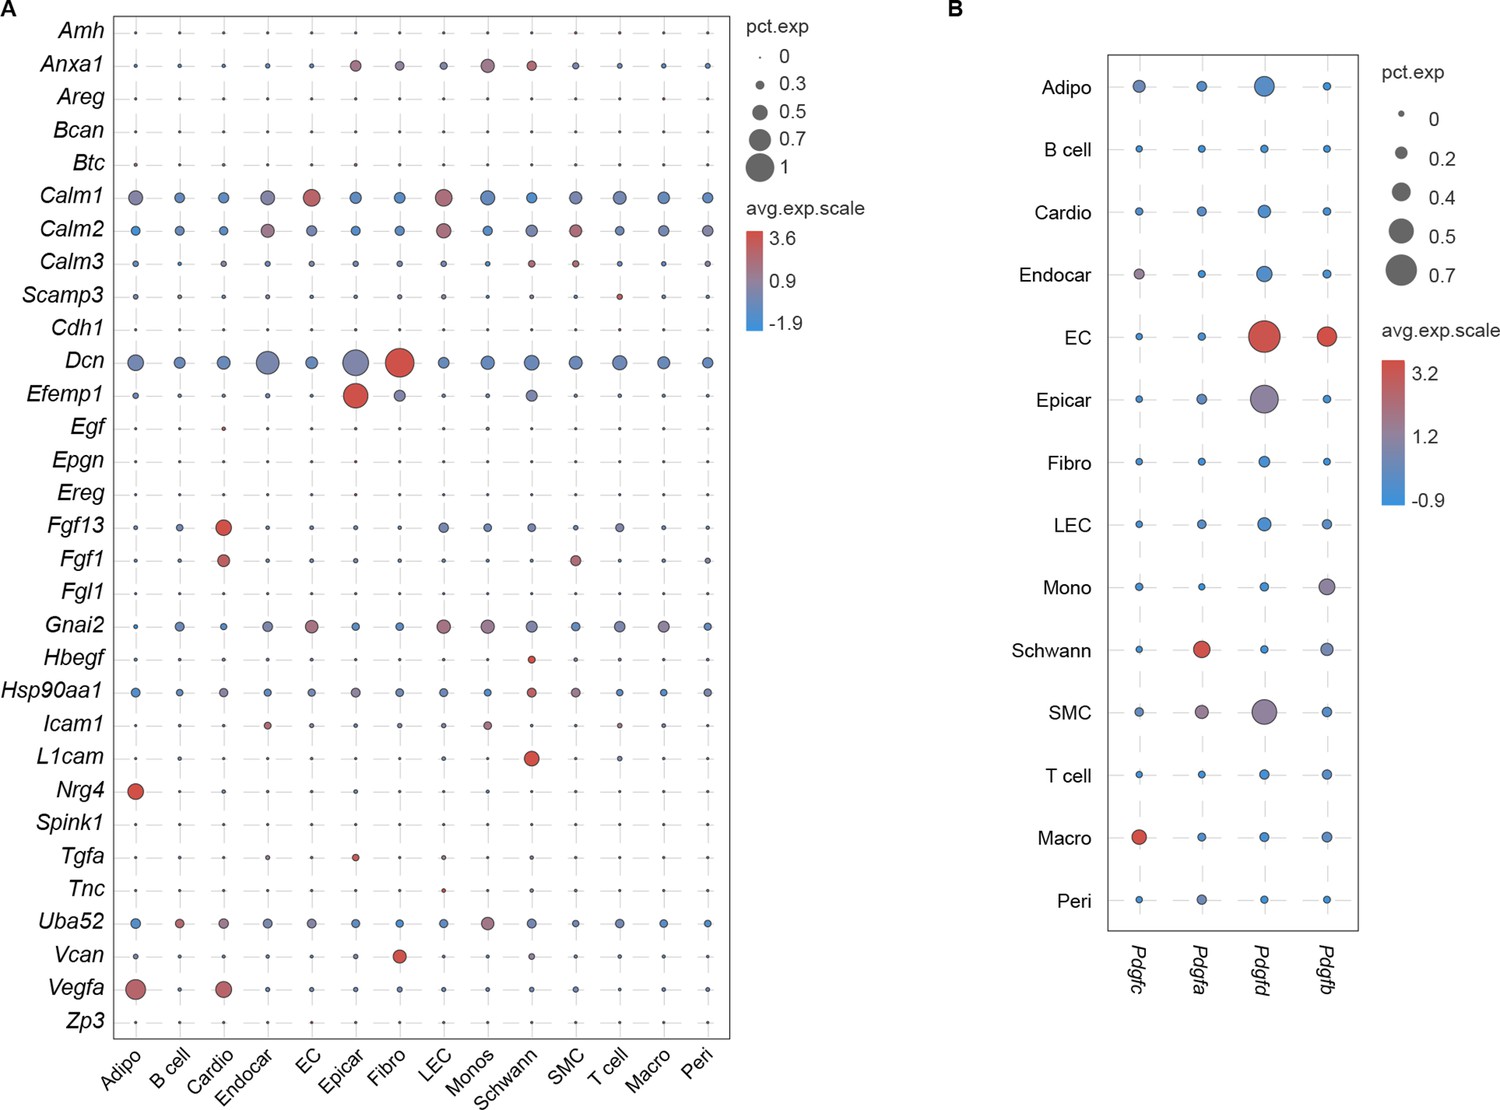
(A) Heatmap showing the enriched Gene Ontology (GO) terms associated with extracellular matrix remodeling and myocardial fibrosis in major cardiac cell populations in the diabetic group. (B) The relative expression of selected essential growth factors in the major cardiac cell types. (C) Heatmap showings the number of ligand–receptor pairs between cardiac cell populations in healthy mice. (D) Heatmap shows the number of ligand–receptor pairs between cardiac cell populations in the HFD/STZ-induced diabetic mice. (E) Bar plot shows total number of connections made by each cell type without (gray bars) and with HFD/STZ treatment (red bars). (F) Bar plot illustrates the number of upregulated receptors and ligands for each population of cardiac cells. (G) Bar plot showing the number of downregulated receptors and ligands in each cardiac cell population. DB, diabetes. The details of unique differentially expressed genes (uni-DEGs) in the cardiac populations are listed in Supplementary file 4. The details of significantly differentially expressed genes in the specific cell populations relative to others in mouse heart are listed in Supplementary file 5. Details of cell type-specific receptors in the cardiac populations and cell type-specific ligands in cardiac populations are listed in Supplementary file 6 and Supplementary file 7, respectively. The details of relative expression of a selection of essential growth factors across major cardiac cell types are listed in Supplementary file 8. The details of the number of ligand–receptor pairs between cardiac cell populations in healthy mice or diabetic mice are listed in Supplementary file 9 and Supplementary file 10, respectively. The details of significantly differentially expressed ligands and receptors in each cell population are listed in Supplementary file 11 and Supplementary file 12, respectively.
Figure 2—figure supplement 1
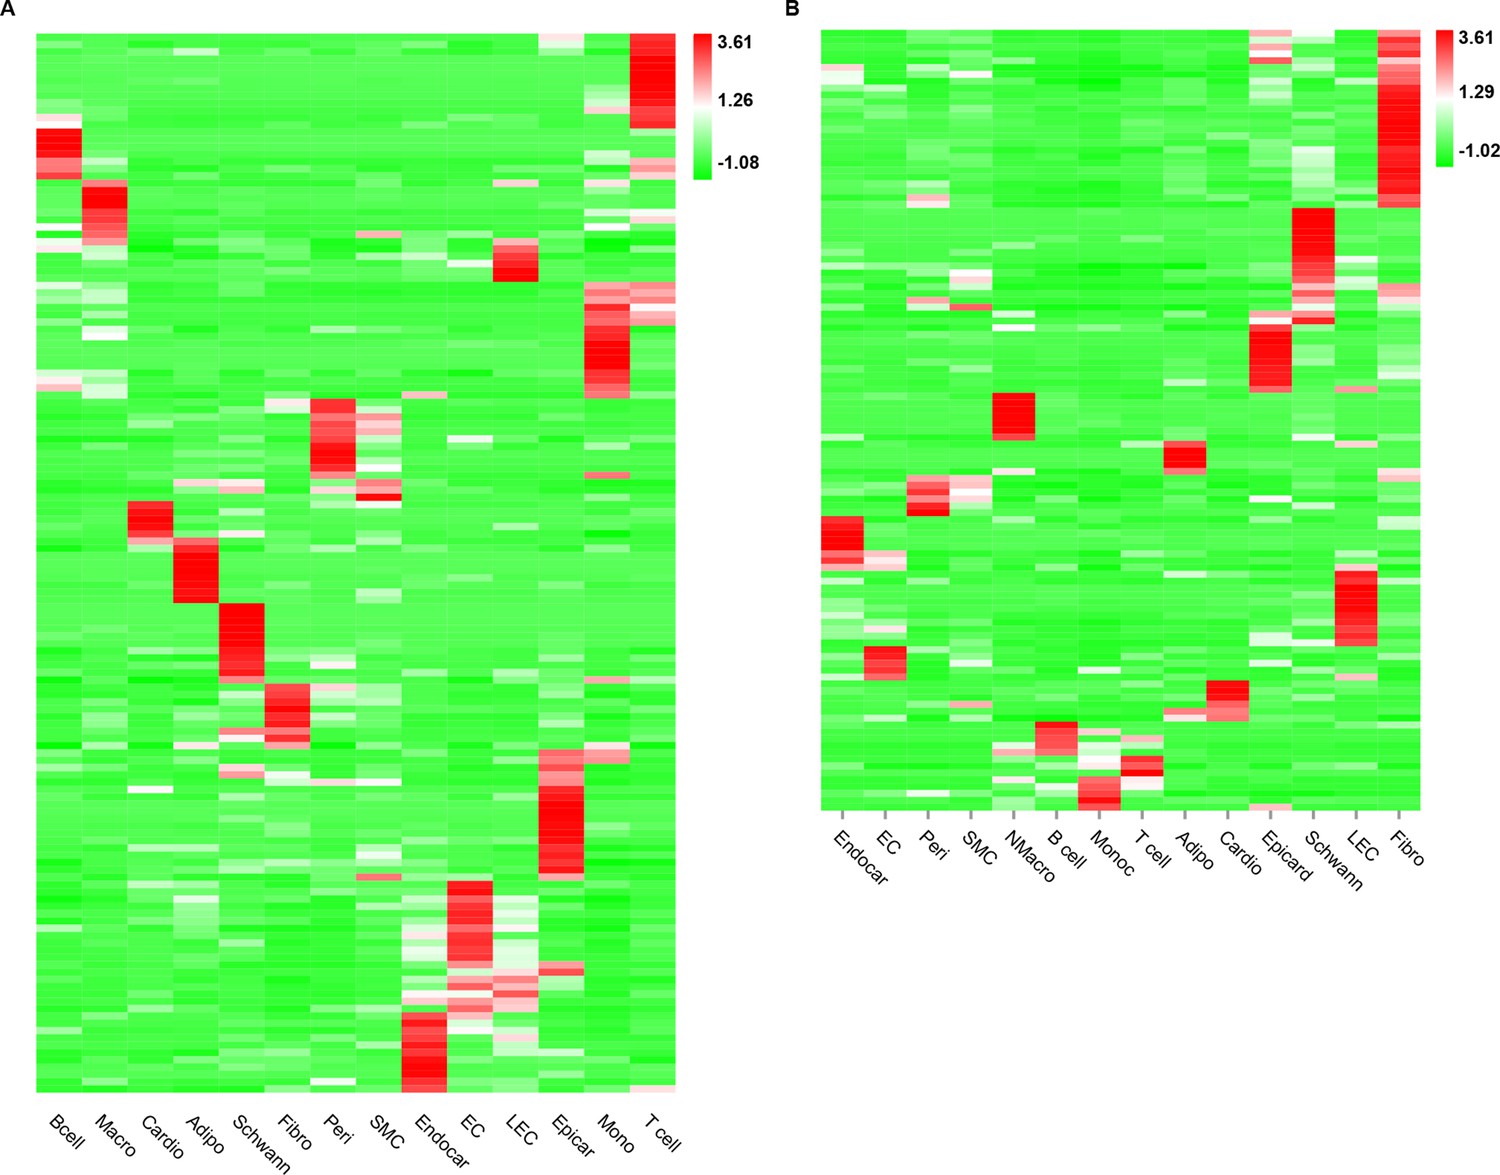
The expression of receptors and ligands across major cardiac cell types.
The heatmap shows the relative expression of receptors (A) and ligands (B) across the major cardiac cell populations (FDR ≤0.01, log2FC ≥1).
Figure 3 with 5 supplements
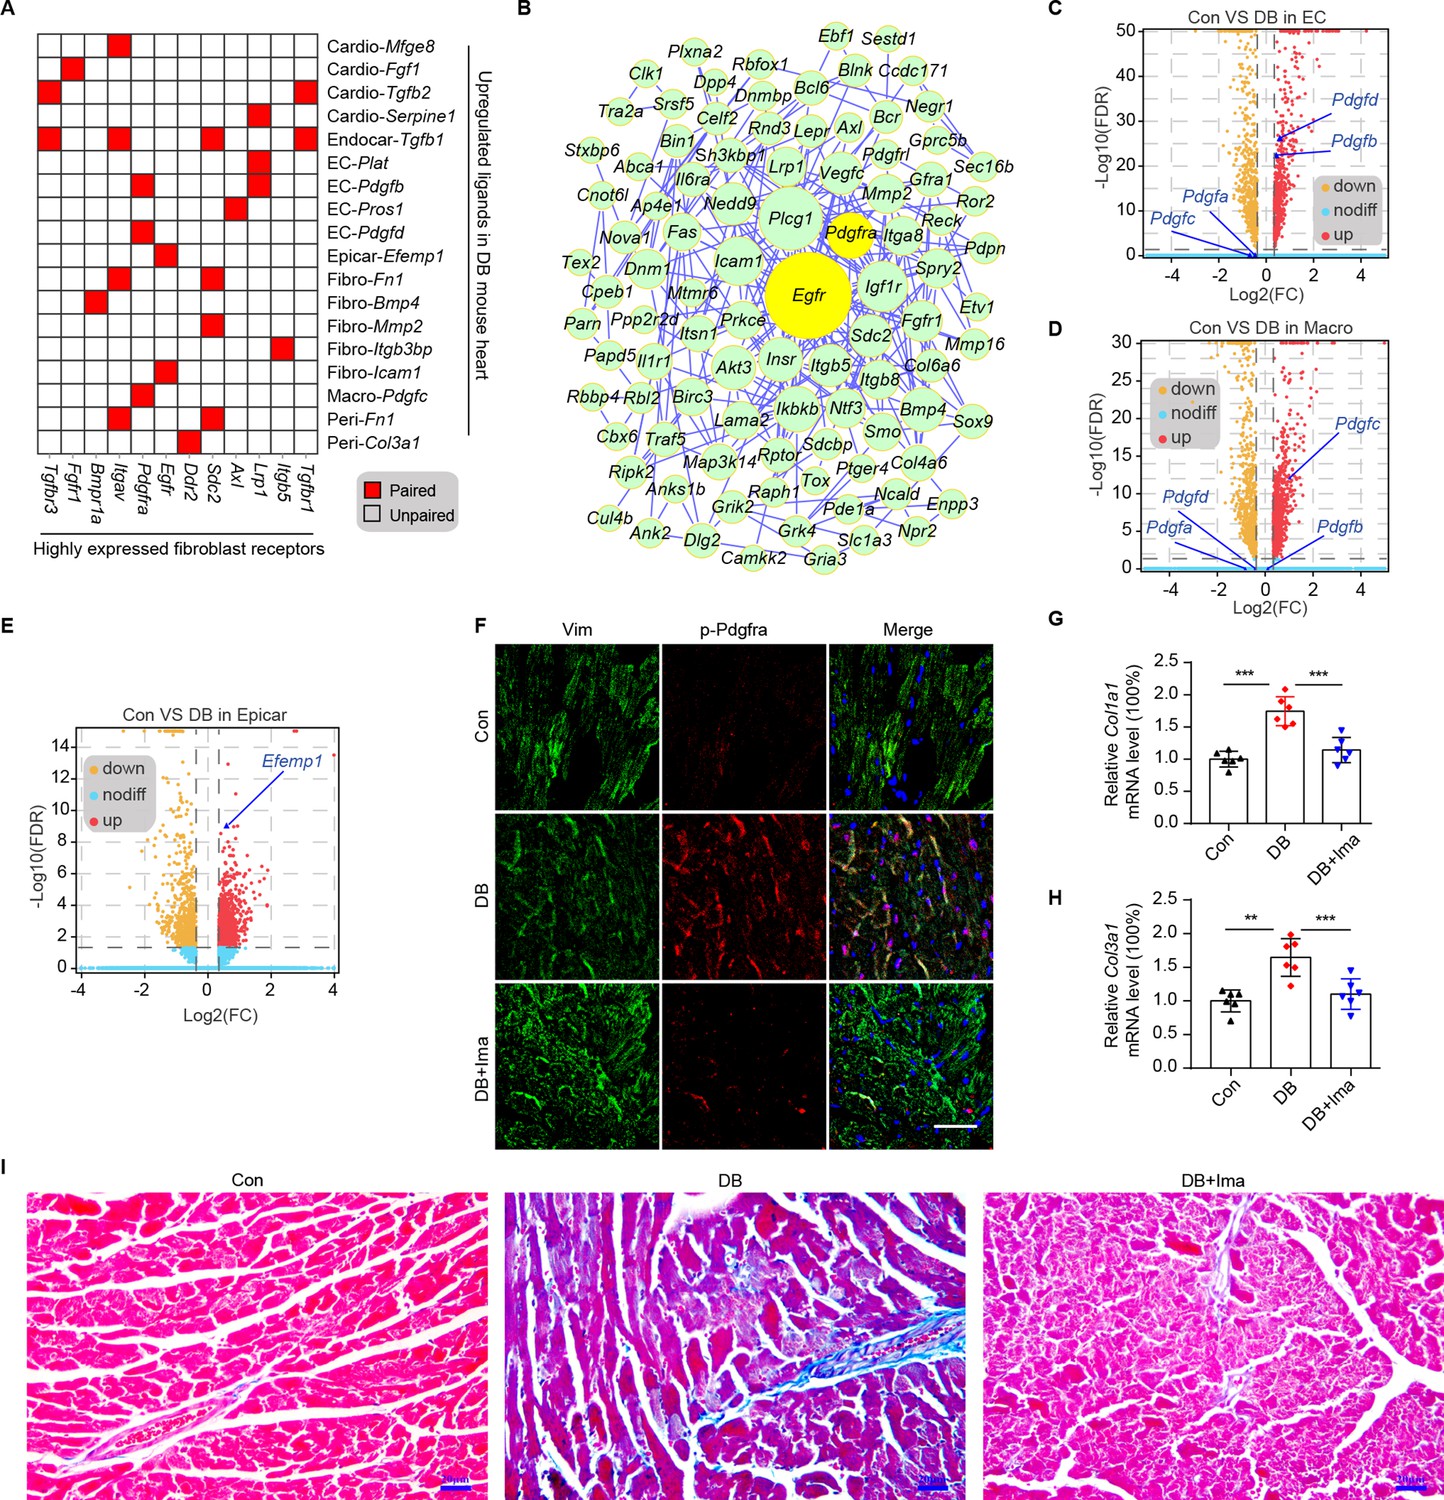
Identification of key ligand–receptor pairs associated with diabetic myocardial fibrosis in the fibroblasts.
(A) Heatmap showing the pairs of highly expressed fibroblast receptors and upregulated ligands in each cell type in the diabetic hearts. (B) PPI network showing the interactions of the upregulated genes in the fibroblasts. The circle size represents the protein node degree in the network. Volcano plots of the DEGs in the heart tissues of high-fat diet (HFD)/streptozotocin (STZ)-treated and control mice. Pdgfa, Pdgfb, Pdgfc, and Pdgfd expression in the endothelial cells (C) and macrophages (D) are highlighted. (E) Volcano plots of the DEGs in the hearts of the HFD/STZ-treated and control mice. Efemp1 expression in the epicardial cells is highlighted. (F) Representative immunofluorescence images of p-Pdgfra in the heart tissues of the HFD/STZ-treated mice with or without Ima treatment (n = 6 mice per group), scale bar = 40 µm. Bar plots showing mRNA expression of Col1a1 (G) and Col3a1 (H) in the heart tissues of the HFD/STZ-treated mice with or without Ima treatment (n = 6 mice per group; mean ± SEM; **p < 0.01; ***p < 0.001). (I) Representative images of Masson dye-stained heart sections from the groups indicated showing the extent of collagen deposition (n = 6 mice per group), scale bar = 20 µm. Ima, imatinib mesylate; SEM, standard error of mean. The details of the cognate ligands of Egfr and Pdgfra are listed in Supplementary file 13 and Supplementary file 14, respectively.
-
Figure 3—source data 1
Source data for CT values of Col1a1 used for Figure 3G.
- https://cdn.elifesciences.org/articles/80479/elife-80479-fig3-data1-v2.xlsx
-
Figure 3—source data 2
Source data for CT values of Col3a1 used for Figure 3H.
- https://cdn.elifesciences.org/articles/80479/elife-80479-fig3-data2-v2.xlsx
Figure 3—figure supplement 1
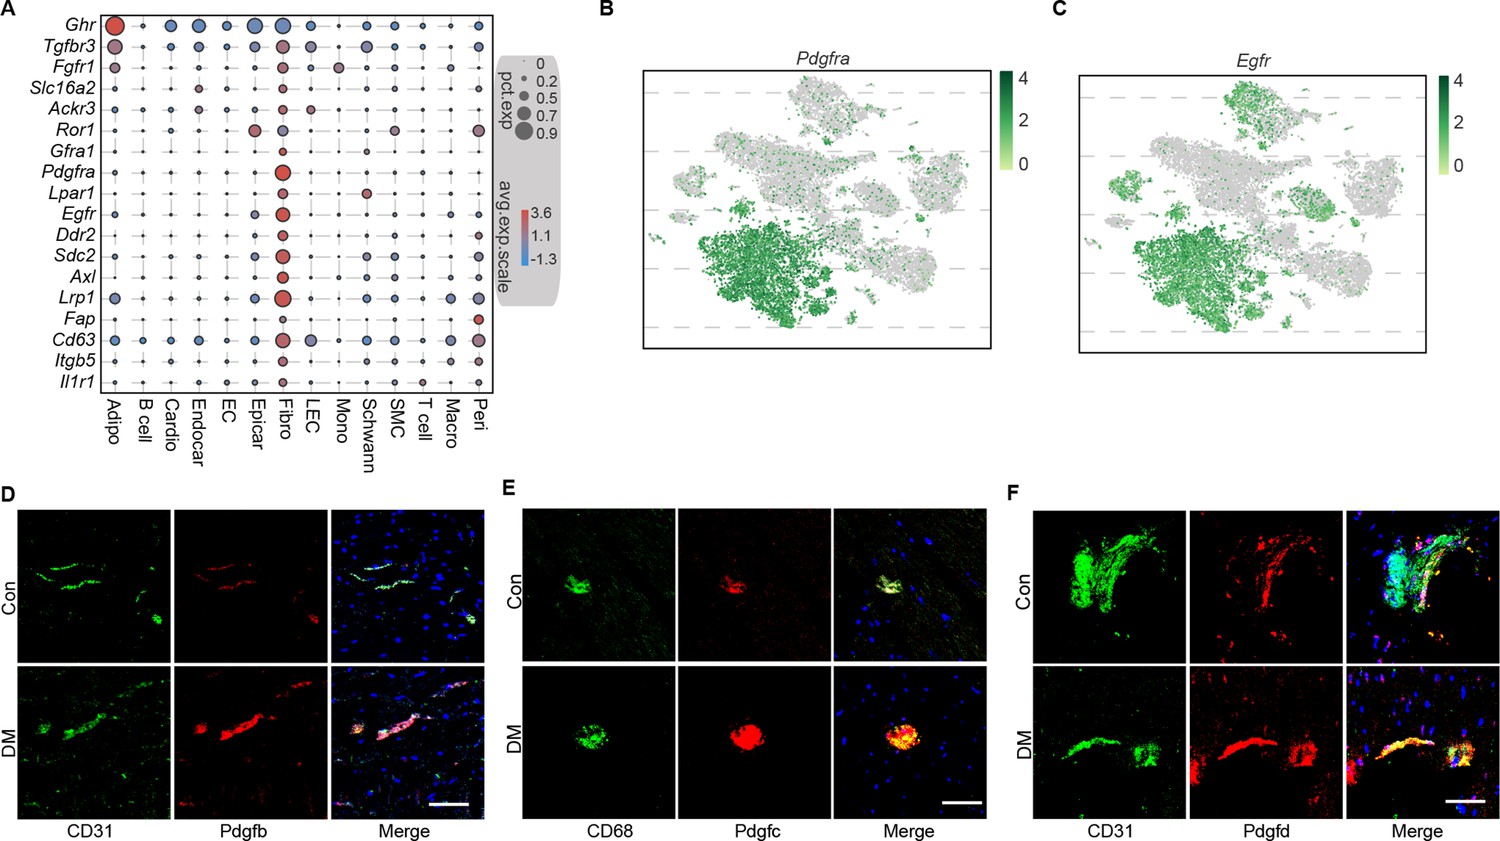
Identification of key ligand–receptor pairs associated with diabetic myocardial fibrosis in the fibroblasts.
(A) Dot plot showing the high expression of specific receptors in the cardiac cell populations. The circle size indicates the proportion of cells within the groups that express each transcript. The red and blue dots indicate up- and downregulated genes, respectively. Two-dimensional t-SNE projection of Pdgfra (B) and Egfr (C) expression in the cardiac cell populations. Green and gray colors indicate up- and downregulated genes, respectively. Representative immunofluorescence images of Pdgfb (D) and Pdgfc (E) in the CD31+ cells, and Pdgfd (F) in the CD68+ cells in the heart tissues of high-fat diet (HFD)/streptozotocin (STZ)-treated and control mice (n = 6 mice per group), scale bar = 100 µm.
Figure 3—figure supplement 2
The cognate ligands of Egfr in each cardiac cell population.
(A) Dot plot showing the cognate ligands of Egfr in each cardiac cell population. (B) Dot plot showing the cognate ligands of Pdgfra in each cardiac cell population. The circle size indicates the proportion of cells within groups that express each transcript. The red and blue dots indicate up- and downregulated genes, respectively.
Figure 3—figure supplement 3
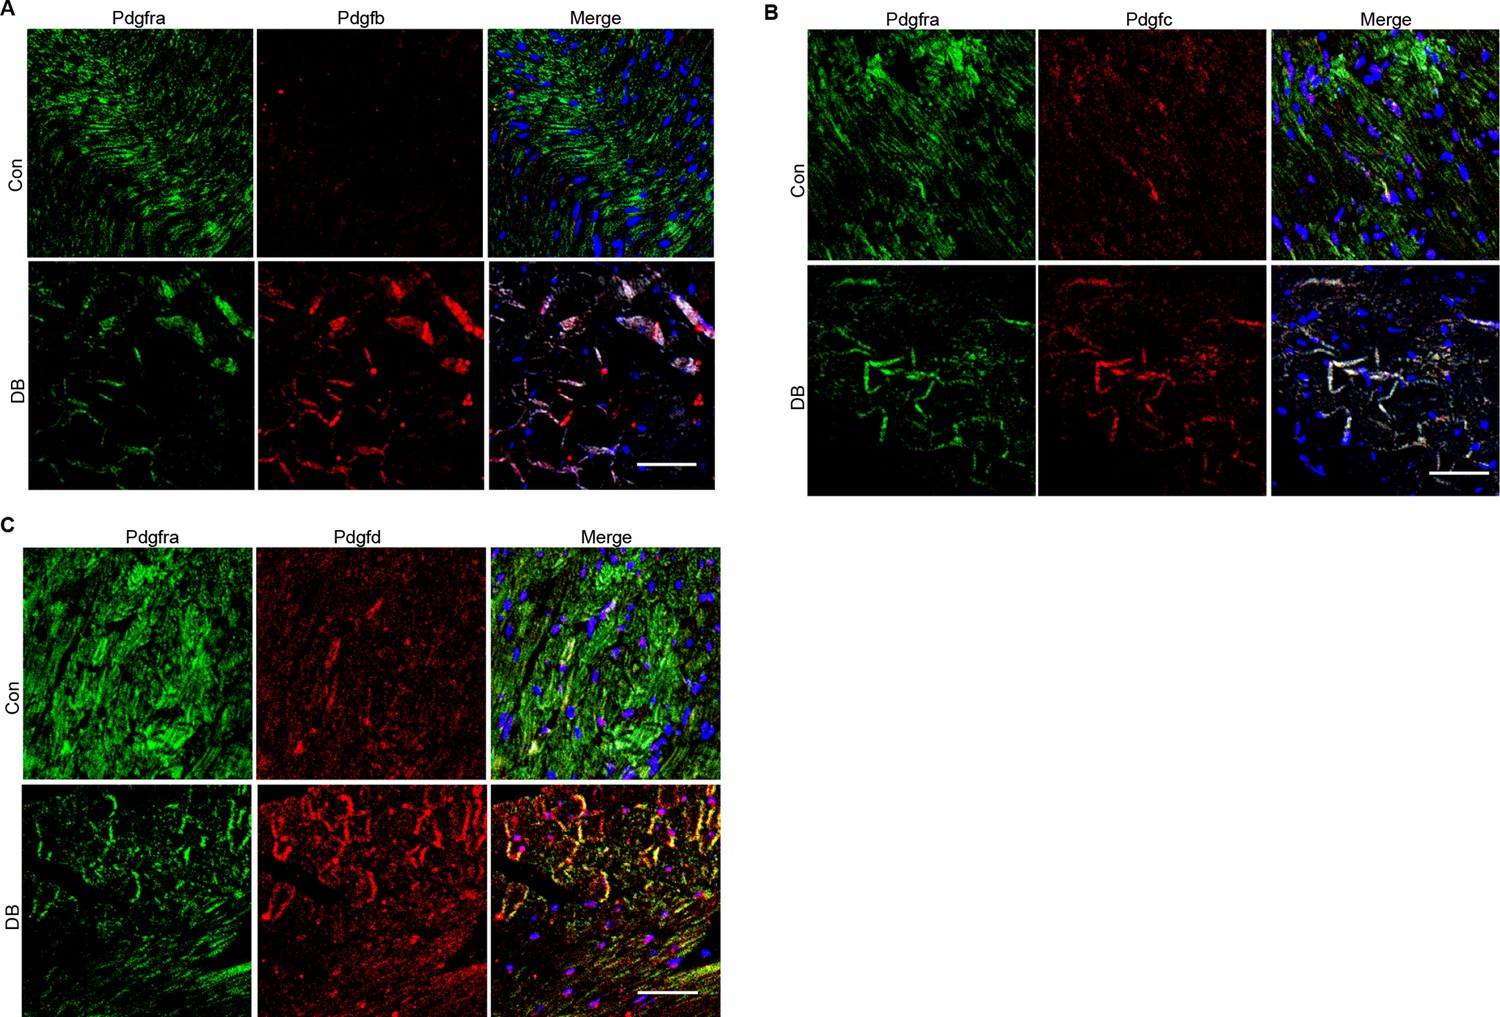
Immunofluorescence results of Pdgfb, Pdgfc, and Pdgfd in the Pdgfra+ cells.
Representative immunofluorescence images for Pdgfb (A), Pdgfc (B), and Pdgfd (C) in Pdgfra+ cells in the heart tissues of high-fat diet (HFD)/streptozotocin (STZ)-treated and control groups (n = 6 mice per group), scale bar = 40 µm.
Figure 3—figure supplement 4
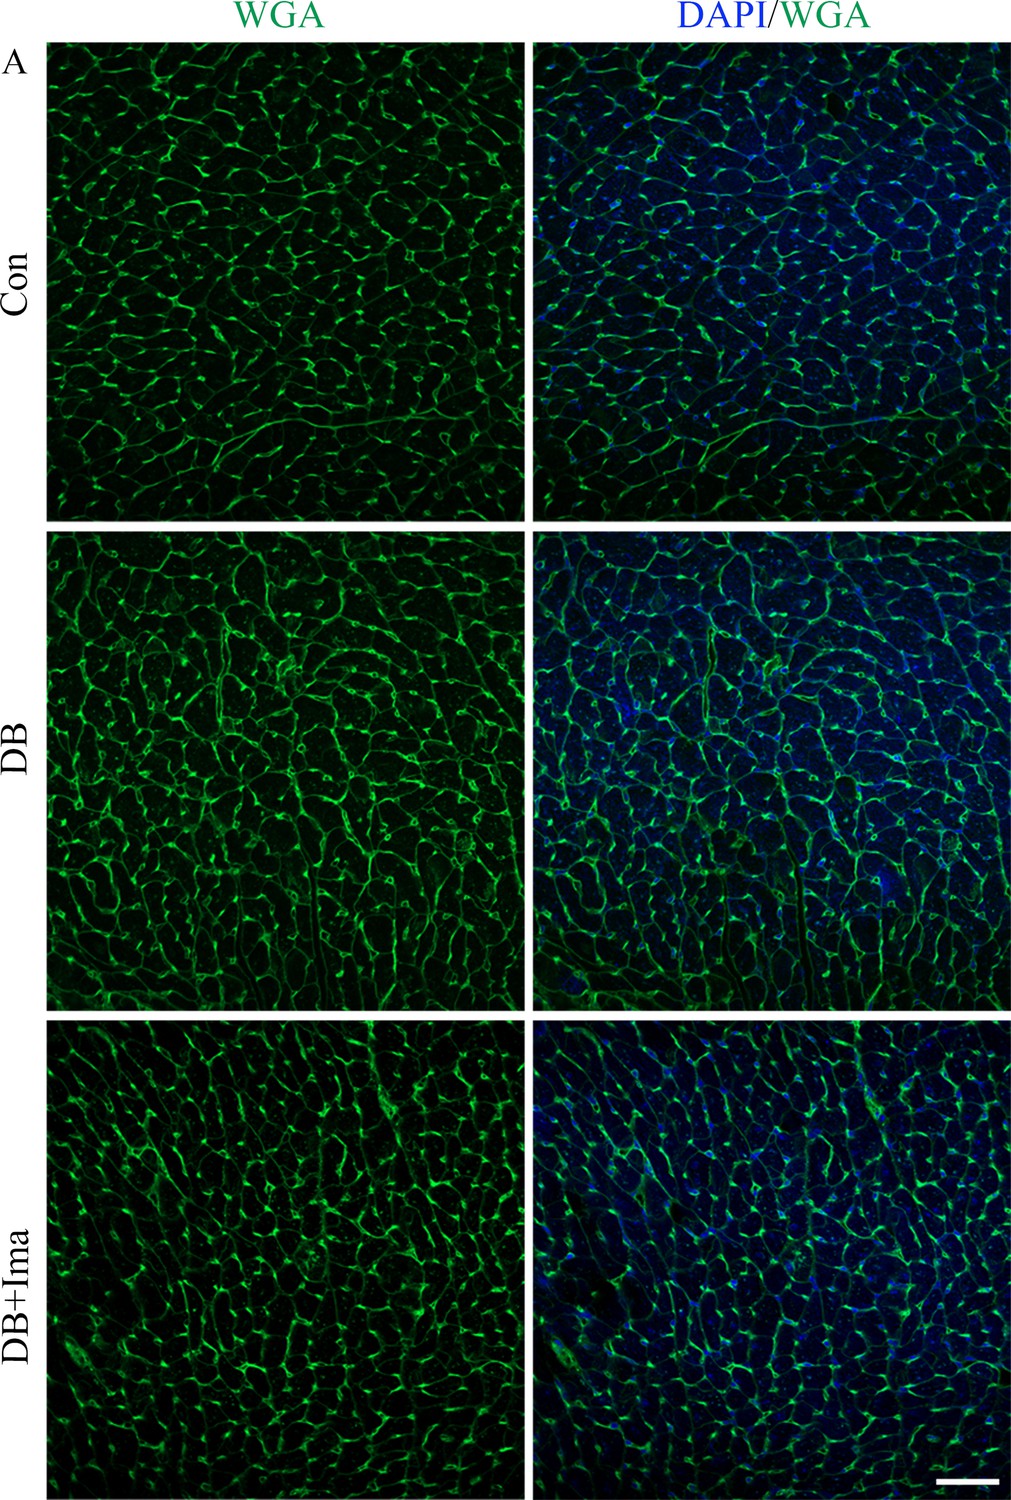
Assessment of myocardial hypertrophy using by WGA staining.
(A) Representative heart WGA staining using tissues from high-fat diet (HFD)/streptozotocin (STZ)-treated mice with or without Ima treatment (n = 6 mice per group), scale bar = 50 µm.
Figure 3—figure supplement 5
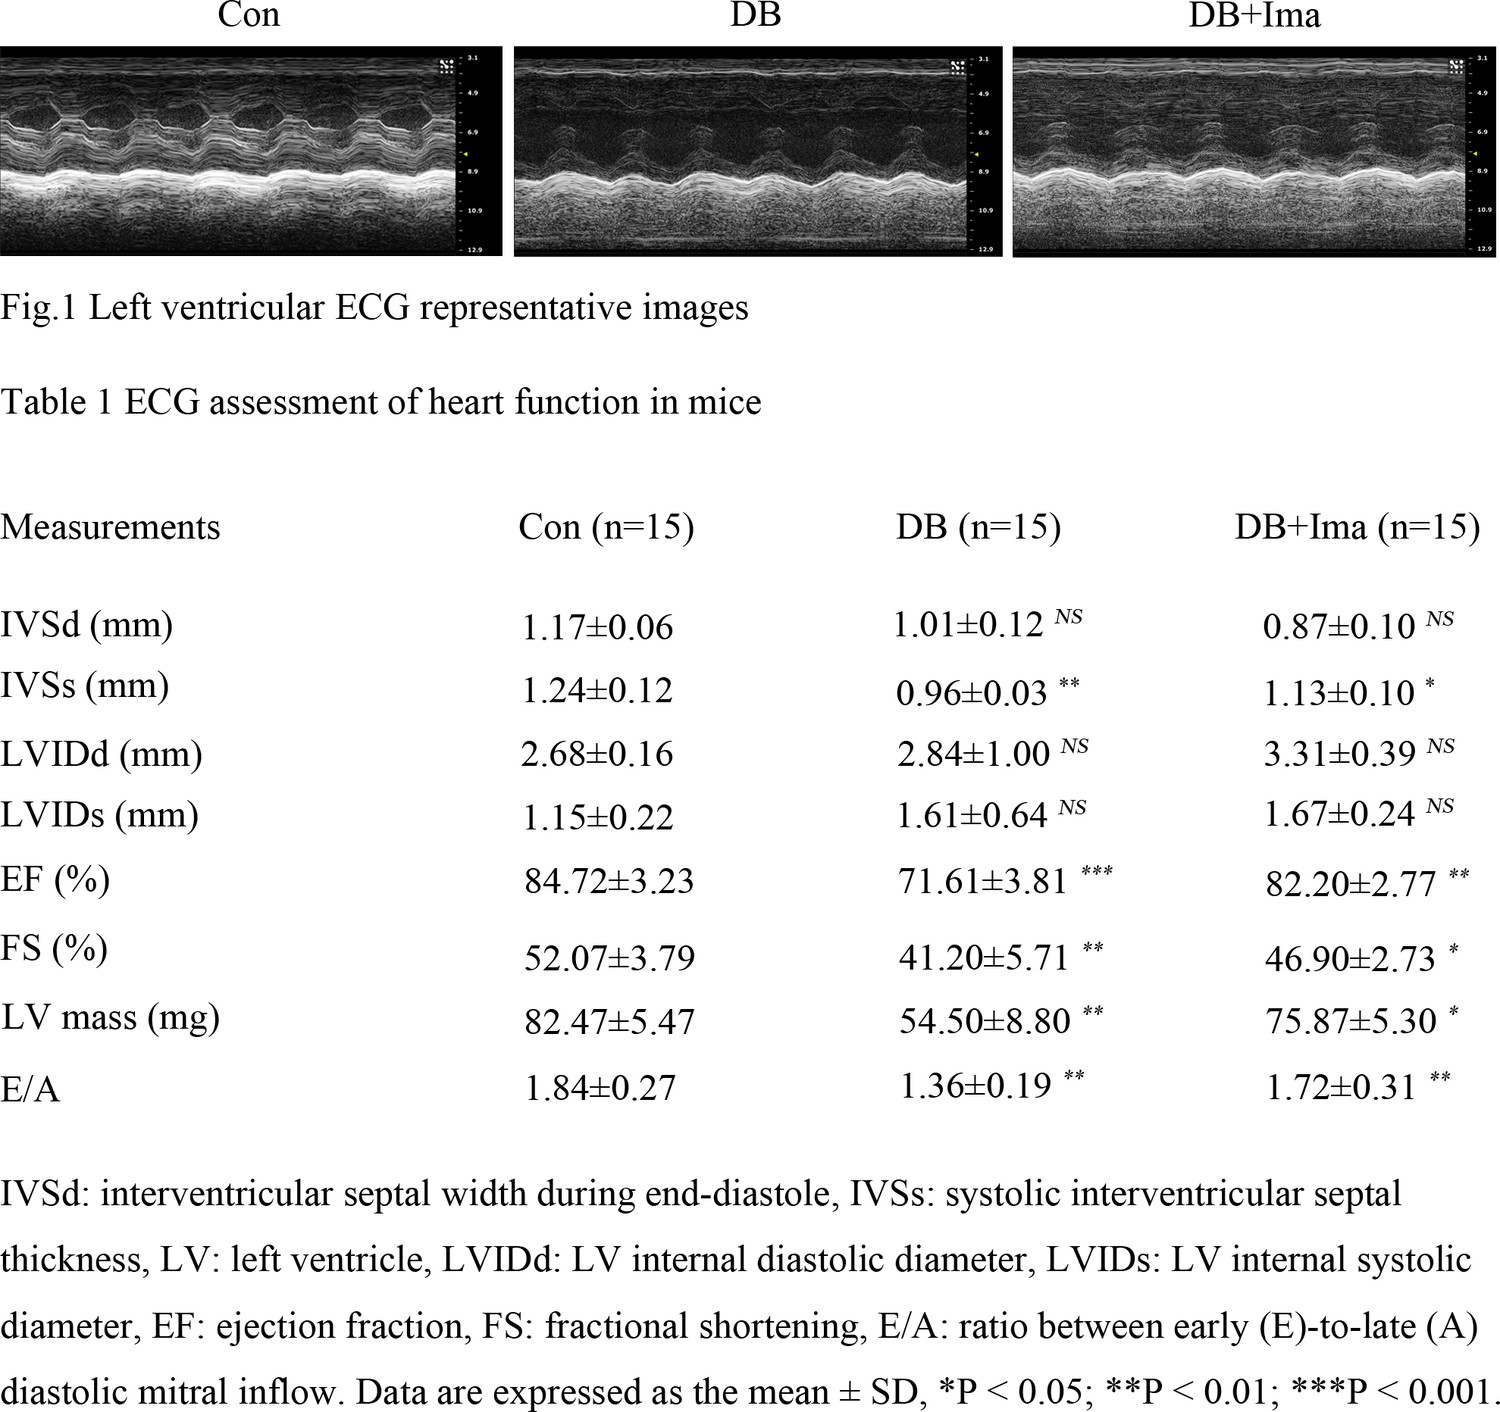
Echocardiographic evaluation of mice heart function.
(Figure 1) Left ventricular ECG representative images of the control, diabetic and Ima treatment mice. (Table 1) ECG assessment of heart function in each different group.
-
Figure 3—figure supplement 5—source data 1
Source data files are provided to support Table 1 in Figure 3—figure supplement 5.
- https://cdn.elifesciences.org/articles/80479/elife-80479-fig3-figsupp5-data1-v2.xlsx
Figure 4
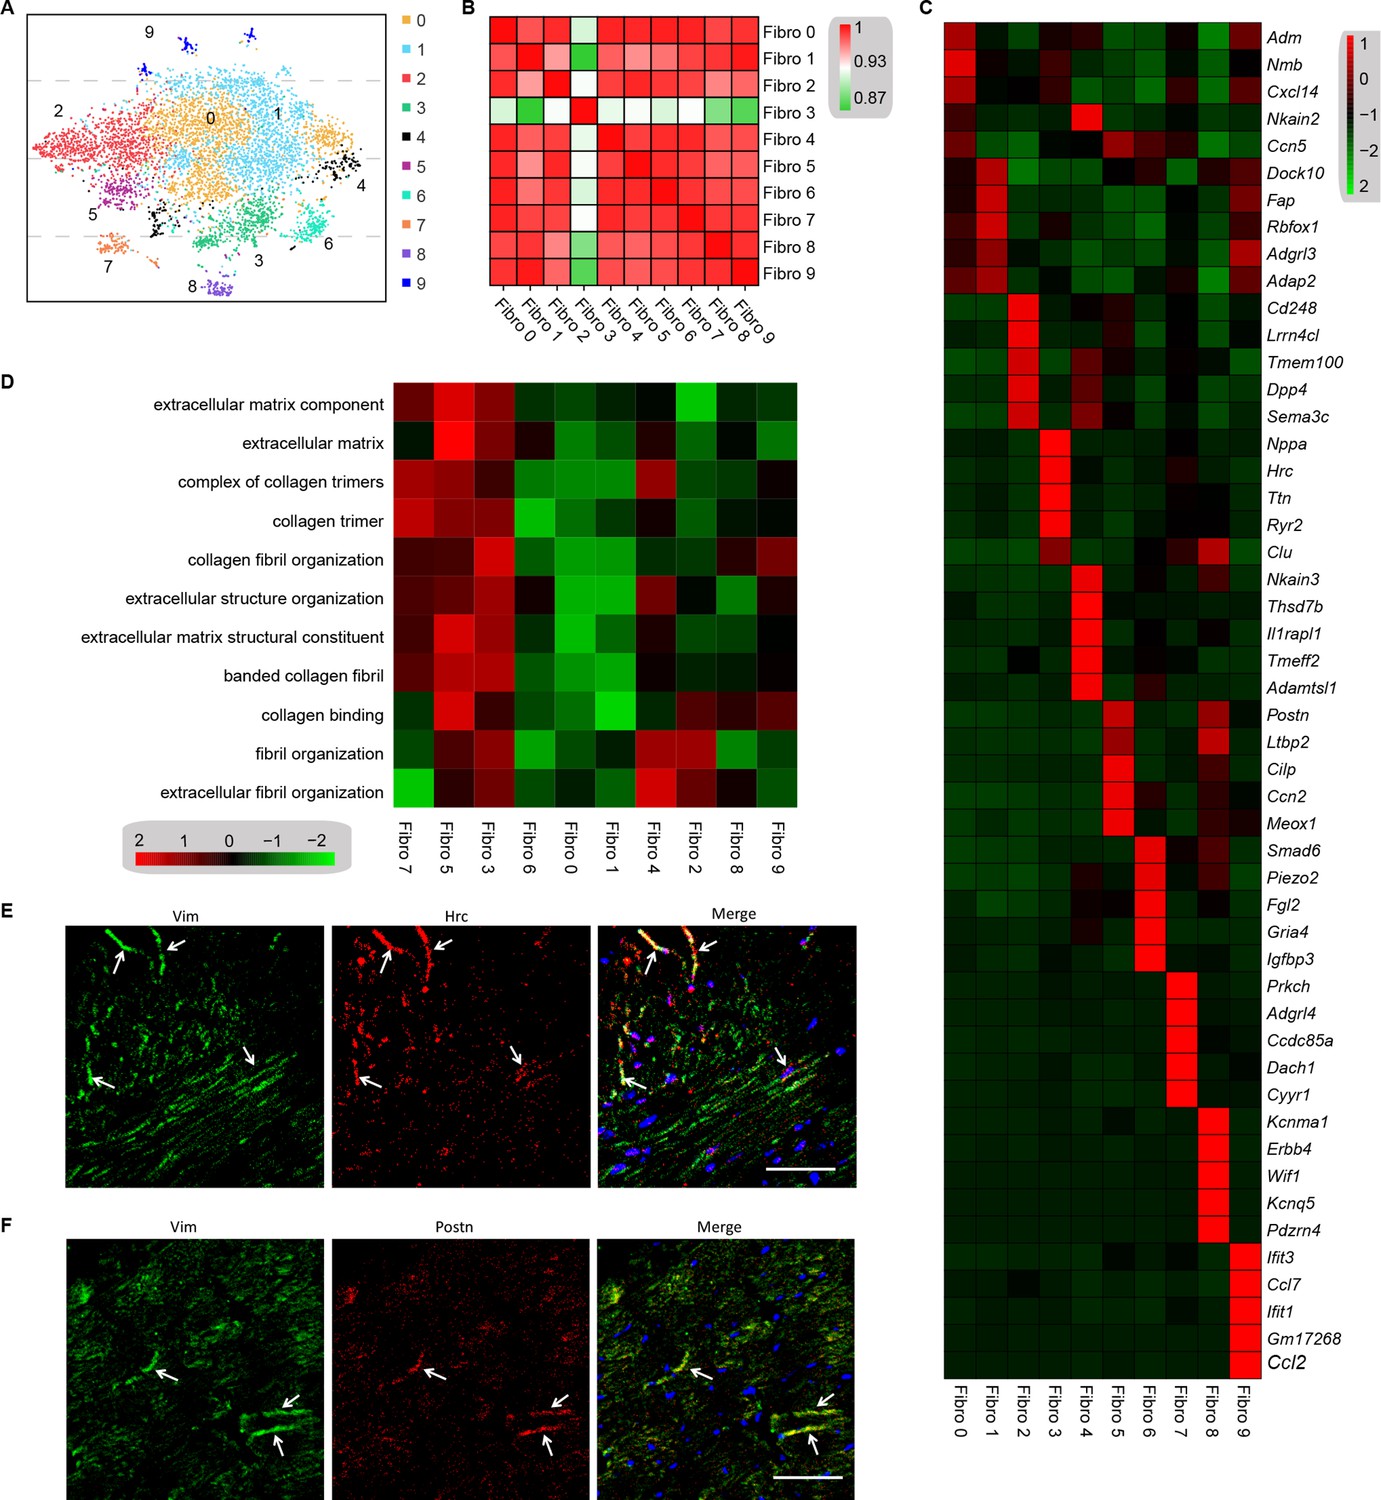
Analysis of the heterogeneity of the fibroblast subpopulations.
(A) t-SNE plot of the 10 cardiac fibroblast subpopulations in the high-fat diet (HFD)/streptozotocin (STZ)-treated and control mice (n = 3428 fibroblasts from healthy control and n = 2988 fibroblasts from 6 diabetic mice). (B) Correlation heatmap of the gene-expression signatures of each fibroblast subpopulation. Color differences indicate subpopulations that were resolved through multiscale bootstrapping. (C) Heatmap showing the top 5 marker genes in each fibroblast subpopulation. The red color indicates high expression, while green color indicates low expression. (D) Heatmap showing the enriched Gene Ontology (GO) terms associated with cardiac fibrosis in each fibroblast population. (E, F) Representative immunofluorescence images of Hrc (E) and Postn (F) in mouse heart (n = 6 mice per group), scale bar = 100 µm. The details of the 10 transcriptionally distinct fibroblast subpopulations are listed in Supplementary file 15. The details of distinct signatures of each fibroblast subpopulation in the heart are listed in Supplementary file 16.
Figure 5
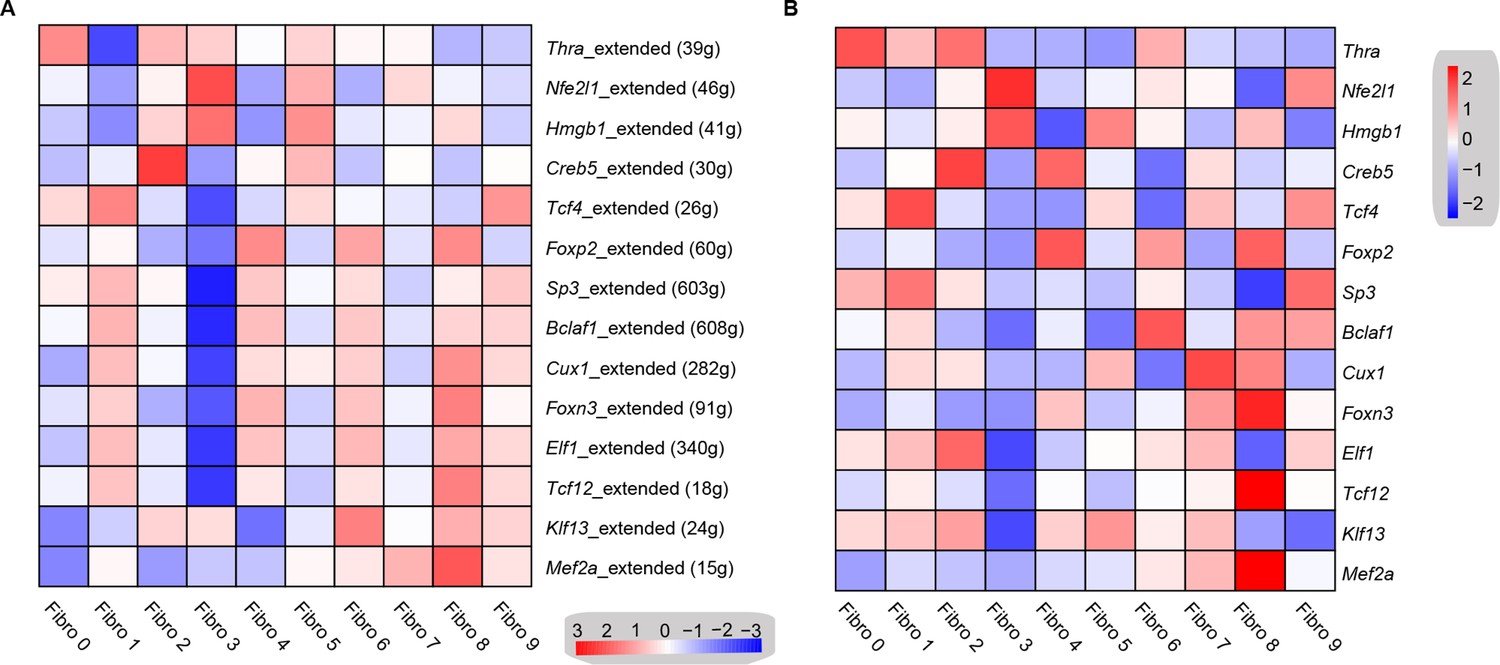
Transcription factor network analysis of fibroblast subpopulations.
(A) Heatmap shows the inferred transcription factor gene-regulatory networks. Numbers between brackets indicate the (extended) regulons for respective transcription factors. (B) Heatmap shows the expression level of transcription factors in (A). The details of transcription factor gene-regulatory networks in the distinct subpopulations are listed in Supplementary file 17. The details of the transcription factors expression are listed in Supplementary file 18.
Figure 6 with 2 supplements
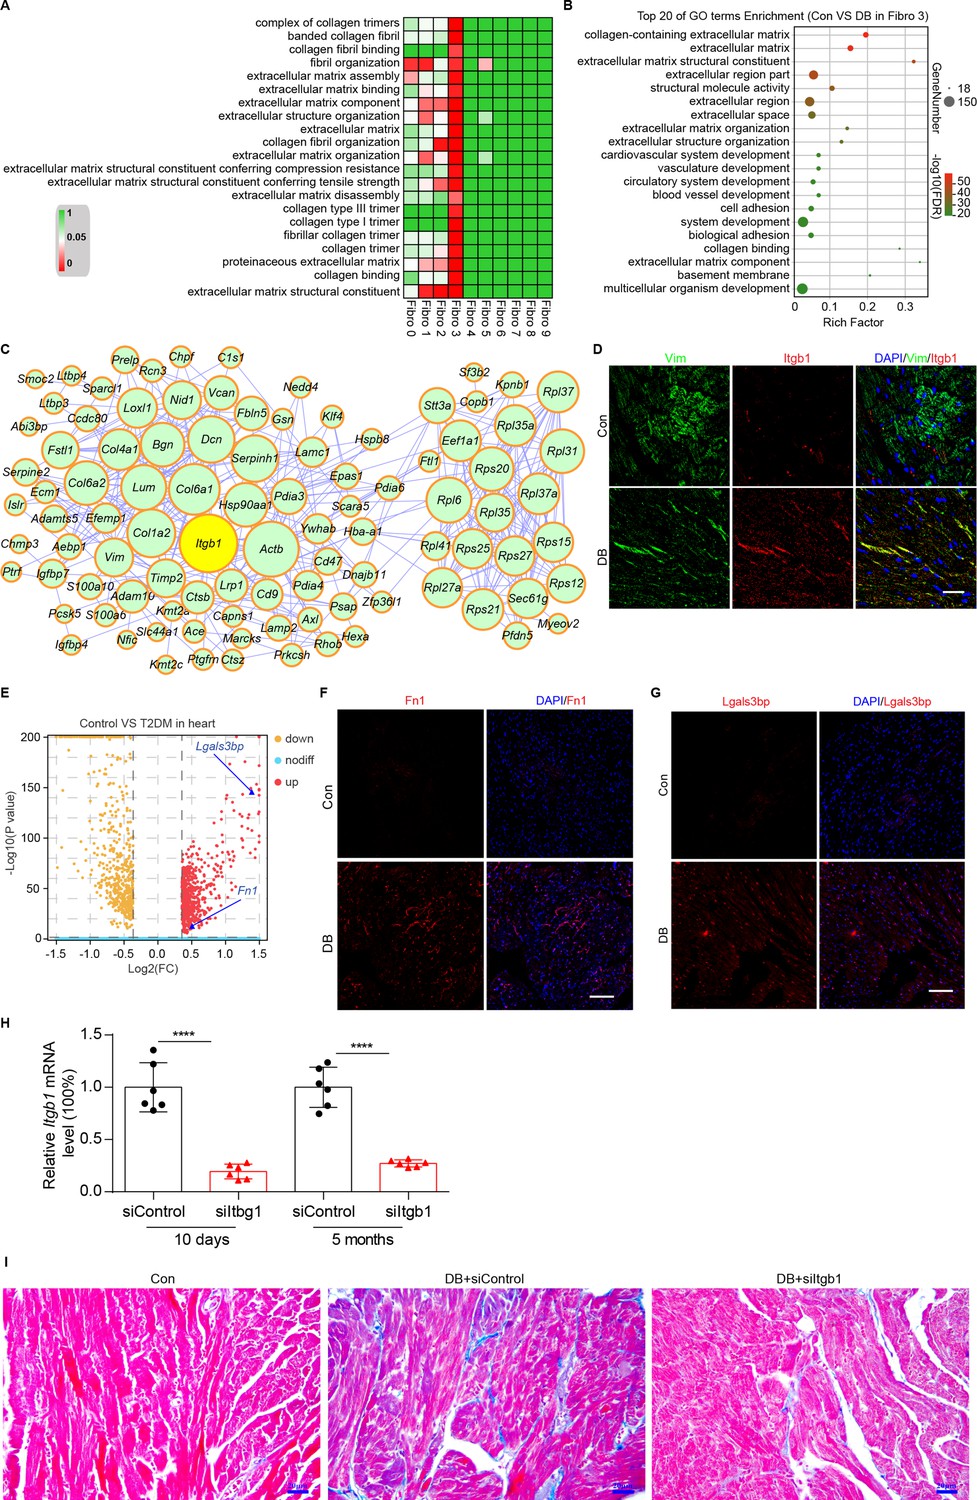
Identification of intercellular communication drivers of myocardial fibrosis in the Hrchi fibroblasts.
(A) Heatmap showing high-fat diet (HFD)/streptozotocin (STZ)-induced enrichment of Gene Ontology (GO) terms associated with extracellular matrix remodeling and myocardial fibrosis in each subpopulation of cardiac fibroblasts. (B) Dot plot of the GO analysis showing the top 20 terms with the highest enrichment in the Hrchi fibroblasts of the HFD/STZ-treated mice relative to controls. (C) PPI network showing the interactions of the upregulated genes in the Hrchi fibroblasts of diabetic mice relative to controls. The circle size represents the protein node degree in the network. (D) Representative immunofluorescence images of Itgb1 in the heart of SHH-fed or control mice (n = 6 mice per group). scale bar = 40 µm. (E) Volcano plots showing the DEGs in the heart tissues of the HFD/STZ-treated or control mice with Fn1 and Lgals3bp highlighted. Representative immunofluorescence images for Fn1 (F) and Lgals3bp (G) in the mouse heart (n = 6 mice per group), scale bar = 100 µm. (H) The efficiency of siRNA-mediated Itgb1 mRNA knockdown was confirmed by qRT–PCR (n = 6 mice per group, mean ± standard error of mean [SEM], ****p < 0.0001). (I) Representative images of Masson dye-stained heart sections from the indicated groups showing extent of collagen deposition (n = 6 mice per group), scale bar = 20 µm. Detailed genes of significant transcriptomic changes in each fibroblast subpopulation are listed in Supplementary file 19. The details of unique differentially expressed genes (uni-DEGs) in each fibroblast subpopulation are listed in Supplementary file 20. The details of the cognate ligands of Itgb1 are listed in Supplementary file 21.
-
Figure 6—source data 1
Source data for CT values of Itgb1 used for Figure 6H.
- https://cdn.elifesciences.org/articles/80479/elife-80479-fig6-data1-v2.xlsx
-
Figure 6—source data 2
Source data for CT values of Itgb1 used for Figure 6H.
- https://cdn.elifesciences.org/articles/80479/elife-80479-fig6-data2-v2.xlsx
Figure 6—figure supplement 1
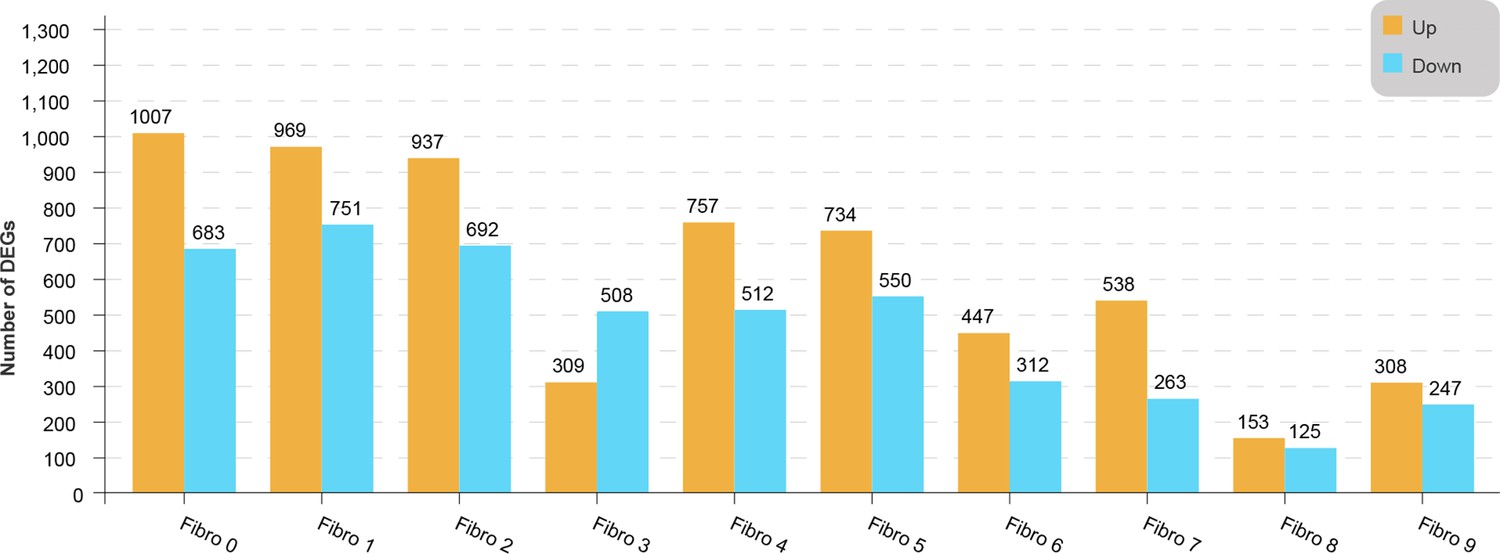
Up- and downregulated genes in each fibroblast subpopulation of diabetic mice, compared with the control mice.
Lollipop plot shows the up- and downregulated genes in each fibroblast subpopulation of diabetic mice, compared with the control mice (two-sided Wilcoxon rank-sum test, FDR ≤0.05, log2FC ≥0.36).
Figure 6—figure supplement 2
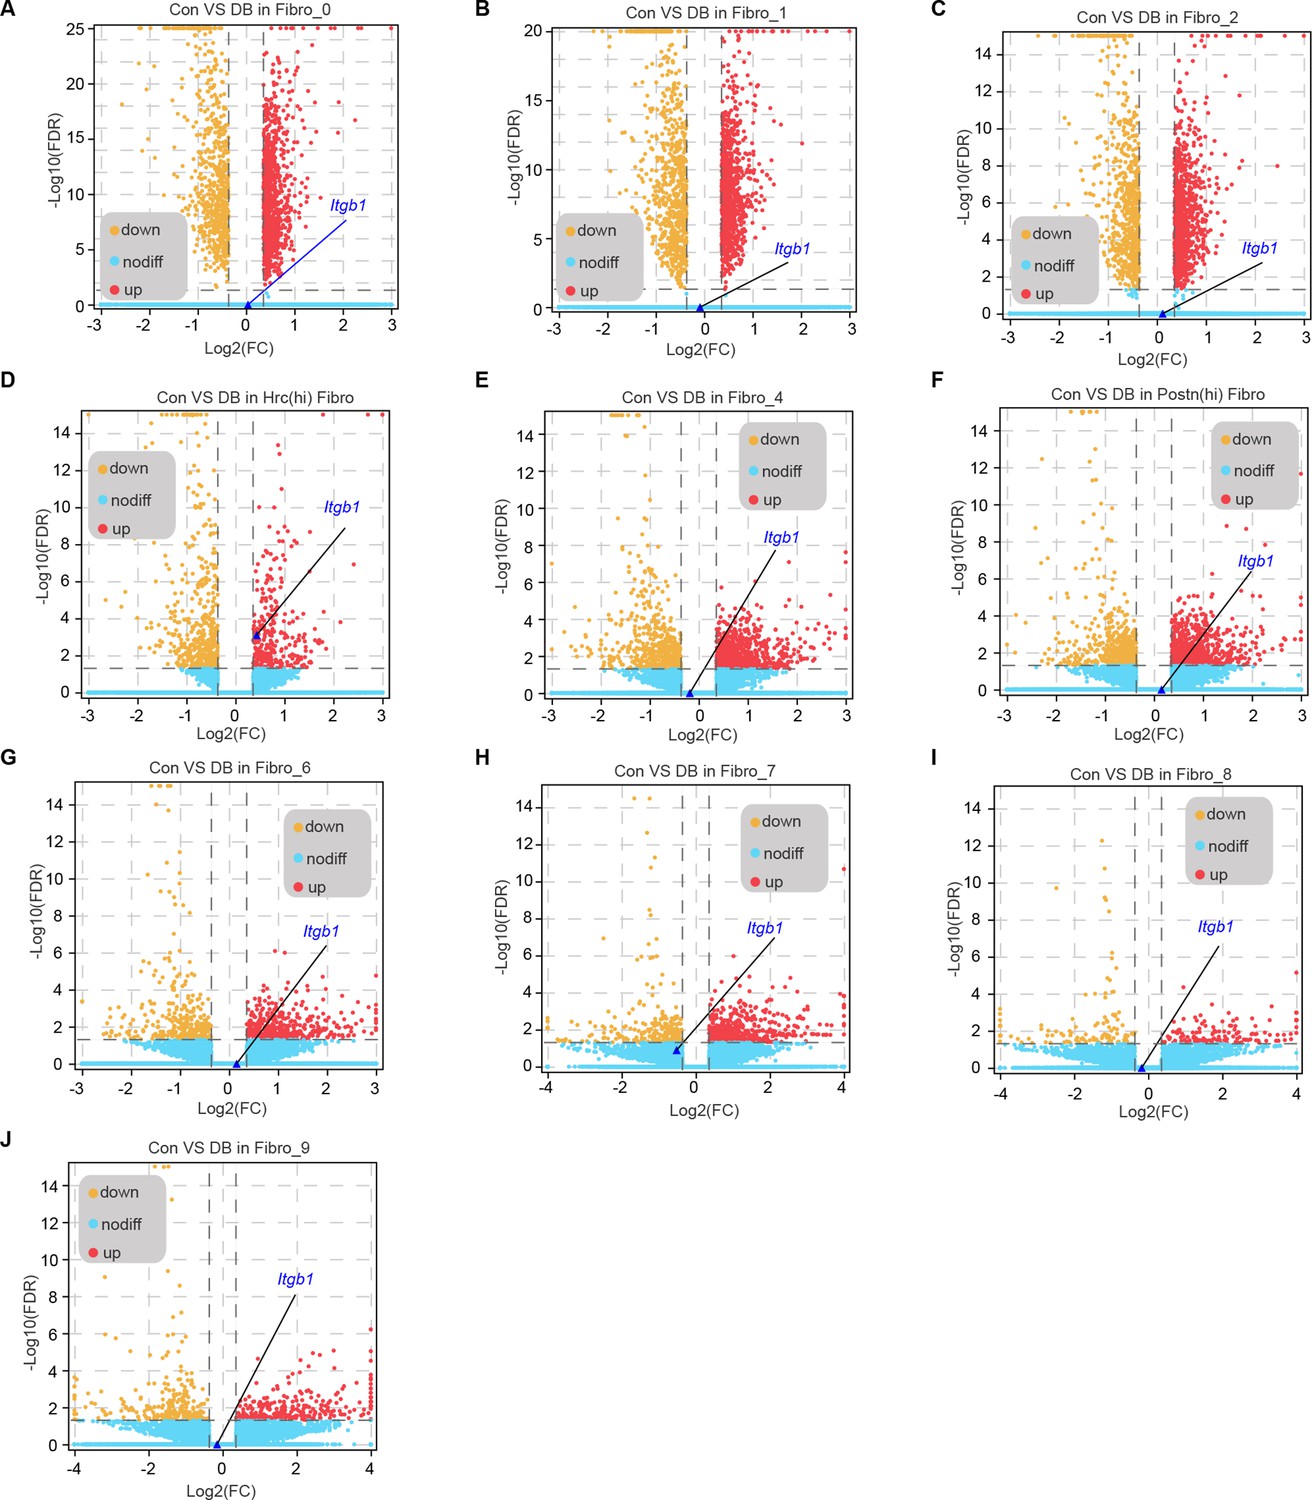
DEGs in each cardiac fibroblast subpopulation from high-fat diet (HFD)/streptozotocin (STZ)-treated or control mice with Itgb1 highlighted.
Volcano plots showing the DEGs in each cardiac fibroblast subpopulation (A-J indicated Fibro_0 to Fibro_9 fibrobalst subcluster) of the HFD/STZ-treated or control mice with Itgb1 highlighted.
Figure 7 with 1 supplement

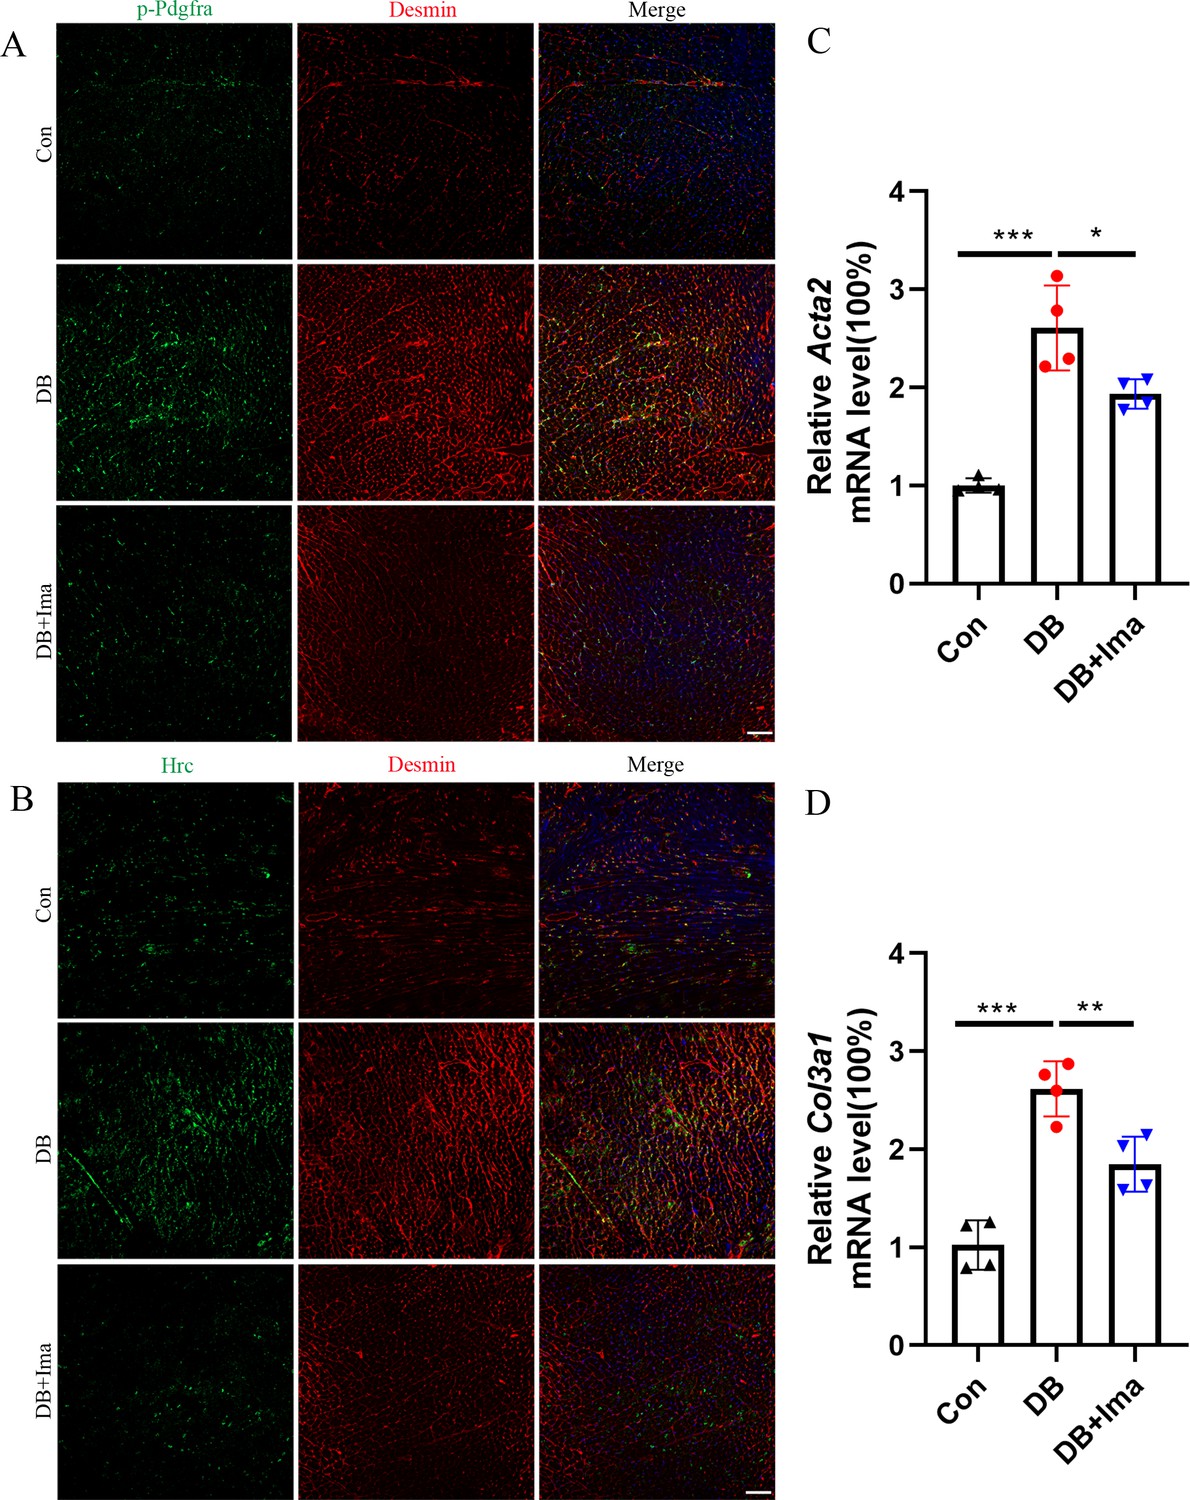
Identification of Hrc-activated fibroblasts and Pdgfra phosphorylation in DB/DB diabetic mice.
(A) p-Pdgfra (green) and Desmin (red) labeled fibroblasts in the mice heart. (B) Hrc (green) and Desmin (red) labeled activated fibroblasts in the mice heart (n = 6 mice per group for A and B; scale bar = 50 μm). (C) Acta2 mRNA expression level in the mice heart (n = 4 mice per group; mean ± standard error of mean [SEM]; *p < 0.05; ***p < 0.001). (D) Col3a1 mRNA expression level in mice heart (n = 6 mice per group; mean ± SEM; **p < 0.01; ***p < 0.001).
Figure 7—figure supplement 1
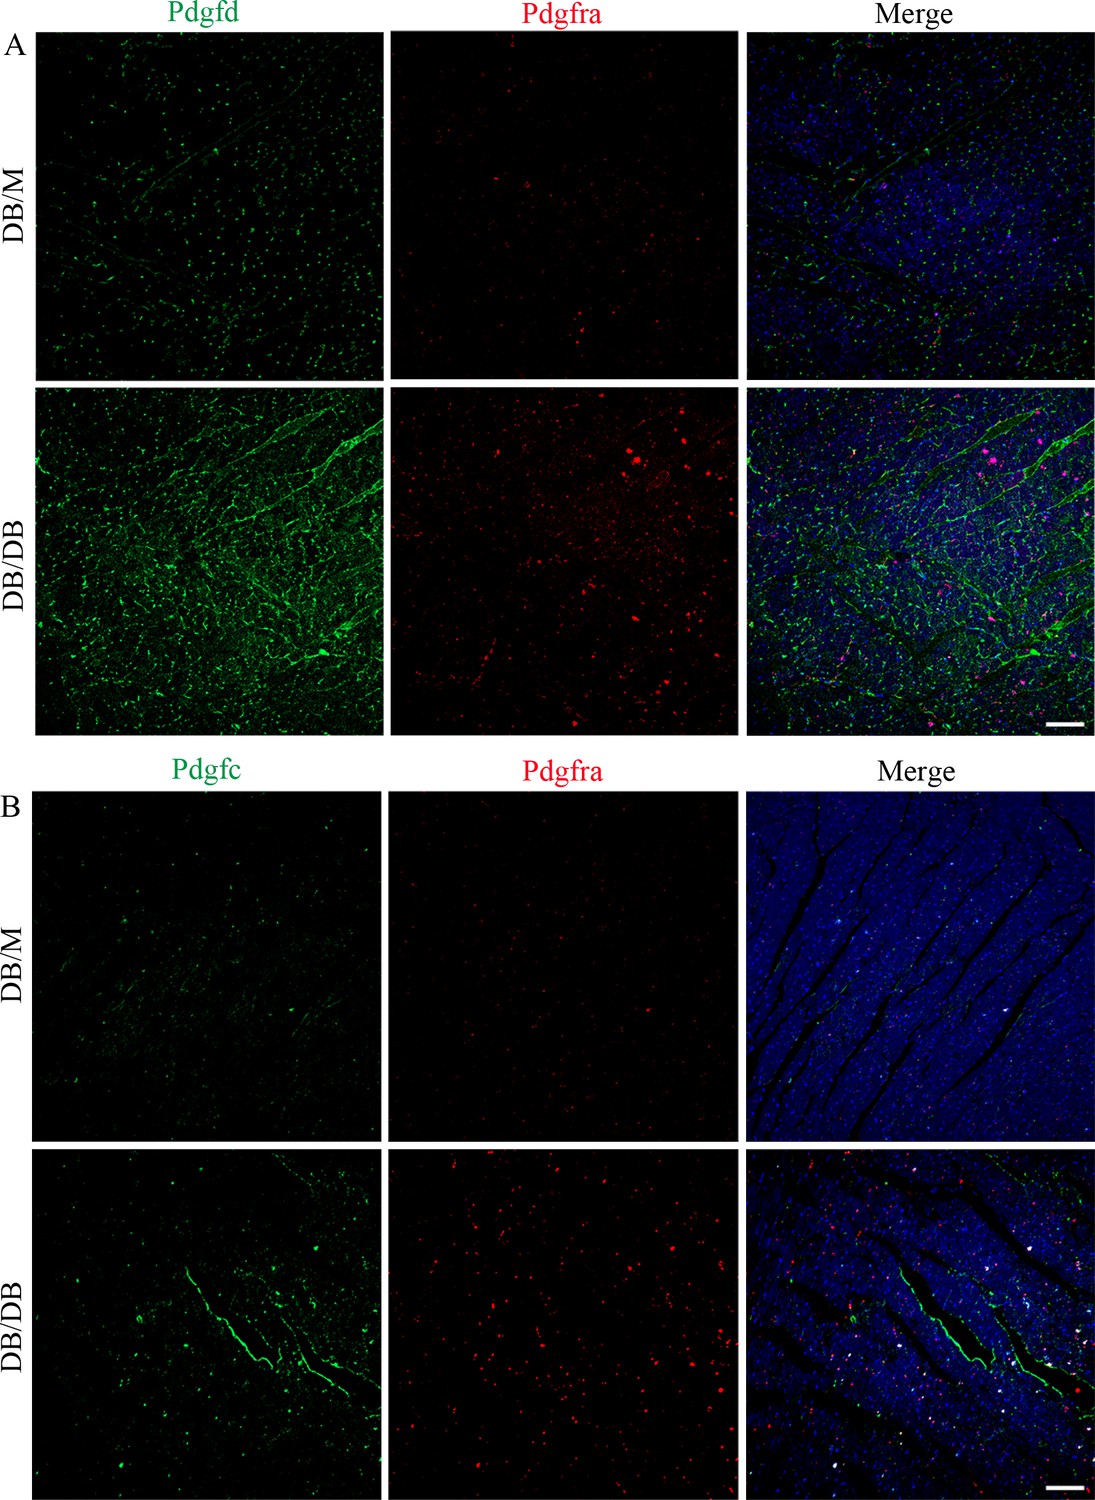
Immunostaining results of Pdgfd and Pdgfc in the Pdgfra+ fibroblasts.
Representative immunofluorescence images of Pdgfd (A) and Pdgfd (B) in the Pdgfra+ cells in the heart tissues of DB/DB diabetic mice and DB/M control groups (n = 6 mice per group; scale bar = 50 µm).
Figure 8 with 1 supplement
Validation of Hrc-activated fibroblasts and Pdgfra phosphorylation in female C57 mice.
(A) p-Pdgfra (green) and Desmin (red) labeled fibroblasts in the mice heart. (B) Hrc (green) and Desmin (red) labeled activated fibroblasts in the mice heart. n = 6 mice per group for A and B; scale bar = 50 μm. (C) Acta2 mRNA expression level in the mice heart (n = 4 mice per group; mean ± standard error of mean [SEM], *p < 0.05; ***p < 0.001). (D) Col3a1 mRNA expression level in mice heart (n = 4 mice per group; mean ± SEM; **p < 0.01; ***p < 0.001).
Figure 8—figure supplement 1
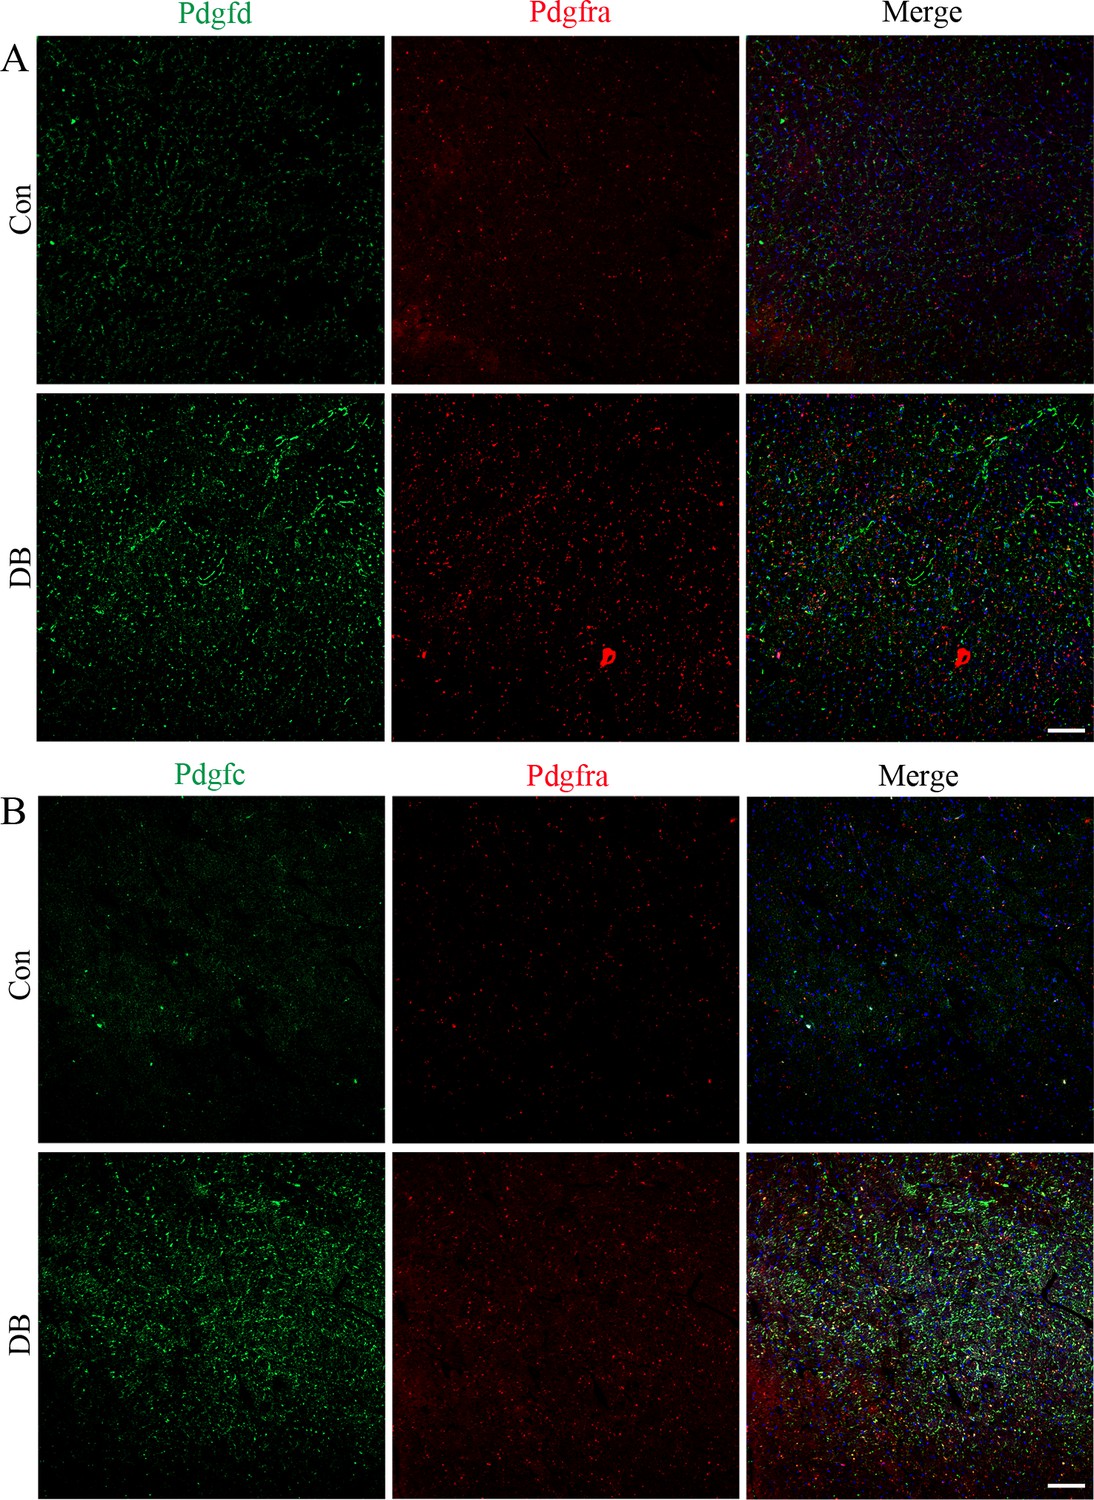
Immunofluorescence results of Pdgfd and Pdgfc in the Pdgfra+ fibroblasts.
Representative immunofluorescence images for Pdgfd (A) and Pdgfd (B) in the Pdgfra+ cells in the heart tissues of female C57 diabetic mice and control groups (n = 6 mice per group; scale bar = 50 µm).
Author response image 1
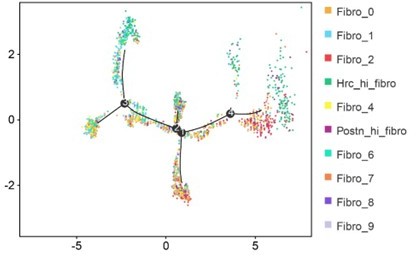
Single-cell trajectories analysis.
Additional files
-
Supplementary file 1
The 25 transcriptionally distinct pre-clusters with highly consistent expression patterns across individual mice hearts.
- https://cdn.elifesciences.org/articles/80479/elife-80479-supp1-v2.xls
-
Supplementary file 2
Genes with significant transcriptomic changes in the cardiac populations.
- https://cdn.elifesciences.org/articles/80479/elife-80479-supp2-v2.xls
-
Supplementary file 3
The top 10 upregulated genes in the cardiac populations.
- https://cdn.elifesciences.org/articles/80479/elife-80479-supp3-v2.xls
-
Supplementary file 4
Unique differentially expressed genes (uni-DEGs) in the cardiac populations.
- https://cdn.elifesciences.org/articles/80479/elife-80479-supp4-v2.xls
-
Supplementary file 5
Significantly differentially expressed genes in specific cell populations relative to others in mice hearts.
- https://cdn.elifesciences.org/articles/80479/elife-80479-supp5-v2.xls
-
Supplementary file 6
Cell type-specific receptors in the cardiac populations.
- https://cdn.elifesciences.org/articles/80479/elife-80479-supp6-v2.xls
-
Supplementary file 7
Cell type-specific ligands in the cardiac populations.
- https://cdn.elifesciences.org/articles/80479/elife-80479-supp7-v2.xls
-
Supplementary file 8
Relative expression of a selection of essential growth factors across the major cardiac cell types.
- https://cdn.elifesciences.org/articles/80479/elife-80479-supp8-v2.xls
-
Supplementary file 9
The number of ligand–receptor pairs among the cardiac cell populations in the healthy mice.
- https://cdn.elifesciences.org/articles/80479/elife-80479-supp9-v2.xls
-
Supplementary file 10
Ligand–receptor pairs among the cardiac cell populations in the healthy mice.
- https://cdn.elifesciences.org/articles/80479/elife-80479-supp10-v2.xls
-
Supplementary file 11
Significantly differentially expressed ligands in each cell population.
- https://cdn.elifesciences.org/articles/80479/elife-80479-supp11-v2.xls
-
Supplementary file 12
Significantly differentially expressed receptors in each cell population.
- https://cdn.elifesciences.org/articles/80479/elife-80479-supp12-v2.xls
-
Supplementary file 13
The cognate ligands of Egfr.
- https://cdn.elifesciences.org/articles/80479/elife-80479-supp13-v2.xls
-
Supplementary file 14
The cognate ligands of Pdgfra.
- https://cdn.elifesciences.org/articles/80479/elife-80479-supp14-v2.xls
-
Supplementary file 15
Ten transcriptionally distinct fibroblast subpopulations.
- https://cdn.elifesciences.org/articles/80479/elife-80479-supp15-v2.xls
-
Supplementary file 16
Distinct signatures of each fibroblast subpopulations in mice hearts.
- https://cdn.elifesciences.org/articles/80479/elife-80479-supp16-v2.xls
-
Supplementary file 17
The transcription factor gene-regulatory networks in the distinct subpopulations.
- https://cdn.elifesciences.org/articles/80479/elife-80479-supp17-v2.xls
-
Supplementary file 18
Gene expression of the transcription factors shown in Figure 5A, B.
- https://cdn.elifesciences.org/articles/80479/elife-80479-supp18-v2.xls
-
Supplementary file 19
Genes with significant transcriptomic changes in each fibroblast subpopulation.
- https://cdn.elifesciences.org/articles/80479/elife-80479-supp19-v2.xls
-
Supplementary file 20
Unique differentially expressed genes (uni-DEGs) in each fibroblast subpopulation.
- https://cdn.elifesciences.org/articles/80479/elife-80479-supp20-v2.xls
-
Supplementary file 21
The cognate ligands of Itgb1.
- https://cdn.elifesciences.org/articles/80479/elife-80479-supp21-v2.xls
-
MDAR checklist
- https://cdn.elifesciences.org/articles/80479/elife-80479-mdarchecklist1-v2.pdf
Download links
A two-part list of links to download the article, or parts of the article, in various formats.
Downloads (link to download the article as PDF)
Open citations (links to open the citations from this article in various online reference manager services)
Cite this article (links to download the citations from this article in formats compatible with various reference manager tools)
Single-cell RNA-seq of heart reveals intercellular communication drivers of myocardial fibrosis in diabetic cardiomyopathy
eLife 12:e80479.
https://doi.org/10.7554/eLife.80479


