Contrasting parental roles shape sex differences in poison frog space use but not navigational performance
- Institute of Biosciences, Vilnius University Life Sciences Center, Lithuania
- CEFE, Univ Montpellier, France
- Department of Biology, Stanford University, United States
- Universidad Nacional de San Antonio Abad del Cusco, Peru
- Technical University of Munich, TUM School of Life Sciences, Ecosystem Dynamics and Forest Management, Hans-Carl-von-Carlowitz-Platz, Germany
- Berchtesgaden National Park, Doktorberg, Germany
- Department of Interdisciplinary Life Sciences, Konrad Lorenz Institute of Ethology, University of Veterinary Medicine Vienna, Austria
- Department of Biology and Environmental Science, University of Jyväskylä, Finland
- Division of Behavioural Ecology, Institute of Ecology and Evolution, University of Bern, Switzerland
- Institute of Electronic Music and Acoustics, University of Music and Performing Arts Graz, Austria
- Department of Behavioral and Cognitive Biology, University of Vienna, Austria
- Department of Evolutionary Biology, University of Vienna, Austria
- Research Center on Animal Cognition, Center for Integrative Biology, CNRS - Paul Sabatier University, France
- Department of Integrative Biology, Oklahoma State University, United States
- Centro Jambatu de Investigación y Conservación de Anfibios, Ecuador
- Messerli Research Institute, University of Veterinary Medicine Vienna, Austria
Figures
Figure 1 with 2 supplements
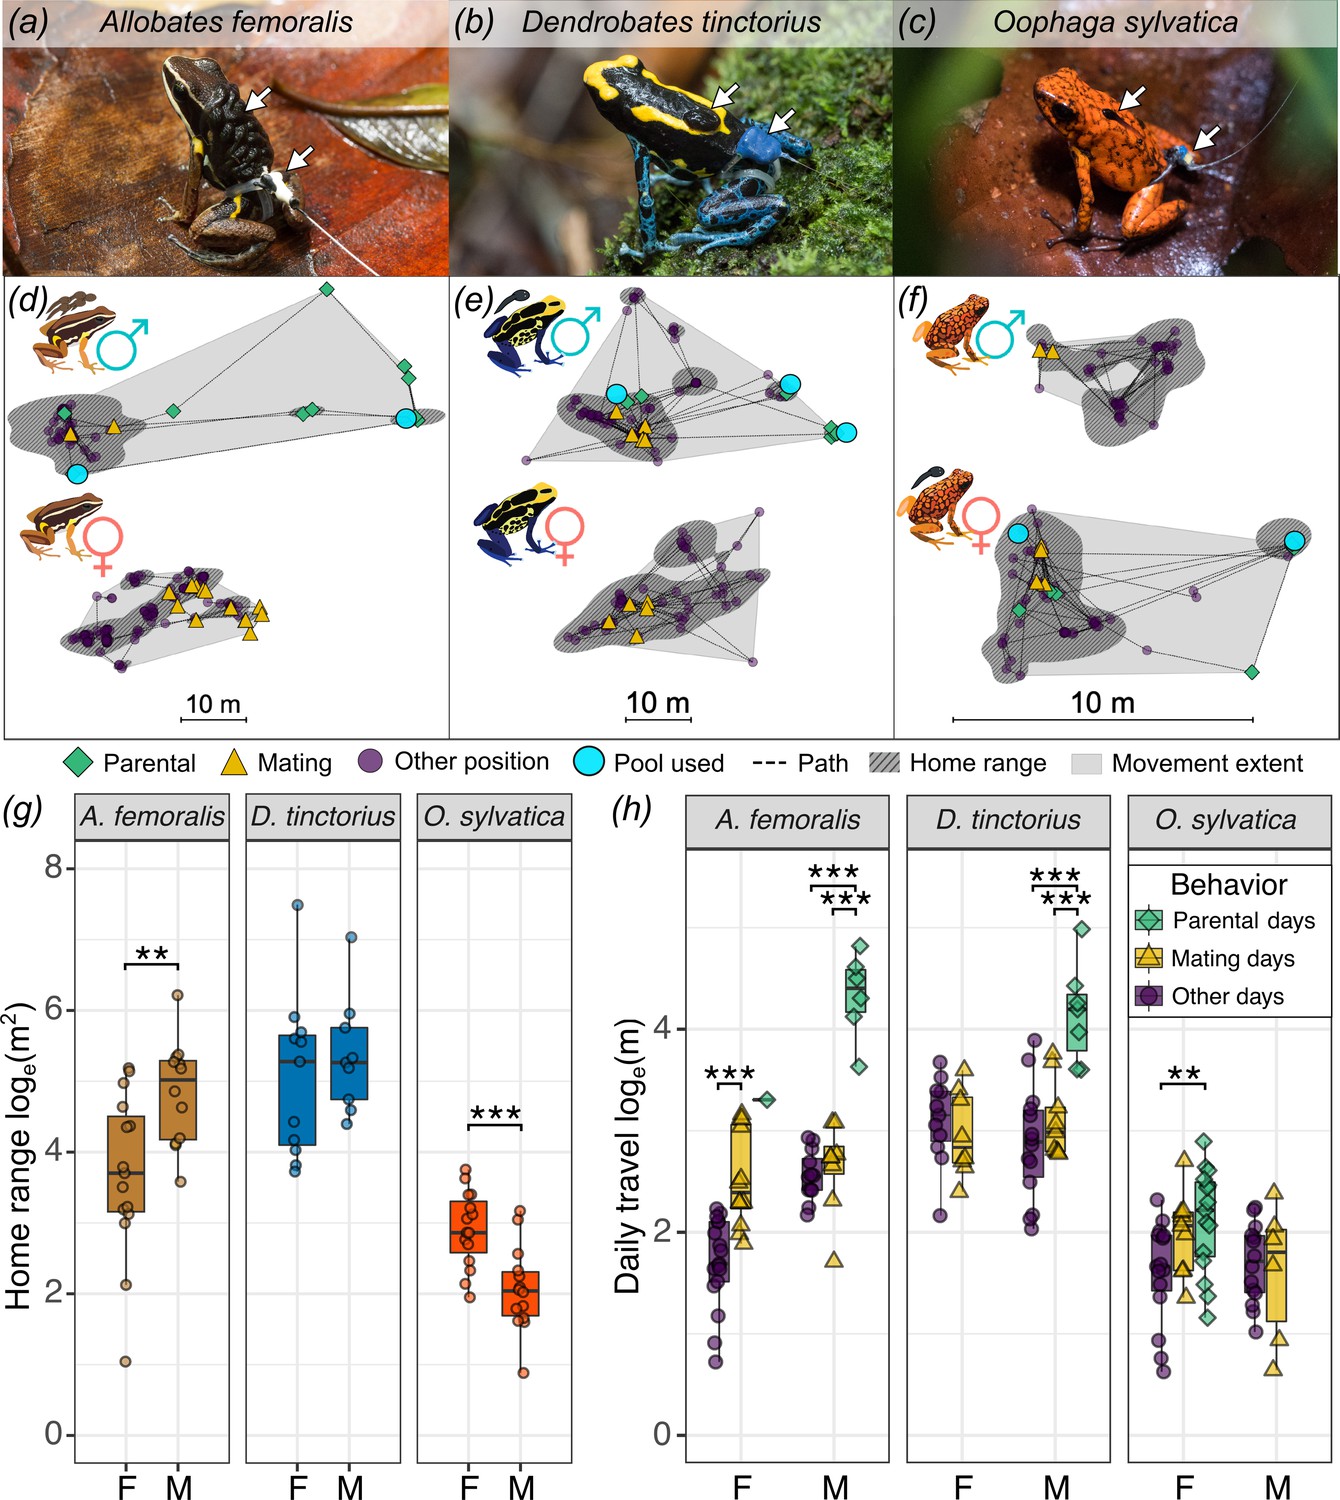
Parental sex roles and behavior drive sex differences in poison frog space use.
Male (a, b) and female (c) individuals of each study species transporting tadpoles while wearing a tracking tag. White arrows indicate tadpoles and the tag. (d, e) Examples of representative space use patterns of one individual of each species and sex show different measured space use parameters. We calculated the daily travel as the cumulative distance (line) between all relocations (points) per day; the movement extent (gray shaded area); and the home range representing more intensely used areas (darker hatched area). Frog positions are classified to represent three types of behaviors associated with daily movements: parental behavior (green diamonds), mating behavior (yellow triangles), and other (purple circles). Light blue circles represent pools used for tadpole deposition. Note that the scale is different in the panel for (f) O. sylvatica. Boxplots show sex differences in home range size (g), and daily travel between days when parental behavior, mating, or neither were observed (h). Plot rectangles indicate the lower and upper quartiles with the median line, whiskers extend to 1.5 times the interquartile limited by value range, and dots indicate individuals. As frogs were tracked for multiple days, average values per individual per behavioral category are shown. Days were categorized as pool visits or mating days if the corresponding behavior was observed at least on one relocation of that day. y-Axes are loge-transformed. Statistical significance levels are indicated as **p < 0.01, ***p < 0.001.
Figure 1—figure supplement 1
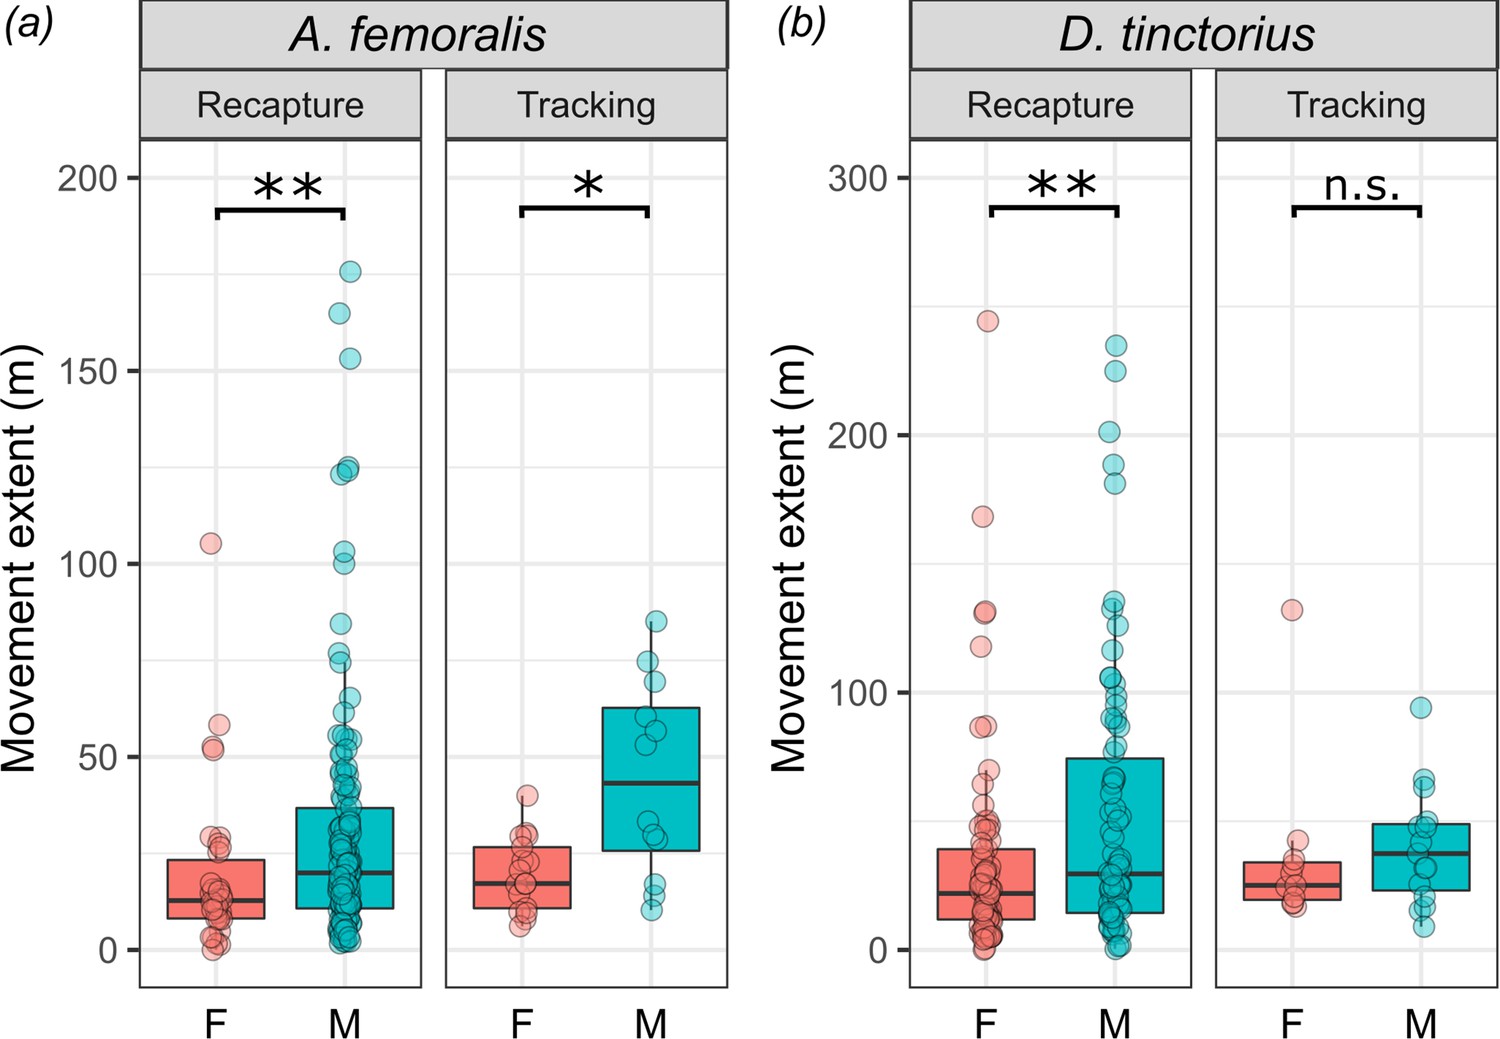
Comparison of sex differences in movement extent between long-term recapture data and short-term tracking.
Boxplots showing sex differences in movement extent of (a) A. femoralis and (b) D. tinctorius female (F) and male (M) frogs calculated based on the long-term capture–recapture data (left panel) or short-term tracking data (right panel). Plot rectangles indicate the lower and upper quartiles (with the median as the dark line), whiskers extend to 1.5 times the interquartile range but do not extend past the full value range, and dots indicate individuals. Statistical significance levels are indicated as *p 0.05–0.01, **p < 0.01.
Figure 1—figure supplement 2
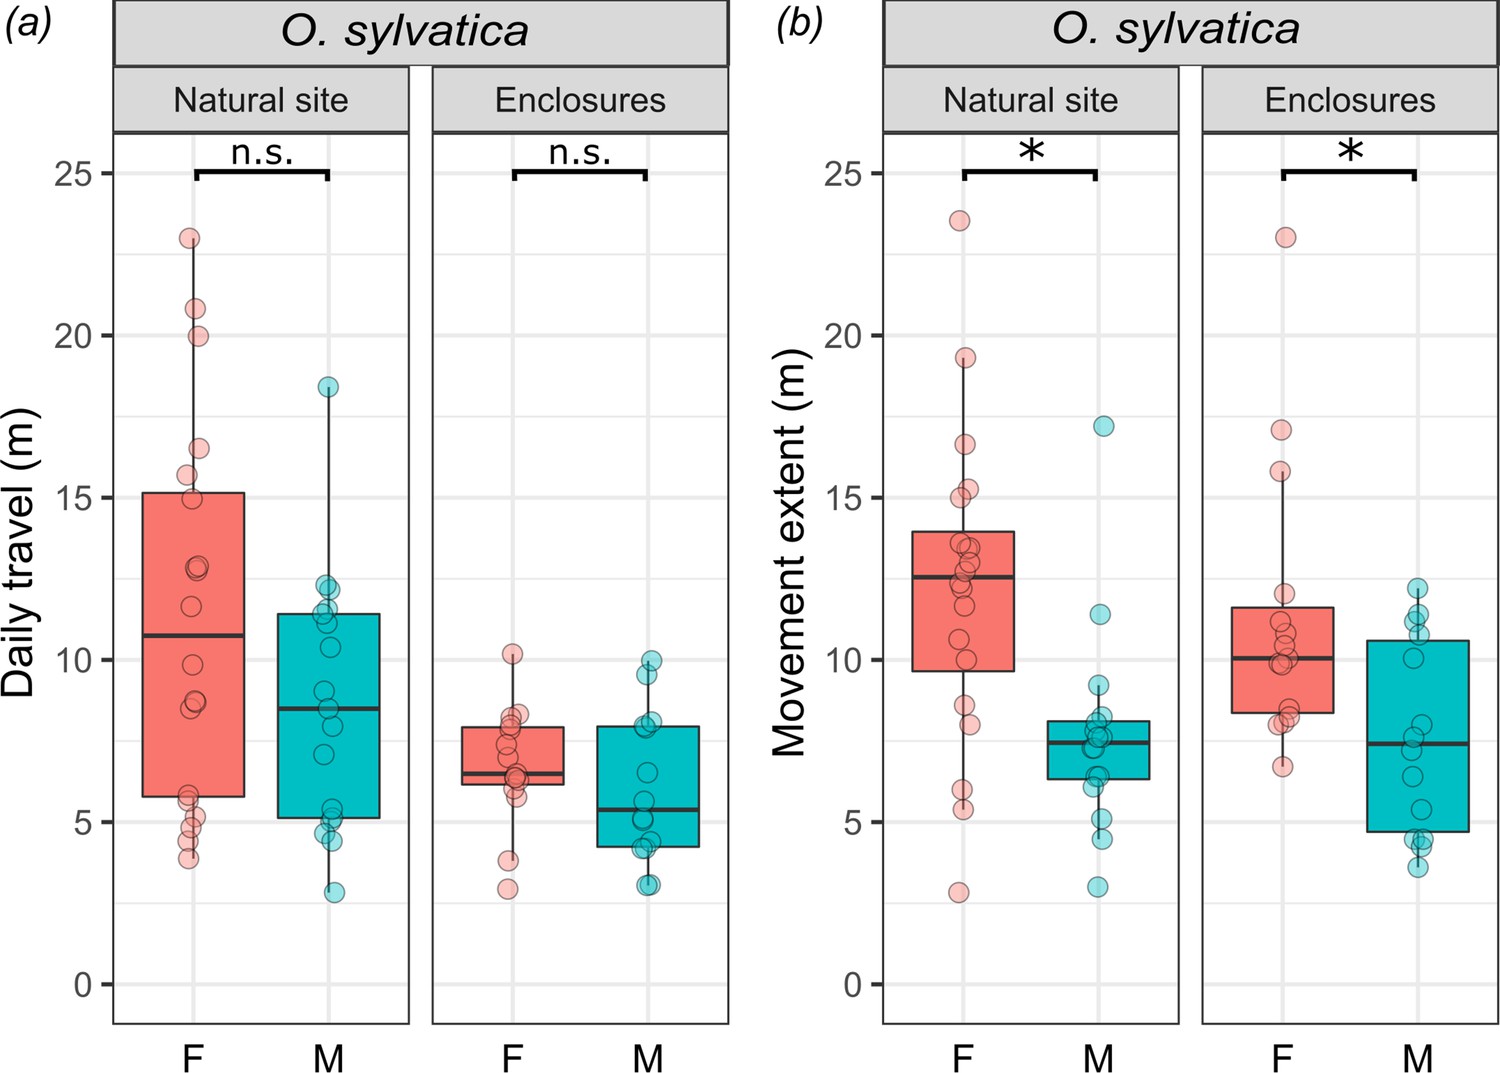
Comparison of sex differences in daily travel and movement extent of O.sylvatica tracked in enclosures and a natural population.
Boxplots showing sex differences in (a) daily travel and (b) movement extent between female (F) and male (M) frogs tracked at a natural site (left panel) and enclosures (right panel). Plot rectangles indicate the lower and upper quartiles (with the median as the line), whiskers extend to 1.5 times the interquartile range but do not extend past the full value range, and dots indicate individuals. Statistical significance level is indicated as *p 0.05–0.01.
Figure 2 with 2 supplements
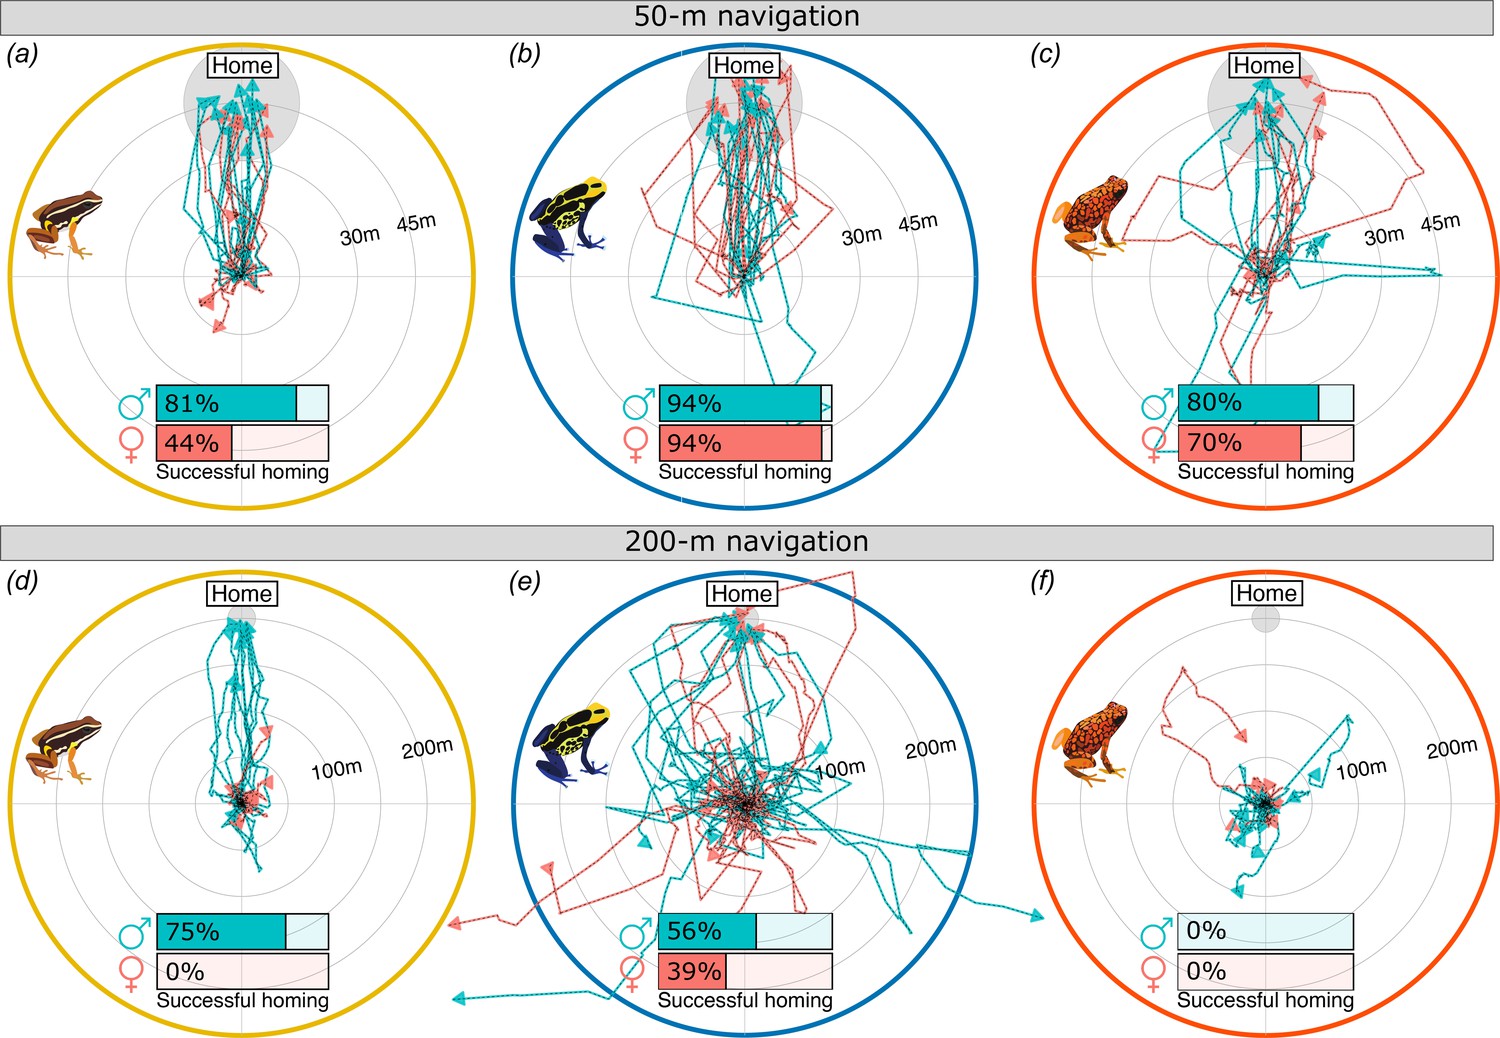
Species and sex differences in movement trajectories of translocated poison frogs.
Homeward normalized movement trajectories of (a, d) A. femoralis, (b, e) D. tinctorius, and (c, f) O. sylvatica translocated approximately 50 m (a–c) or 200 m (d–f) from home. All trajectories are normalized to a common start location (center of the plot) and home direction (top of the plot). The approximate home area is indicated by a gray circle. Each line corresponds to a different individual with male trajectories in teal and female in red. The proportion of each sex that showed homing behavior is indicated on inserted bar plots. Frogs were considered homing if they completed at least 70% of the distance from the release site to the home center within 3 or 6 days for 50 and 200 m, respectively.
Figure 2—figure supplement 1
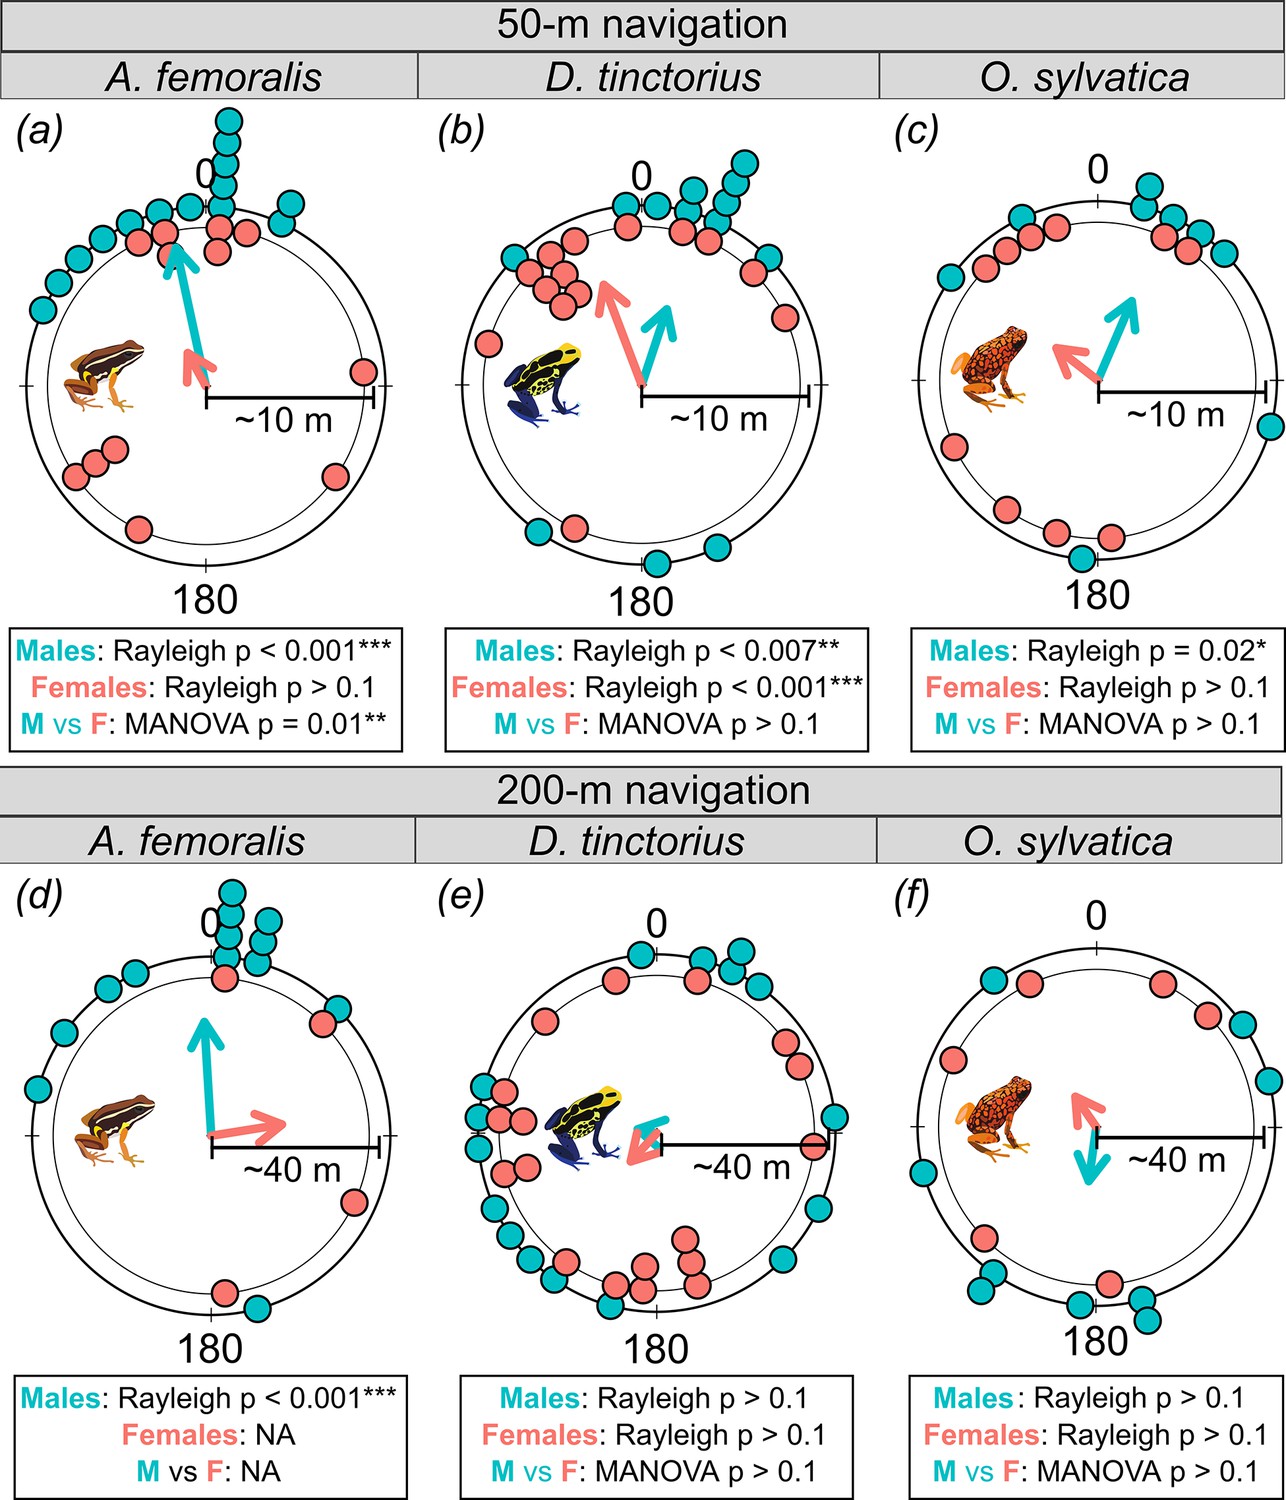
Sex differences in angular deviation from home direction.
The angular deviation was measured at ~10 or ~40 m from the release site for (a–c) 50 m and (d–f) 200 m translocation, respectively. Dots on circular plots represent individual angular deviations with males (M) in teal and females (F) in red. Arrows represent the mean vector direction and length for each species, sex, and translocation distance. Circular statistics for significant deviation from uniformity are indicated separately for males and females together with a MANOVA directly comparing significant group differences. Statistical significance levels are indicated as *p 0.05–0.01, **p < 0.01, ***p < 0.001.
Figure 2—figure supplement 2

Temporal patterns of homing.
Species difference in temporal patterns of movement after (top row) 50-m or (bottom row) 200-m translocation. y-Axis shows distance (in meters) from the respective home center. x-Axis shows time (in days) from the release after translocation. Color gradient indicates the distance remaining to the home area at the end of the tracking period. Blue represents the frogs that returned home, gray shows the frogs that stayed close to the release site or moved in parallel to home, and yellow shows frogs that moved away from home. Gray shaded areas represent night-time when frogs do not move. Each line represents a different individual. (a, d) A. femoralis (inconspicuous species) rarely moved unless moving toward home while (b, e) D. tinctorius and (c, f) O. sylvatica (two aposematic species) showed exploratory movements and often move away from home.
Figure 3

Sex differences in poison frog exploration and navigational performance.
(a) Schematic representation of the parameters measured during navigation experiments (numbers in parentheses), which are plotted in panels (b–d). Explored area (b), trajectory straightness (c), and homing duration (d) were measured for successful homing, while only explored area (b) were measured for frogs that did not return home. Boxplots show sex differences in (b) explored area (loge-transformed), (b) homing trajectory straightness, and (c) homing duration (a). Filled and empty circles indicate individuals that were homing or not. Plot rectangles indicate the lower and upper quartiles with the median line, whiskers extend to 1.5 times the interquartile limited by the value range, and dots indicate individuals. Statistical significance levels are indicated as *p 0.05–0.01, **p < 0.01, ***p < 0.001.
Figure 4
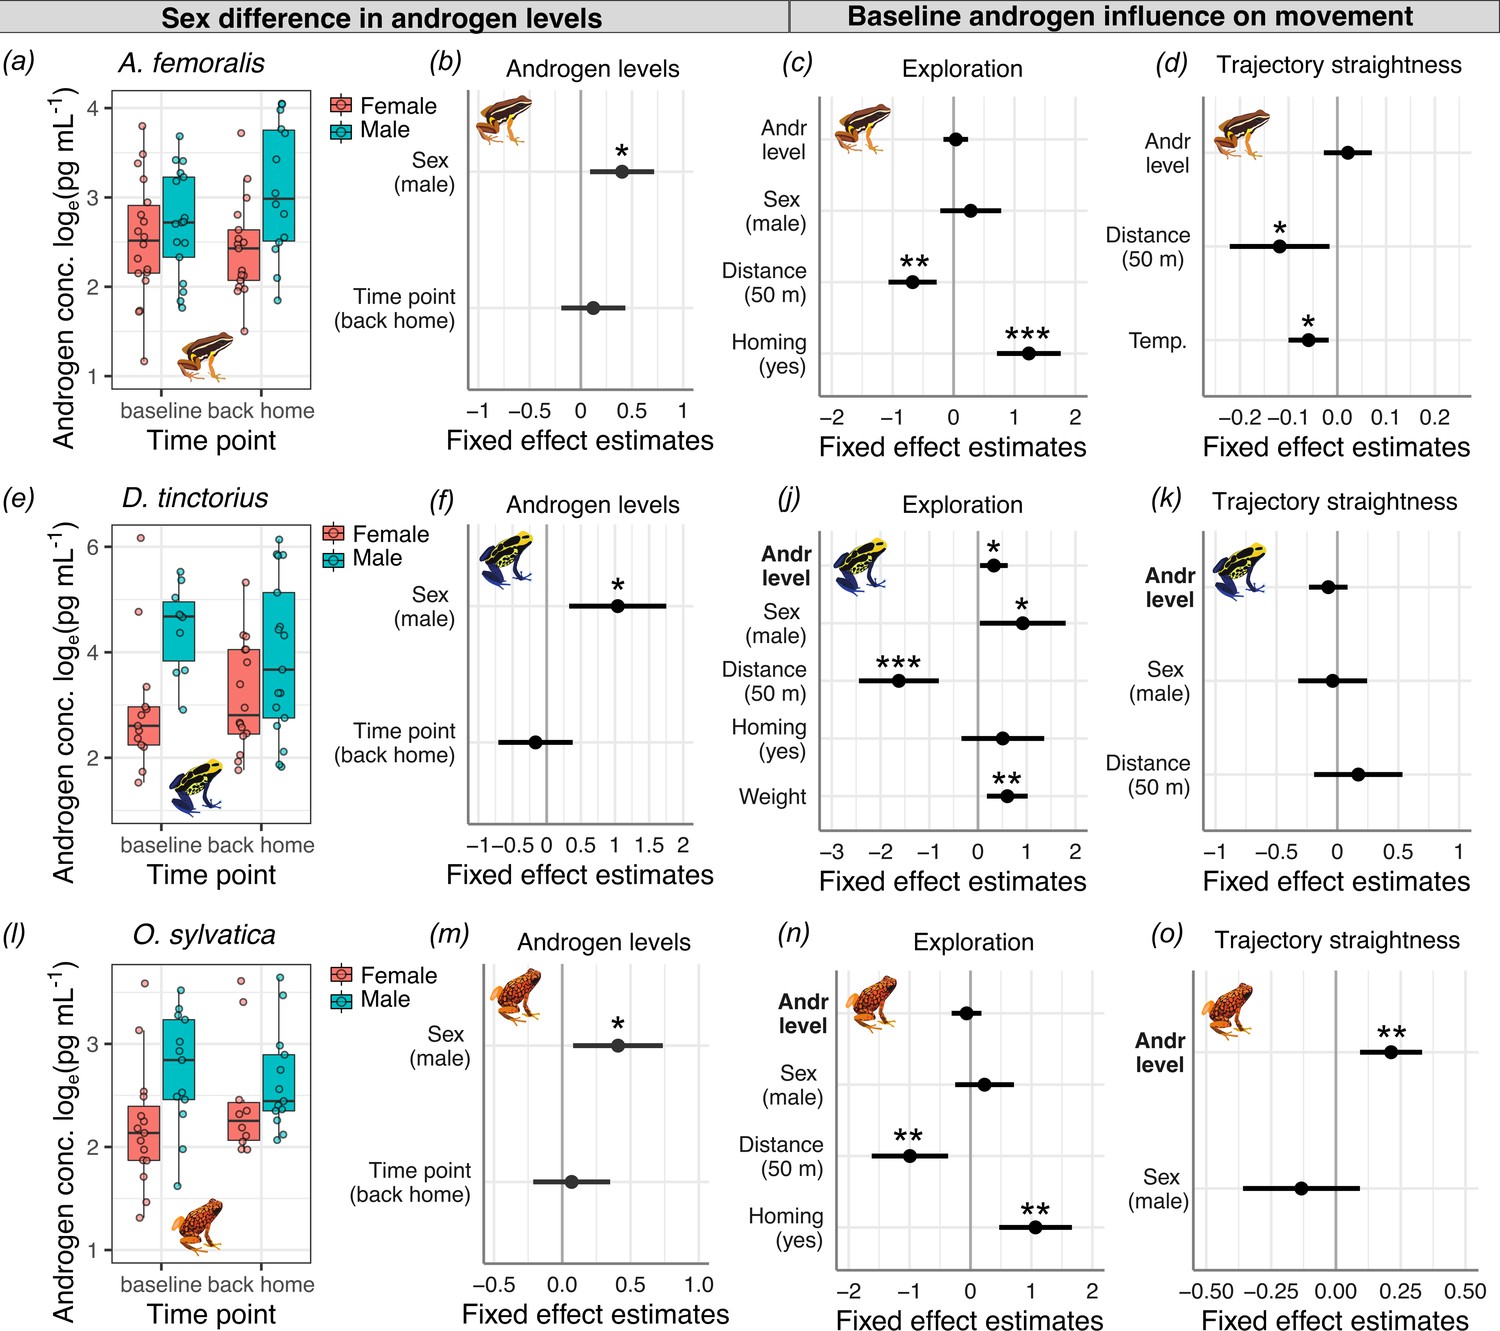
Relationships between androgen levels and spatial behavior.
Boxplots show sex differences in water-borne androgen concentration measured before and after the navigational task in (a) A. femoralis, (e) D. tinctorius, and (l) O. sylvatica. The coefficient plots indicate the effect size and confidence intervals of androgen level difference between sexes and the two sampling points for (b) A. femoralis, (f) D. tinctorius, and (m) O. sylvatica and the influence of androgen levels and other factors on exploration (c, j, n) and homing trajectory straightness (d, k, o) in each species. The plot title represents the response variable of the respective regression model with its predictors on the y-axis, and fixed effect estimates (black dots) ± 95% confidence interval (error bars) on the x-axis. For categorical predictors such as ‘sex’, the estimates are always shown for the reference factor (its label in parenthesis), which is compared to the other factors represented by the intercept. The overlap of the error bars with the zero-reference line indicates lack of a significant effect on the response variable. All continuous predictors were centered and standardized. Androgen concentrations are natural loge-transformed. Statistically significant levels are indicated as *p 0.05–0.01, **p < 0.01, ***p < 0.001.
Figure 5
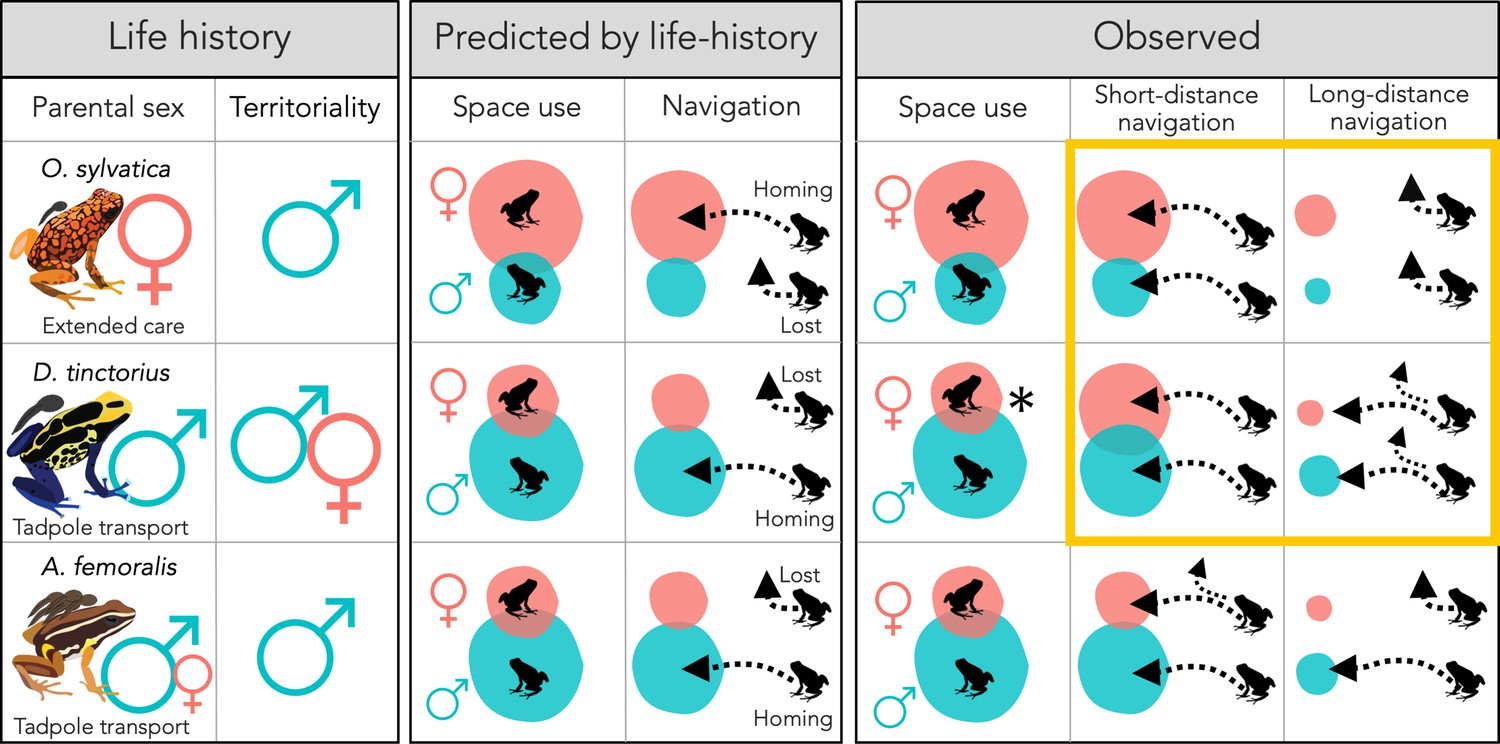
Summary of sex and species differences in life-history traits, predicted, and observed space use and navigational performance.
Pink and teal circles represent the space use extent for females and males, respectively, and dotted arrows represent homing success after translocations. Arrows pointing to home range represent successful homing and arrows pointing away present lost frogs, based on the overall pattern of homing success. Note that possible differences in homing accuracy and duration are not represented. Yellow frame highlights the observed outcomes that differed from the predictions and in all of these cases we found no sex differences where differences were expected. *Sex difference only observed in long-term movements and qualitatively in vertical space use.
Tables
Table 1
Home range size model summaries.
| A. femoralis loge (home range) | D. tinctorius loge (home range) | O. sylvatica loge (home range) | ||||
|---|---|---|---|---|---|---|
| Predictors | Estimates (CI) | p | Estimates (CI) | p | Estimates (CI) | p |
| (Intercept) | 3.15 (1.1 to 5.2) | 0.004 | 5.3 (4.0 to 6.6) | <0.001 | 2.5 (1.6 to 3.4) | <0.001 |
| Sex [male] | 0.9 (0.2 to 1.7) | 0.015 | 0.2 (−0.9 to 1.3) | 0.68 | −0.8 (−1.3 to 0.4) | 0.001 |
| Tracking duration | 0.06 (−0.1 to 0.2) | 0.46 | −0.02 (−0.1 to 0.06) | 0.62 | 0.04 (−0.04 to 0.1) | 0.36 |
| Observations | 25 | 19 | 29 | |||
| R2/R2 adjusted | 0.28/0.21 | 0.02/0.0 | 0.40/0.35 | |||
-
Summary of three linear models with loge-transformed home range size in A. femoralis, D. tinctorius, and O. sylvatica as the response variable, sex as the predictor, and tracking duration (in days) as a covariate. Statistical significance with p < 0.05 is highlighted in bold.
Table 2
Homing success model summaries.
| A. femoralis 50 m homing success | D. tinctorius 200 m homing success | O. sylvatica 50 m homing success | ||||
|---|---|---|---|---|---|---|
| Predictors | Log-Odds (CI) | p | Log-Odds (CI) | p | Log-Odds (CI) | p |
| (Intercept) | 107.8 (34.7 to 242.3) | 0.02 | 18.7 (−23.9 to 65.4) | 0.4 | 152.65 (−127.6 to 543.3) | 0.35 |
| Sex [male] | 5.2 (1.7 to 12.4) | 0.03 | 1.05 (−1.2 to 3.6) | 0.38 | 1.4 (−1.0 to 4.6) | 0.29 |
| Temp. | −4.8 (−10.8 to 1.8) | 0.020 | −0.8 (−2.7 to 0.85) | 0.35 | –6.5 (−23.3 to 5.5) | 0.35 |
| Weight | 4.7 (−1.9 to 13.0) | 0.19 | 0.2 (−1.0 to 1.5) | 0.74 | NA | |
| Observations | 32 | 32 | 18 | |||
| R2 Tjur | 0.59 | 0.07 | 0.10 | |||
-
Summary of three logistic regression models with homing success in A. femoralis, D. tinctorius, and O. sylvatica as the response variable, sex as the predictor, and average daytime temperature (Temp.) and frog weight as covariates. We did not perform statistical comparisons conditions A. femoralis 200 m because only males successfully returned; for O. sylvatica 200 m because no frogs returned and for D. tinctorius 50 m because both sexes return at an equal rate. Weight was excluded for O. sylvatica to achieve model convergence. Statistical significance with p < 0.05 is highlighted in bold.
Table 3
Explored area model summaries.
| A. femoralis 200 m loge (explored area) | D. tinctorius 200 m loge (explored area) | O. sylvatica 200 m loge (explored area) | ||||
|---|---|---|---|---|---|---|
| Predictors | Estimates (CI) | p | Estimates (CI) | p | Estimates (CI) | p |
| (Intercept) | 28.0 (8.7 to 47.4) | 0.006 | 5.6 (−7.65 to 18.9) | 0.39 | 30.85 (−97.0 to 158.7) | 0.61 |
| Sex [male] | 1.5 (0.9 to 2.1) | <0.001 | 1.5 (0.8 to 2.2) | <0.001 | 0.8 (0.02 to 1.7) | 0.045 |
| Temp. | −1.0 (−1.8 to 0.2) | 0.017 | −0.04 (−0.6 to 0.5) | 0.87 | −0.9 (−6.4 to 4.5) | 0.72 |
| Weight | 1.0 (−0.5 to 2.5) | 0.19 | 0.6 (0.2 to 0.9) | 0.004 | −1.4 (−3.2 to 0.3) | 0.10 |
| Observations | 30 | 32 | 15 | |||
| R2/R2 adjusted | 0.56/0.51 | 0.41/0.35 | 0.38/0.21 | |||
-
Summary of three linear models with loge-transformed explored area in A. femoralis, D. tinctorius, and O. sylvatica as the response variable, sex as the predictor, and average daytime temperature (Temp.) and frog weight as covariates. Statistical significance with p < 0.05 is highlighted in bold.
Table 4
Homing trajectory straightness model summaries.
| A. femoralis 50 m homing straightness | D. tinctorius 50 m homing straightness | D. tinctorius 200 m homing straightness | O. sylvatica 50 m homing straightness | |||||
|---|---|---|---|---|---|---|---|---|
| Predictors | Estimates | p | Estimates | p | Estimates | p | Estimates | p |
| (Intercept) | 28.7 (12.6 to 44.9) | <0.001 | 2.0 (−18.9 to 22.9) | 0.85 | 8.9 (−0.7 to 18.5) | 0.069 | 111.0 (25.9 to 196.0) | 0.011 |
| Sex [male] | 0.7 (0.1 to 1.3) | 0.017 | −0.05 (−0.8 to 0.7) | 0.89 | −0.5 (−0.9 to 0.02) | 0.039 | 0.5 (−0.4 to 1.3) | 0.30 |
| Temp. | −1.1 (−1.8 to 0.5) | 0.001 | −0.04 (−0.9 to 0.8) | 0.93 | −0.4 (−0.75 to 0.03) | 0.071 | −4.8 (−8.4 to 1.1) | 0.011 |
| Observations | 17 | 22 | 15 | 13 | ||||
| R2 | 0.35 | 0.001 | 0.39 | 0.44 | ||||
-
Summary of four beta regression models with homing trajectory straightness in A. femoralis, D. tinctorius, and O. sylvatica as the response variable, sex as the predictor, and average daytime temperature (Temp.) as a covariates. Statistical significance with p < 0.05 is highlighted in bold.
Additional files
-
MDAR checklist
- https://cdn.elifesciences.org/articles/80483/elife-80483-mdarchecklist1-v1.docx
-
Supplementary file 1
Supplementary statistics and methods tables.
- https://cdn.elifesciences.org/articles/80483/elife-80483-supp1-v1.docx
Download links
A two-part list of links to download the article, or parts of the article, in various formats.
Downloads (link to download the article as PDF)
Open citations (links to open the citations from this article in various online reference manager services)
Cite this article (links to download the citations from this article in formats compatible with various reference manager tools)
Contrasting parental roles shape sex differences in poison frog space use but not navigational performance
eLife 11:e80483.
https://doi.org/10.7554/eLife.80483


