The evolution of manipulative cheating
- Department of Biology, University of Oxford, United Kingdom
- Department of Mathematics, The University of Western Ontario, Canada
Figures
Figure 1
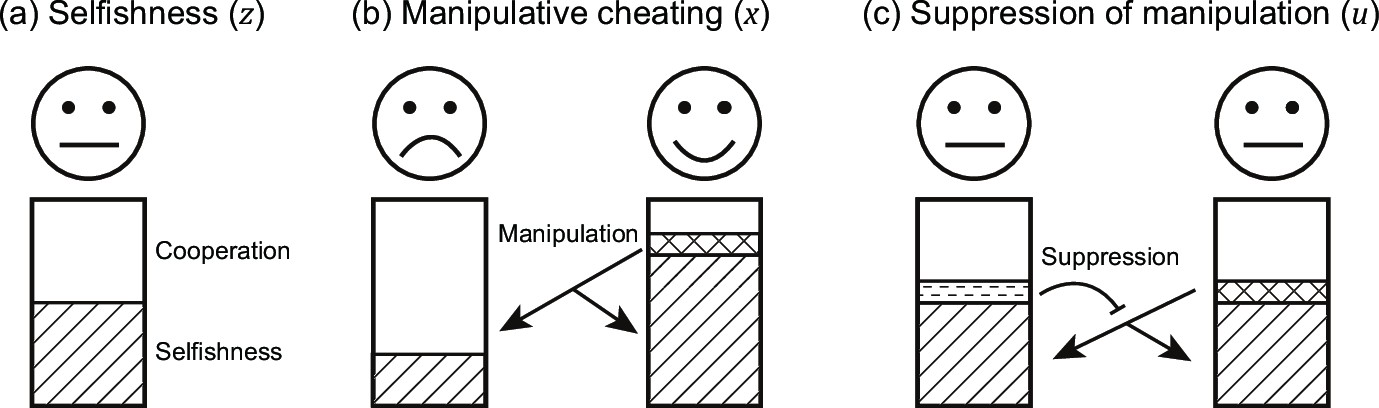
Schematic view of the three evolving traits in our model.
Each individual can put effort into three actions: (a) invest resources into reproduction ( ; represented by stripe texture) or group productivity (average cooperation; ); (b) manipulate others ( ; represented by the grid texture), to make them invest more into group productivity; and (c) suppress (block) the manipulation from others ( ; represented by horizontal dashed texture).
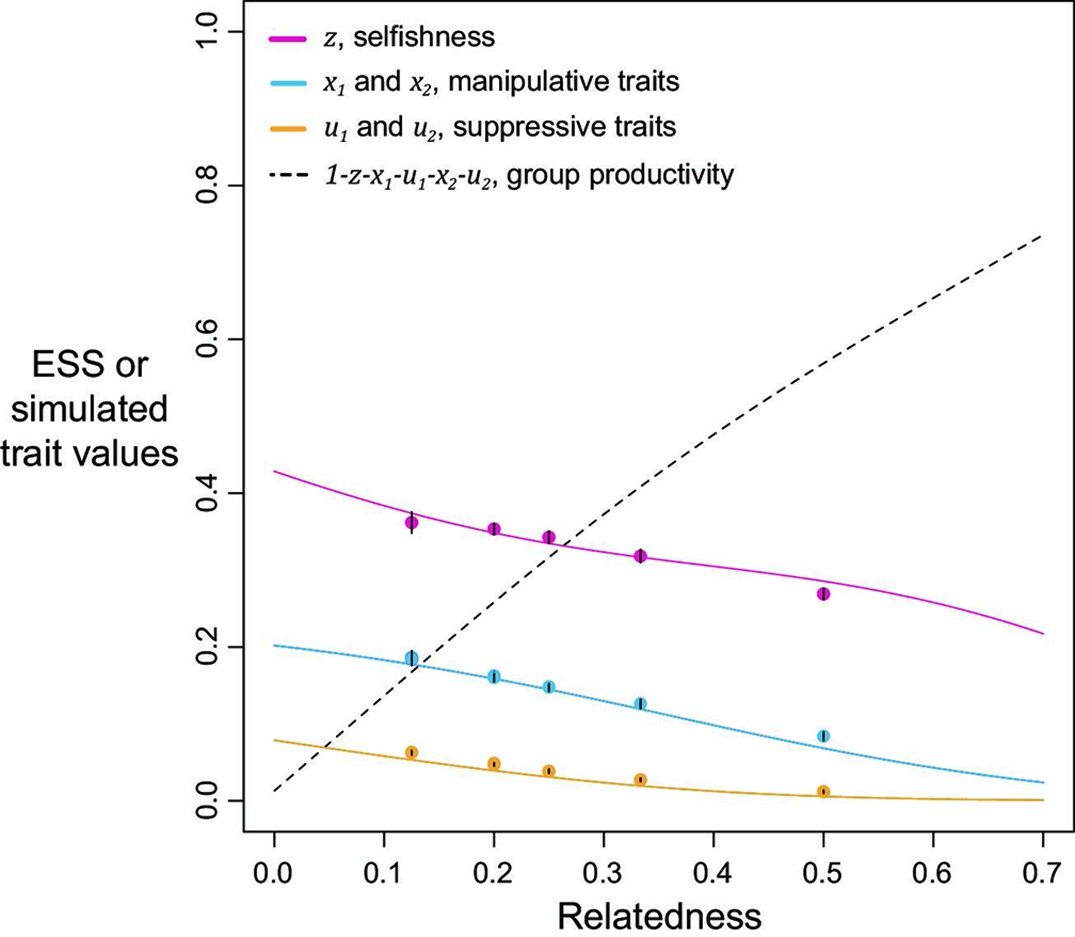
Figure 2
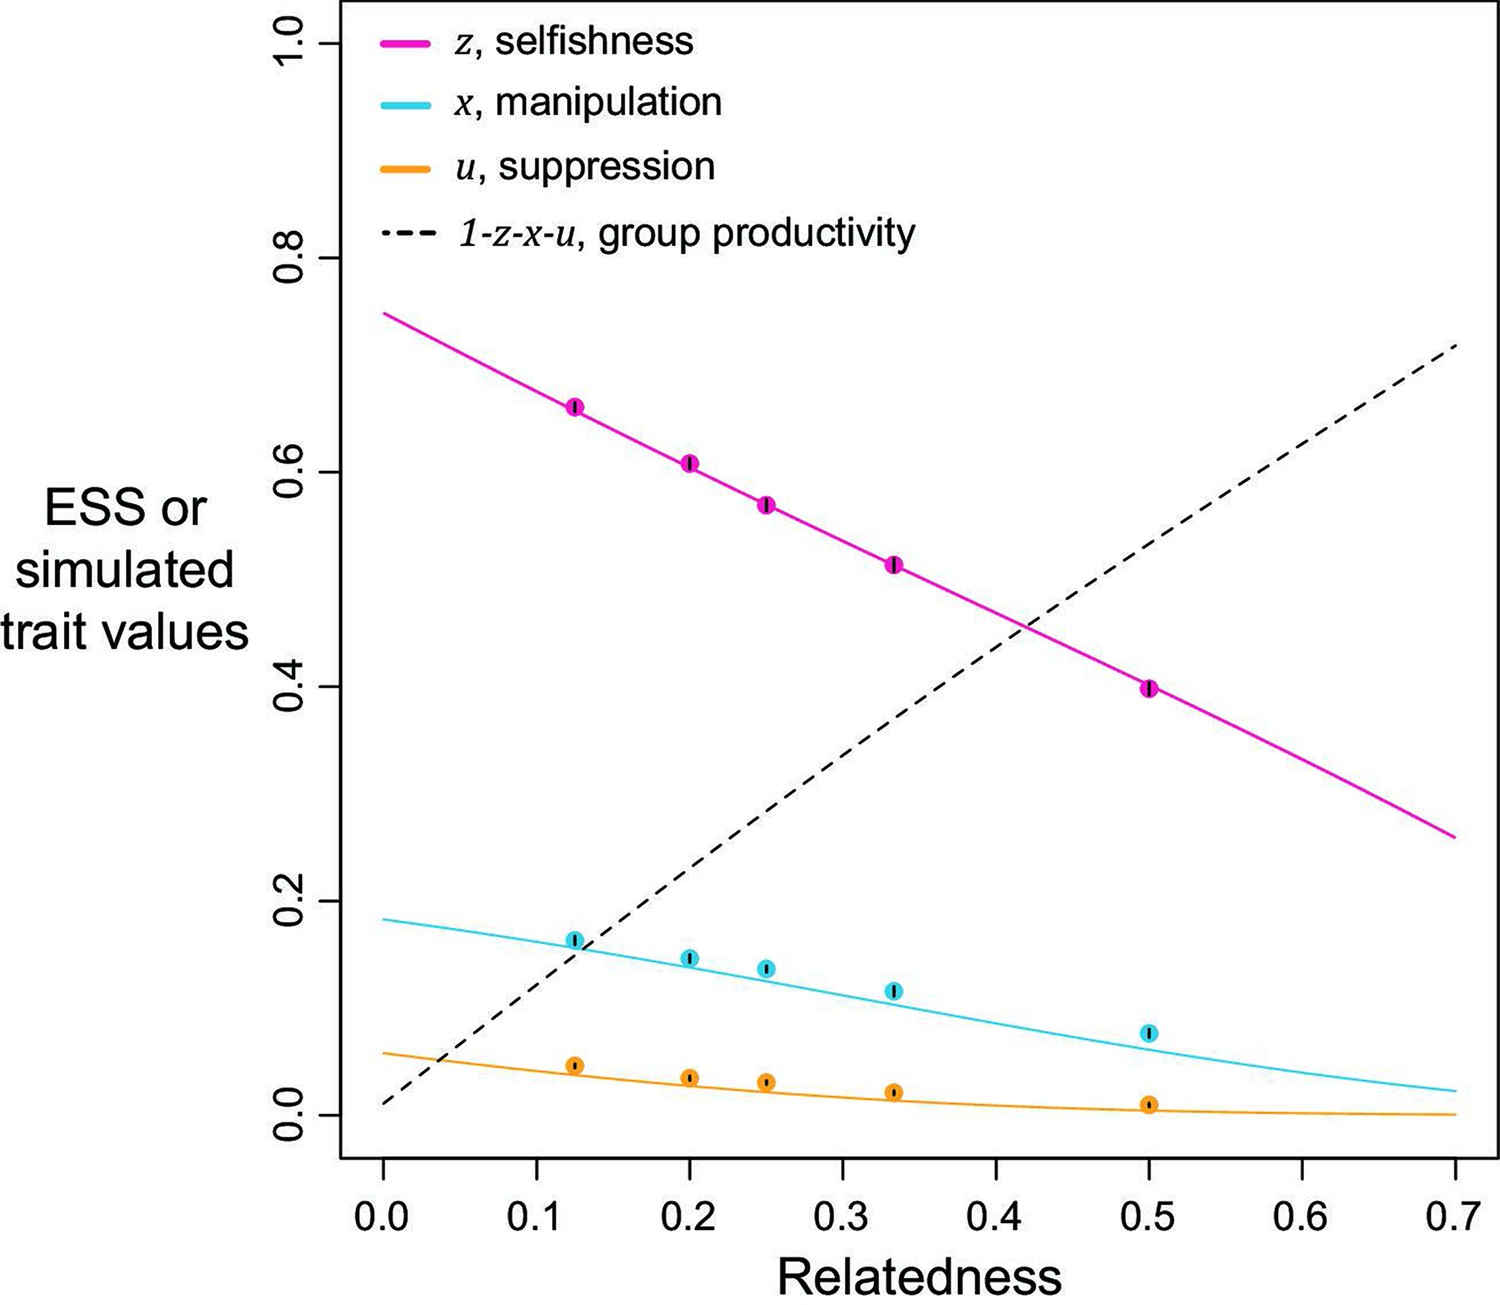
Selfishness, manipulation, and suppression of manipulation.
The panels show the ESS predictions and simulation results for our three-trait model. The solid lines show the ESS predictions, and the dots show the results of our individual-based simulations (=0.5). The black segments within each dot show the standard deviation of trait values of the last 10% duration of 10 repeated simulations (Appendix 1—7).
Figure 3
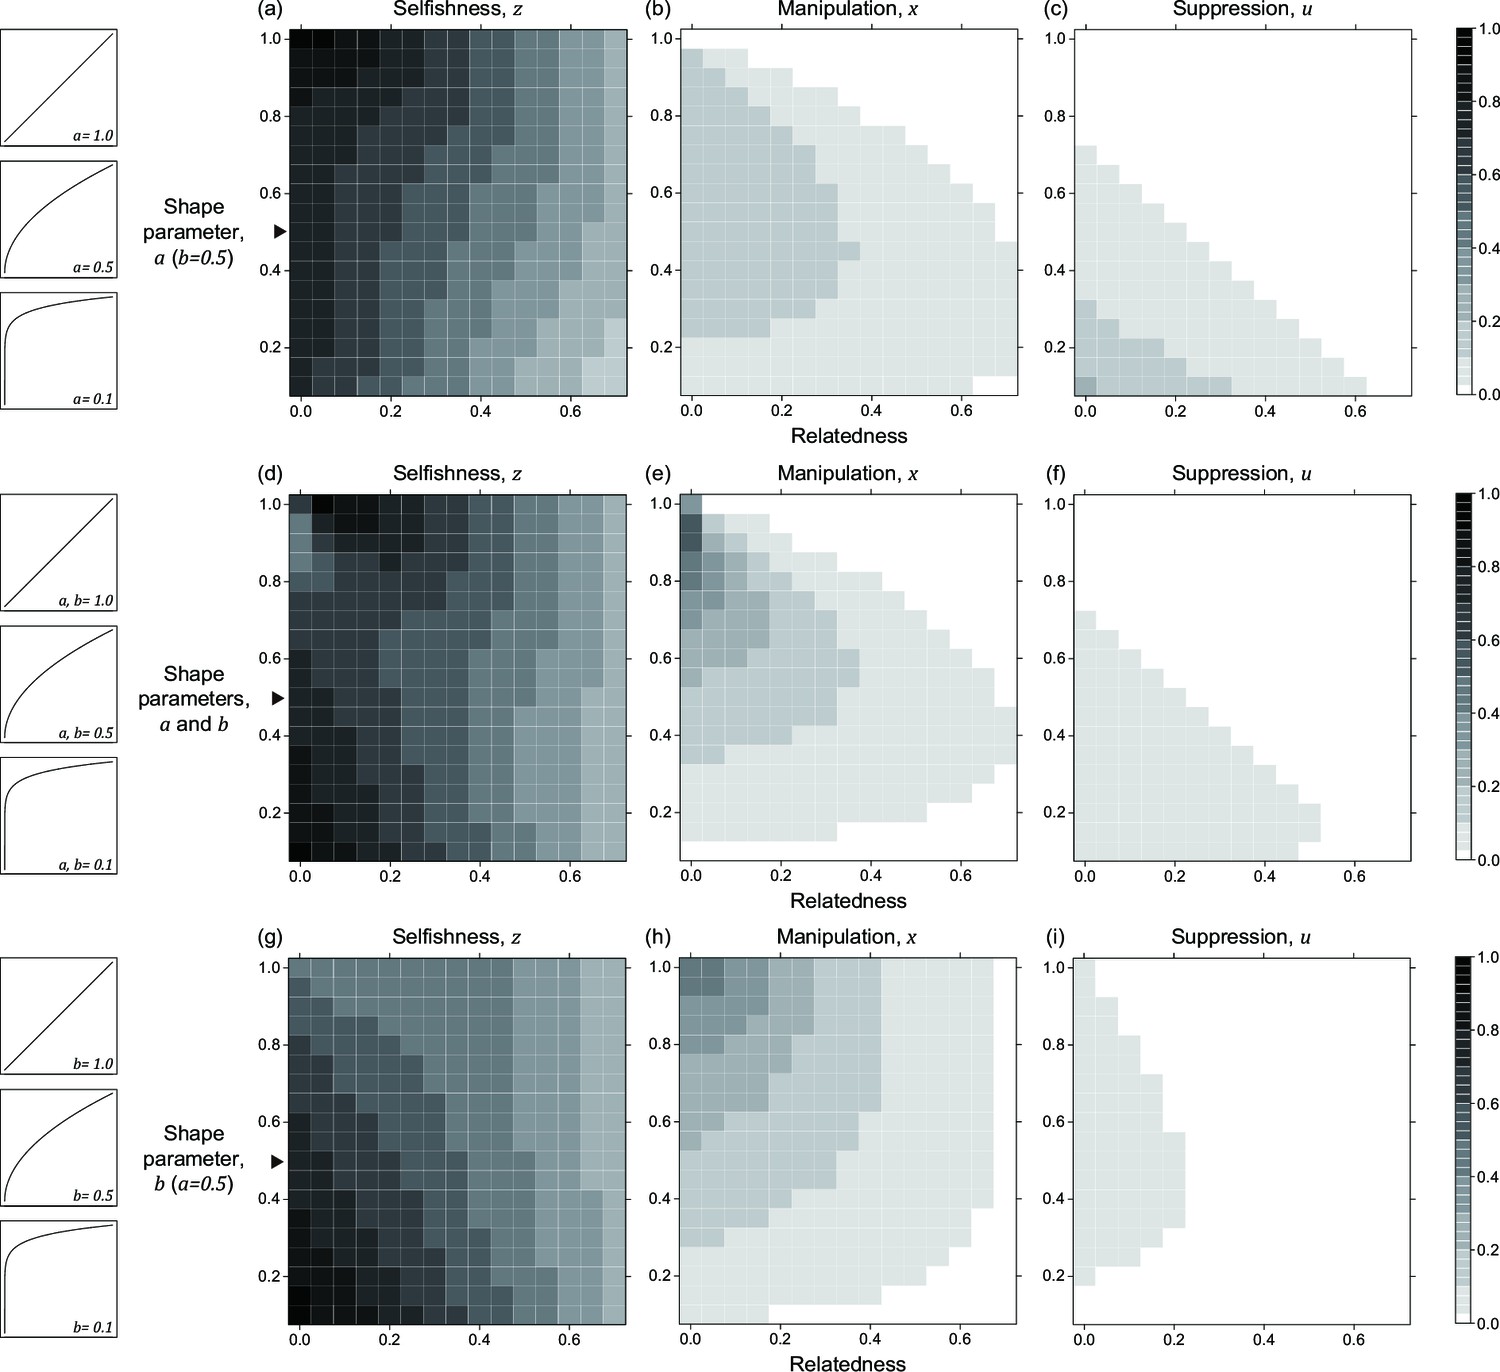
Nonlinear returns of manipulative cheating and its suppression.
Panels (a), (b), and (c) show the predicted ESS level of selfishness (), manipulation (), and suppression () respectively, for different values of relatedness (, x-axis). From top to bottom, each row of panels presents varying different parameters on y-axis: the shape parameter for manipulative cheating (a-c; ), both parameters (d-f; and ), and the shape parameter for suppression (g-i; ). The black triangle indicates the horizontal row where the parameter settings are identical to each other and to Figure 2. We have focused on decelerating function for shape parameters because it resembles the nature of communication (Appendix 1—6.1).
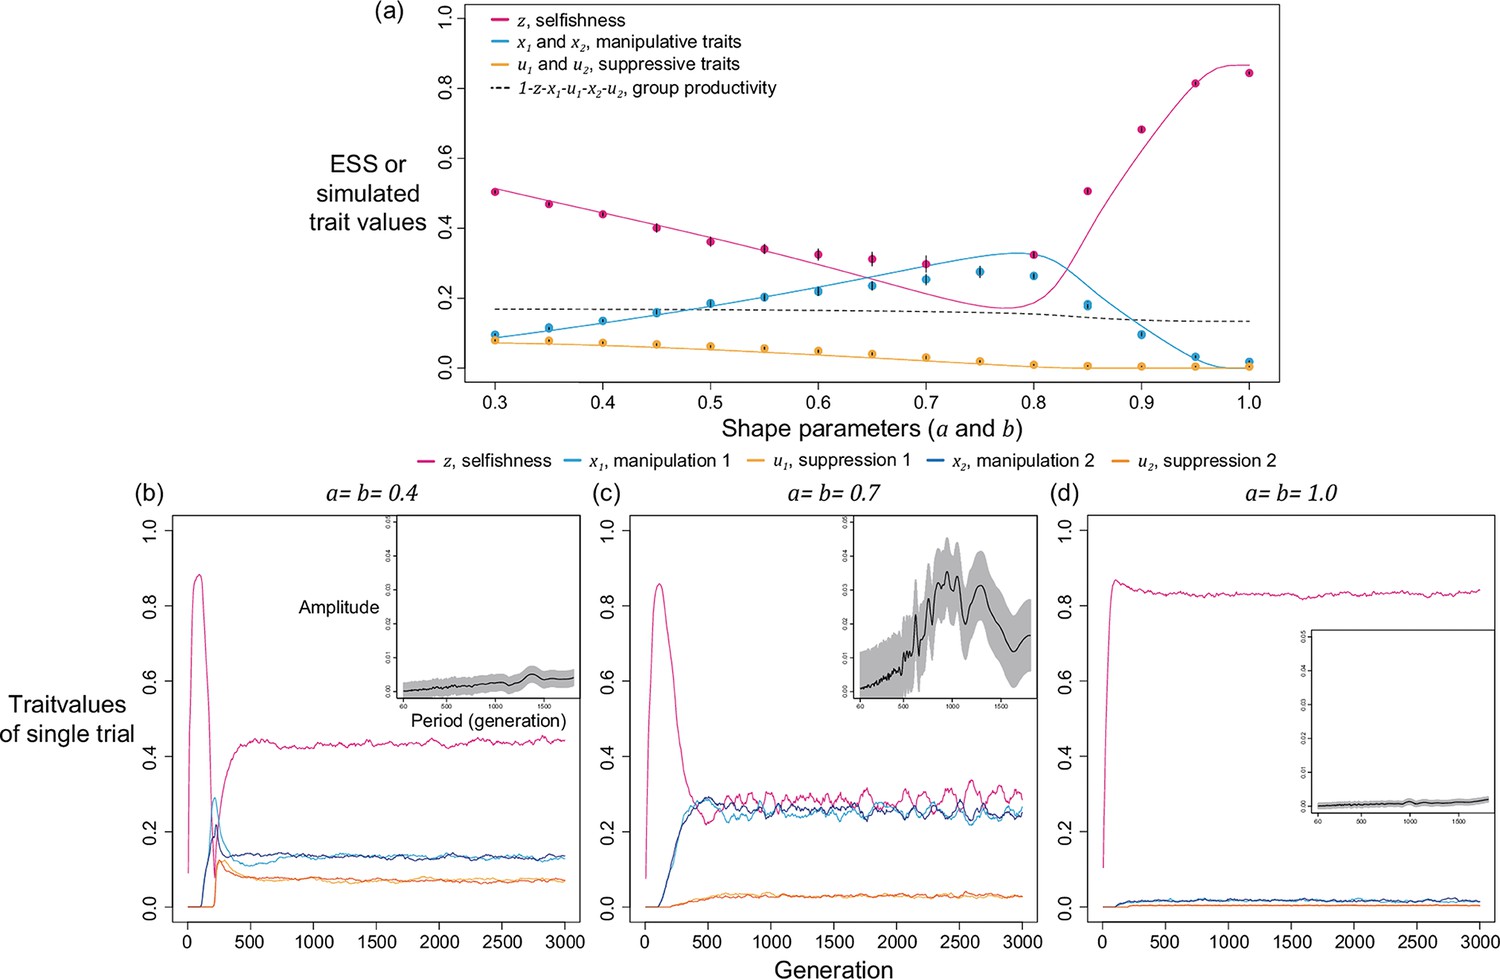
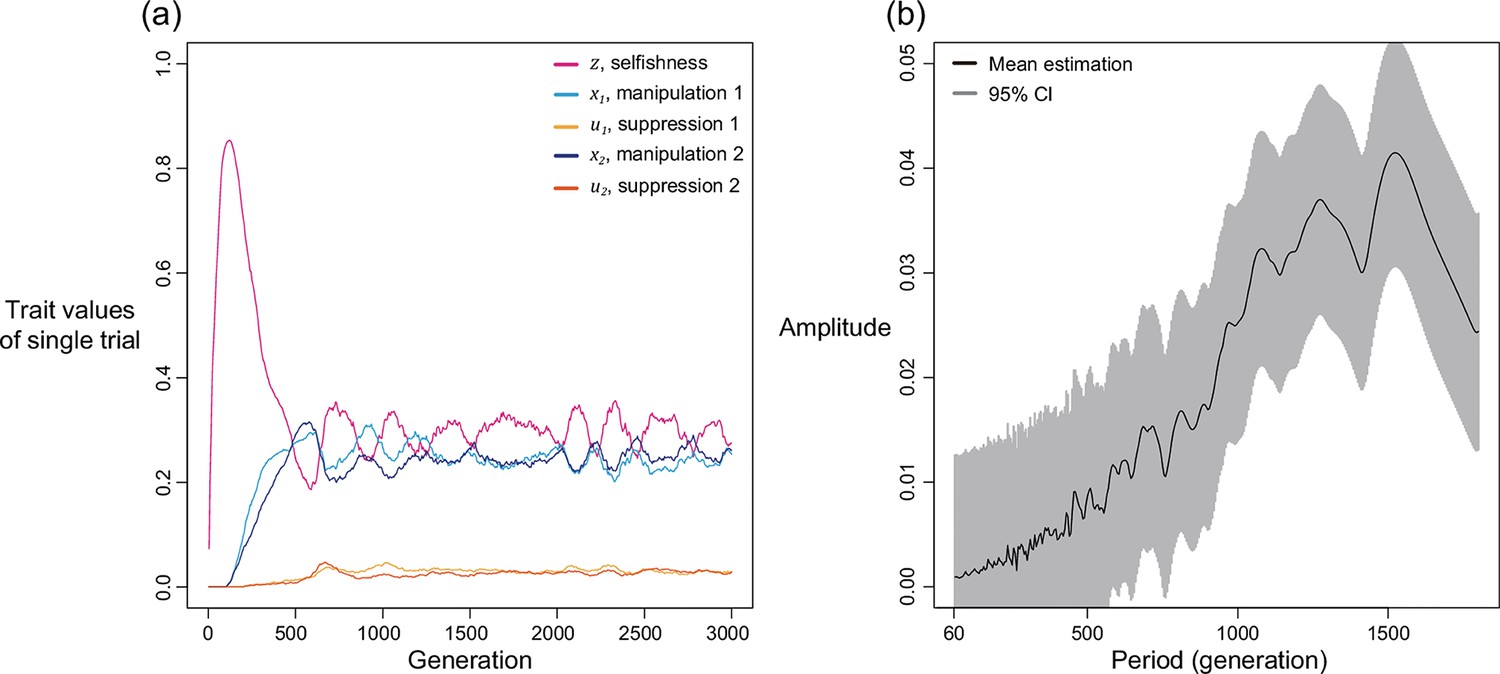
Figure 4

Selfishness and manipulative cheating traits can oscillate when there are two mechanisms for manipulation and suppression.
(a) An example of oscillating dynamics when shape parameters are intermediate, and relatedness is relatively low (; ). Broader analysis and more details are provided in Appendix 1—4. (b) The estimated amplitude of the time series of selfishness by harmonic regression. Harmonic regression is an analysis of time series to show the significance of periodic oscillation, where low period means frequent recurrent pattern, and high period means recurrence ager a long span. Here, 10 repeated simulations were used and only the last 75% of the 3000 generations was analysed, after selfishness is roughly stabilised. The analysis shows maximal amplitude is found at period of 815 generations with p-value of 1.8035x10⁻⁵. Mean estimation is shown in black curve whereas the 95% confidence interval is illustrated as the grey area (F-test; ).
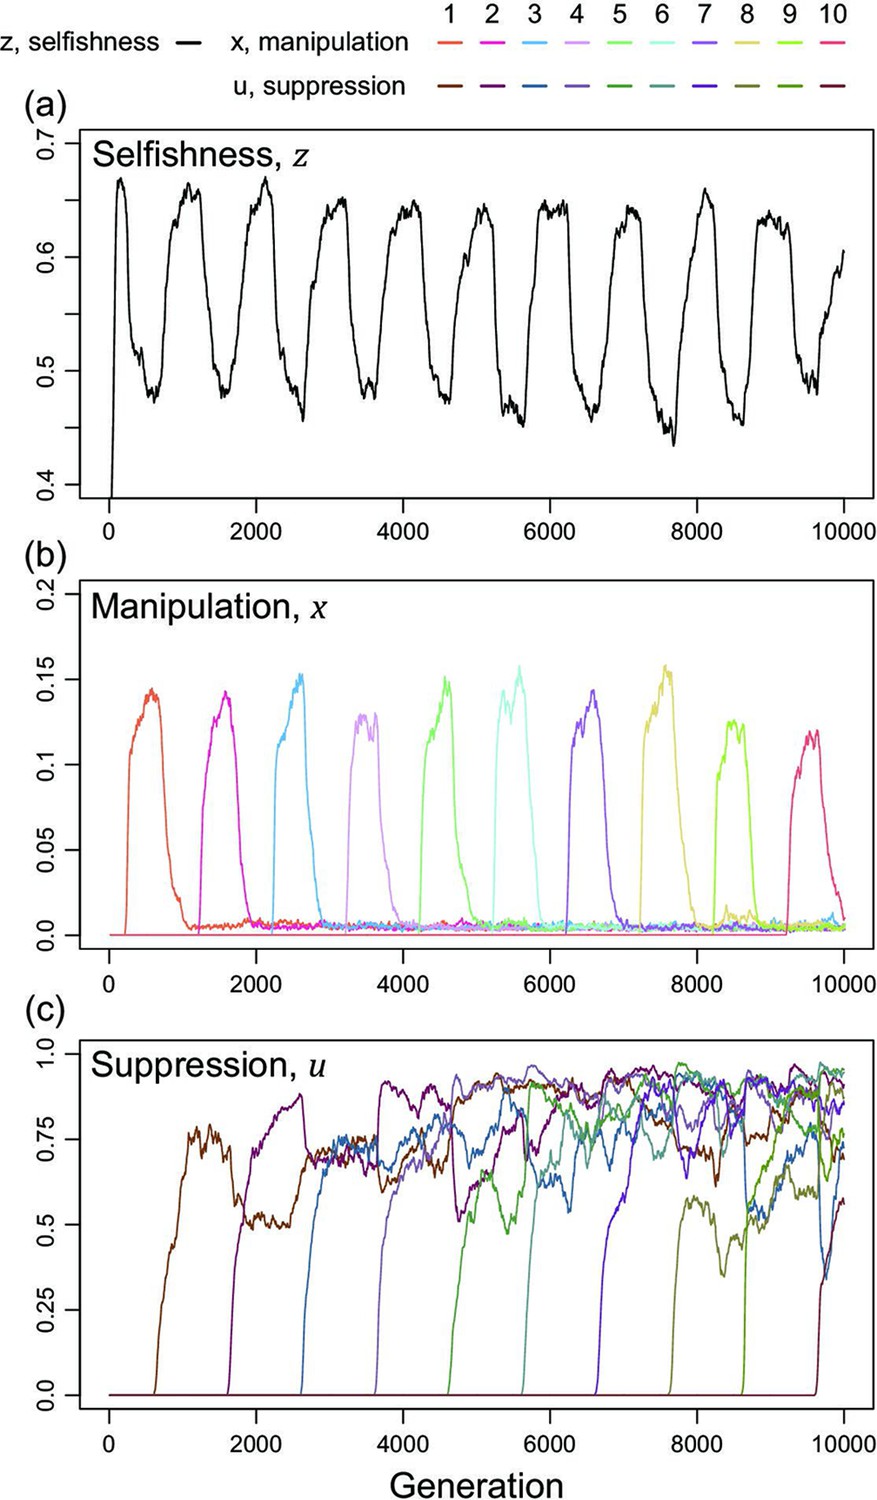
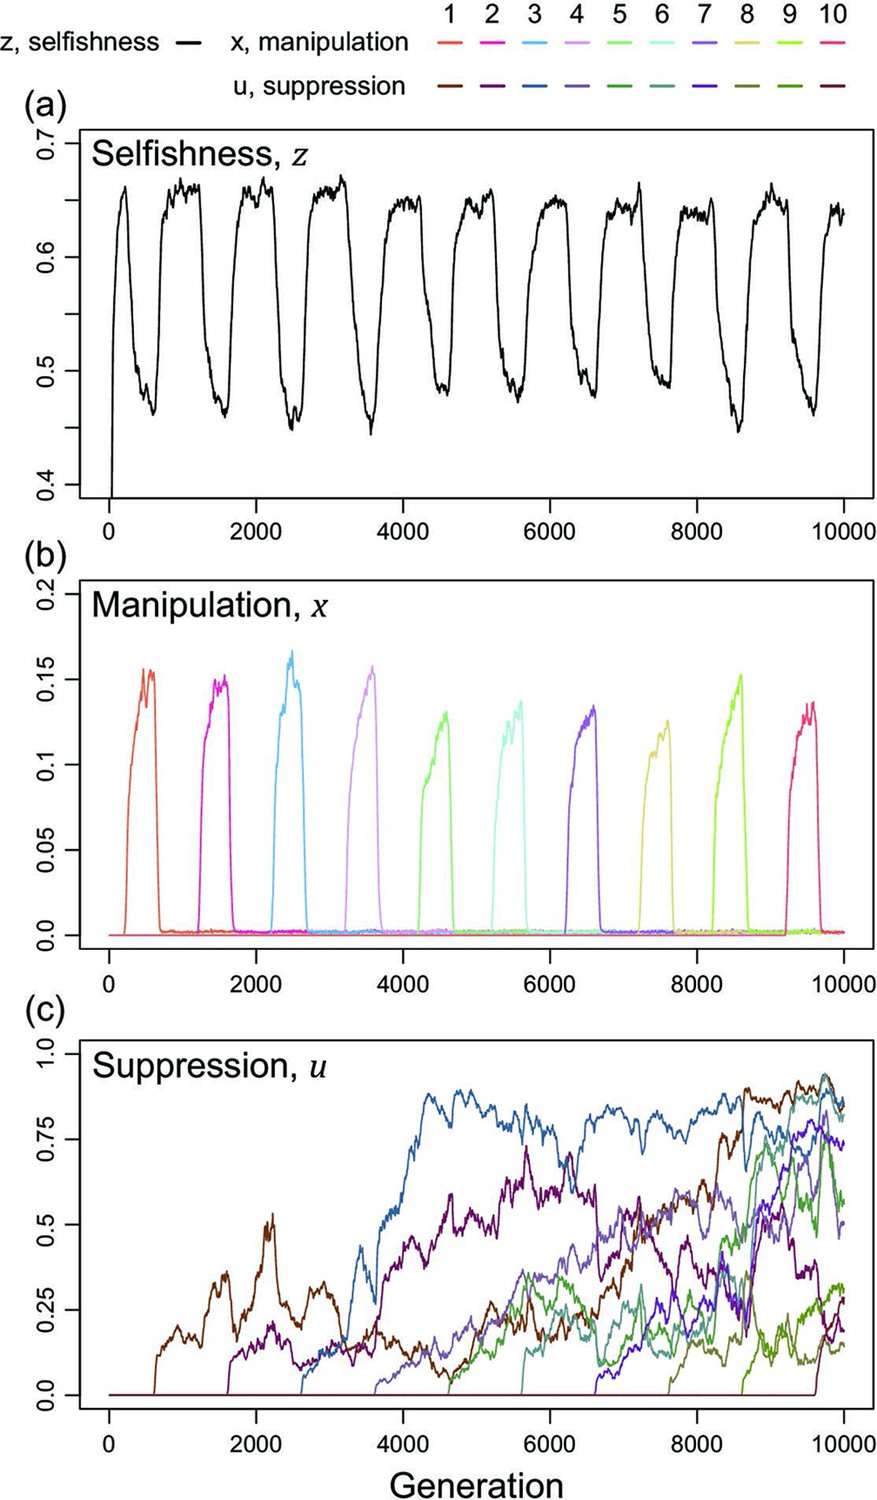
Figure 5
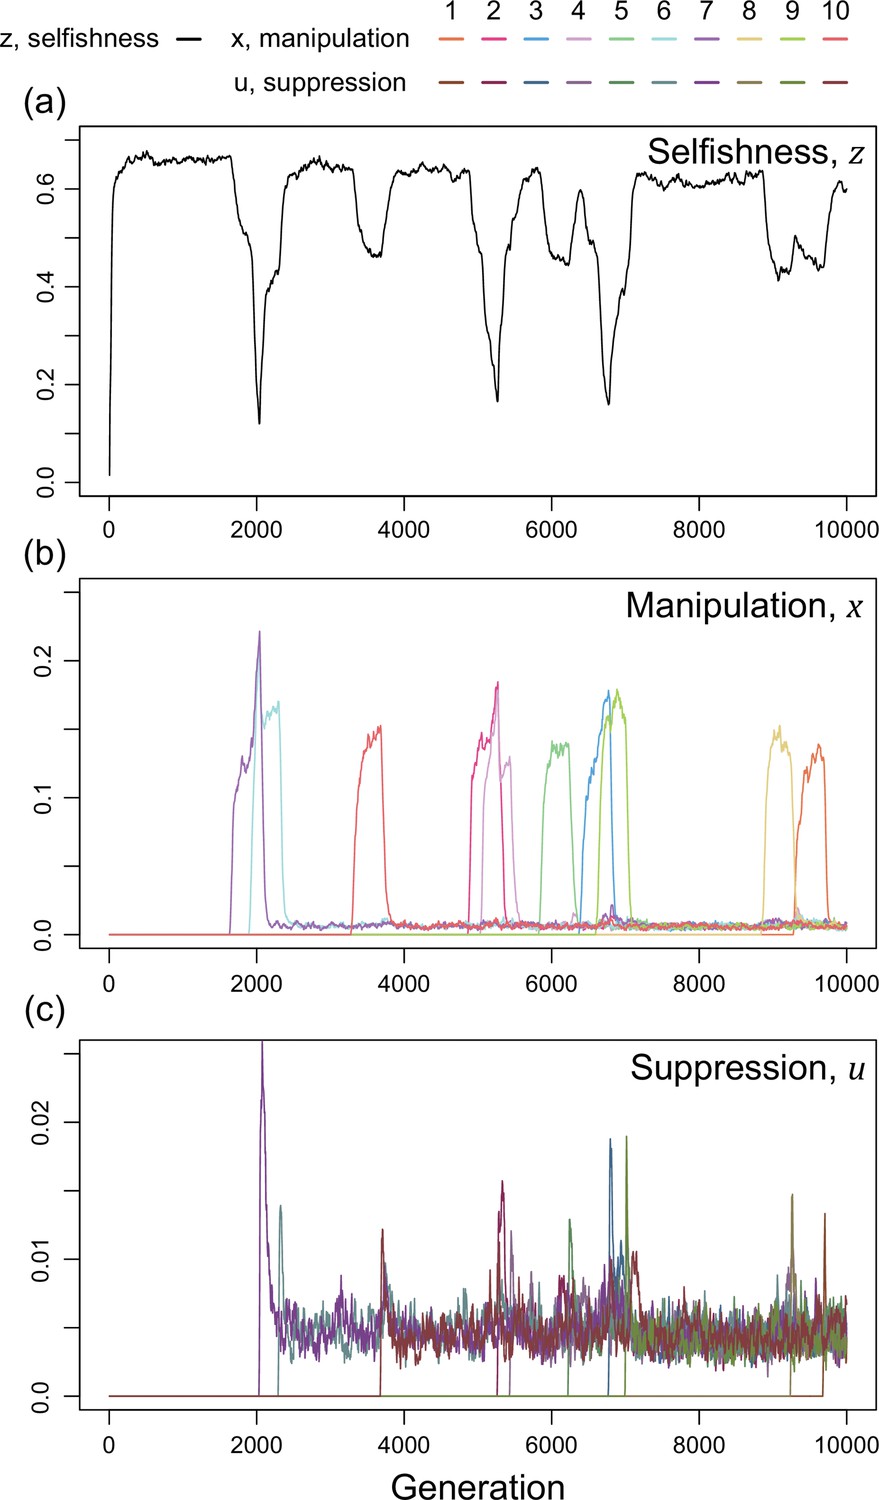
Time series of trait dynamics of the simulations when new mechanisms for manipulation and suppression are introduced at different time points.
Selfishness is shown in the upper panel, the ten manipulative traits are shown in the middle panel, and the ten suppressive traits are shown in the bottom panel. The y-axis is scaled differently across the panels, to match the levels of variation. Each manipulative and suppressive trait are mutated to non-zero values in arbitrary time points for better visualisation. The shape parameters are set to for manipulation and for suppression, and the relatedness is . All data are from a single representative simulation.
Appendix 1—figure 1
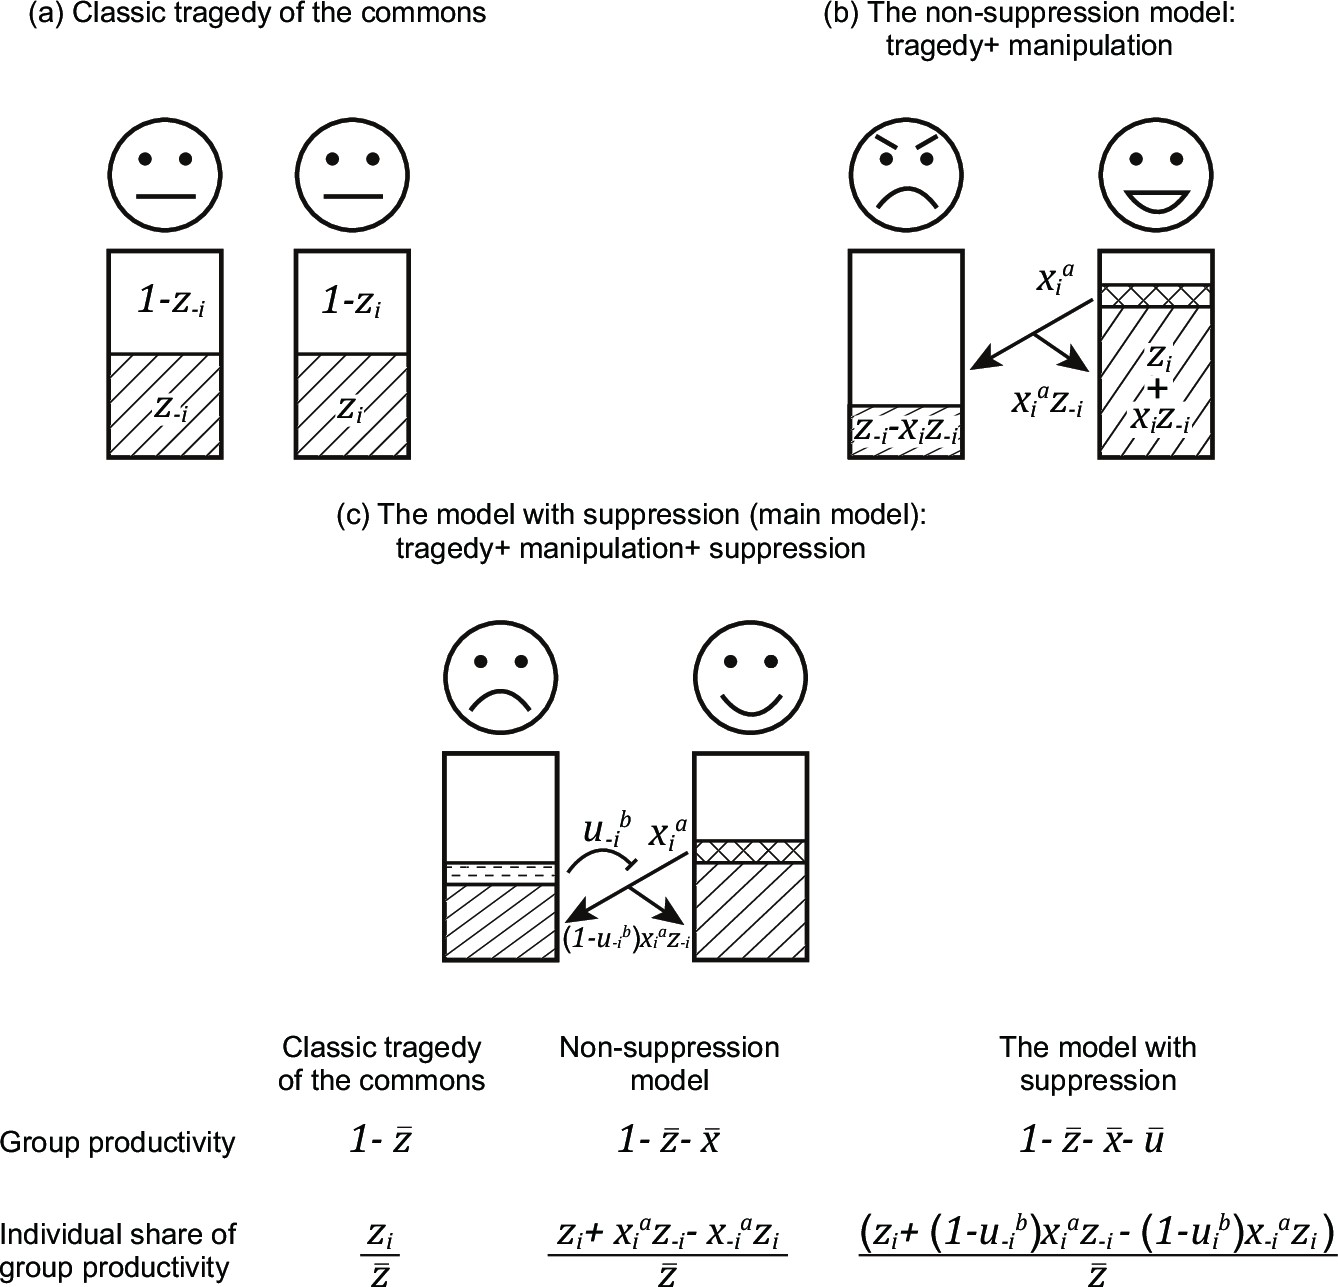
Comparison between the classic tragedy of the commons, the non-suppression model, and the model with suppression.
Here, we illustrate three models with gradually increasing complexity. (a) In the classic tragedy of the commons, individuals can choose to invest resources into reproduction () or group productivity (cooperation; ). (b) In the non-suppression model, individuals can also manipulate others (), to make them invest more in group productivity. (c) In the model with suppression, individuals can also suppress (block) the manipulation by others (). Within each model, arrows indicate manipulation, the blockings indicate suppression, and the outcome of the two actions are expressed below the arrows. The fitness of an individual is divided into two components: group productivity and share of group productivity, both shown at the bottom of the figure.
Appendix 1—figure 2
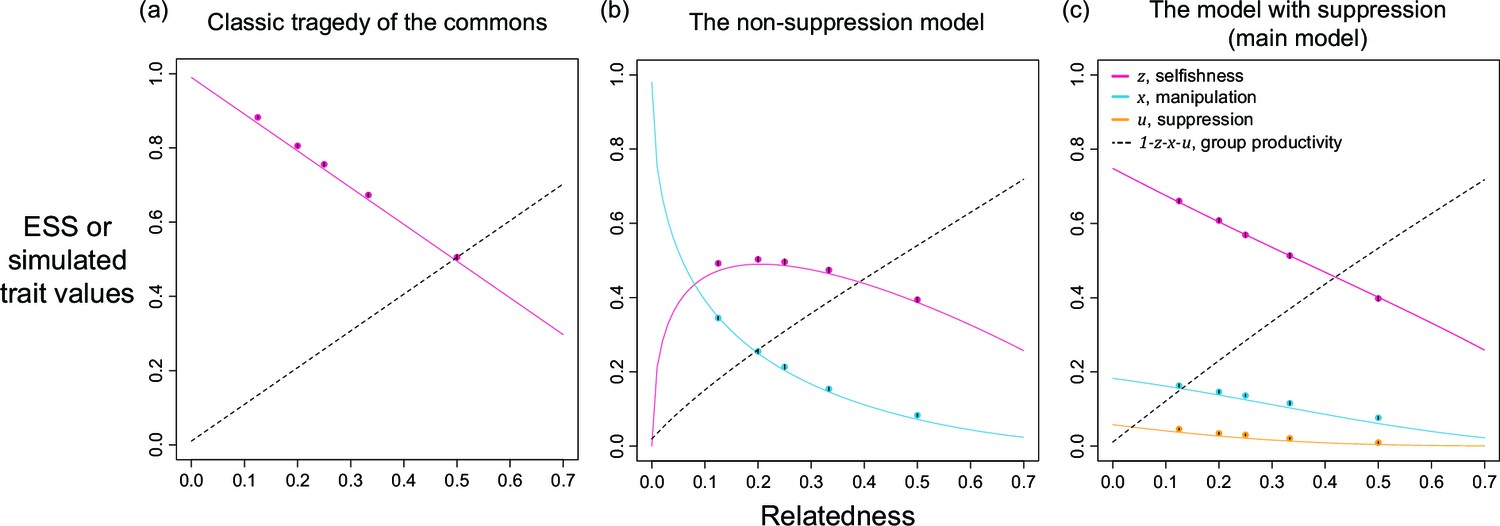
Selfishness, manipulation, and suppression of manipulation.
The panels show the ESS predictions and simulation results for: (a) tragedy of the commons (only selfishness evolves); (b) the non-suppression model (selfishness and manipulation evolve); (c) the model with suppression (selfishness, manipulation, and suppression of manipulation evolve). The solid lines show the ESS predictions, and the dots show the results of our individual-based simulations (=0.5).
Appendix 1—figure 3
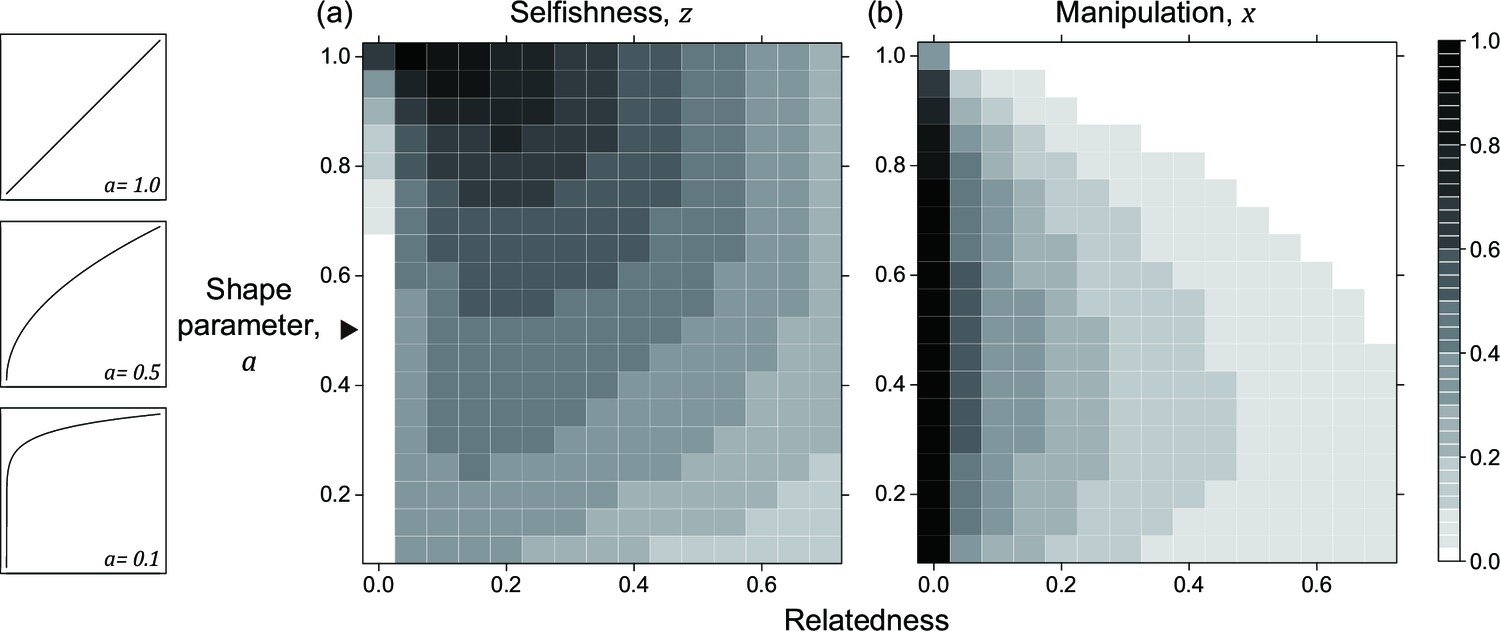
Nonlinear returns in the non-suppression model.
Panels (a) and (b) show the predicted ESS level of selfishness () and manipulation () respectively, for different values of relatedness () and the shape parameter (). The black triangle indicates the horizontal row where the parameter settings are identical to each other and to Appendix 1—figure 2b.
Appendix 1—figure 4
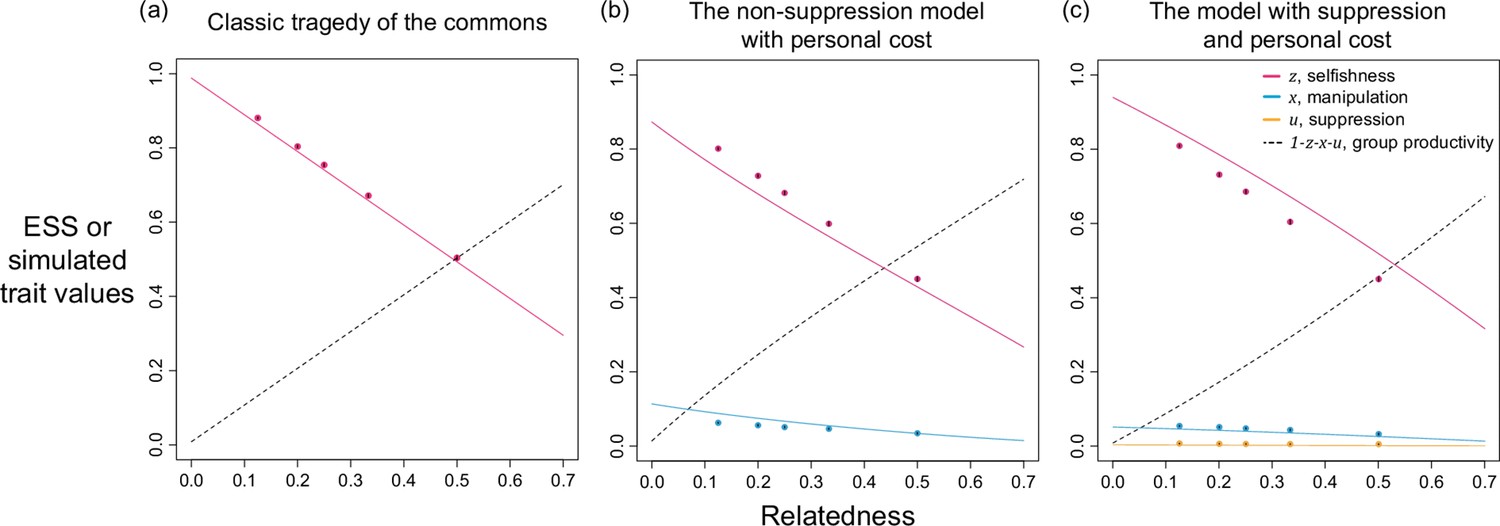
Selfishness, manipulation, and suppression of manipulation.
The panels show the ESS predictions and simulation results for: (a) tragedy of the commons (only selfishness evolves); (b) the non-suppression model with personal cost (both selfishness and manipulation evolve); (c) the model with suppression and personal cost (selfishness, manipulation, and suppression evolve). All results are generated with the same shape parameters as other figures ().
Appendix 1—figure 5
Selfishness, manipulations, and suppressions of manipulation in the scenario with two mechanisms to manipulate and suppress manipulation, where all traits are introduced at the same time point.
Solid lines show the ESS predictions, and dots show the results of our individual-based simulations ().
Appendix 1—figure 6
Oscillation dynamics of selfishness and manipulation occur in some ranges of shape parameters in the scenario with two mechanisms when relatedness is low ().
(a) ESS predictions and simulation results from the model, where disagreement between two approaches is found when shape parameters are between 0.6 and 0.8. (b–d) Time series of simulations under various relatedness settings. Each panel shows the time series of traits, and the analysis from harmonic regression is shown in the inset (same as Figure 4). Harmonic regression found the greatest amplitude in the period of 1385 generations and p-value of 1.5333x10⁻² when shape parameters are 0.4; period of 815 generations and p-value of 1.8035x10⁻⁵ when shape parameters are 0.7; period of 1760 and p-value of 2.5202x10⁻³ when shape parameters are 1.0.
Appendix 1—figure 7
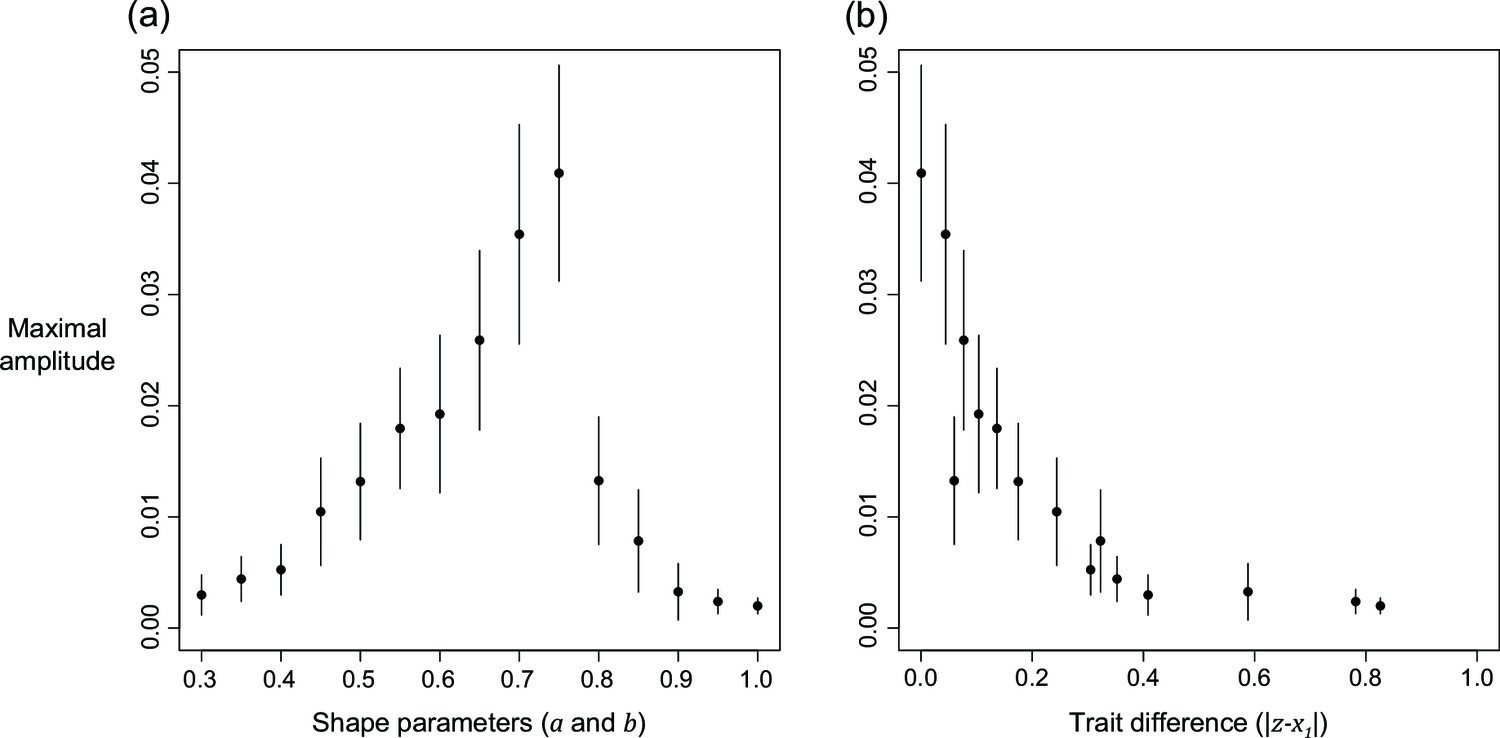
The relation of maximal amplitude from harmonic regression in response to (a) shape parameters, and (b) distance in evolved levels of selfishness and manipulation.
Relatedness is set to 1/8 and the error bars are the 95% confidence intervals. Details of the analysis are described in Appendix 1—7.5.
Appendix 1—figure 8
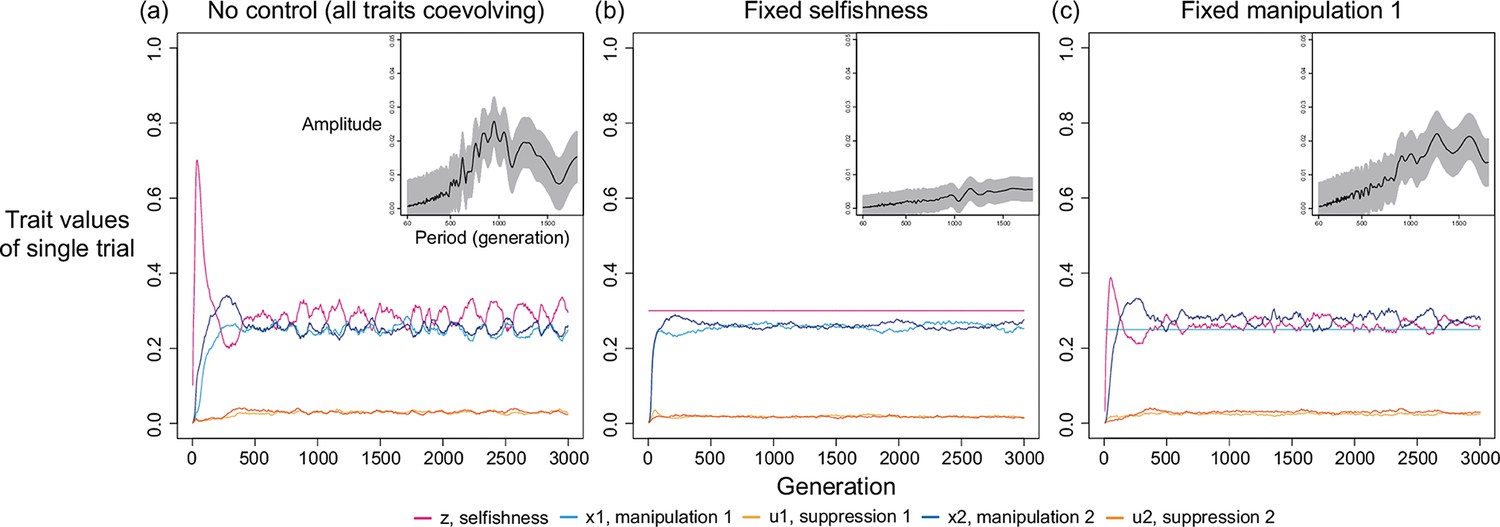
Oscillation disappears when selfishness is controlled and fixed at a value.
We use harmonic regression to instead analyse the dynamics of manipulation 2 in this figure, because selfishness and manipulation 1 are fixed in some panels. The level of fixed selfishness and manipulation are determined by the ESS predicted in game-theoretical analysis, where relatedness is 1/8 and shape parameters are 0.7. Harmonic regression found greatest amplitude in the period of 825 generations and p-value of 2.1045x10⁻⁴ when all traits coevolve; period of 1450 generations and p-value of 2.5239x10⁻⁴ when selfishness is fixed; period of 1575 and p-value of 5.5099x10⁻⁴ when manipulation 1 is fixed.
Appendix 1—figure 9

Oscillation does not occur when traits are inherited independently without linkage.
(a) Time series of coevolving traits when shape parameters are intermediate, and relatedness is low (; ). (b) The estimated amplitude of the time series of selfishness by harmonic regression. (c) Analytical predictions and simulation results from the model without linkage of traits.
Appendix 1—figure 10
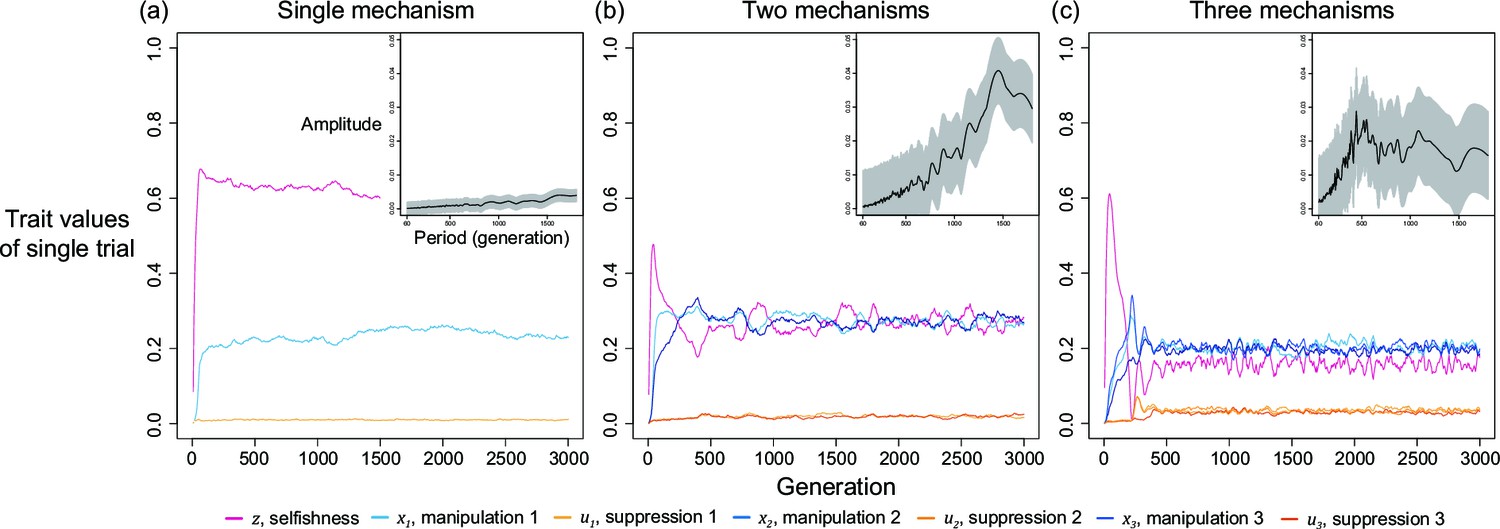
Oscillation happens when there is more than one mechanism to manipulate and suppress.
Here, relatedness is 1/8 and shape parameters are 0.75. Harmonic regression found greatest amplitude in the period of 1800 generations and p-value of 4.7899x10⁻³ in single-mechanism simulations; period of 1475 generations and p-value of 2.7475x10⁻⁵ in two-mechanism simulations; period of 390 and p-value of 1.4544x10⁻² in three-mechanism simulations.
Appendix 1—figure 11
Selfishness and manipulative cheating traits oscillate slower when mutation rate is lower.
In this figure, we set mutation rate is half the size of which in all other simulation (; ).
Appendix 1—figure 12
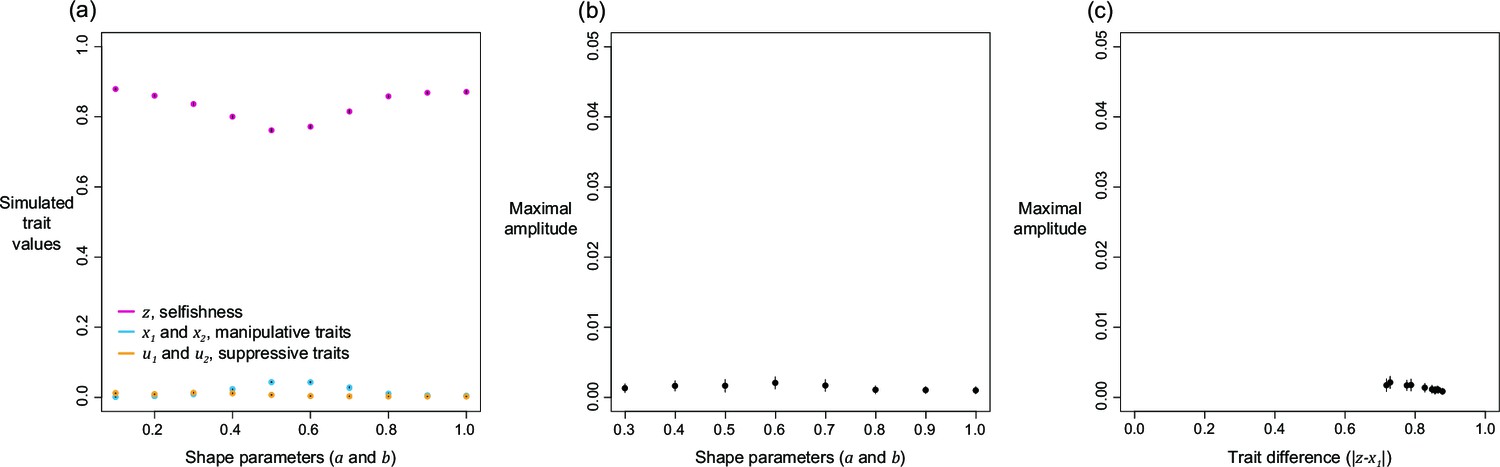
The properties of personal cost model with two mechanisms to manipulate and suppress.
(a) The simulated level of selfishness, manipulative cheating, and suppression, (b) the relation between maximal amplitude from harmonic regression and shape parameters (), and (c) the relation between maximal amplitude and trait difference in evolved selfishness and evolved manipulation.
Appendix 1—figure 13

Effects of recombination on the simulated level of selfishness, manipulation, and suppression.
Each panel has a specific relatedness setting (R=0.5, 0.25, or 0.125), and various recombination rates (0, 0.25, 0.5, 0.75, and 1). Two scenarios are simulated: (a–c) single mechanism to manipulate and suppress, (d-f) two mechanisms. The single mechanism results, where shape parameters are 0.5, extended the discussion in Figure 2 (no recombination). The two mechanisms results, where shape parameters are 0.7, bridged the gap between Appendix 1—figure 6 and Appendix 1—figure 9 of this appendix as the former is equal to recombination rate of 0 and the latter is equal to 1.
Appendix 1—figure 14
Arms race with an unconditional and fixed amount of cost for suppressing manipulative cheating.
Suppression is costly in group productivity when it exceeds 0.05, and the cost is fixed at 0.01 regardless of the trait value of suppression. Shape parameters are equal for manipulation and suppression () and relatedness is 1/3.
Appendix 1—figure 15
Arms race with a conditional and fixed cost for suppression.
Suppression is costly only when both manipulative cheating and suppression are above 0.05, and the cost of suppression is fixed at 0.05 regardless of the trait value. Shape parameters are the same as Figure 5 ( and ) and relatedness is 1/3.
Additional files
Download links
A two-part list of links to download the article, or parts of the article, in various formats.
Downloads (link to download the article as PDF)
Open citations (links to open the citations from this article in various online reference manager services)
Cite this article (links to download the citations from this article in formats compatible with various reference manager tools)
The evolution of manipulative cheating
eLife 11:e80611.
https://doi.org/10.7554/eLife.80611


