Phase separation of competing memories along the human hippocampal theta rhythm
- Centre for Human Brain Health, School of Psychology, University of Birmingham, United Kingdom
- Research Group Adaptive Memory and Decision Making, Max Planck Institute for Human Development, Germany
- Centre for Cognitive Neuroimaging, School of Neuroscience and Psychology, University of Glasgow, United Kingdom
Figures
Figure 1
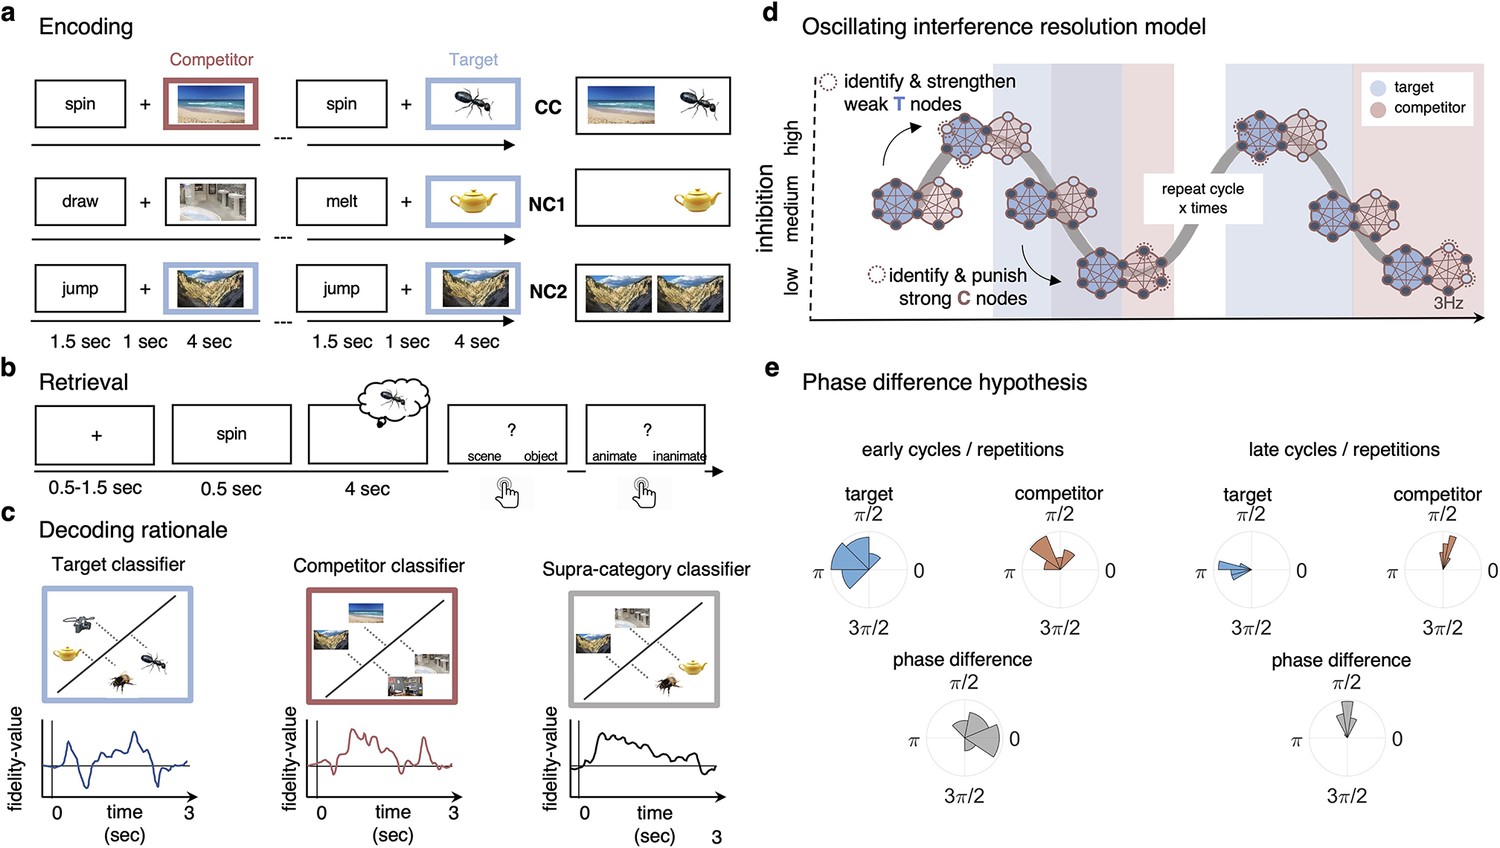
Paradigm and rationale for decoding analyses.
(a) At encoding, subjects (n = 24) were instructed to memorise the word–image associations using an imagery strategy and constantly update their memory with the most recent associate to each word. The experiment consisted of three different conditions. In non-competitive single-exposure condition (NC1), subjects encoded the word together with one associate; in the non-competitive dual-exposure condition (NC2), subjects encoded the word with the same associate twice; and in the competitive condition (CC), subjects encoded the word together with two different associates (one scene and one object). (b) At retrieval, participants were instructed to remember the most recently encoded associate when prompted with a word cue. (c) Subordinate-category classifiers (animate/inanimate for objects, and indoor/outdoor for scenes) were used to obtain independent evidence for target and competitor reactivation at each sample point. Note that the superordinate (object/scene) classifier cannot discriminate between evidence for the target and against the competitor, and vice versa. (d) Hypothesised reactivation dynamics of targets and competitors relative to theta phase, based on the oscillating interference resolution model (adjusted from Norman et al., 2006). Blue circles represent the target memory, pink circles the competitor memory. Target and competitor memories consist of a number of features (small circles), some distinct and some overlapping, that can be either active (dark blue) or inactive (light blue) at any given point along the phase of the oscillation. When inhibition is high, only a few features of the target memory are active initially. The transition from medium to high levels of inhibition is used in the model to identify and strengthen weak target features, such that these nodes have a higher likelihood of becoming active in future high-inhibition phases (see right portion of the graph). In contrast, during the low-inhibition phase, features of both target and competitor memories are simultaneously active. The transition from medium to low levels of inhibition is used to identify and punish overly strong competitor features, which will in turn be less likely to activate even in low-inhibition phases in the future. (e) An illustration of the expected phase of maximum target and competitor reactivation, and their phase difference, in the first and last repetition of retrieval. Note that in this example target and competitor memories show a consistent phase angle across subjects in the third repetition; however, this is not a necessary assumption for finding consistent phase separation.
Figure 2 with 2 supplements
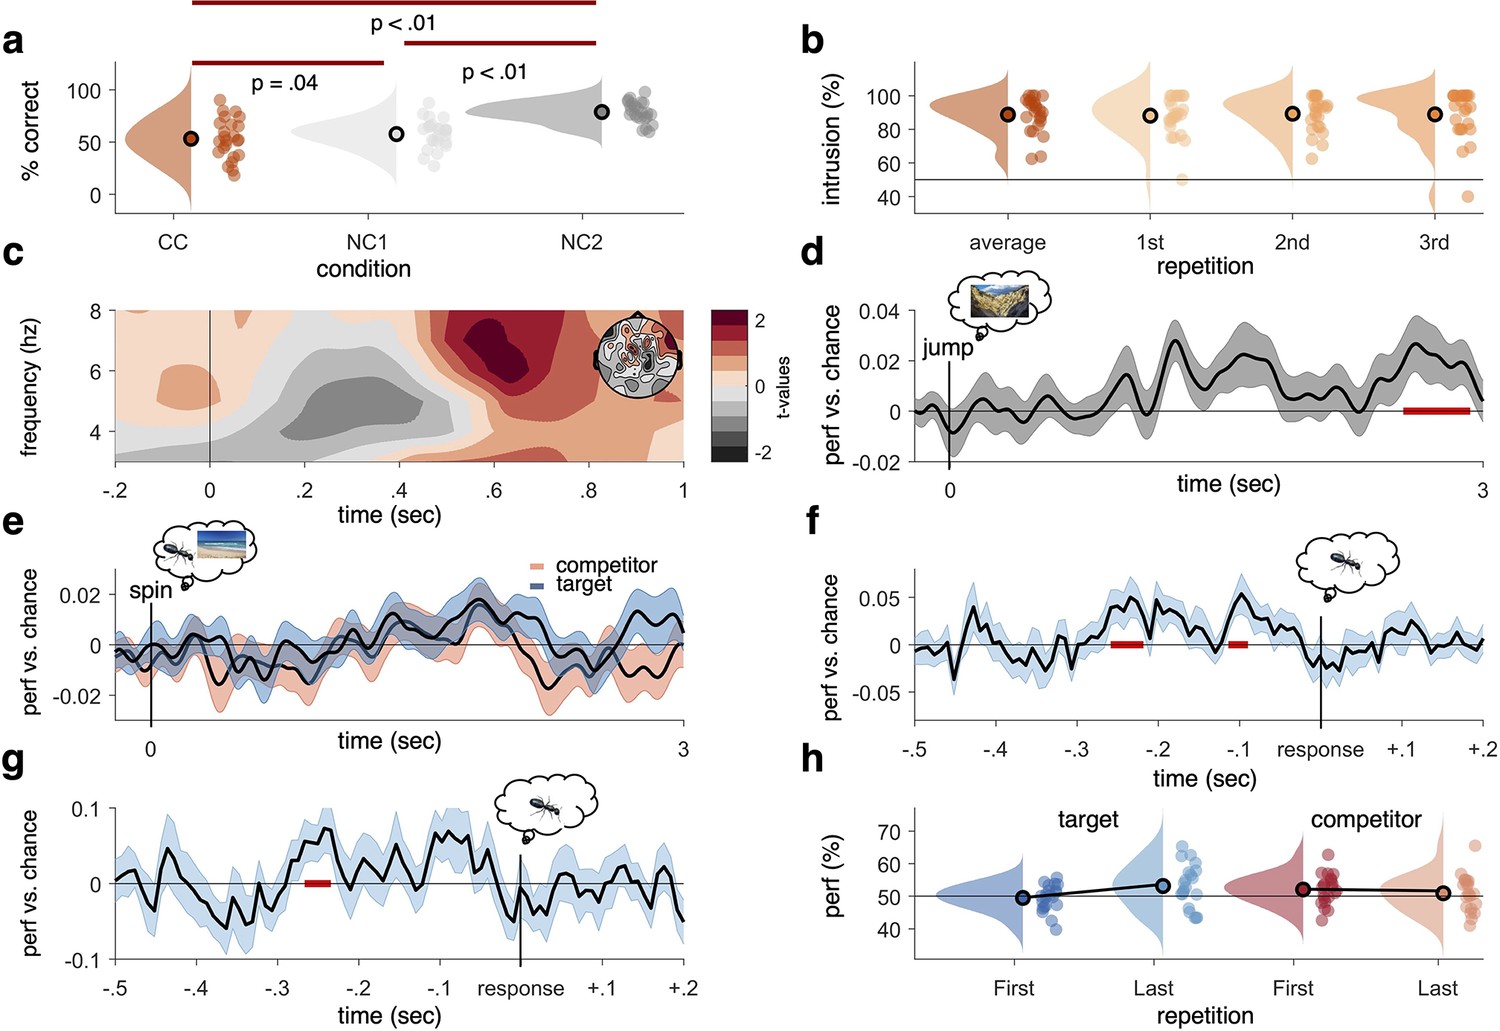
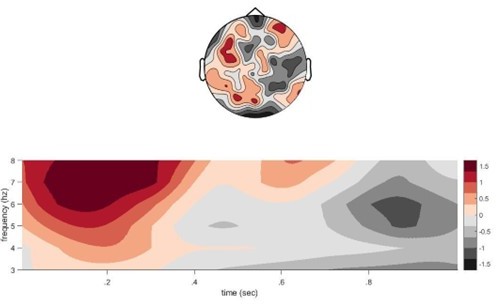
Behavioural results, time–frequency analysis of theta power, and decoding accuracies in the non-competitive (NC) and competitive conditions (CCs).
(a) As expected, we found that memory accuracy (on the two follow-up questions combined), averaged across the three recall repetitions, was significantly impaired when encoding a given word cue with two different images (CC) compared to just one image (NC1), indicative of proactive interference (red line indicating significant difference at p<0.05, using Paired Samples t-test). Recall performance also benefited from learning a cue word together with the same image twice (NC2) compared to once (NC1). (b) The average intrusion score shows that errors were not random (50% black line), but instead were significantly biased towards the competitor’s subcategory. The proportion of intrusions did not decrease significantly across repetitions. (c) Contrasting oscillatory power elicited by the cue in the CC and NC2 conditions resulted in a significant cluster (500–700 ms, darkest red, cluster-based permutation < .05) in the theta frequency range (3–8 Hz), most prominently over right frontal electrodes (see right inlay). (d) Results of a linear discriminant analysis (LDA)-based classifier trained and tested on the non-competitive conditions (NC1 and NC2) at retrieval, showing a cluster of significantly above-chance decoding accuracy approximately 2500–3000 ms post-cue onset, with an earlier decoding peak around 1–2 s not surviving cluster correction. Graph shows mean and SEM. (e) Results from a classifier trained on the non-competitive conditions (NC1 and NC2) and tested on the CC. Separate classifiers were used to detect target (blue) and competitor (red) evidence at the level of subcategories. No significant cluster emerged when averaging across all repetitions. (f) Realigning the trials to the time of subjective recollection (i.e. response), instead of cue onset, significant target decoding was found in the CC when averaging over all repetitions. (g) Response-locked target decoding in the CC was also significantly higher on correct than incorrect trials. (h) Using a repeated measures ANOVA to con decodability in the first and third retrieval repetition for target and competitor memories, respectively, yielded a significant interaction such that evidence for target memories increased as a function of repetition, whereas evidence for competitor memories decreased as a function of repetition. For behavioural analyses, 24 participants were included, whereas for neurophysiological analyses 21 participants were included. Red line in panel (d, f, g), indicates time windows of significant clusters at pcluster<0.05 corrected for multiple comparisons across time.
Figure 2—figure supplement 1

Behavioural performance across repetitions, correlation between intrusion score and memory performance, and correlation between intrusion score and decoding performance.
(a) Memory performance (n = 24) in the competitive condition (CC) condition, plotted as the probability of answering both follow-up questions correctly, did not significantly change across repetitions (Z = –0.73, p=0.47; Wilcoxon signed-rank test of linear slope against zero). (b) Correlation between memory performance in the non-competitive condition (NC1 and NC2) and the number of intrusion errors in the CC, with each dot representing one participant’s z-scored memory accuracy. A correlation of r = –0.37 (p=0.037) was found such that more intrusions in the CC were related to lower memory performance in the baseline conditions. (c) Within the CC, intrusion score in the first repetition positively correlated (r = 0.446, p=0.04) with competitor decoding performance, such that the stronger the observed reactivation of competitor memories, the more intrusion errors participants made.
Figure 2—figure supplement 2
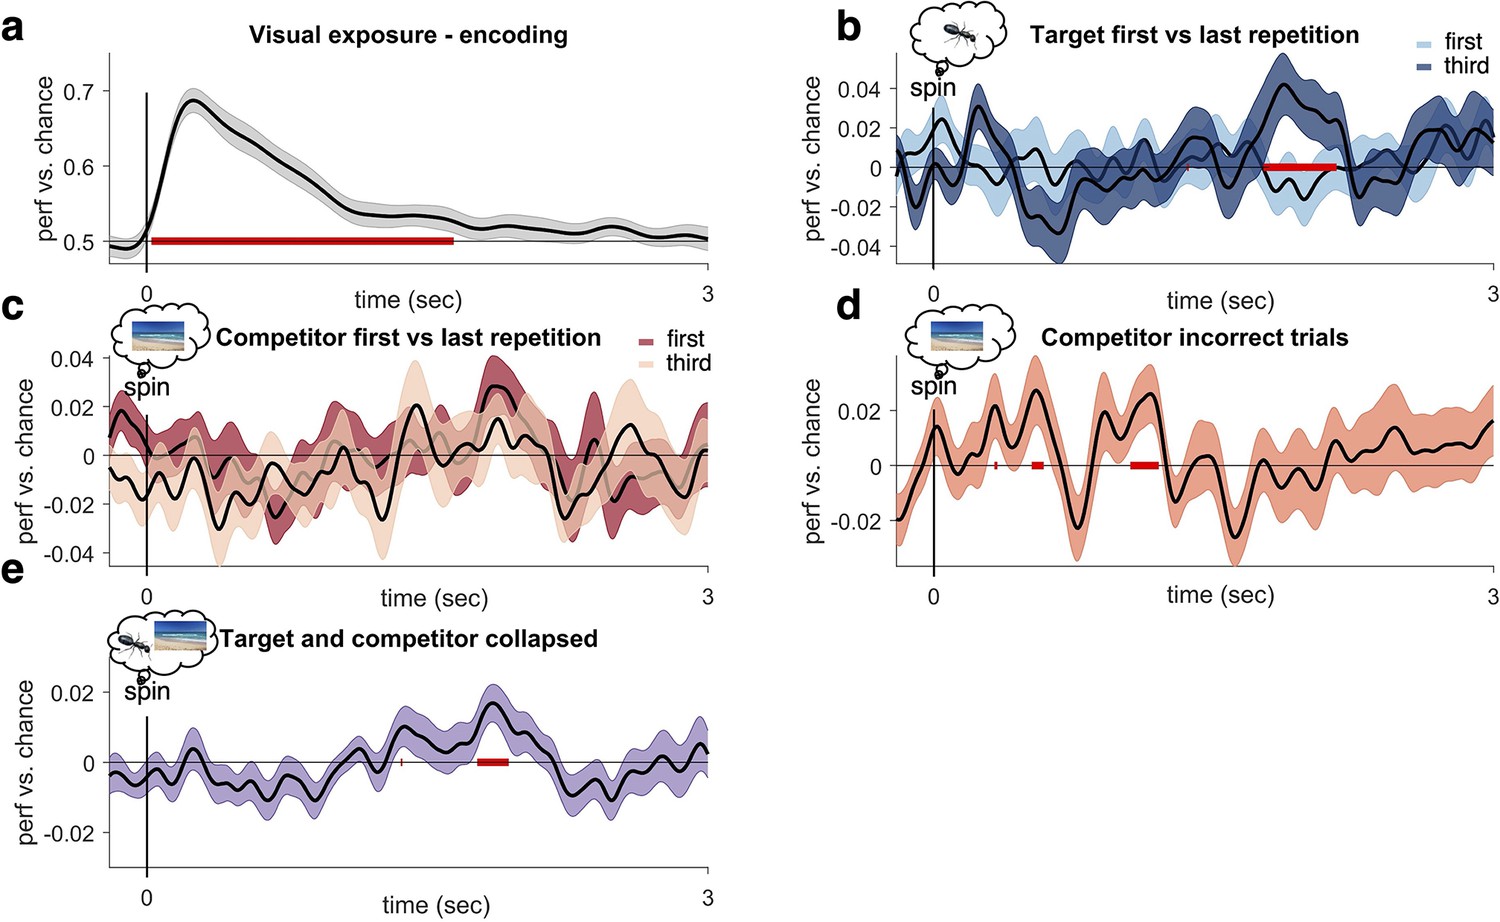
Additional decoding analyses during encoding and retrieval.
(a) Linear discriminant analysis (LDA)-based decoding of image class during visual exposure, conducted as a sanity check. Magnetoencephalography (MEG) trial timecourses were smoothed with a 40 ms Gaussian window and thereafter baseline corrected from –200 to –50 ms before cue onset. The spatial pattern (i.e. sensor amplitudes) of all gradiometers at a given time point was used as feature vector to train the classifier. A 10-fold cross-validation repeated five times was used to minimise dependencies between training and testing data. This analysis revealed a cluster of significantly above-chance decoding performance peaking around 150 ms after image onset. (e) To identify an unbiased time window (i.e. not biased towards target or competitor decoding), we collapsed classification accuracy over target and competitor memories and averaged across all retrieval attempts. We then tested for changes over repetitions in this select time window. We found significant decoding (uncorrected p<0.05, with cluster not surviving stringent cluster correction, pcluster=0.15) between 1.77 and 1.93 s after cue onset. (b) Contrasting target decoding between first and third repetition revealed significantly higher decoding (at pcluster<0.05) , in line with the pre-registered hypothesis. Testing the third repetition against chance revealed a significant (puncorr<0.05) peak of target decoding ranging between 1.81 and 2.08 s after cue onset, which did however now survive stringent cluster correction (pcluster=0.07). (c) When instead testing for a downregulation of competitor memories across retrieval attempts, despite a qualitative difference in the expected direction around 2 s, the contrast between first and third repetition did not reveal any statistically significant clusters (at pcluster<0.05), contrary to our pre-registered hypotheses. (d) Stronger competitor reactivation was found when only analysing incorrect trials across all repetitions, with peaks of early reinstatement (puncorr<0.05, not surviving cluster correction) around 500–1500 ms. For all analyses (a-e), n = 21 participants were included and the graphs show mean and SEM.
Figure 3 with 2 supplements
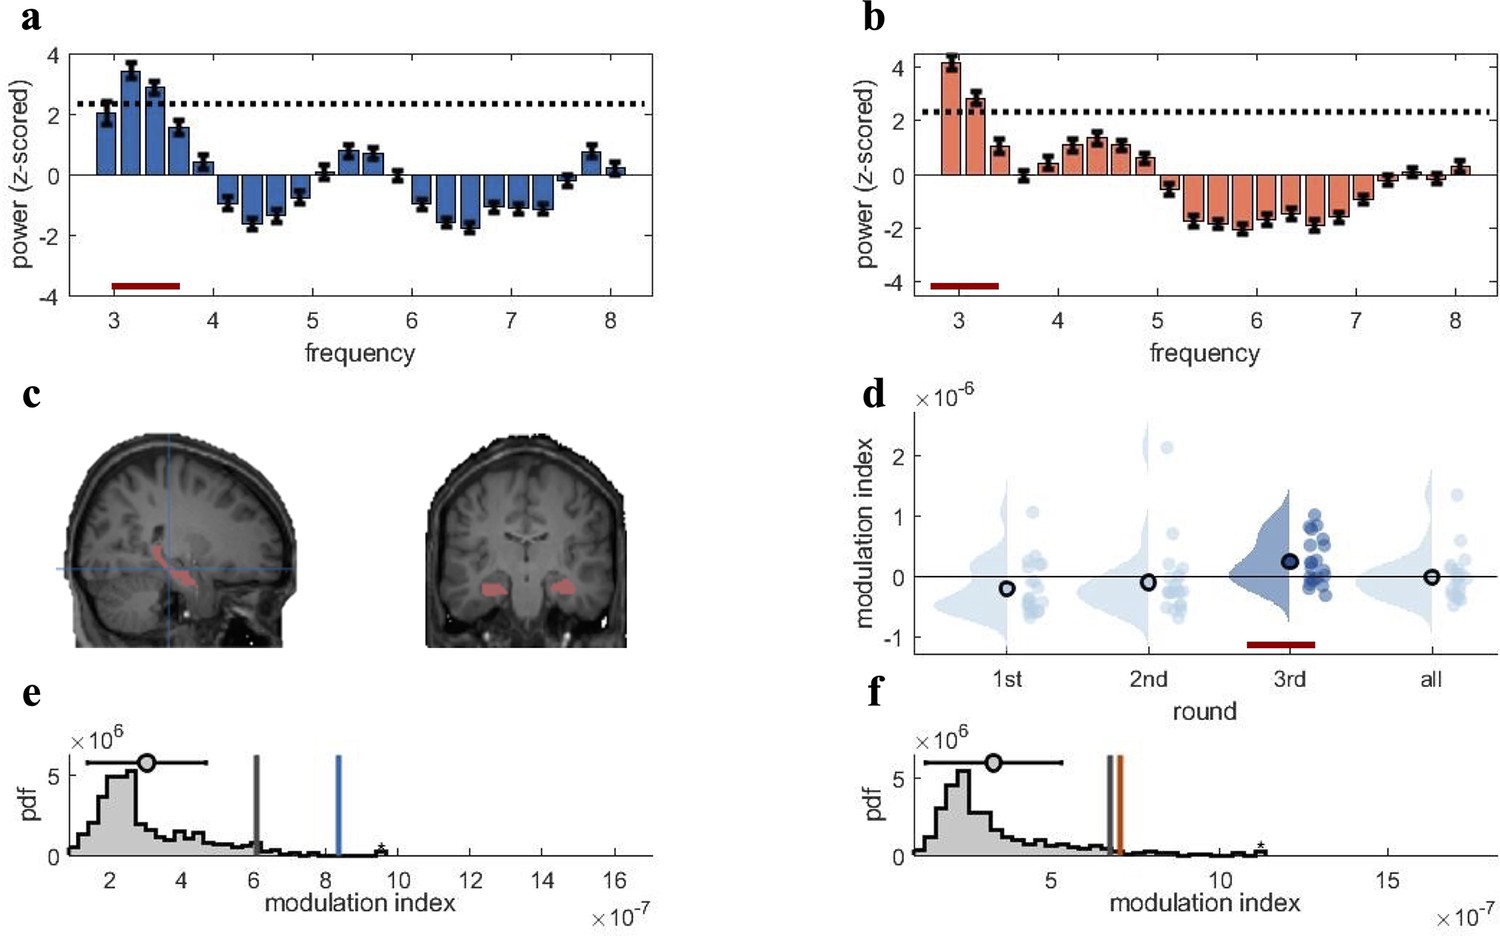
Rhythmic fluctuations in classifier fidelity and phase locking to hippocampal theta oscillation.
(a, b) An estimation of oscillatory components in the classifier fidelity values, using Irregular-Resampling Auto-Spectral Analysis (IRASA), revealed significant rhythmicity at 3 Hz, compared with the same estimate from a label-shuffled baseline classifier (dashed black line; red line indicates frequencies that significantly differ from baseline) for both target (a) and competitor (b) memories. (c) The hippocampal region of interest used as the source for theta phase, shown in sagittal and (left) coronal (right) plane. (d) Distribution of each individual’s modulation index (MI) with the 95th percentile subtracted. The third retrieval repetition shows significant modulation exceeding the 95th percentile (red line). (e, f) Results of the phase modulation analysis linking decoding fidelity to the phase of the hippocampal 3 Hz oscillation. Fidelity values for target (e) and competitor memories (f) were significantly modulated by the hippocampal theta rhythm at 3 Hz. The histogram shows the chance distribution of the MI, together with the 95th percentile in grey vertical bars and empirical value in blue for target memories and orange for competitor memories. For all analyses, n = 21 participants were included. Graphs in a and b show means and SEM (error bars).
Figure 3—figure supplement 1
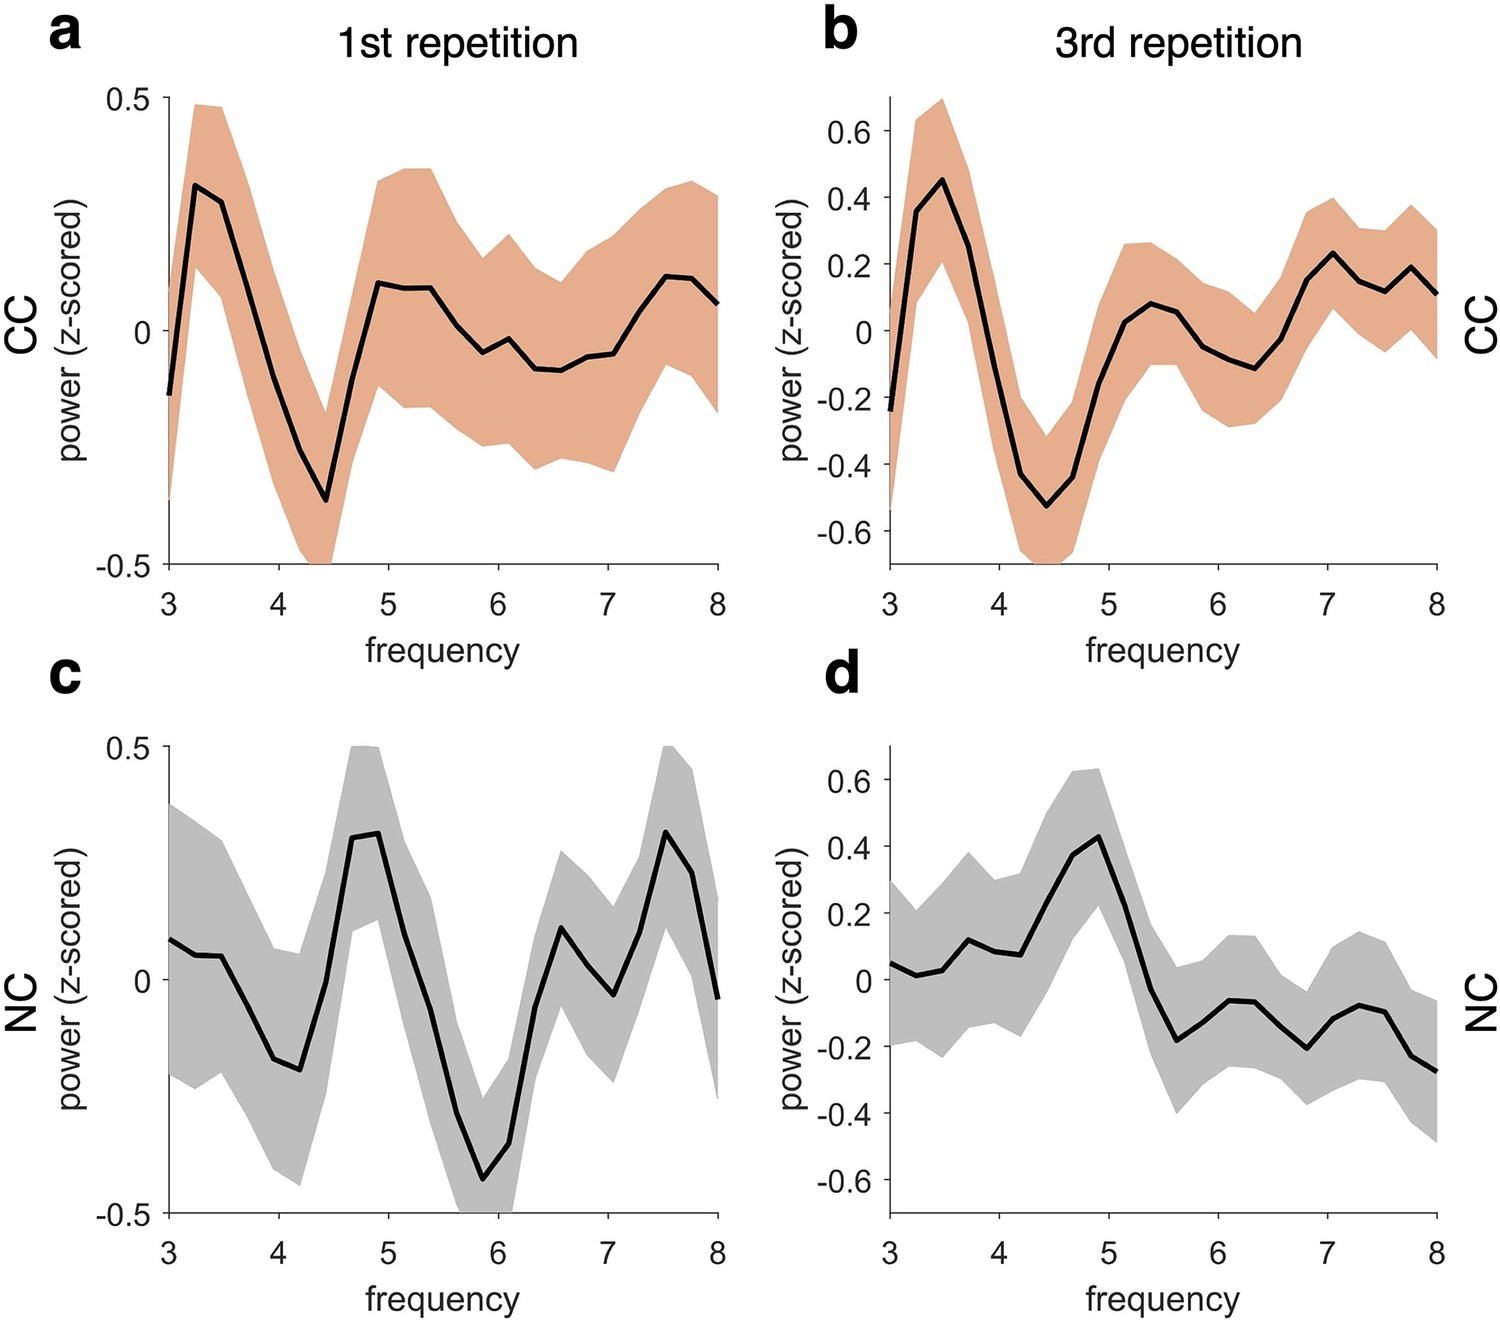
Frequency profile of fidelity timecourses across repetitions.
Top row shows the frequency spectrum of the classifier fidelity timecourses in the competitive condition (CC) for the first (a) and last (b) repetition. The bottom row shows the same profiles for first (c) and last (d) repetitions of the non-competitive conditions (NCs) collapsed. Frequency profiles do not change substantially across repetitions within each condition. However, the peak frequency of fidelity values is centred at 3–4 Hz in the CC and at 4–5 Hz in the NC. For all analyses, n = 21 participants were included and the graphs show mean and SEM of decoding performance. No statistical tests were used here.
Figure 3—figure supplement 2
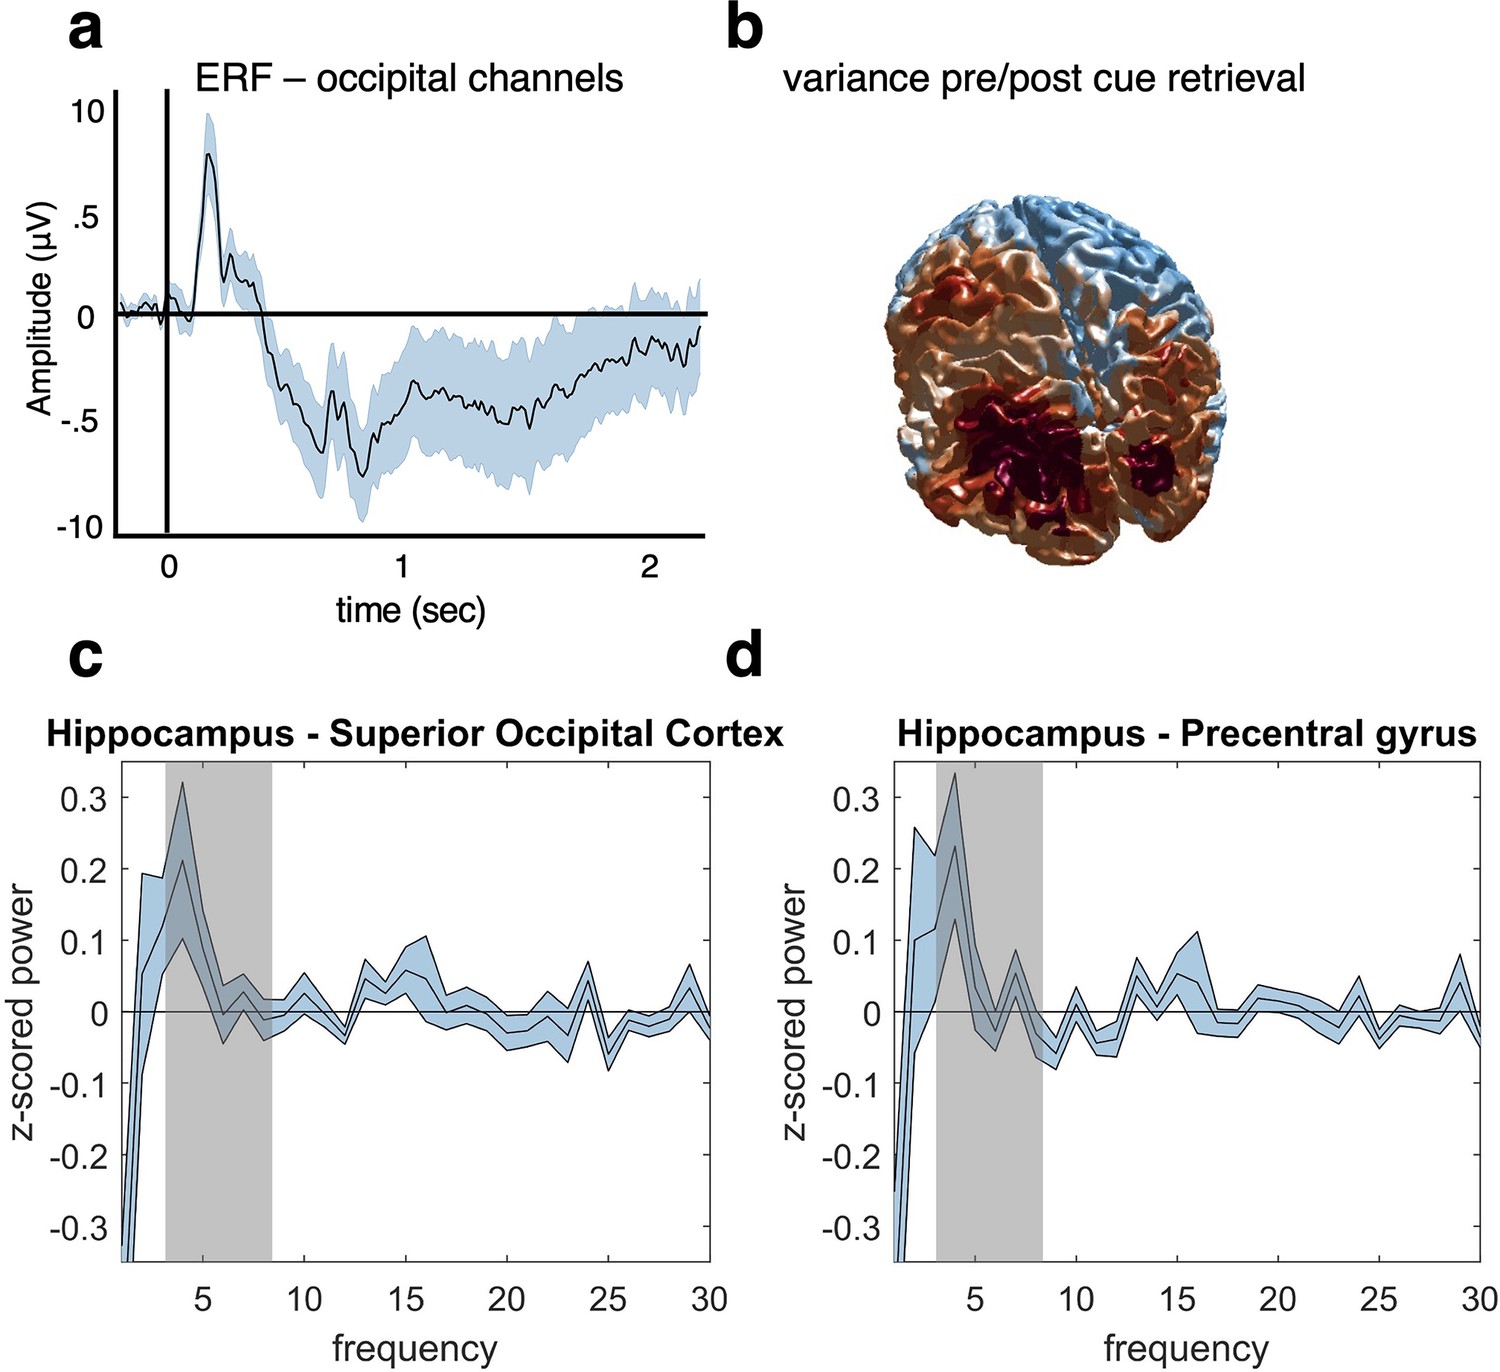
Control analyses preprocessing and source localisation.
(a) An ERF analysis was conducted after preprocessing to ensure that a clean visually evoked potential was obtained from posterior sensors. The data were low-pass filtered at 30 Hz, and the vertical and horizontal gradients were summed for occipital channels. Before averaging the trials, the data were baseline corrected based on the activity at each channel from –200 to –50 ms before cue onset at retrieval. Results show a typical ERF with a maximum around 200 ms after cue onset. (b) A variance index was calculated to check the source distribution in response to a visual stimulus. The data were source localised using a linear constrained minimum variance (LCMV) beamforming approach (Gross et al., 2007). We then subtracted the temporal variance from –200 to 0 ms pre-cue from the 0–200ms post-cue variance, and subsequently divided by the pre-cue variance. We found the expected source distribution in this early time window with an occipital maximum, thus providing a basic sanity check for our source analysis approach. (c, d) We used Irregular-Resampling Auto-Spectral Analysis (IRASA) to extract the frequency profile of our main hippocampal region of interest and two control regions, one in superior occipital cortex (c) and one in motor cortex (precentral gyrus, d). The graphs show power differences between the hippocampus and each of the two control regions in a time window from 0 to 2 s after cue onset, from 1 to 30 Hz. When averaging theta power in our predefined frequency range of interest (3–8 Hz, highlighted in grey), we found (c) significantly stronger theta power in hippocampus compared to superior occipital cortex (t(1,20) = 2.37, p=0.0279, aired-samples t-test), and (d) a qualitatively similar but non-significant difference for precentral gyrus (t(1,20) = 1.98, p=0.0622), after having corrected for multiple tests over the two regions. For all analyses, n = 21 participants were included and graphs a, c and d show mean and SEM.
Figure 4 with 1 supplement

Target–competitor phase difference results.
(a) Phase difference of maximal target minus competitor reactivation for each participant, separately for each recall repetition. At repetition 3 (right circular plot), there was a phase shift of on average 34° that was statistically coherent across subjects and significantly different from zero, indicative of robust target–competitor phase segregation. (b) When splitting the phase difference in the third repetition by behavioural intrusion score, the high-intrusion group had a mean phase separation angle close to zero (top), while the low-intrusion group had a mean separation angle of 57° (bottom). (c) A cross-correlation between the continuous fidelity timecourses of target and competitor memories revealed a significant cluster (pcluster < .05) from approximately 1 s after cue onset, lasting to the end of the trial, with a maximum around 30° phase lag. z-values in panels (a, b) (colour code) indicate strength of Rayleigh test for non-uniformity, with z-values/colours exceeding the dashed line on the colour bar indicating significant coherence in the target–competitor phase difference. For all analyses, n = 21 participants were included.
Figure 4—figure supplement 1
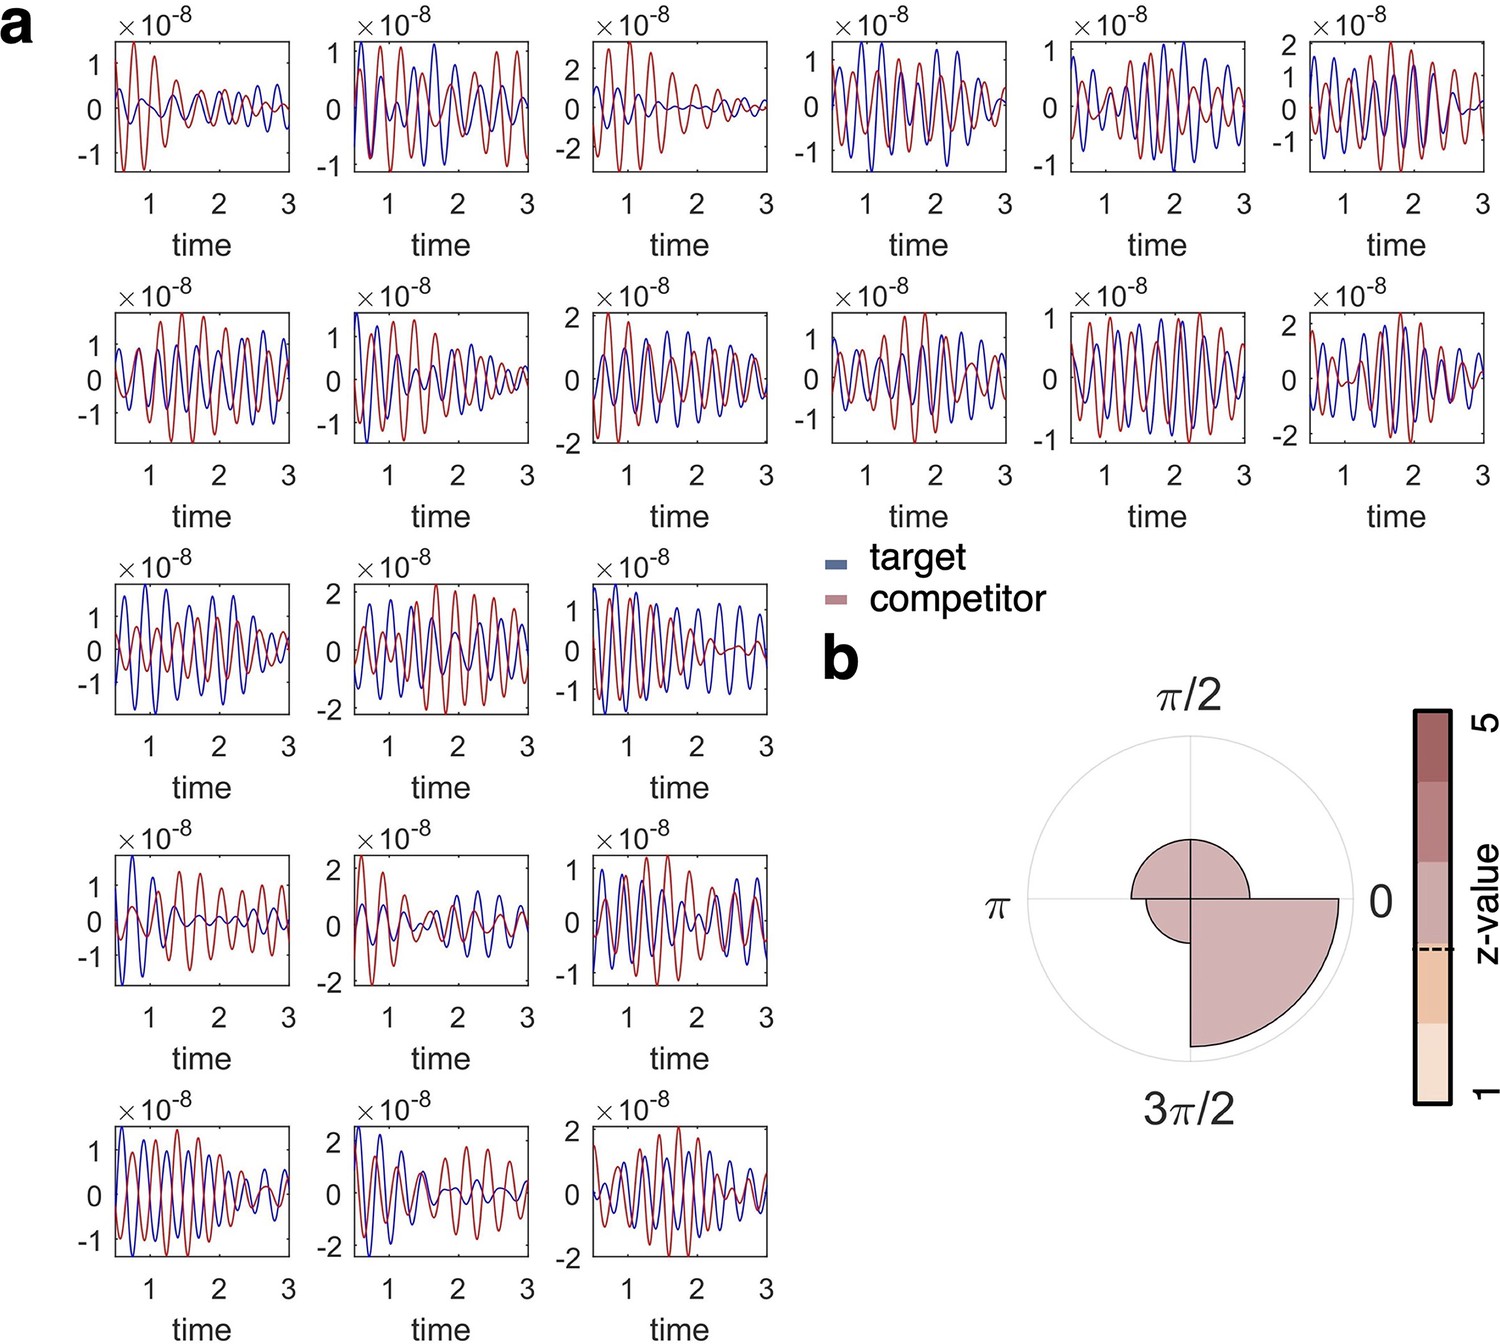
Single subject fidelity values and phase difference.
(a) Individual plots show the fidelity values for target (blue) and competitor (orange) classification per individual participant (n = 21), filtered at the frequency of interest (3 Hz). These graphs are included for visual inspection of participant-level data and show that target and competitor decoding does not necessarily go hand in hand over the timecourse of a trial, and appears phase-shifted in many of the participants. (b) When formalising the phase shift between the timecourses of target and competitor reactivation (i.e. fidelity of decoding), we found a similar pattern of phase separation as in our main analyses relating decoding maxima to the hippocampal 3 Hz phase, with an average phase difference of 45° (see Figure 4 for comparison).
Author response image 1
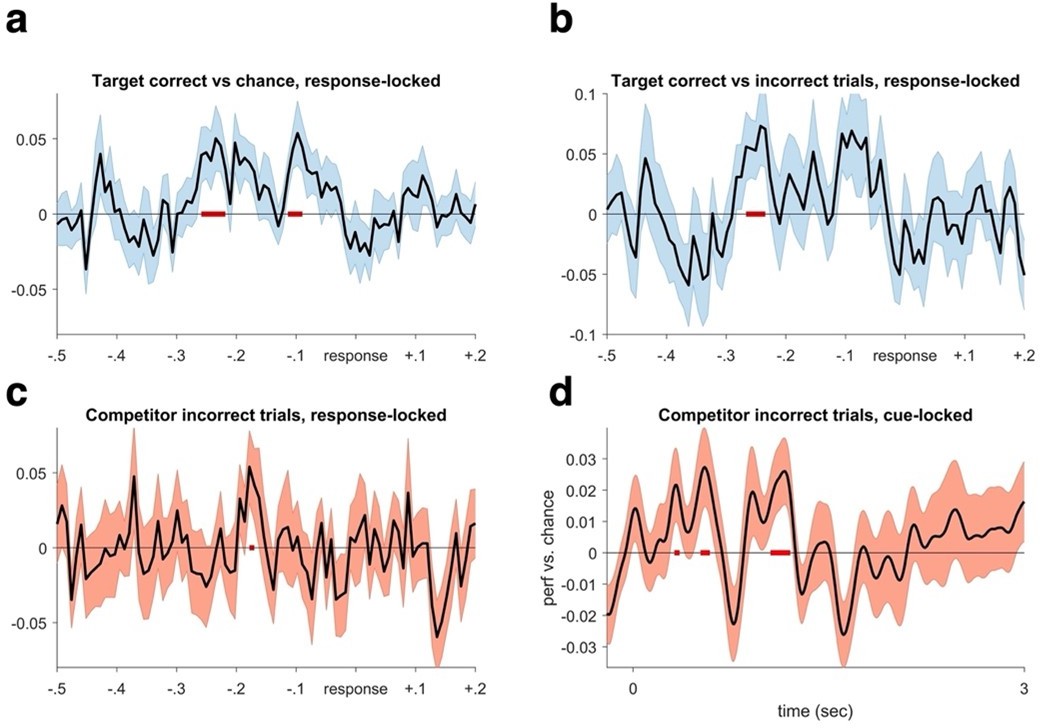
Decoding performance time-locked to the subjective recollection button press.
We realigned the trials based on response a. We find significant target decoding when averaging over all repetitions for targets in the competitive condition (CC), pcluster <.05. b. A similar pattern is evident when contrasting target decoding between correct and incorrect trials in the CC (pcluster <.05). These results reaffirm that the lack of significant decoding in the cue-locked analyses is due to timing differences in memory reinstatement between trials and participants, which is rectified when locking to the time point of subjective recollection. c. When only analysing incorrect trials, we find evidence of competitor decoding in a similar time window as when target memories were maximally reactivated in (a and b) (puncorrected = .05). d. Lastly, analysing competitor decoding on all incorrect trials from cue onset, we again found evidence for competitor reactivation in an early and a later time window (puncorrected = .05).
Author response image 2
Conflict theta during second presentation at encoding.
We found that there is stronger theta power when participants encode a second competing associate (target item) with an old memory cue in the CC condition, compared to re-encoding the first associate with the old memory cue in the NC condition. X-axis shows time from image onset (0) and one second after the image appeared on screen.
Additional files
Download links
A two-part list of links to download the article, or parts of the article, in various formats.
Downloads (link to download the article as PDF)
Open citations (links to open the citations from this article in various online reference manager services)
Cite this article (links to download the citations from this article in formats compatible with various reference manager tools)
Phase separation of competing memories along the human hippocampal theta rhythm
eLife 11:e80633.
https://doi.org/10.7554/eLife.80633


