A searchable image resource of Drosophila GAL4 driver expression patterns with single neuron resolution
- Geoffrey W Meissner

- Aljoscha Nern
- Yoshinori Aso
- Gwyneth M Card
- Barry J Dickson
- Wyatt Korff
- Gerald M Rubin
- Janelia Research Campus, Howard Hughes Medical Institute, United States
- Max-Delbrueck-Center for Molecular Medicine in the Helmholtz Association (MDC), Germany
Figures
Figure 1 with 1 supplement
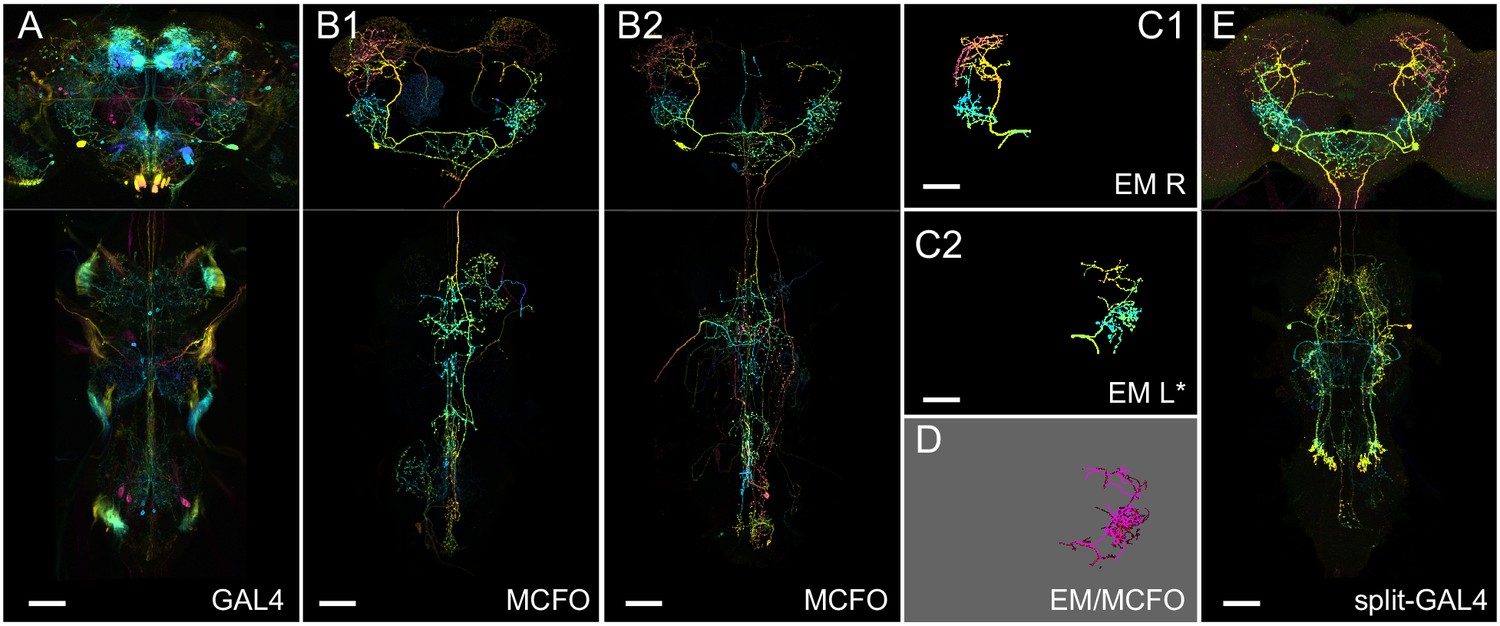
Generation 1 MultiColor FlpOut (MCFO) and electron microscopy (EM)/light microscopy (LM) comparison overview.
(A) Overall GAL4 expression pattern of a driver line containing a cell type of interest, shown as a color depth maximum intensity projection (MIP) (Otsuna et al., 2018). Original images are from published datasets (Jenett et al., 2012). (B1) Example MCFO labeled cells from the driver line in (A). MCFO labeling reveals a prominent descending neuron. (B2) An additional MCFO labeled cell of the same type but from a different line. The color depth MIPs in B1 and B2 represent data from one of the three MCFO markers, so color changes indicate changes in the z-dimension rather than differential MCFO labeling. (C1, C2) Matching EM reconstructions for the cell type. Both panels show reconstructions from the right-side Hemibrain; the lower panel is mirrored to facilitate comparison to the LM data. (D) PatchPerPixMatch (PPPM) overlay of MCFO from (B1) and EM reconstruction from (C2). (E) Split-GAL4 made from split hemidrivers derived from GAL4 lines in A and B. Driver lines used are R56H09 (A, B1), R23E11 (B2), and SS01588 (E). Hemibrain body IDs are 571346836 (C1) and 1786496543 (C2). All scale bars, 50 µm.
Figure 1—figure supplement 1
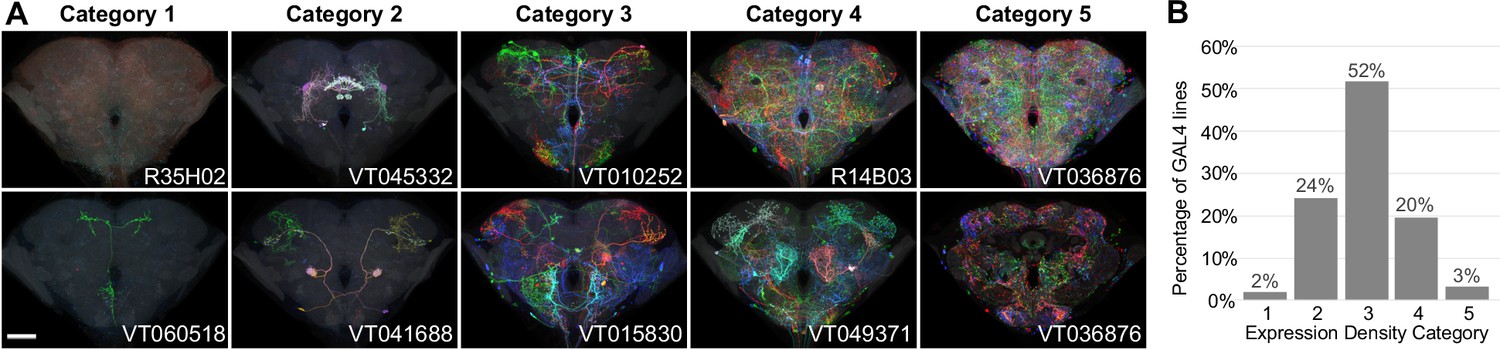
Generation 1 MultiColor FlpOut (MCFO) expression density categories.
(A) Two example brain maximum intensity projections (MIPs) are shown for each expression density category, except Category 5, where a single brain is shown both as an MIP and a single confocal slice through its center. Qualitative categorization was manually performed on a line level based on 2D MIPs of MCFO and full central nervous system (CNS) expression patterns. Category 1 lines contained no visible neurons or only commonly repeated ones. Categories 2–4 labeled identifiable neurons with increasing density. Category 5 lines had such dense expression that the immunohistochemical labeling approach failed to fully label the center of the brain. Category 1 and 5 lines were generally excluded from imaging and the collection as a whole. Scale bar, 50 µm. (B) The frequency distribution of lines within the different expression density categories are shown. Sample size is all 4919 lines considered for inclusion in either phase of the 40× pipeline. 95% of lines were within the desired range.
Figure 2
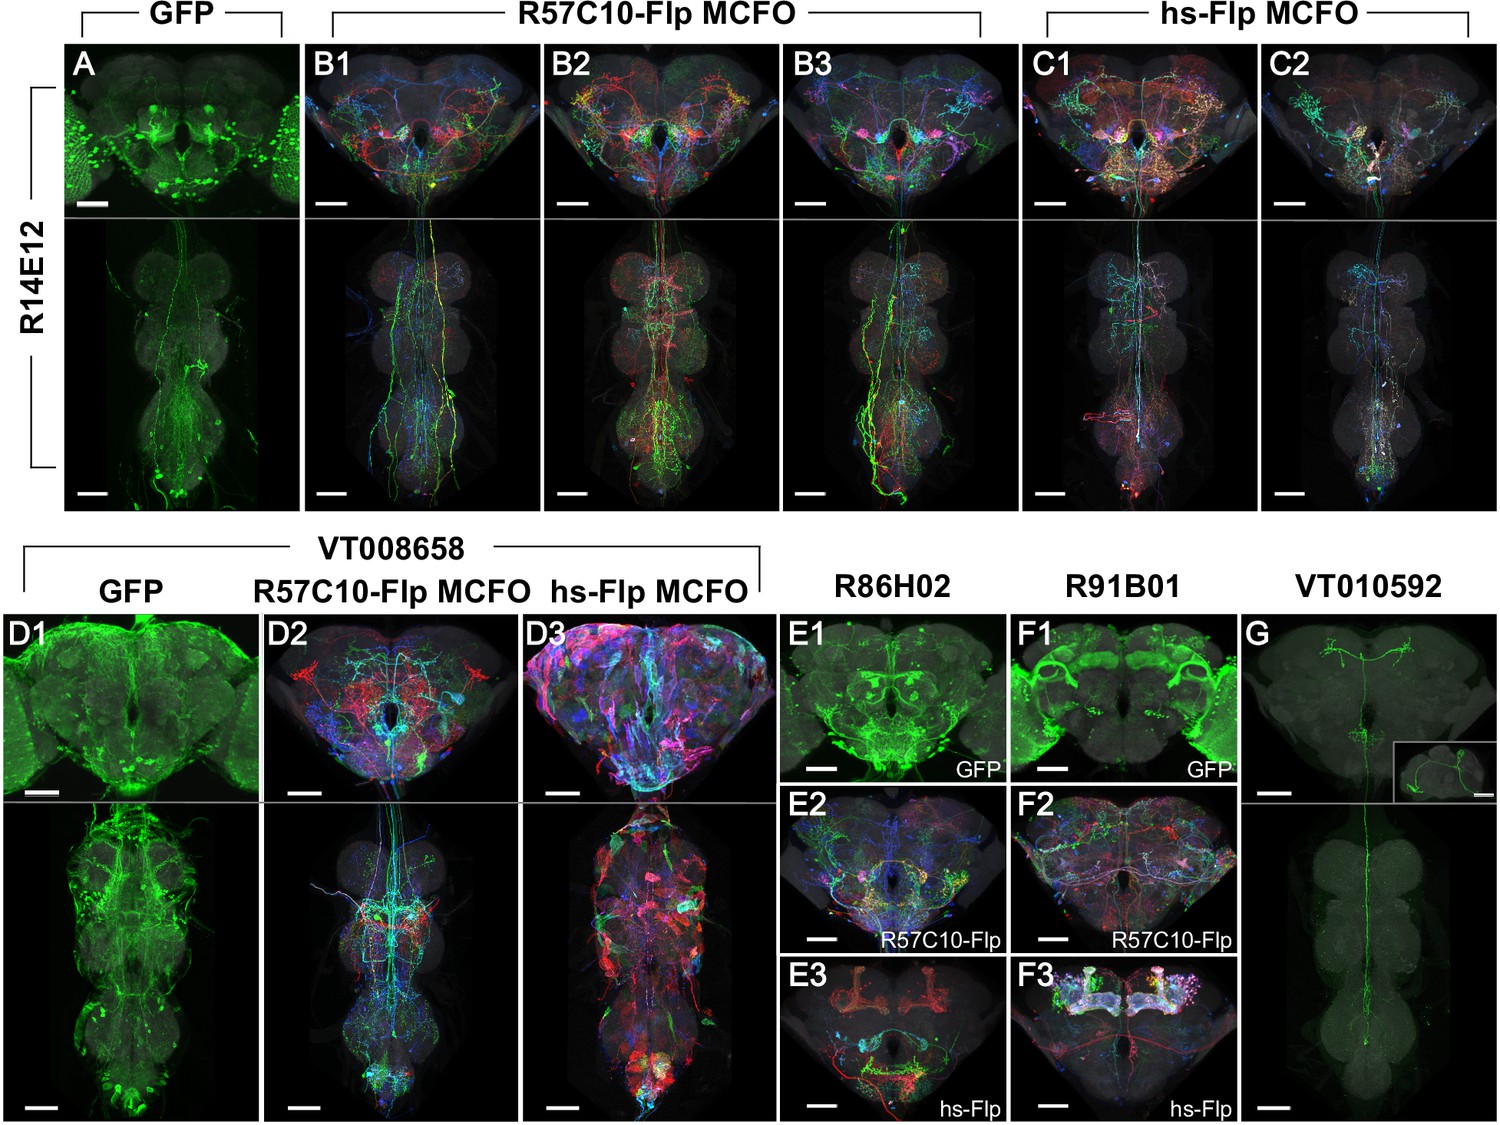
Phase 1 and 2 overview and labeling examples.
R14E12-GAL4 in attP2 crossed to (A) pJFRC2-10XUAS-IVS-mCD8::GFP, (B) R57C10-Flp MCFO, or (C) hs-Flp MCFO. Adult central nervous system (CNS) maximum intensity projections (MIPs) are shown, with neuropil reference in gray and neuronal signal in green (A) or full MultiColor FlpOut (MCFO) colors (B, C). Multiple examples are shown for B, C. Scale bars, 50 µm. (D) Glia are seen with VT008658-GAL4 in attP2 crossed to (D1) pJFRC2-10XUAS-IVS-mCD8::GFP and (D3) hs-Flp MCFO, but not (D2) R57C10-Flp MCFO. (E) Kenyon cell labeling is not seen with R86H02-GAL4 in attP2 crossed to (E1) pJFRC2-10XUAS-IVS-mCD8::GFP or (E2) R57C10-Flp MCFO, but is seen when crossed to (E3) hs-Flp MCFO. (F) Kenyon cell labeling is seen with R91B01-GAL4 in attP2 crossed to (F1) pJFRC2-10XUAS-IVS-mCD8::GFP and (F3) hs-Flp MCFO, but is not seen when crossed to (F2) R57C10-Flp MCFO. (G) An ascending neuron (sparse T) is commonly seen with many Gen1 GAL4 lines crossed to different reporters. VT010592-GAL4 in attP2 crossed to R57C10-Flp MCFO is shown as an example. A single neuron channel plus reference are shown for clarity. The inset shows a lateral (y-axis) MIP of the brain. All scale bars, 50 µm.
Figure 3
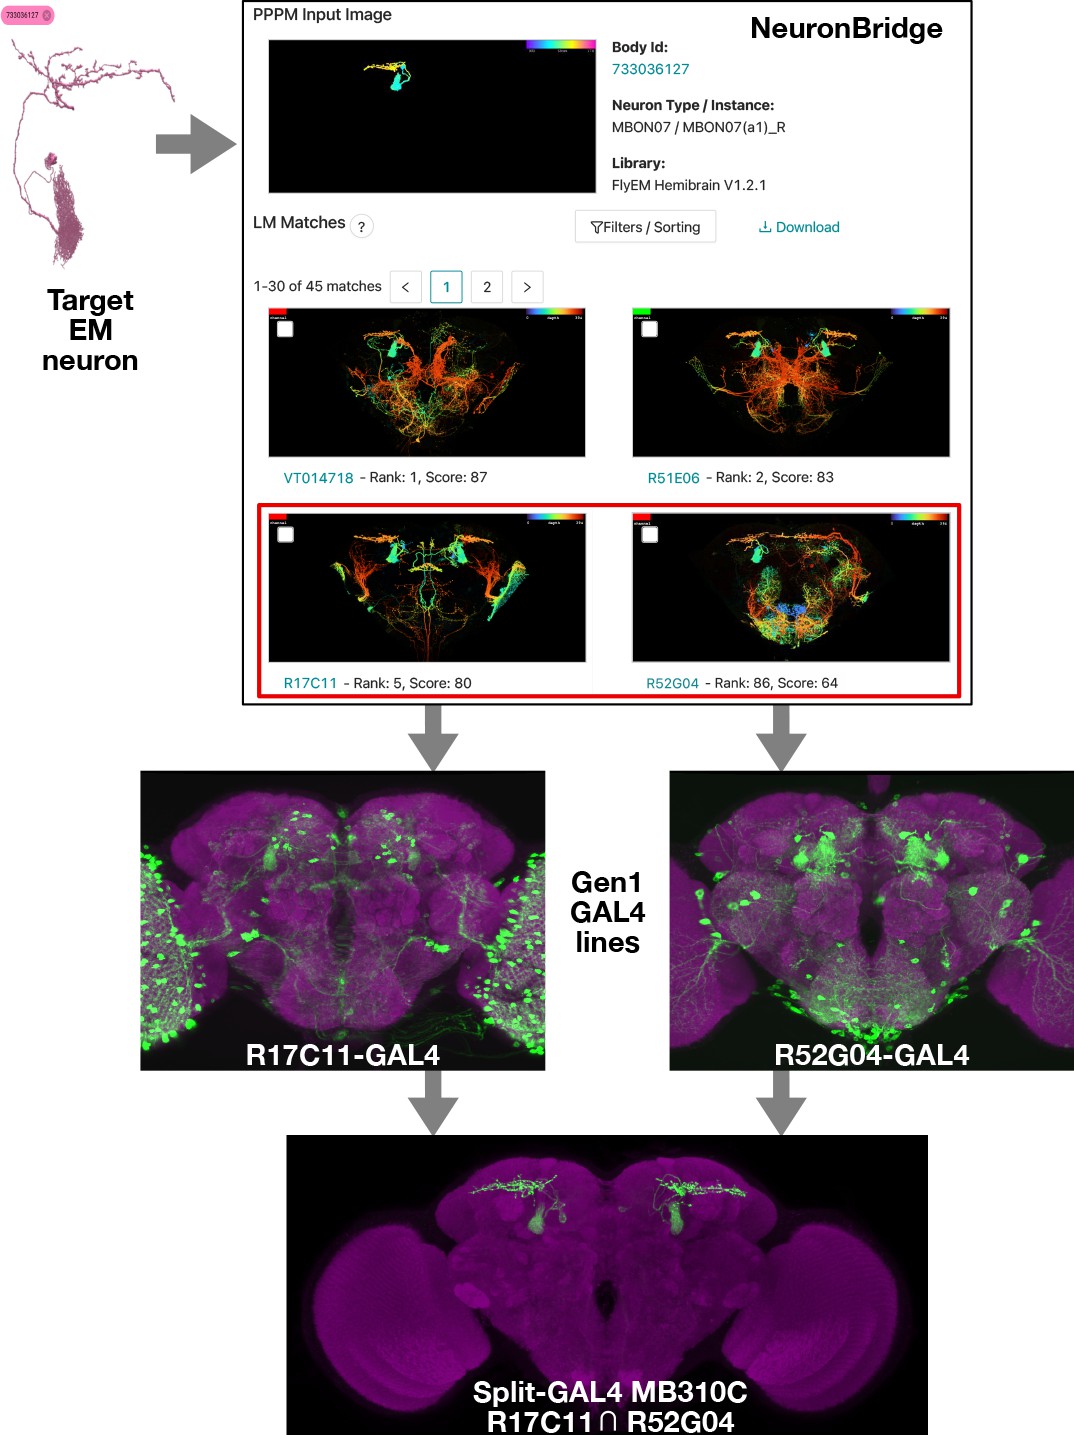
Electron microscopy (EM)/light microscopy (LM) search for split-GAL4 creation.
Neuron search techniques allow for the identification of Gen1 MultiColor FlpOut (MCFO) images containing an EM body of interest. The corresponding Gen1 GAL4 lines should label the same neuron with other upstream activation sequence (UAS) reporters, as should split-GAL4 hemidrivers constructed with the same enhancer fragment. The two hemidrivers can then be combined into a split-GAL4 with the aim of generating a driver that specifically targets that neuron. An example is shown of the anticipated search process, from a neuron identified via EM to the creation of a split-GAL4 driver. As in Figure 1, NeuronBridge displays color depth maximum intensity projections (MIPs) of single MCFO markers rather than the full MCFO image, so color changes indicate depth rather than different neurons. NeuronBridge result order was reformatted for display purposes. The example shown includes FlyEM Hemibrain body ID 733036127 (Scheffer et al., 2020), Generation 1 GAL4 lines R17C11-GAL4, R52G04-GAL4, and split-GAL4 MB310C (MBON07) (Jenett et al., 2012; Aso et al., 2014b).
Figure 4 with 1 supplement
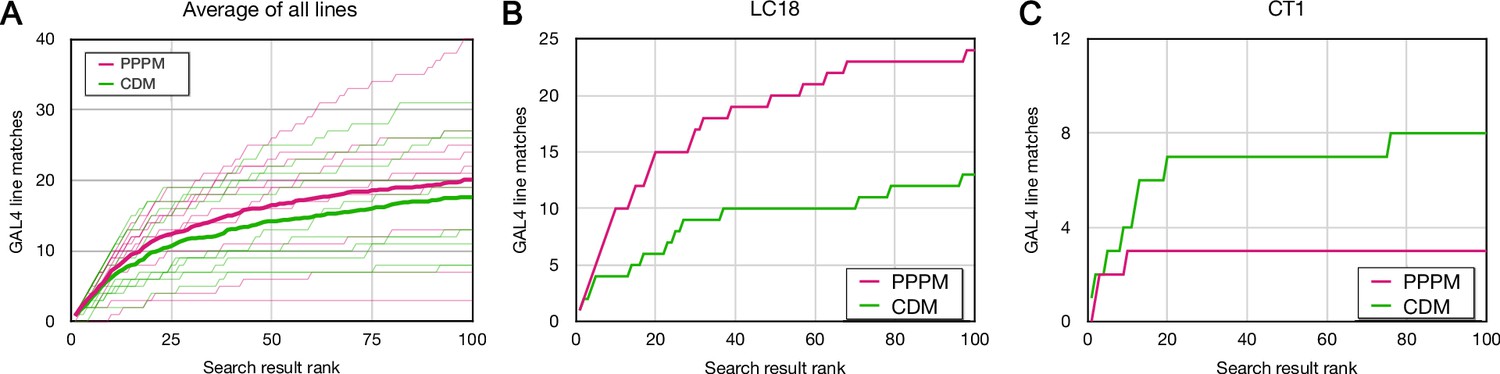
Forward analysis: direct evaluation of Color Depth Maximum intensity projection (CDM) and PatchPerPixMatch (PPPM) search results.
EM bodies were searched for in Phase 1 40× Gen1 MultiColor FlpOut (MCFO) light images using CDM and PPPM approaches. Search results were qualitatively evaluated by an anatomical expert for the presence of the sought neuron. Most results were scored based on color depth maximum intensity projection (MIP) images. Full image stacks were used to score about 20% of samples, including the majority of samples scored as containing the sought neuron. The cumulative number of correct matches found is plotted against the depth of searching for CDM (green) and PPPM (magenta). (A) Average results for each search approach are plotted in bold on top of individual results. (B) Cell type LC18 (Hemibrain body 1722342048) search result evaluation. (C) Cell type CT1 (Hemibrain body 1311993208) search result evaluation.
-
Figure 4—source data 1
Table of forward analysis results by cell type.
Table shows all individual scores and the following metrics: the number of lines independently identified by CDM and PPPM, number only identified by one approach (XOR), number identified by both approaches (AND), and total number identified (OR).
- https://cdn.elifesciences.org/articles/80660/elife-80660-fig4-data1-v2.xlsx
Figure 4—figure supplement 1
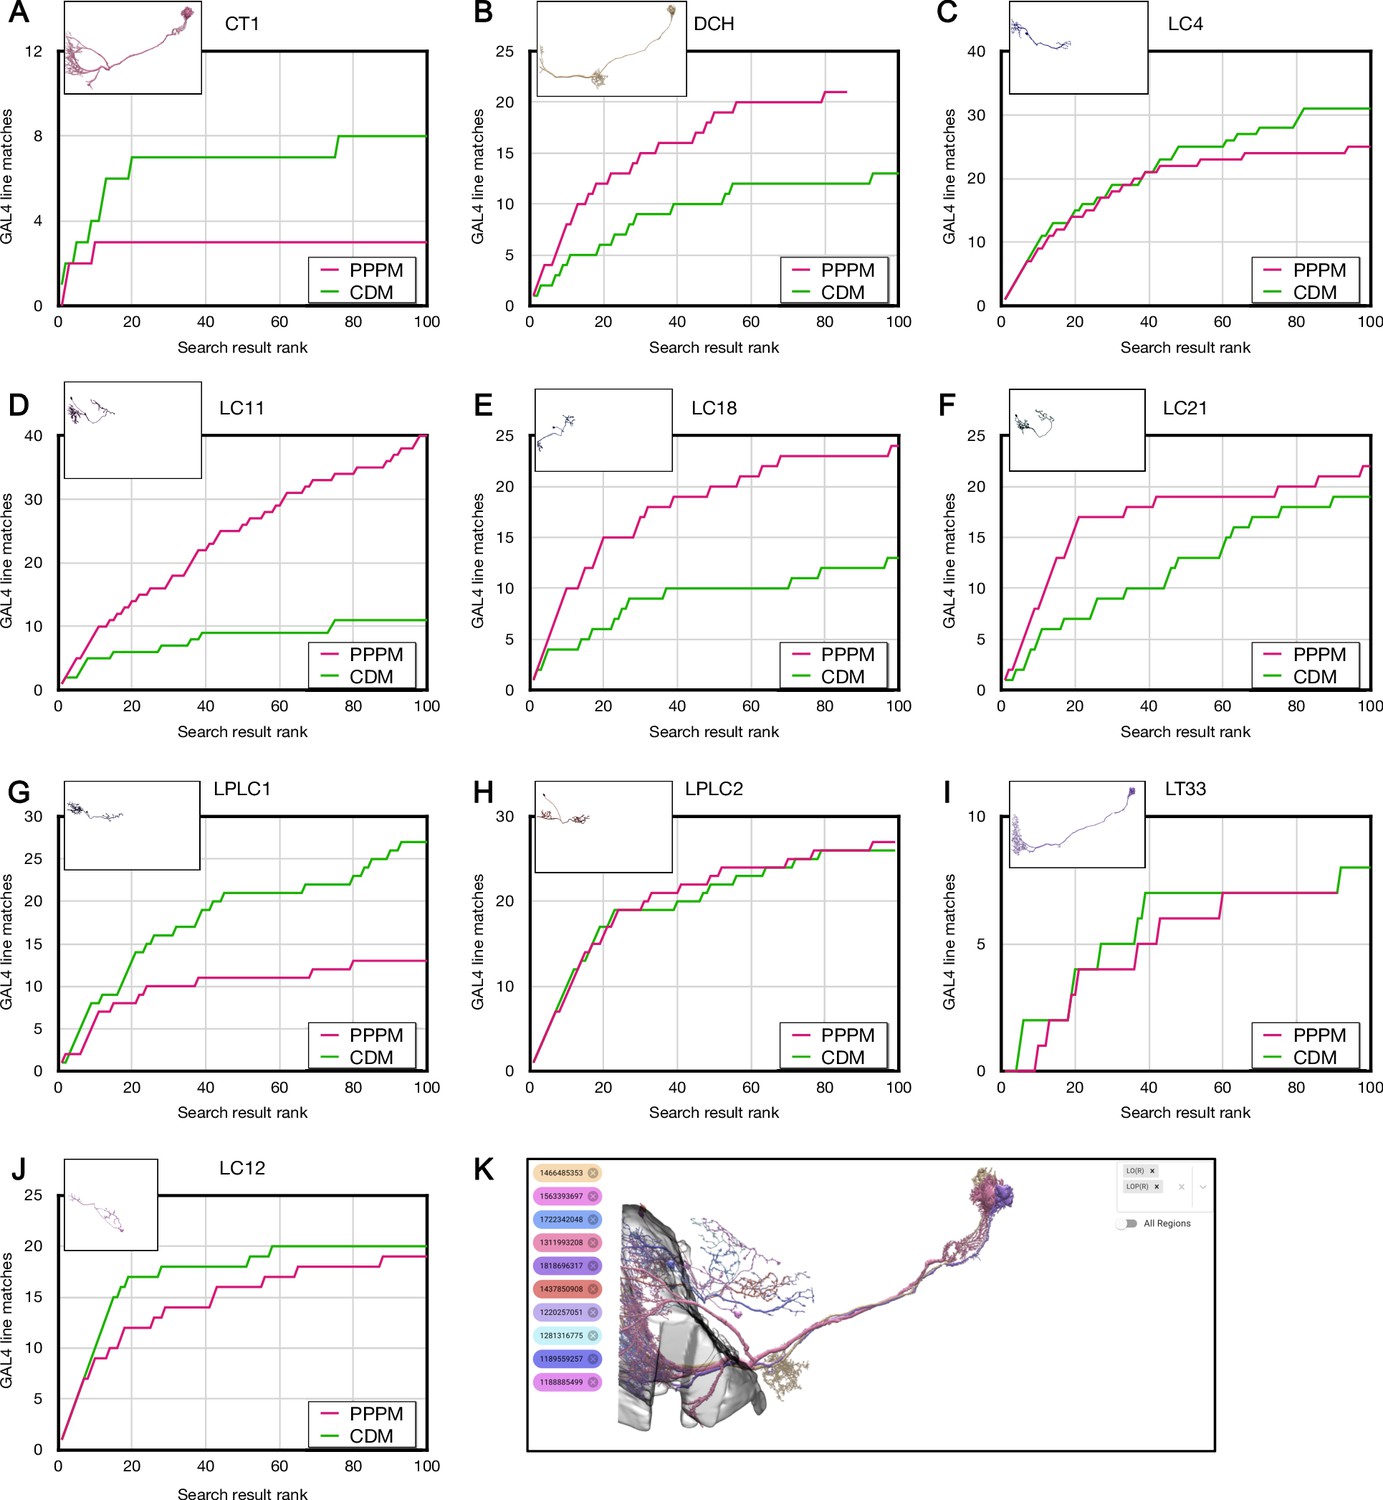
Forward analysis individual plots for Color Depth Maximum intensity projection (CDM) and PatchPerPixMatch (PPPM).
(A–J) Individual CDM and PPPM results for the indicated cell types. (K) All cell types composited with partial lobula and lobula plate. Includes duplicated images from Figure 4. Electron microscopy (EM) images are from https://neuprint.janelia.org (Clements et al., 2020; Scheffer et al., 2020). Figure 4—source data 1.
Tables
Table 1
Image collection statistics.
| 20×/63× collection | 40× collection | Total | |
|---|---|---|---|
| Gen1 GAL4 lines | 2463 | 4575 | 5155 |
| Samples | 27,546 | 46,791 | 74,337 |
| Average samples/line | 11.2 | 10.2 | 14.4 |
| Std. Dev. samples/line | 7.6 | 4.6 | 8.7 |
| Average brain/line | 11.2 | 10.1 | 14.3 |
| Average VNC/line | 0.9 | 7.1 | 6.8 |
| Female % | 94.2% | 44.9% | 63.2% |
| 20×/40× image tiles | 29,784 | 111,380 | 141,164 |
| 63× image tiles | 22,775 | – | 22,775 |
| Lines with 63× images | 1748 | – | 1748 |
| Samples with 63× images | 8447 | – | 8447 |
Table 2
Reverse analysis: scoring known match search ranks in Color Depth Maximum intensity projection (CDM) and PatchPerPixMatch (PPPM) results.
PPPM and CDM search results on nine Hemibrain bodies were scored for the presence of known GAL4 matches from the literature (Schretter et al., 2020; Wang et al., 2020a). Only the top-ranking sample for each line and EM body comparison was considered. Searches were performed across only Phase 140× Gen1 MCFO collection data. vpoDN PPPM median line ranks were 7, 49, >400, and >400. Results for bodies 514850616 and 5813063587 are reformatted from Mais et al., 2021 Figure 9.
| Name | Hemibrain body ID | Known-matching lines | PPPM median line rank | CDM median line rank | PPPM % in top 50 | CDM % in top 50 |
|---|---|---|---|---|---|---|
| pC1e | 514850616 | 13 | 14 | 58 | 69% | 46% |
| pC1d | 5813063587 | 12 | 28 | 41 | 58% | 50% |
| aIPg | 645456880 | 5 | 6 | 3 | 80% | 100% |
| oviDN | 550655668 | 4 | 70 | 42 | 50% | 75% |
| oviDN | 519949044 | 4 | 95 | 41 | 50% | 50% |
| SAG | 517587356 | 2 | 49 | 78 | 50% | 0% |
| SAG | 5812981862 | 2 | 44 | 118 | 50% | 0% |
| vpoDN | 5813057864 | 4 | NA | 95 | 50% | 50% |
| DNp13 | 887195902 | 3 | 84 | 53 | 33% | 33% |
Key resources table
| Reagent type (species) or resource | Designation | Source or reference | Identifiers | Additional information |
|---|---|---|---|---|
| Genetic reagent (Drosophila melanogaster) | MCFO-1; hsPESTOPT_attP3_ 3stop1_X_0036; (w, pBPhsFlp2::PEST in attP3;; pJFRC201-10XUASFRT >STOP > FRT-myr::smGFP-HA in VK00005,pJFRC240- 10XUAS-FRT>STOP > FRT-myr::smGFP-V5-THS-10XUASFRT >STOP > FRT-myr::smGFPFLAG in su(Hw)attP1/TM3,Sb) | Nern et al., 2015 | RRID:BDSC_64085 (Janelia stock 1117734) | |
| Genetic reagent (Drosophila melanogaster) | MCFO-2; pBPhsFLP_PEST_ HAV5_FLAG_OLLAS_ X3_0095; (w, pBPhsFlp2::PEST in attP3;; pJFRC210-10XUASFRT >STOP > FRT-myr::smGFP-OLLAS in attP2, pJFRC201- 10XUAS-FRT>STOP > FRT-myr::smGFP-HA in VK0005, pJFRC240-10XUAS-FRT>STOP > FRT-myr::smGFP-V5-THS10XUAS-FRT>STOP > FRT-myr::smGFPFLAG in su(Hw)attP1/TM2) | Nern et al., 2015 | RRID:BDSC_64086 (Janelia stock 3022015) | |
| Genetic reagent (Drosophila melanogaster) | MCFO-4; 57C10wt_attp8_ 3stop1; (w, R57C10-Flp2 in su(Hw)attP8;; pJFRC201-10XUASFRT >STOP > FRT-myr::smGFP-HA in VK00005,pJFRC240- 10XUAS-FRT>STOP > FRT-myr::smGFP-V5-THS-10XUASFRT >STOP > FRT-myr::smGFP-FLAG in su(Hw)attP1) | Nern et al., 2015 | RRID:BDSC_64088 (Janelia stock 1116898) | |
| Genetic reagent (Drosophila melanogaster) | MCFO-5; 57C10PEST_attp8_ 3stop1; (w, R57C10-Flp2::PEST in su(Hw)attP8;; pJFRC201- 10XUAS-FRT>STOP > FRT-myr::smGFPHA in VK00005, pJFRC240-10XUAS-FRT>STOP > FRTmyr::smGFP-V5-THS-10XUAS-FRT>STOP > FRTmyr::smGFP-FLAG in su(Hw)attP1/TM2) | Nern et al., 2015 | RRID:BDSC_64089 (Janelia stock 1116876) | |
| Genetic reagent (Drosophila melanogaster) | MCFO-6; 57C10L_attp8_ 4stop1; (w, R57C10-FlpL in su(Hw)attp8;; pJFRC210-10XUASFRT >STOP > FRT-myr::smGFP-OLLAS in attP2, pJFRC201- 10XUAS-FRT>STOP > FRT-myr::smGFP-HA in VK00005, pJFRC240-10XUAS-FRT>STOP > FRT-myr::smGFP-V5-THS10XUAS-FRT>STOP > FRT-myr::smGFPFLAG in su(Hw)attP1/TM2) | Nern et al., 2015 | RRID:BDSC_64090 (Janelia stock 1116894) | |
| Genetic reagent (Drosophila melanogaster) | MCFO-7; 57C10PEST_attp18_ 4stop1; (w, R57C10-Flp2::PEST in attp18;; pJFRC210-10XUASFRT >STOP > FRT-myr::smGFP-OLLAS in attP2, pJFRC201- 10XUAS-FRT>STOP > FRT-myr::smGFPHA in VK00005, pJFRC240-10XUAS-FRT>STOP > FRTmyr::smGFP-V5-THS-10XUAS-FRT>STOP > FRTmyr::smGFP-FLAG in su(Hw)attP1/TM2) | Nern et al., 2015 | RRID:BDSC_64091 (Janelia stock 1116875) | |
| Genetic reagent (Drosophila melanogaster) | MCFO-3 derivative; 57C10L_brp_SNAP_ MCFO_X23_0117; (w, R57C10-FlpL in su(Hw)attP8; brp::Snap / CyO; pJFRC201-10XUAS-FRT>STOP > FRT-myr::smGFPHA in VK00005,pJFRC240-10XUAS-FRT>STOP > FRTmyr::smGFP-V5-THS-10XUAS-FRT>STOP > FRTmyr::smGFP-FLAG in su(Hw)attP1/TM6B) | Nern et al., 2015; Kohl et al., 2014 | RRID:BDSC_64087 (Janelia stock 3023700) | |
| Genetic reagent (Drosophila melanogaster) | 57C10PEST_brp_SNAP_ MCFO_X23_0099; (w, R57C10- Flp2::PEST in attP18; brp::Snap / CyO; pJFRC201-10XUASFRT >STOP > FRT-myr::smGFP-HA in VK00005,pJFRC240- 10XUAS-FRT>STOP > FRT-myr::smGFP-V5-THS-10XUASFRT >STOP > FRT-myr::smGFP-FLAG in su(Hw)attP1/TM6B) | Nern et al., 2015 | (Janelia stock 3023701) | |
| Genetic reagent (Drosophila melanogaster) | MCFO-1 derivative; pBPhsFlp2_PEST_ brp_SNAP_ MCFO_0128; (w, pBPhsFlp2::PEST in attP3; brp::Snap / CyO; pJFRC201- 10XUAS-FRT>STOP > FRT-myr::smGFPHA in VK00005,pJFRC240-10XUAS-FRT>STOP > FRTmyr::smGFP-V5-THS-10XUAS-FRT>STOP > FRTmyr::smGFP-FLAG in su(Hw)attP1/TM6B) | Nern et al., 2015; Kohl et al., 2014 | RRID:BDSC_64085 (Janelia stock 3023951) | |
| Genetic reagent (Drosophila melanogaster) | pJFRC2-10XUAS-IVS-mCD8::GFP | Pfeiffer et al., 2010 | RRID:BDSC_32185 (Janelia stock 1115125) | |
| Antibody | Anti-Brp mouse monoclonal nc82 | Developmental Studies Hybridoma Bank (DSHB) | RRID: AB_2314866 | 1:30 |
| Antibody | Anti-HA rabbit monoclonal C29F4 | Cell Signaling Technologies: 3724S | RRID: AB_1549585 | 1:300 |
| Antibody | Anti-FLAG rat monoclonal DYKDDDDK Epitope Tag Antibody | Novus Biologicals: NBP1-06712 | RRID: AB_1625981 | 1:200 |
| Antibody | DyLight 550 conjugated anti-V5 mouse monoclonal | AbD Serotec: MCA1360D550GA | RRID: AB_2687576 | 1:500 |
| Antibody | Anti-RAT IgG (H&L) Goat Polyclonal Antibody ATTO 647N Conjugated | Rockland: 612-156-120 | RRID: AB_10893386 | 1:300 |
| Antibody | Alexa Fluor 594 AffiniPure Donkey Polyclonal Anti-Rabbit IgG (H+L) | Jackson ImmunoResearch Labs: 711-585-152 | RRID: AB_2340621 | 1:500 |
| Antibody | Anti-Green Fluorescent Protein (GFP) Rabbit Polyclonal Antibody, Unconjugated | Thermo Fisher Scientific: A-11122 | RRID: AB_221569 | 1:1000 |
| Antibody | Goat Polyclonal anti-Rabbit IgG (H+L) Highly Cross-Adsorbed Antibody, Alexa Fluor 488 | Thermo Fisher Scientific: A-11034 | RRID: AB_2576217 | 1:800 |
| Antibody | Goat Polyclonal anti-Mouse IgG (H+L) Highly Cross-Adsorbed Antibody, Alexa Fluor 568 | Thermo Fisher Scientific: A-11031 | RRID: AB_144696 | 1:800 |
| Software, algorithm | Janelia Workstation | Rokicki et al., 2019; https://github.com/JaneliaSciComp/workstation; Howard Hughes Medical Institute, 2023 | RRID: SCR_014302 | |
| Software, algorithm | NeuronBridge codebase | Clements et al., 2022; Clements et al., 2021https://doi.org/10.25378/janelia.12159378.v2 | ||
| Software, algorithm | Fiji | https://fiji.sc | RRID: SCR_0022852 | |
| Software, algorithm | Affinity Designer | https://affinity.serif.com/designer/ | RRID: SCR_016952 | |
| Other | MCFO Hybrid Chemical Tag & IHC for Adult CNS | https://doi.org/10.17504/protocols.io.nyhdft6 | Protocol | |
| Other | FlyLight protocols for dissection, immunohistochemistry, and mounting | https: //www.janelia.org/project-team/flylight/protocols | Protocol |
Additional files
-
Supplementary file 1
Generation 1 MultiColor FlpOut (MCFO) samples included in the study.
Metadata for the included 74,363 MCFO samples from 5155 Gen1 GAL4 lines are tabulated, including line name, landing site, effector, slide code, creation date, GUID, gender, heat shock duration, objectives, release name, and contributing annotator. See Key resources table for effector codes.
- https://cdn.elifesciences.org/articles/80660/elife-80660-supp1-v2.xlsx
-
MDAR checklist
- https://cdn.elifesciences.org/articles/80660/elife-80660-mdarchecklist1-v2.docx
Download links
A two-part list of links to download the article, or parts of the article, in various formats.
Downloads (link to download the article as PDF)
Open citations (links to open the citations from this article in various online reference manager services)
Cite this article (links to download the citations from this article in formats compatible with various reference manager tools)
A searchable image resource of Drosophila GAL4 driver expression patterns with single neuron resolution
eLife 12:e80660.
https://doi.org/10.7554/eLife.80660


