Hippocampal place cell remapping occurs with memory storage of aversive experiences
- Department of Psychology, UCLA, United States
- David Geffen School of Medicine, University of California Los Angeles, United States
- Department of Neurology, David Geffen School of Medicine, University of California, Los Angeles, United States
- Integrative Center for Learning and Memory, University of California, Los Angeles, United States
Figures
Figure 1 with 1 supplement
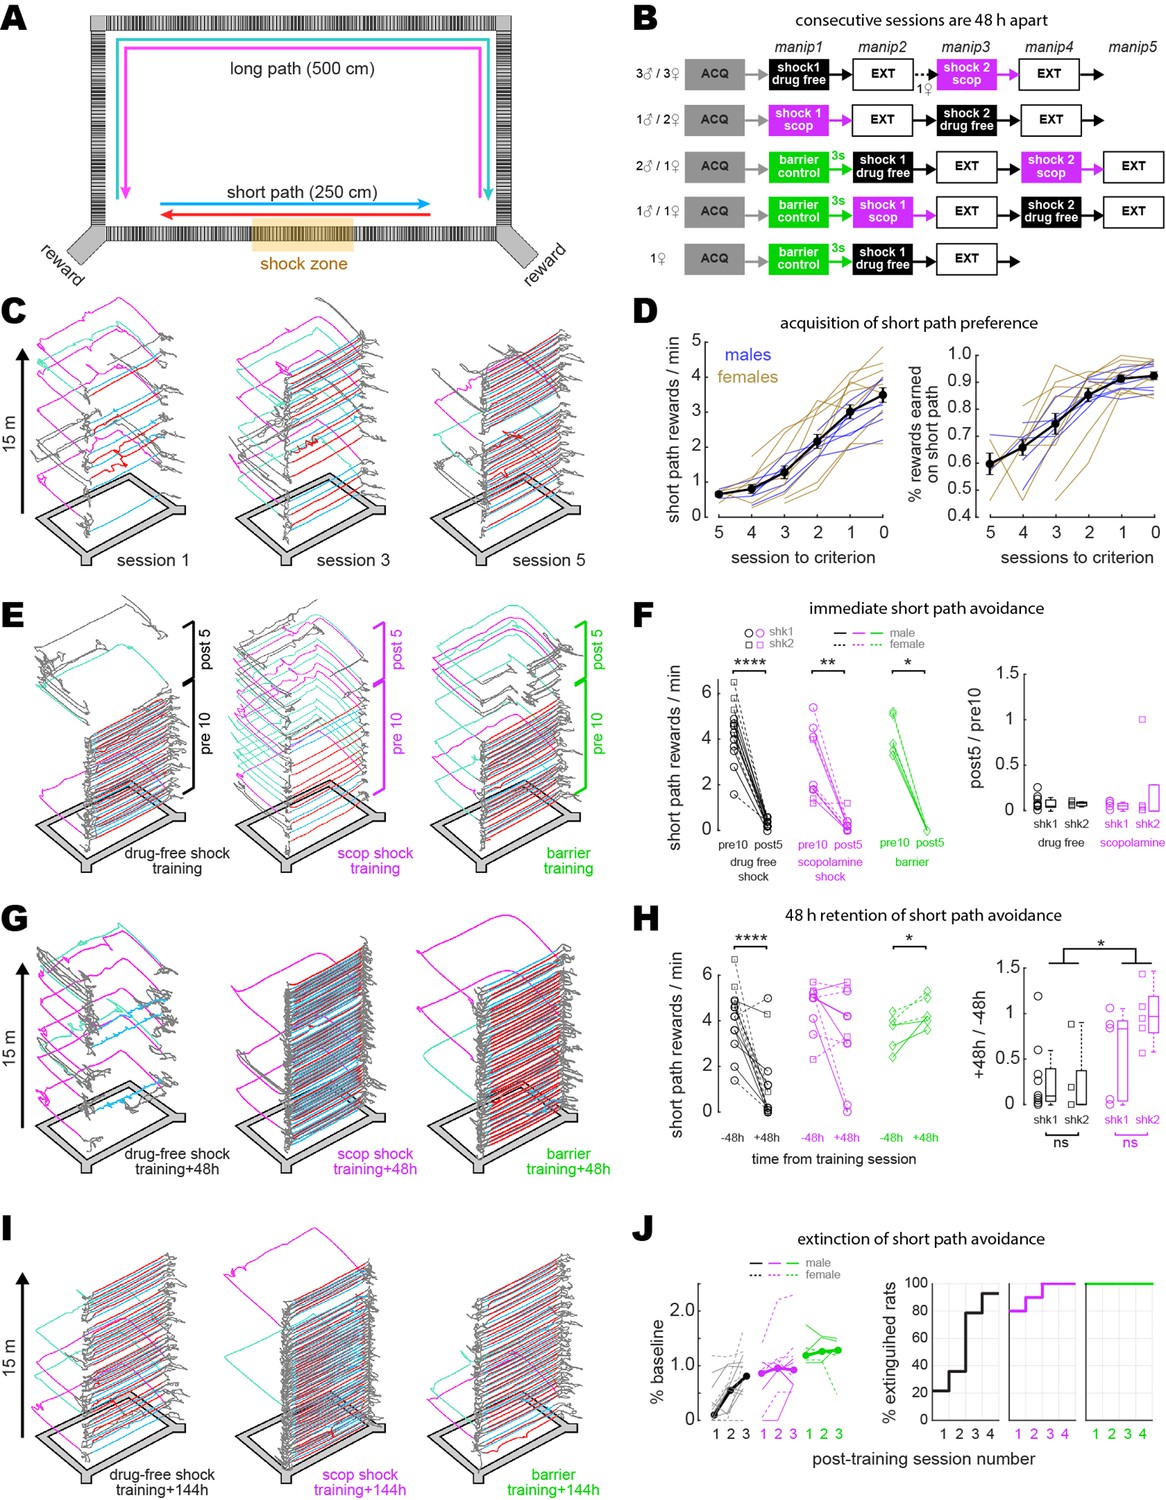
Disruption of aversive avoidance acquisition by scopolamine.
(A) Overhead view of the rectangular maze. (B) Order of treatment for five subgroups of rats in the study. The number of sessions in ACQ and EXT boxes varied per rat, depending on how many sessions it took individual subjects to reach behavioral criteria. (C) Example trajectories from sessions 1, 3, and 5 during initial acquisition of short path preference. (D) Acquisition curves for short path preference; criterion was reached on session 0. Black lines show mean +/- 1 standard deviation for the session (E) Example maze trajectories from training sessions. (F) Left: rewards/min earned on the short path during the first 10 min (pre10) versus last 5 min (post5) of training sessions; symbols indicate whether each rat received its first (shk1) or second (shk2) shock during a session. Right: boxplots show post-shock reduction in short path rewards/min (post5/pre10). (G) Example maze trajectories 48 hr after training. (H) Left: rewards/min earned on the short path during drug-free sessions given 48 hr before (–48 hr) vs. after (+48 hr) training. Right: boxplots show 48 hr retention of shock avoidance (+48 hr/ –48 hr). (I) Example maze trajectories 144 hr after training. (J) Left: extinction curves over the first three post-extinction sessions; number of rewards earned on the short path is measured as a percentage of baseline (48 hr before training; thin lines: individual rats, thick lines: per session median). Right: cumulative distributions show percentage of rats in each training condition meeting extinction criterion (≥2 rewards/min on the short path, and at least twice as many short path rewards as long path rewards) at 1, 2, 3, or 4 d after training. *p<0.05, **p<0.01, ****p<0.0001.
Figure 1—figure supplement 1
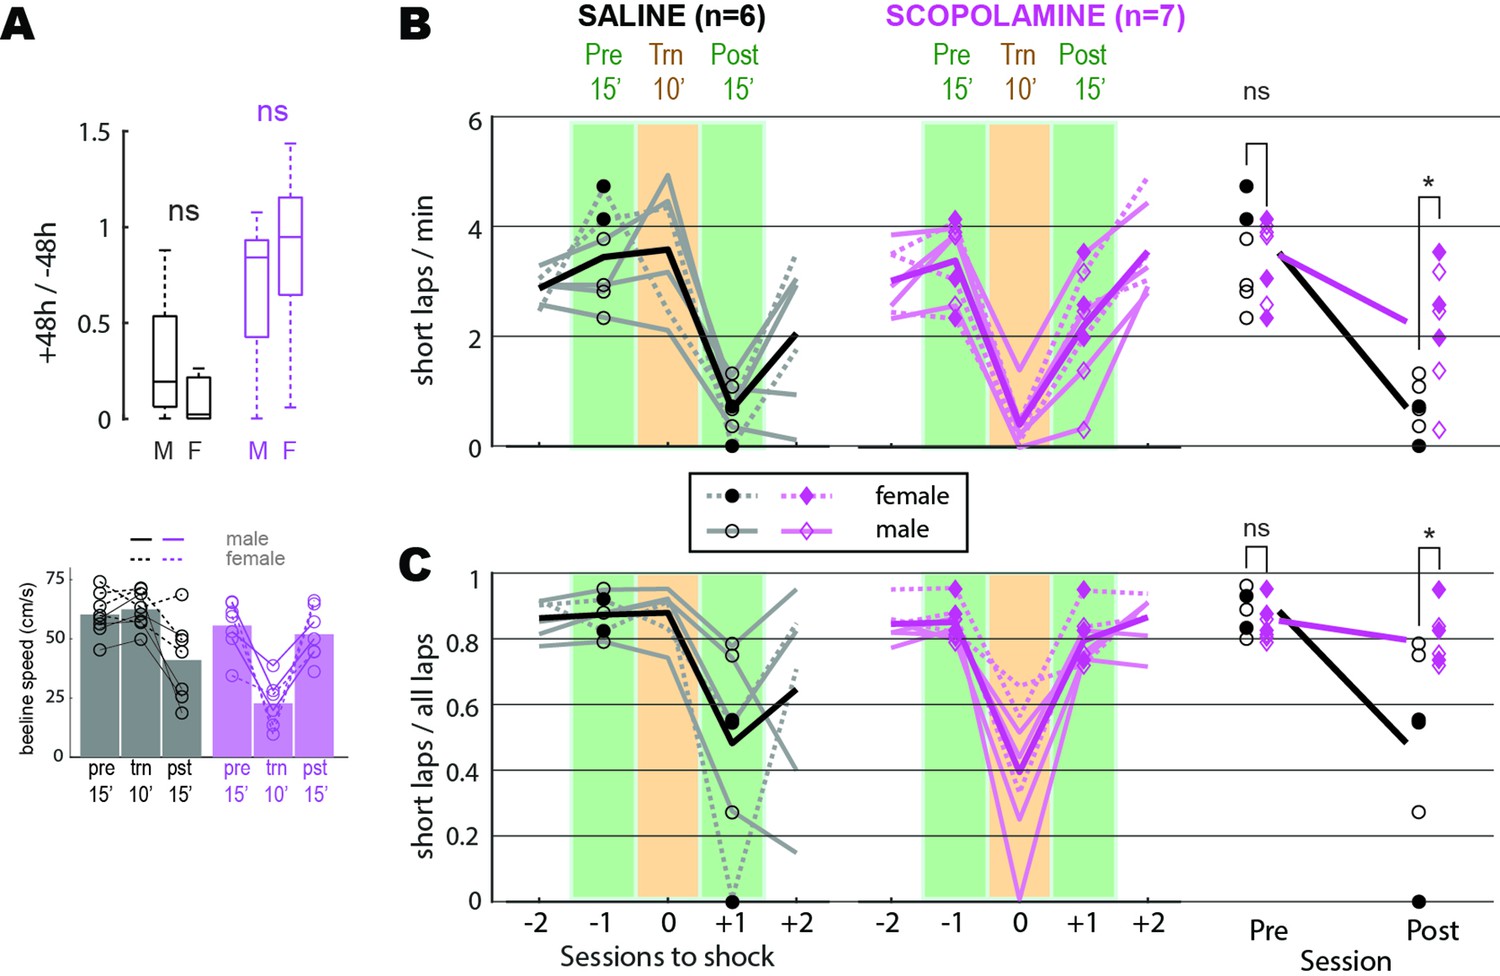
Avoidance learning in male versus female and scopolamine versus saline injected rats.
(A) Top: Mann–Whitney U tests found that 48 hr retention of avoidance behavior did not differ for males versus females in the drug-free or scopolamine shock conditions. Bottom: median beeline running speeds per session. (B, C) Seven rats without lens implants were trained to criterion for preferring the short path on the maze, then given a shock avoidance session. On the day of shock avoidance training, rats either received injections of saline (n = 3) or scopolamine (n = 4) 30 min prior to the session. Aftershock avoidance training, rats were given standard sessions every 48 hr (with no injection) until they reached criterion for extinction of avoidance. Rats then received another avoidance training session preceded by an injection that differed from the one they had received before (i.e., rats previously injected with saline were injected with scopolamine and vice versa). One of the four rats injected with saline prior to the second shock session experienced a health issue and was removed from the study prior to being given a shock session. Graphs in (B) show number of short laps per minute during five sessions (two prior to shock training session, shock training session, two aftershock training session) for rats injected with saline and scopolamine; a 2 × 2 mixed ANOVA (rightmost graph) was performed with drug condition (saline versus scopolamine) as an independent factor and training condition (pre versus post) as a repeated factor; shock session includes only data from the 10’ pre-shock period, whereas all other days include data from the full 15’ session. There was a significant interaction (F1,11 = 7.6, p=0.0186) indicating that saline injected rats exhibited more post-training avoidance (i.e., greater reduction in short laps/min) than scopolamine-injected rats. Post hoc independent t-tests (Bonferroni corrected, indicated by asterisks) found that rats in the two drug conditions ran similar numbers of short laps/min before avoidance training, but saline rats ran significantly fewer short laps/min after training. Scopolamine rats ran significantly fewer short laps/min prior to shock on the training day (paired t5 = 8.7, p=0.00034), replicating the finding from the main text that scopolamine rats were impaired at expressing their previously learned preference for the short path. Graphs in (C) are the same as in (A) but show the ratio of short laps to all laps run during each session. A significant interaction (F1,11 = 7.6, p=0.0186) again indicated that saline injected rats exhibited more post-training avoidance (i.e., greater reduction in proportion of short laps) than scopolamine-injected rats. Scopolamine rats chose the short path significantly less than the long path on the training day (paired t5 = 5.4, p=0.003), replicating the finding from the main text that scopolamine rats were impaired at expressing their previously learned preference for the short path. *p<0.05 for Bonferroni correct post hoc comparisons.
Figure 2 with 8 supplements
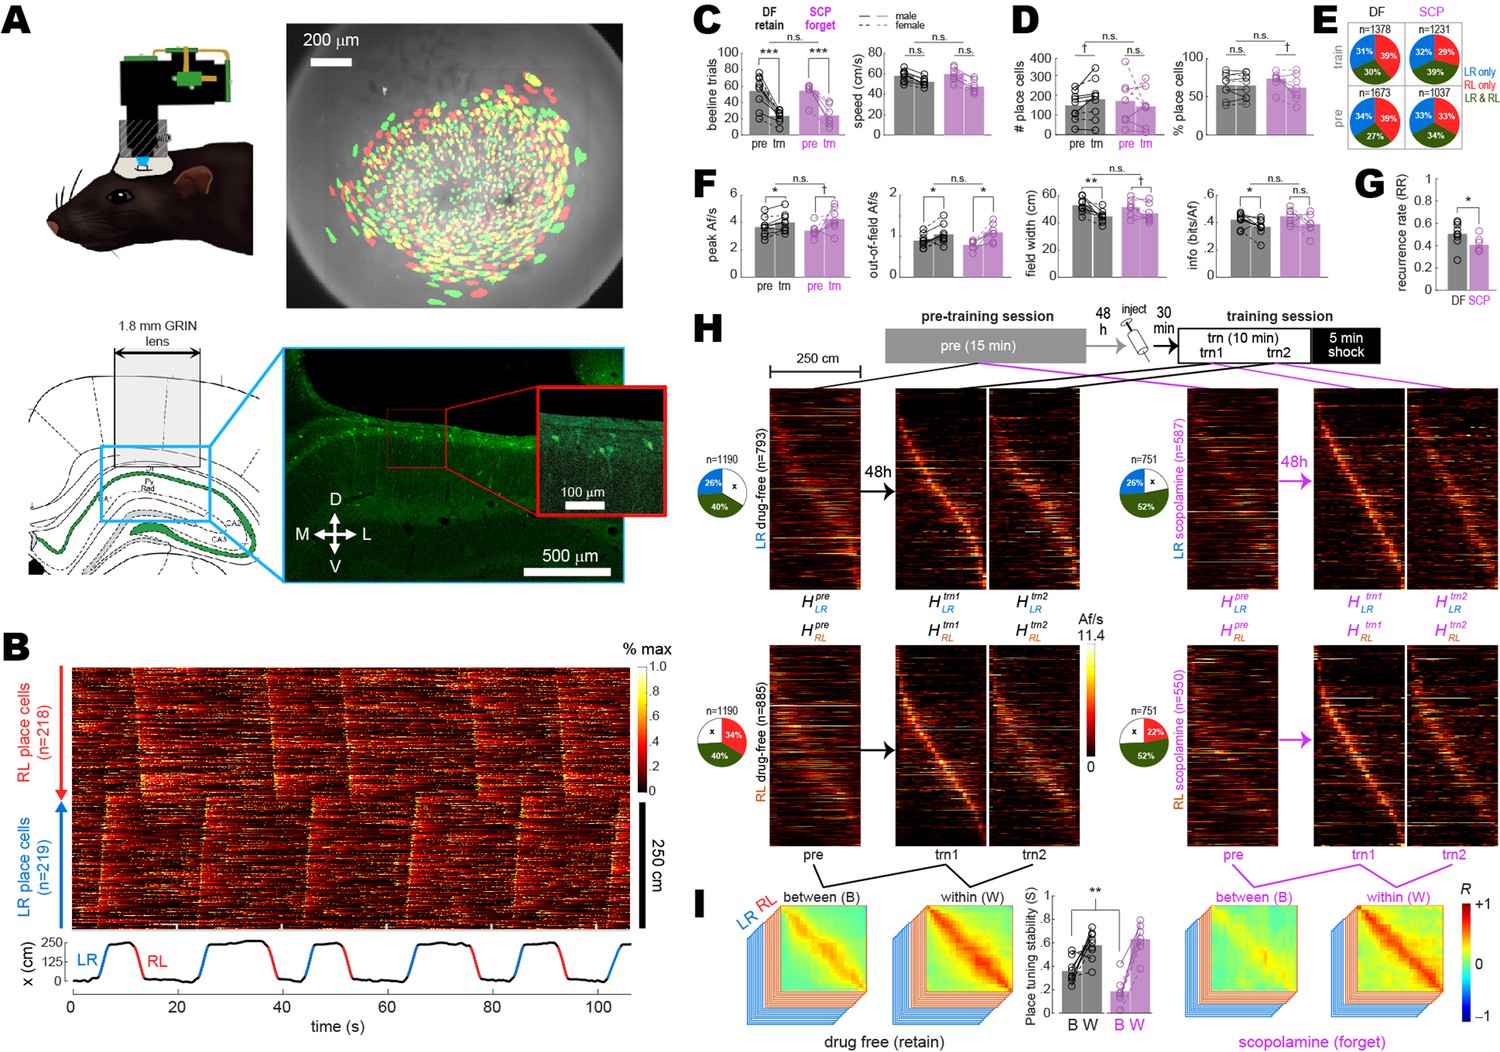
Between- versus within-session population coding.
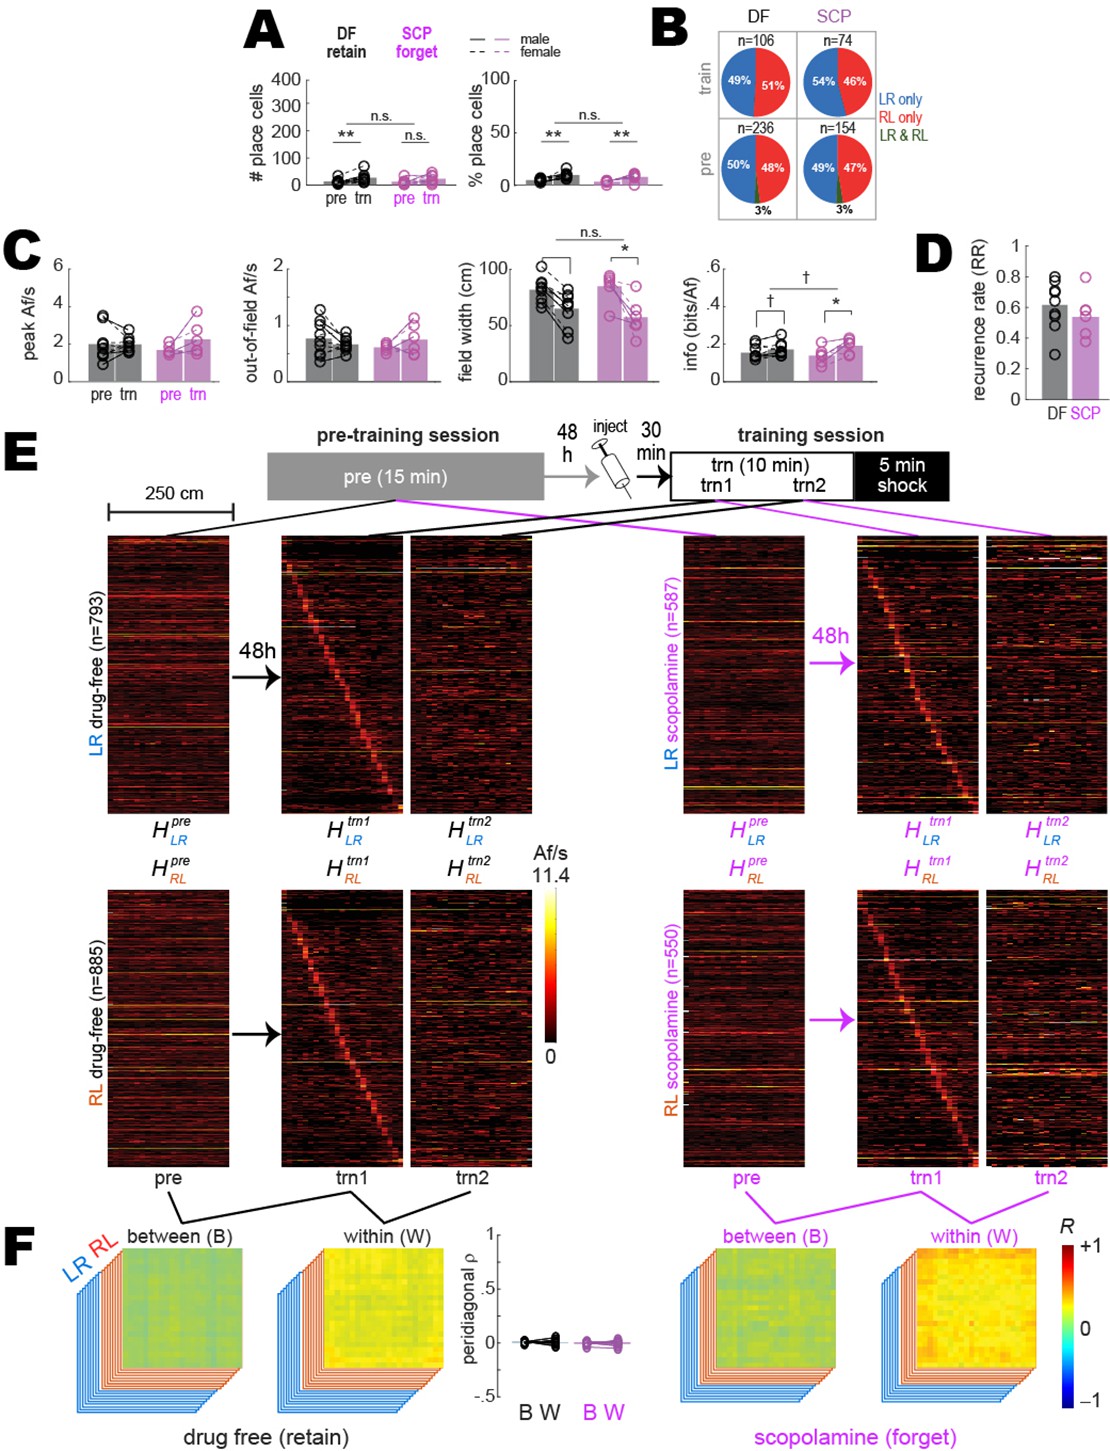
(A) Upper left: illustration of rat wearing MiniLFOV. Upper right: cell contours identified during pre-training (green) and training (red) sessions in one rat; regions of overlap between contours that recurred in both sessions appear yellow. Lower left: target position of GRIN lens over the CA1 layer. Lower right: fluorescence image of lens position from the example rat. (B) Top: rastergram shows normalized calcium fluorescence traces of place cells (one per row, sorted by preferred firing location and direction) during several traversals of the short path during an example session. Bottom: rat’s position (black) with running epochs colored by direction of travel (‘LR,’ left to right, in blue; ‘RL,’ right to left, in red). (C) Individual rat data (lines and symbols) and session means (bars) for the number of subsampled beeline trials (left) and median beeline running speed (right) during pre-training (pre) and training (trn) sessions; subsampled beeline trial counts were lower for trn than pre sessions because only trials from the first 10 min of trn (prior to shock delivery) were included; running speeds were lower for trn than pre sessions because scopolamine (SCP) reduced running speeds, resulting in preferential subsampling of slower beeline trials from drug-free (DF) sessions by the algorithm that minimized running speed differences between training conditions (see ‘Methods’). (D) Bar/line graphs show number of place cells imaged per rat (left) and percentage of all imaged cells classified as place cells (right) during pre and trn sessions. (E) Pie graphs show percentages of place cells imaged per condition (‘n’ gives total number summed over rats) that were spatially tuned in the LR only, RL only, or both LR and RL running directions. (F) Tuning curve properties of place cells imaged during pre and trn sessions. (G) Place cell recurrence ratios (RR) between pre and trn sessions. (H) Top: diagram shows timeline for pre and trn sessions given 48 hr apart. Bottom: tuning curve heatmaps for recurring place cells (from all rats combined, co-sorted by peak locations from the trn1 session) that were spatially tuned in the LR (top) or RL (bottom) running directions; separate heatmaps are shown for pre, trn part 1 (trn1), and trn part 2 (trn2) sessions. (I) Between- (B) and within- (W) session population vector correlation matrices are shown for DF and SCP shock training conditions; middle bar graph shows median place tuning stability (S) for each rat (lines and symbols) and mean over rats (bars) for B and W heatmap pairs. Asterisks in (C) and (D) denote significance for main effect of DF vs. SCP or uncorrected t-test comparing pre vs. trn sessions; asterisks in (E) and (G) denote significance for uncorrected t-tests. †p<0.1; *p<0.05; **p<0.01; ***p<0.001.
Figure 2—figure supplement 1
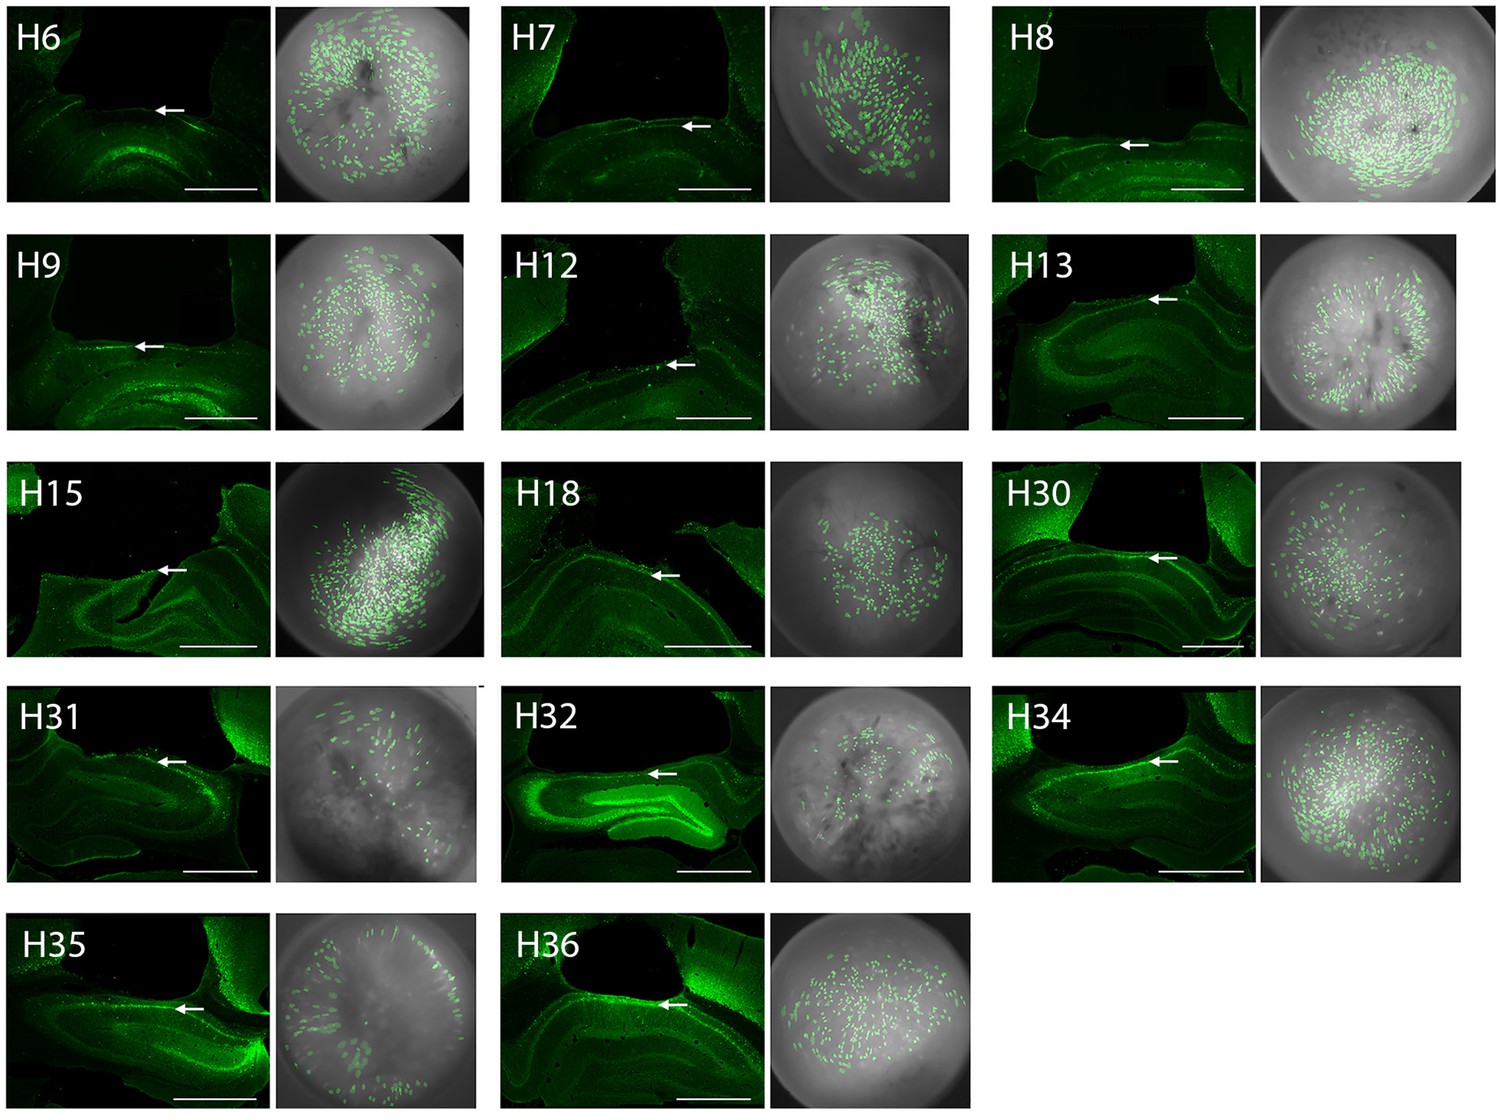
GRIN lens placements and cell contours for imaged neurons in CA1.
The left image in each pair shows a photomicrograph of the GRIN lens placement for one of the rats in the study; arrows point to the CA1 layer, scale bar = 1 mm. The right image in each pair shows cell contours (green) identified by CNMFe superimposed over cropped images of the MiniLFOV’s view through the 1.8 mm GRIN lens; the image shown for each rat was obtained from the day of the rat’s drug-free shock training session. Figure shows results from 14 rats that were included in imaging data analysis (one rat that was included in the behavior analysis but dropped from image analysis is not shown).
Figure 2—figure supplement 2
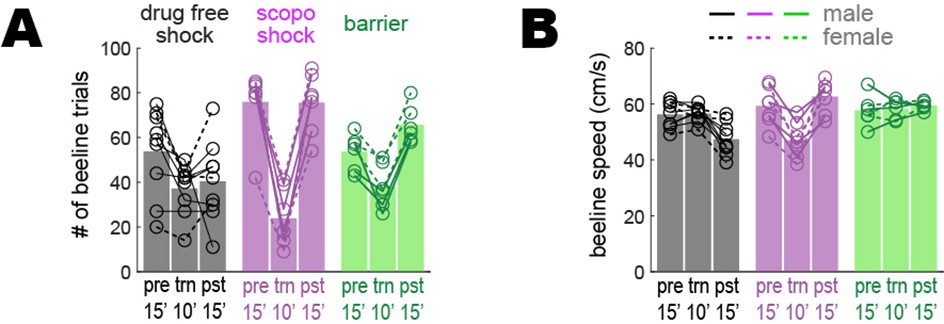
Beeline trial counts and running speeds prior to downsampling.
To control for any possible confounding effects of behavior upon imaging results, analyses presented in the main text were performed on behavioral data that was downsampled to equalize the number of beeline trials and median running speed across imaging sessions (see ‘Methods’). Graphs plotted here show the rats’ behavior prior to downsampling beeline trials in the drug-free shock condition for rats that retained avoidance learning (n = 9), scopolamine shock condition for rats that failed to retain avoidance learning (n = 7), and barrier training condition (n = 6). (A) Number of beeline trials during pre-training (pre; data from full 15’ session), training (trn; data from 10’ pre-shock portion of session), and post-extinction (pst; data from full 15’ session) sessions prior to downsampling; a 3 × 3 mixed ANOVA yielded a marginal main effect of training condition (drug-free shock, scopolamine shock, barrier: F2,19 = 3.5, p=0.0509), a significant main effect of session (pre, trn, pst: F2,38 = 51.5, p=1.49e-11), and a significant interaction (F4,38 = 13.9, p=4.37e-7). In all training conditions there were fewer trials during ‘trn’ sessions because data only came from the first 10 min (prior to shock or barrier introduction) of the training sessions, compared with 15 min of data for other session types. For the drug-free shock condition, the mean number of beeline trials is marginally lower during ‘pst’ than ‘pre’ sessions (paired t8 = 2.1, p=0.0676; uncorrected) because despite having reached the extinction criteria during the ‘pst’ session, rats persisted in showing some avoidance of the short path and thus earned fewer short path rewards during the ‘pst’ session. (B) Median beeline running speed during per session prior to downsampling; a 3 × 3 mixed ANOVA yielded a marginal main effect of training condition (drug-free shock, scopolamine shock, barrier: F2,19 = 3.07, p=0.0698), a significant main effect of session (pre, trn, pst: F2,38 = 5.08, p=0.0111), and a significant interaction (F4,38 = 20.8, p=3.74e-9). Uncorrected post hoc paired t-tests found that for the drug-free shock condition, beeline running speed was significantly lower during ‘pst’ than ‘pre’ (t8 = 4.4, p=0.0022) or ‘trn’ (t8 = 4.7, p=0.0015) sessions; this was because despite having reached the avoidance extinction criteria during the ‘pst’ session, rats persisted in running more a bit slowly on the short path after avoidance extinction. In addition, during ‘trn’ sessions given on scopolamine, rats ran more slowly during ‘trn’ sessions than during ‘pre’ (t6 = 5.5, p=0.0015) or ‘pst’ (t6 = 5.2, p=0.0019) sessions (both of which were given drug free) because the drug acutely reduced running speeds on the maze, as reported in the main text.
Figure 2—figure supplement 3
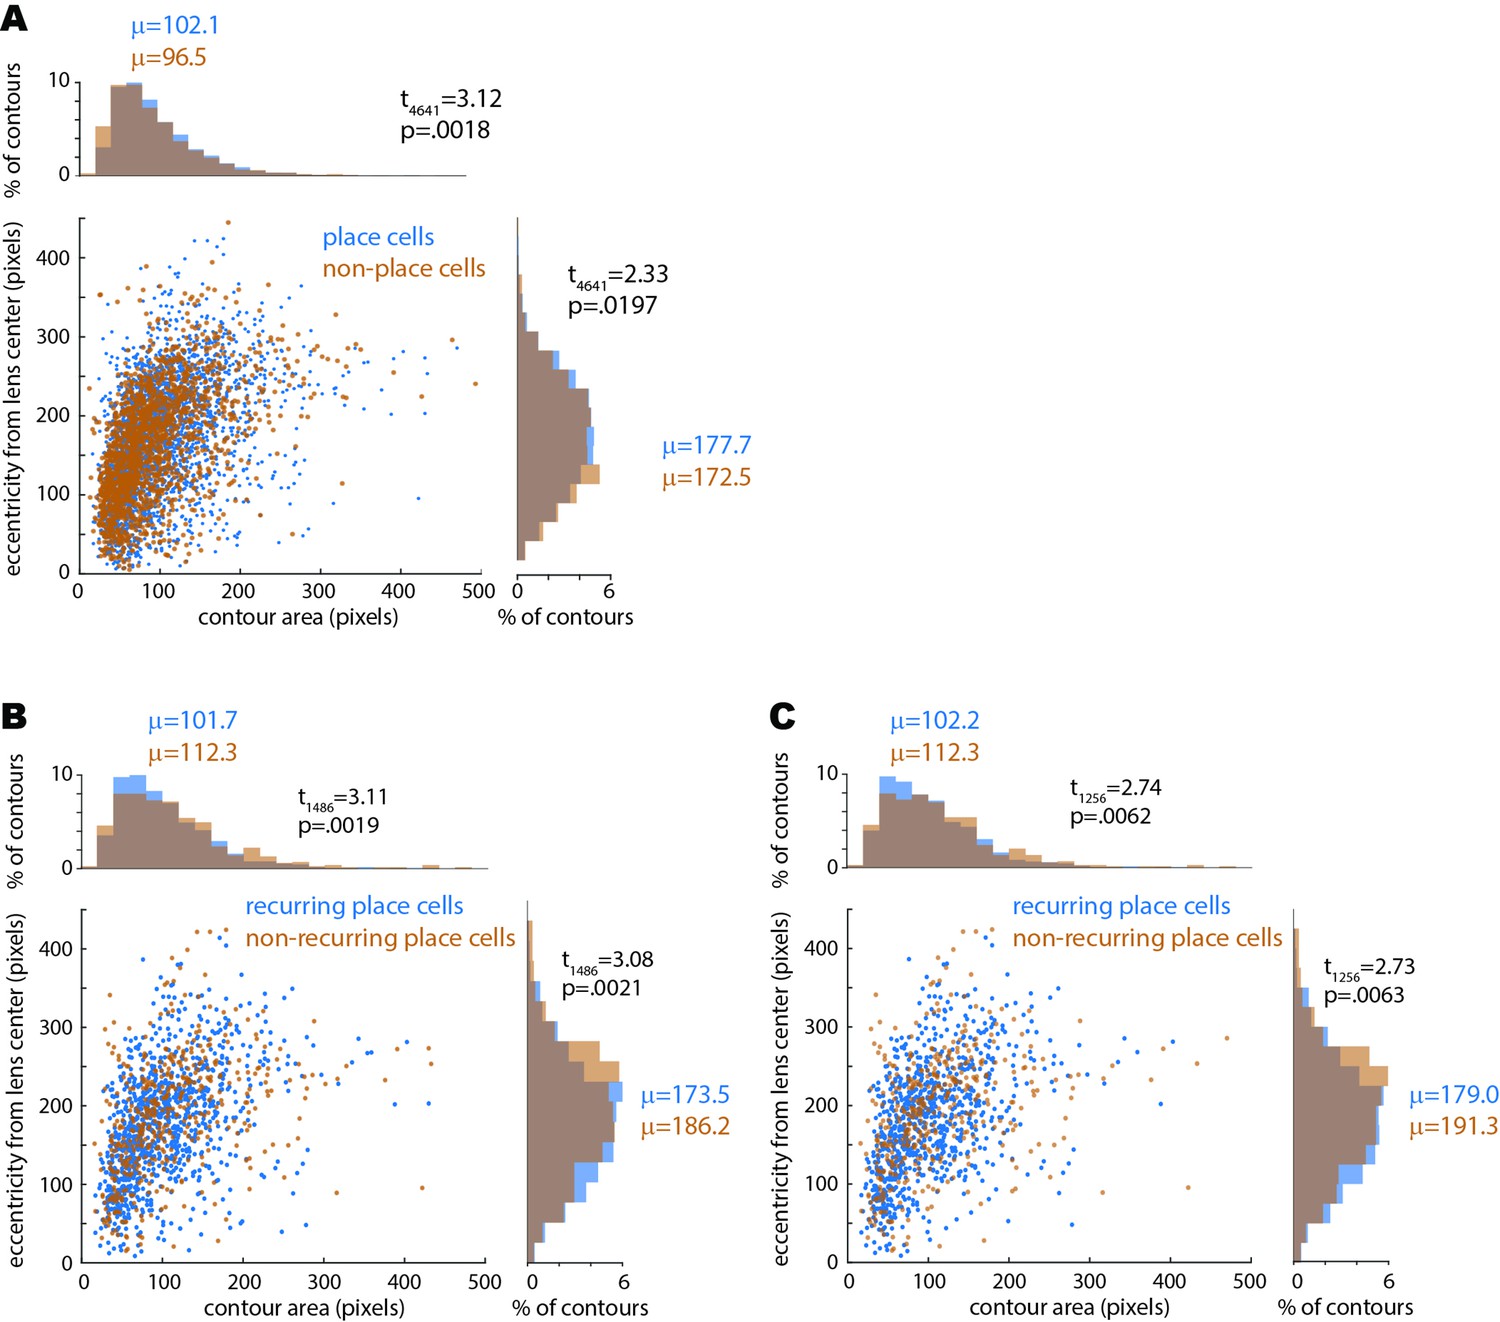
Relationship between place tuning versus size and eccentricity of imaged cell contours.
(A) Scatter plot shows contour area (in pixels, x-axis) versus eccentricity of contour from center of the GRIN lens (in pixels, y-axis) for all place cells and non-place cells imaged during the pre-training session for the drug-free and scopolamine shock conditions; histograms on perimeter show distributions of values plotted on each axis. Independent t-test results show that non-place cells were slightly but significantly smaller and less eccentric from the lens center than place cells, possibly because residual post-correction motion artifact may have caused the smallest cell contours to jitter occasionally out of their ROI and therefore meet the criterion for spatial tuning stability slightly less often. (B) Same as (A) except graphs show contour area and eccentricity for all place cells imaged during the pre-training session prior to drug-free shocks; place cells that recurred during the subsequent shock session are shown in blue, whereas place cells that did not recur are shown in orange. Independent t-test results show that non-recurring cells were slightly but significantly larger and more eccentric than recurring place cells, possibly because compared with contours near the center of the lens, between-session overlap of contours at eccentric locations (near the edge of the lens) was slightly more sensitive to small between-session changes in the mounted position of the miniscope camera. (C) Same as (B) except data is shown for place cells imaged during the pre-training session prior to shocks on scopolamine (rather than drug free); as in the drug-free condition, non-recurring cells were slightly but significantly larger and more eccentric than recurring place cells; hence the effect of eccentricity on recurrence probability was similar on the drug-free and scopolamine conditions. Confirming this, independent t-tests found no significant difference between the drug-free versus scopolamine conditions in the size of recurring (t1860 = 0.18, p=0.86) or non-recurring (t882 = 0.02, p=0.98) place cells, nor in the eccentricity of recurring (t1860 = 1.62, p=0.11) or non-recurring (t882 = 1.01, p=0.31) place cells.
Figure 2—figure supplement 4
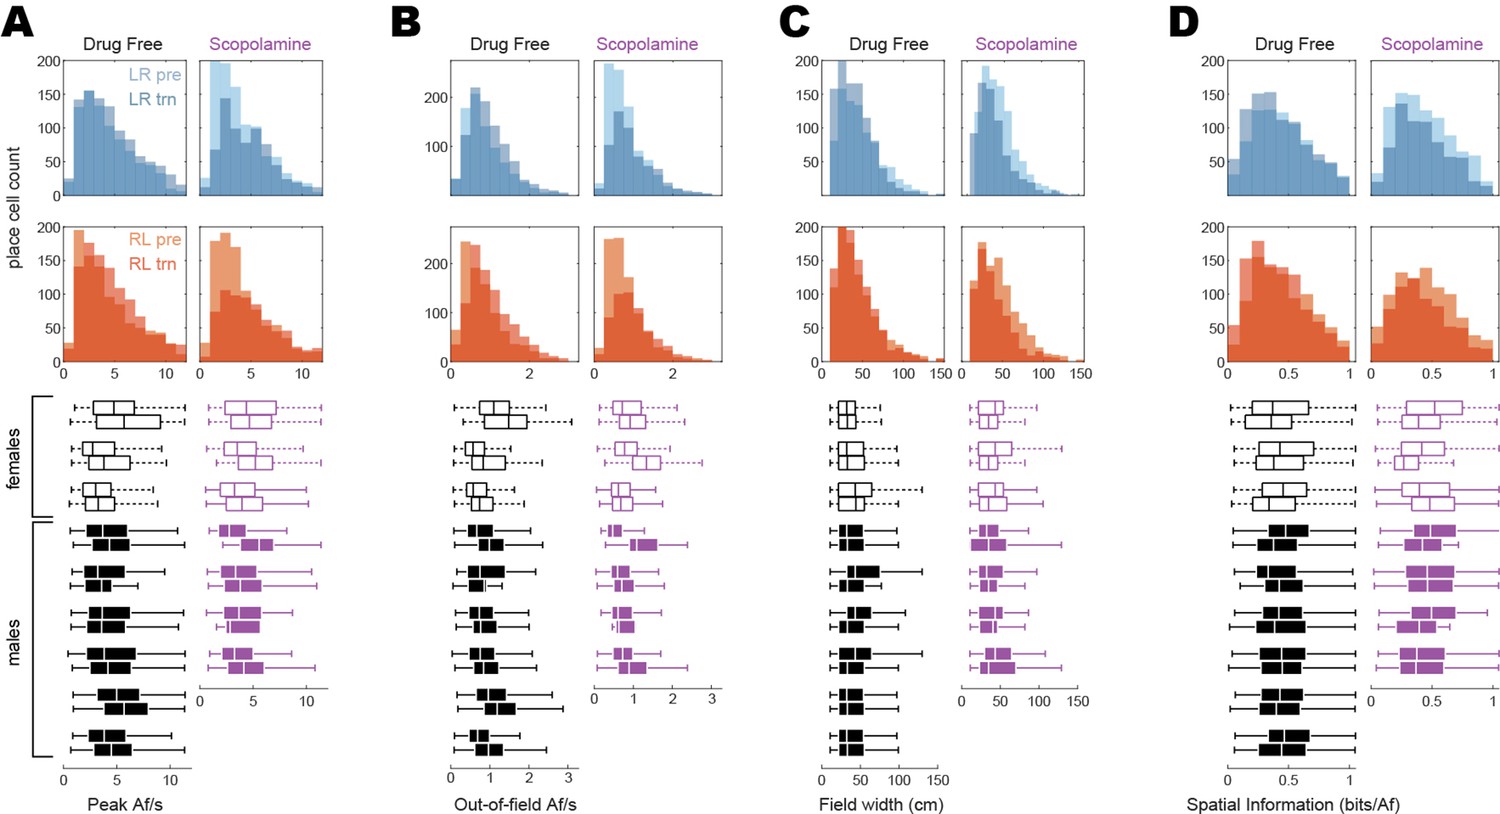
Distributions of place cell tuning properties.
Histograms at top compare pre-training and training session distributions of firing properties measured from tuning curves that were spatially tuned in the LR (top row, blue) or RL (second from top row, red) direction during one or both sessions. Boxplots below histograms show each rat’s median and range of tuning property values for LR and RL tuning curves combined; boxplot medians for each rat are the same values plotted for each rat in Figure 2F. (A) Peak Af/s rates. From the histograms, it can be seen that scopolamine acutely reduces the proportion of tuning curves peaks that are <5 Af/s while having little effect on the frequency of peaks that are >5 Af/s. (B) Out-of-field Af/s rates. Similar to peak Af/s rates, scopolamine acutely reduced the incidence of low out-of-field rates (<1 Af/s), while having little effect on the incidence of higher rates (>1 Af/s). (C) Field widths. Scopolamine slightly narrows the width of place fields; since the field width is defined as the number of spatial bins that exceed 50% of the peak rate, this slight narrowing of place fields may be related to the fact that peak Af/s rates are higher on scopolamine (see A). (D) Spatial information. Distributions of bits/Af showed little change on scopolamine.
Figure 2—figure supplement 5
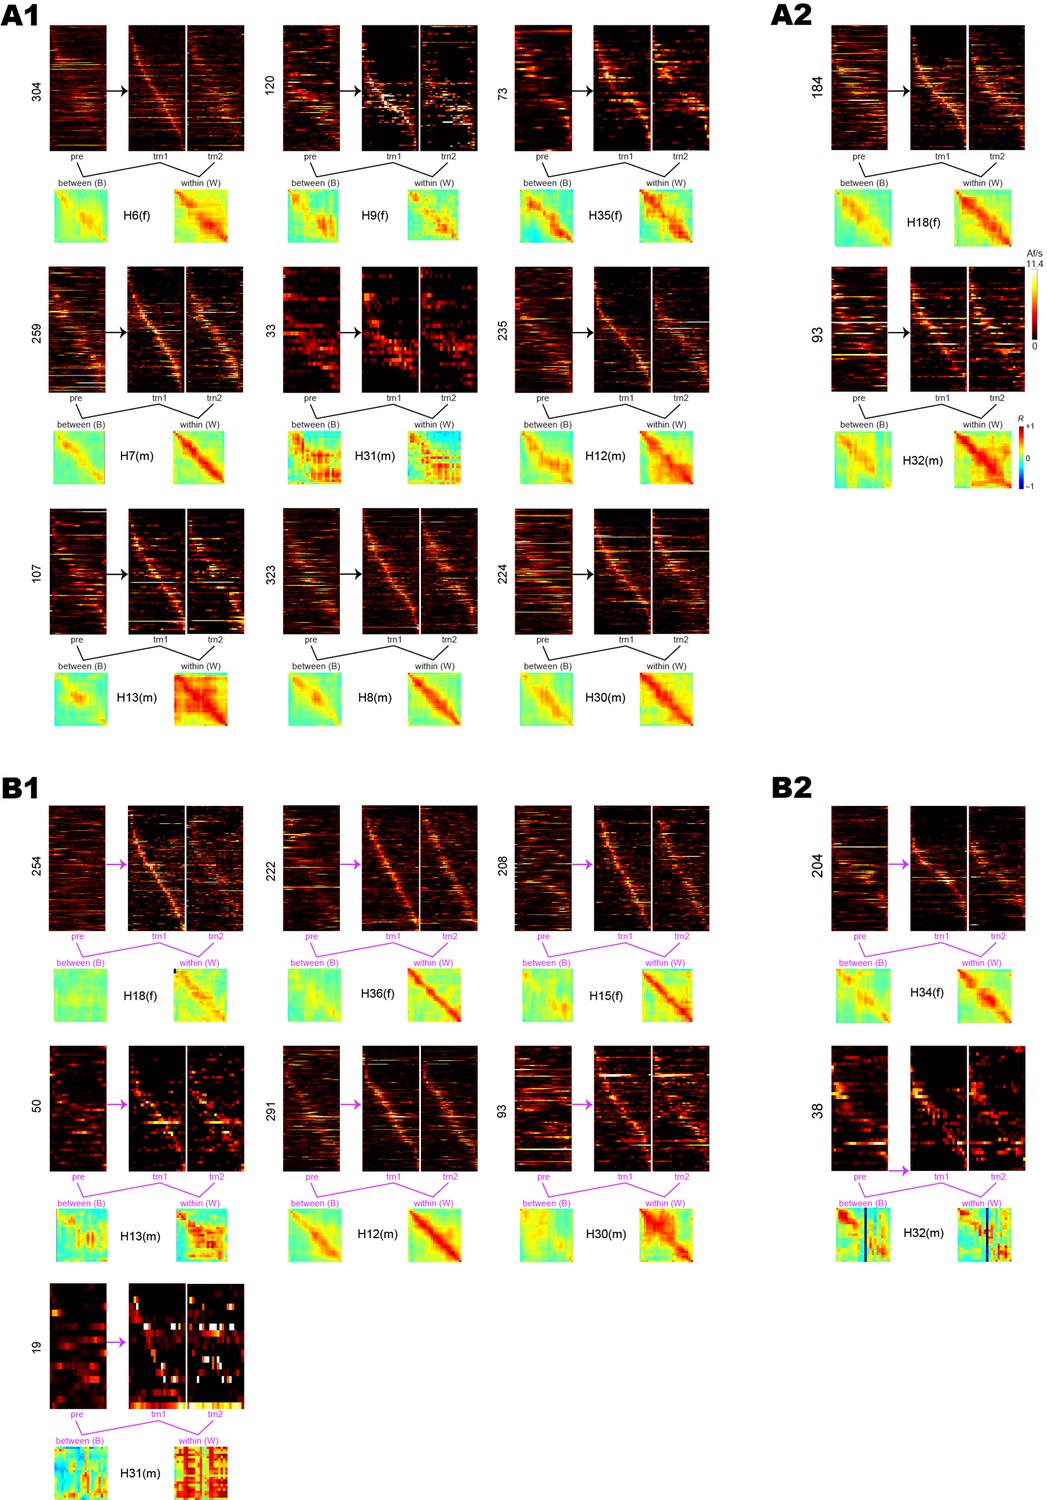
Pre-training and training session data from individual rats.
As in Figure 2H, heatmaps are shown for the pre, trn1, and trn2 sessions, with between- (pre vs. trn1) and within- (trn1 vs. trn2) session correlation matrices below heatmaps. For brevity, LR and RL tuning curves are co-sorted within heatmaps so that cells meeting spatial selectivity criteria in both running directions contribute two rows to each heatmap (one per direction), whereas cells meeting selectivity criteria in only one direction contribute only row to each heatmap. (A1) Rats (n = 9) from the drug-free shock condition that showed 48 hr avoidance retention. (A2) Rats (n = 2) from the drug-free shock condition that failed to show 48 hr avoidance retention. (B1) Rats (n = 7) from the scopolamine condition that failed to show 48 h avoidance retention. (B2) Rats (n = 2) from the scopolamine shock condition that showed 48 hr avoidance retention.
Figure 2—figure supplement 6
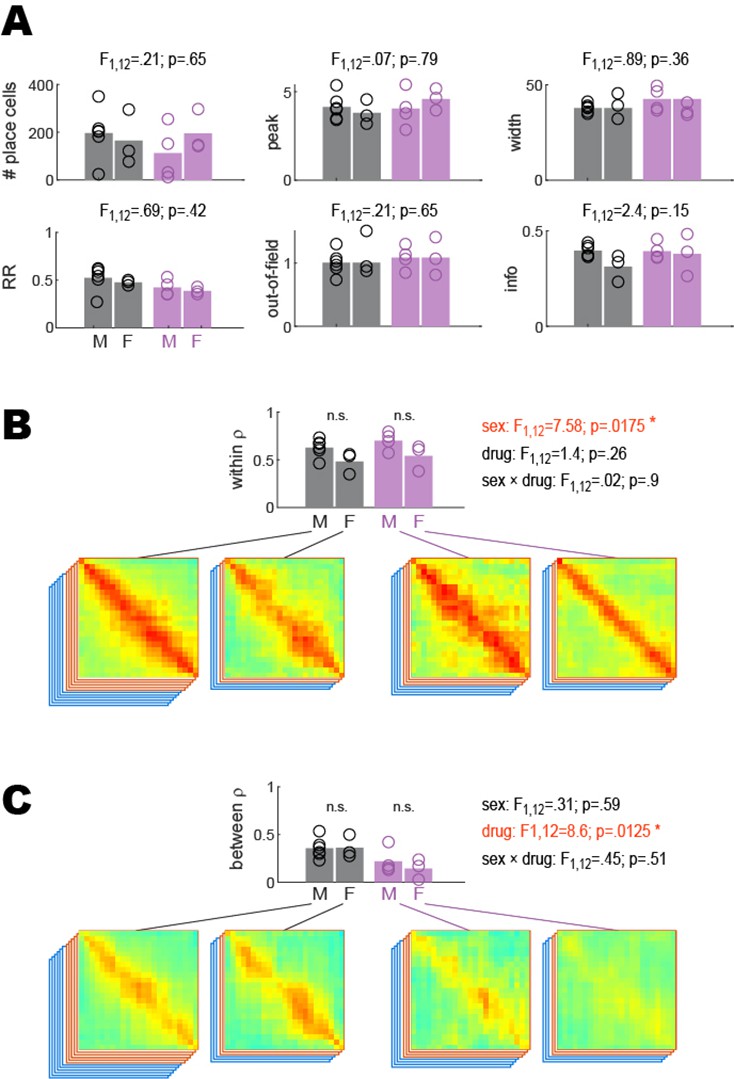
Between- and within-session place coding in male versus female rats.
Statistical analyses reported in Figure 2 were performed to compare results from male versus female rats. 2 × 2 ANOVAs were performed with sex (M, F) and drug (drug-free, scopolamine) as independent factors. (A) There were no significant effects of sex upon the number of place cells imaged per rat (analysis shown for training session), recurrence ratio (RR), or spatial tuning properties (peak rate, out-of-field rate, field width, spatial information); main effect of sex is shown above each graph; however, sex-by-drug interactions also were not significant (not shown). (B) As reported in the main text, there was no significant main effect of drug upon within-session population vector correlations; however, there was a significant main effect of sex arising from the fact that females exhibited lower within-session population vector correlations than males in both drug conditions; this was the only significant effect of sex that was found in any of the analyses. (C) As reported in the main text, there was a significant main effect of drug upon between-session population vector correlations; however, there was no significant main effect of sex and no sex-by-drug interaction.
Figure 2—figure supplement 7
Shuffled analysis of between- and within-session population coding.
Results shown are similar to those plotted in Figure 2, except that prior to analysis, the deconvolved spike train from every beeline trial was circularly shifted by a random amount against position tracking data from the trial. (A) Bar/line graphs show number (left) and percentage (right) of cells per rat that were classified as place cells after the random circular shift; the number of place cells was greatly reduced from that shown in Figure 2. There was a significant tendency for more shuffled trains to meet place criteria in trn than pre sessions, attributable to the fact that all detections of place cells in shuffled data were artifactual and the likelihood of artifactual detection was higher for trn than pre sessions because fewer trials were analyzed in trn sessions (from which only the first 10 min pre-shock were analyzed) than pre sessions (from which all trials were analyzed across the 15 min session). (B) Pie graphs show percentages of ‘place cells’ detected in shuffled data (‘n’ gives total number summed over rats) that were spatially tuned in the LR only, RL only, or both LR&RL running directions. (C) Tuning curve properties of ‘place cells’ detected in shuffled data; tuning property differences between trn and pre sessions are attributable to differences in behavior sampling. (D) Recurrence ratios (RR) between pre and trn sessions for ‘place cells’ detected in shuffled data. (E, F) Results plotted in panels (E, F) are from analyses of shuffled trains performed on cells that were classified as place cells based on their unshuffled trains (the same population of place cells analyzed in Figure 2). (E) Top: diagram shows timeline for pre and trn sessions given 48 hr apart. Bottom: tuning curve heatmaps of shuffled trains for recurring place cells (from all rats combined, co-sorted by peak locations from the trn1 session) whose unshuffled trains were spatially tuned in the LR (top) or RL (bottom) running directions; separate heatmaps are shown for pre, trn part 1 (trn1), and trn part 2 (trn2) sessions. (F) Between- (B) and within- (W) session population vector correlation matrices are shown for DF and SCP shock training conditions; middle bar graph shows median place tuning stability (S) derived from shuffled trains for each rat (lines and symbols) and mean over rats (bars) for B and W heatmap pairs. p<0.1; *p<0.05; **p<0.01; ***p<0.001. Higher correlation values were uniformly distributed throughout the within- than between-session correlation matrices, indicating that baseline firing rates tended to be better correlated within than between sessions.
Figure 2—figure supplement 8
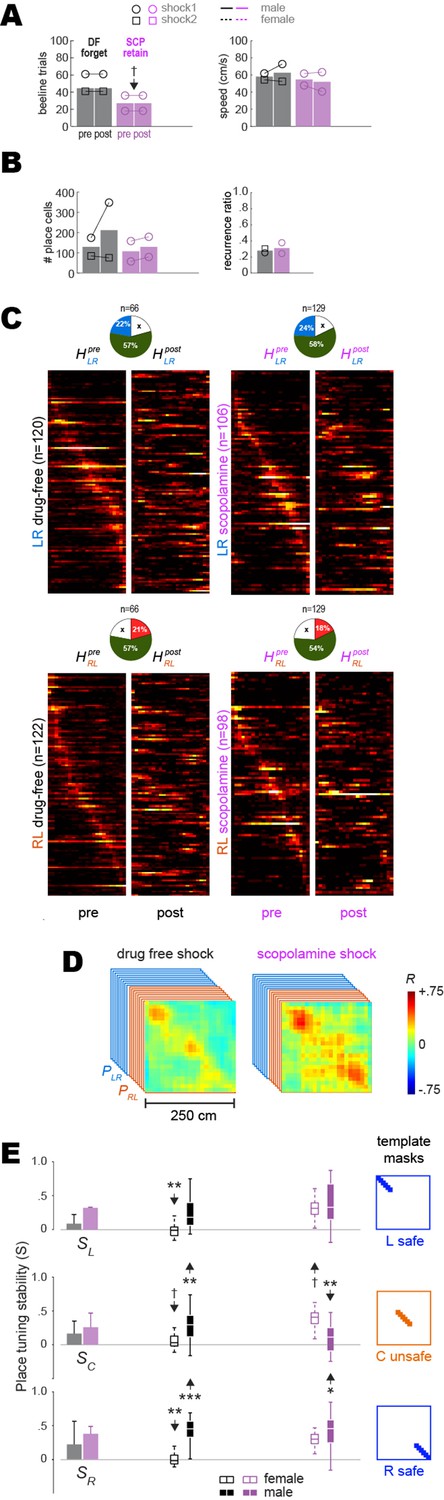
Pre-training and training session results from drug-free (DF) rats that failed to retain avoidance and scopolamine (SCP) rats that successfully retained avoidance.
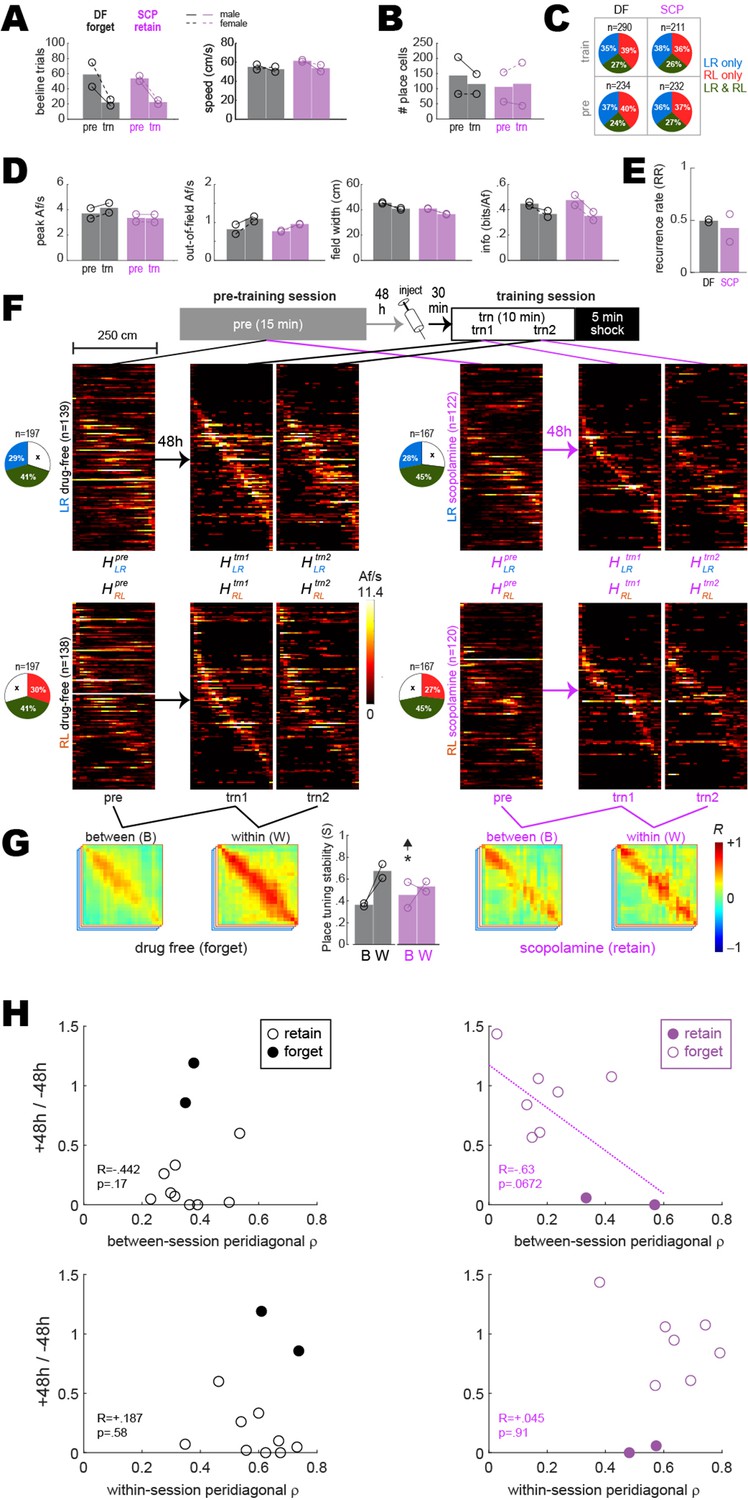
Panels (A–G) are similar to those shown in panels (C–I) of Figure 2, except here, results are shown for DF rats that failed to retain avoidance (n = 2) and SCP rats that successfully retained avoidance (n = 2) 48 hr after training. The sample size of rats was not sufficient to perform ANOVAs, so independent t-tests were performed to compare values included in each graph bar against values in corresponding bars from Figure 2. The only comparison to beat p<0.05 (uncorrected) between-session place tuning stability (S) in the SCP condition (‘*’ and up arrow over center bar graph in panel G; compare with panel I of Figure 2). Hence, in rats for which SCP failed to block avoidance, SCP also failed to impair between-session stability of place cell population vectors. Further supporting this conclusion, a marginally significant correlation was observed (see regression line in panel H, upper right) between 48 hr avoidance retention scores and between-session S values in the SCP condition (n = 11 rats, combining those that retained and forgot the avoidance response). Hence, lower between-session place tuning stability was associated with more severely impaired retention of avoidance. No such correlations were observed in the DF condition or for within-session stability scores.
Figure 3 with 5 supplements
Remapping of place cells is induced by avoidance learning.
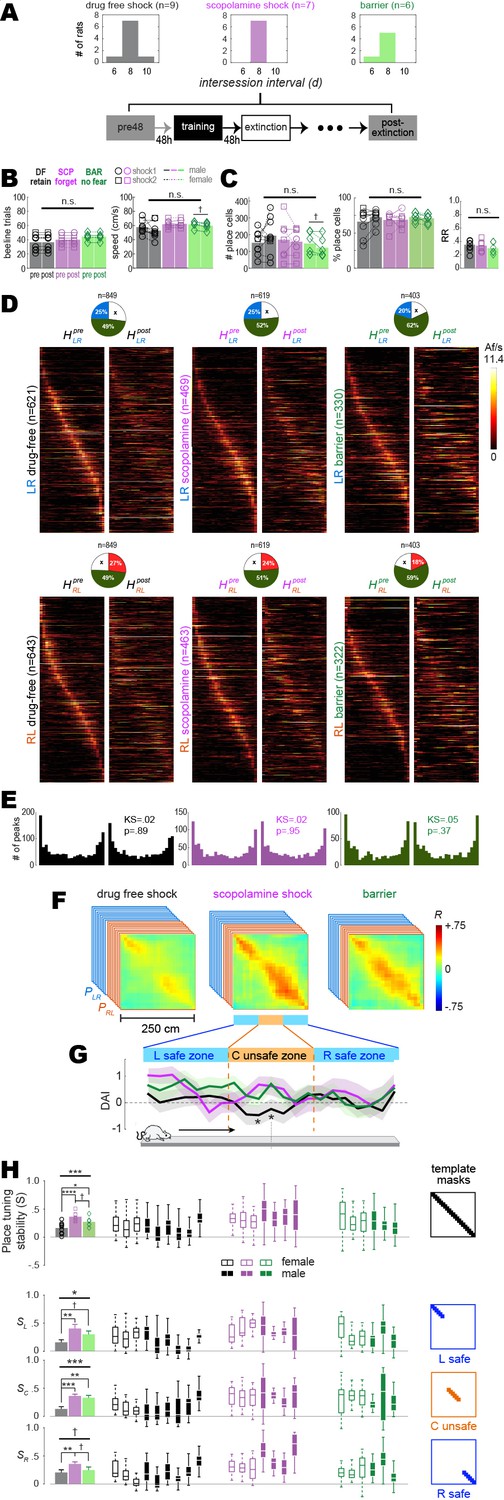
(A) Top: bar graphs show distributions of intersession intervals between pre-training (pre) and post-extinction (post) session pairs included in the analysis. Bottom: diagram shows timeline for pre and post sessions. (B) Left: number of subsampled beeline trials did not differ significantly by training condition or session. Right: running speeds did not differ significantly by training condition; there was a marginal difference between pre vs. post running speeds in the barrier (but not drug-free or scopolamine shock) condition. (C) Left: total number of imaged place cells (recurring and non-recurring) did not differ significantly by training condition; there was a marginal difference between pre vs. post place cell counts in the barrier (but not drug-free or scopolamine shock) condition. Middle: percentage of all imaged cells (recurring and non-recurring) per session that were classified as place cells. Right: between-session place cell recurrence ratios did not differ by training condition. (D) Heatmap pairs show pre and post tuning curves for recurring place cells that were spatially tuned in the LR (top row) and RL (bottom row) running direction; both heatmaps in each pair are co-sorted by peak locations from the pre session. Pie charts show the proportion of recurring place cells (total number given at top) for which tuning curves were included in LR and RL heatmap pairs. (E) Kolmogorov–Smirnov tests show that distributions of place field peaks locations (LR and RL combined) were unchanged between pre and post sessions. (F) Mean population vector correlation matrices for the three training conditions. (G) Decoding accuracy index (DAI) at each position on the track for each of the three training conditions; ‘*’ indicates locations where decoding was significantly (p<0.05) less accurate for the drug-free condition than the other two conditions. (H) Analysis of place tuning stability scores (S) along the full short path are shown in the top row; results for L, C, and R track zones are shown in the bottom 3 rows, respectively. Left column: bar graphs show means and standard errors of S; Middle columns: boxplots show median and range of template-selected population vector correlation bins in each rat. Right column: templates used to select peri-diagonal correlation values for analysis from different track zones. †p<0.1; *p<0.05; **p<0.01; ***p<0.001.
Figure 3—figure supplement 1
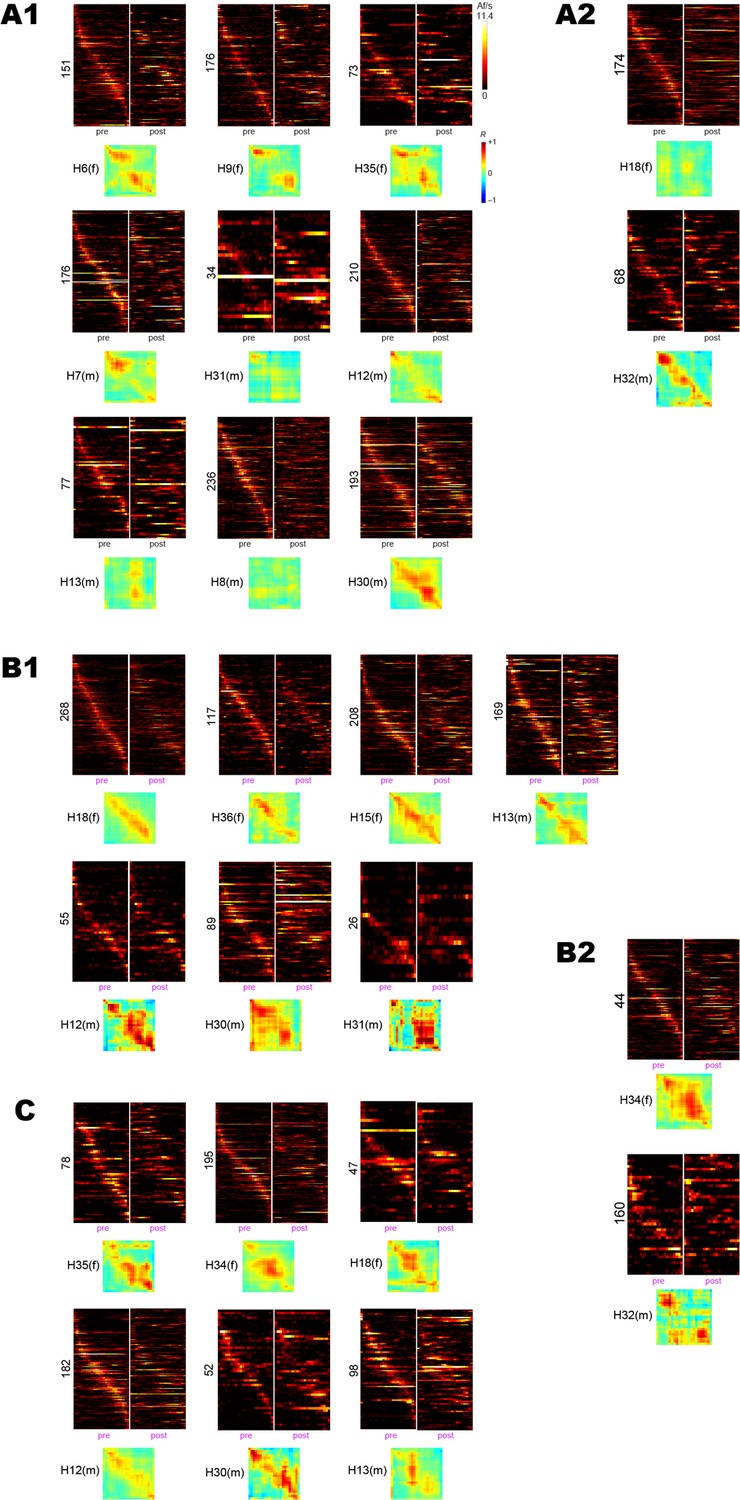
Pre-training and post-extinction session data from individual rats.
As in Figure 3, heatmaps are shown for pre-training and post-extinction sessions, along with pre vs. post population vector correlation matrices. (A1) Rats (n = 9) from the drug-free shock condition that showed 48 hr avoidance retention. (A2) Rats (n = 2) from the drug-free shock condition that failed to show 48 hr avoidance retention. (B1) Rats (n = 7) from the scopolamine condition that failed to show 48 hr avoidance retention. (B2) Rats (n = 2) from the scopolamine shock condition that showed 48 hr avoidance retention. (C) Rats (n = 6) from the barrier training control condition.
Figure 3—figure supplement 2

Remapping in male versus female rats.
Statistical analyses shown in Figure 3 were performed to compare results from male versus female rats. 3 × 2 ANOVAs were performed with sex (M, F) and training condition (DF,SCP,BAR) as independent factors. (A) The change in the number of imaged place cells between pre and post sessions (measured as the number of post session cells over the number of pre session cells) did not differ for males versus females; hence, neither sex showed a tendency to gain or lose more place cells than the other after avoidance acquisition and extinction. (B) Place cell recurrence rates (RR) between the pre and post sessions did not differ for males versus females. (C) Males and females showed similar learning-induced remapping in the center of the short path (black bars) and similar blockade of this remapping by scopolamine (pink bars).
Figure 3—figure supplement 3
Pre-training and post-extinction results from drug-free (DF) rats that failed to retain avoidance and scopolamine (SCP) rats that successfully retained avoidance.
Panels (A–E) are similar to Figure 3B, C, D, F, and G, respectively. Here, results are shown for DF rats that failed to retain avoidance (n = 2) and SCP rats that successfully retained avoidance (n = 2) 48 hr after training. The sample size of rats was not sufficient to perform ANOVAs, so independent t-tests were performed to compare values included in each graph bar against values included in corresponding bars from Figure 3. The number of beeline trials per session was equalized between sessions in each rat, but not between training conditions; beeline trial counts were marginally lower in SCP rats that retained avoidance responses (panel A, left graph) compared to those in Figure 3 that failed to retain avoidance; this was because SCP rats that retained avoidance ran fewer beeline trials in the post-extinction session (probably because they were expressing residual fear despite reaching the avoidance extinction criterion), resulting in a smaller equalized number of trials. Of the two DF rats that failed to retain avoidance, one appeared to show remapping and the other did not (see individual rat heatmaps in Figure 3—figure supplement 1A2). Panel (E) shows that in the male DF rat that failed to retain avoidance or show remapping, place tuning stability (S) was significantly larger in the unsafe C zone and also in the safe R (but not L) zone compared with the mean from Figure 3 for DF rats that retained avoidance (**p<0.01, ***p<0.001). Of the two SCP rats that retained avoidance, one appeared to show remapping of the unsafe center zone and the other did not (see individual rat heatmaps in Figure 3—figure supplement 1B2). Panel (E) shows that in the male SCP rat that retained avoidance and showed remapping, S was significantly lower in the unsafe C zone (**p<0.01 with down arrow), consistent with remapping of the shock zone.
Figure 3—figure supplement 4
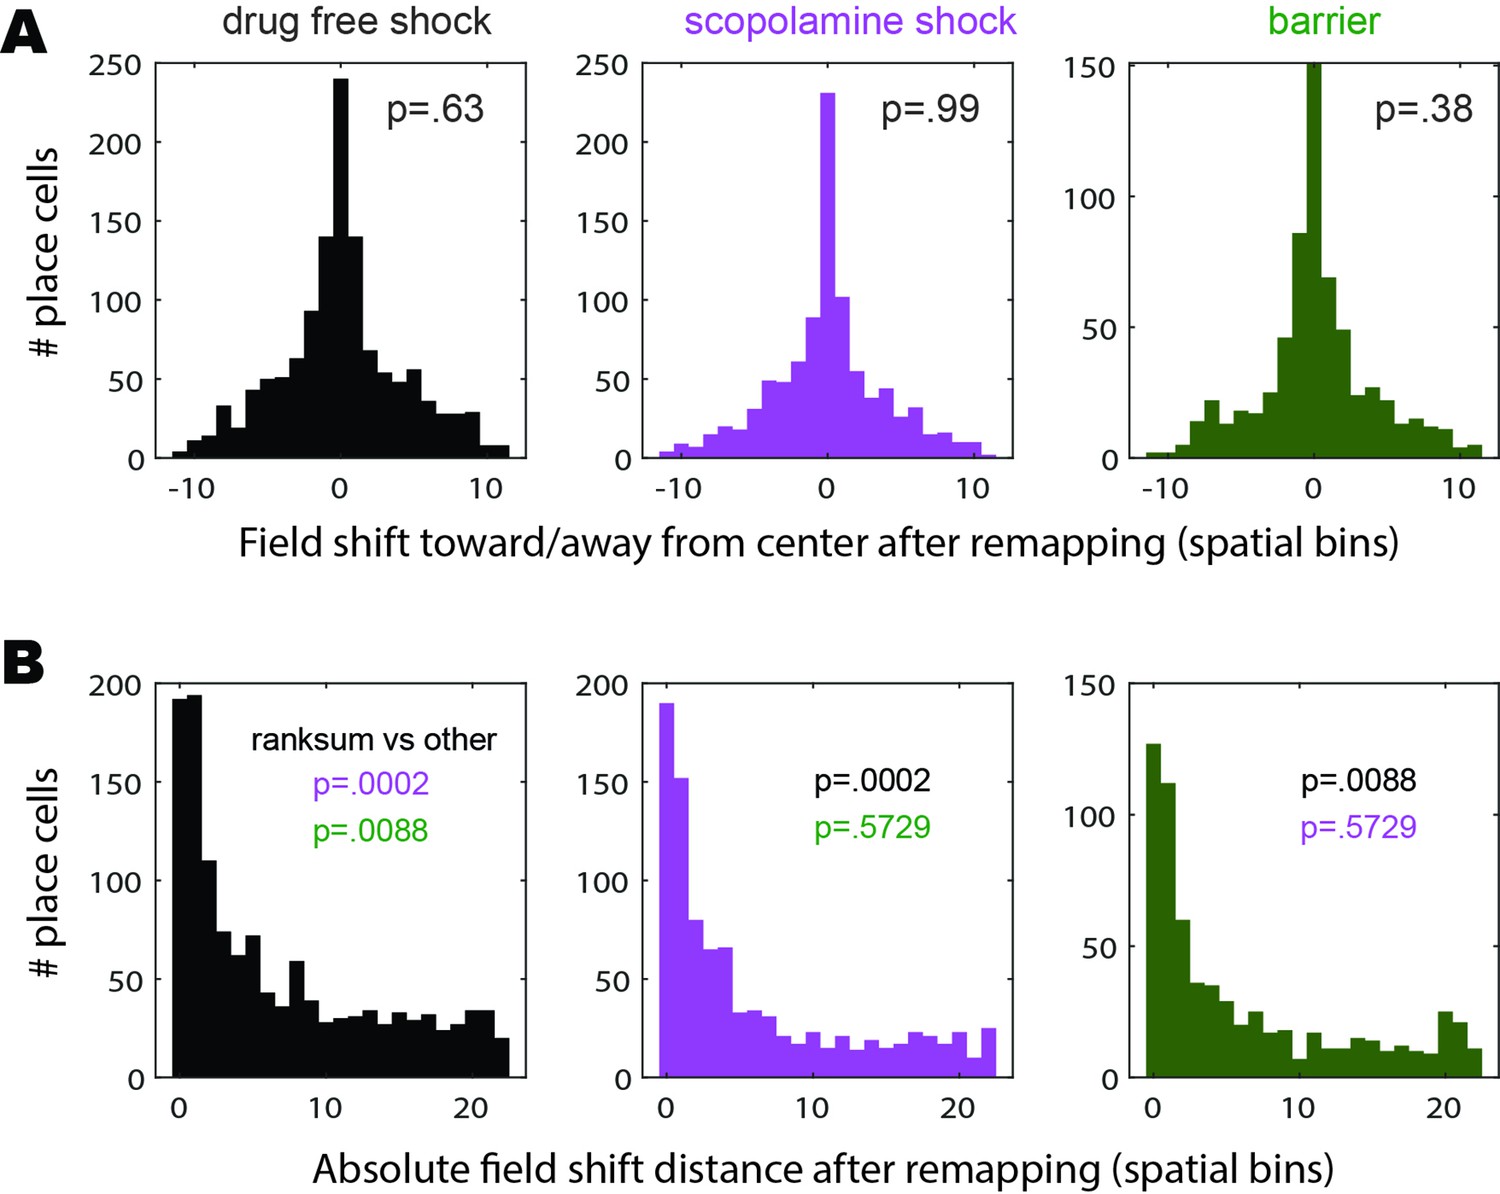
Place field shifts induced by remapping.
(A) Graphs show distributions of the distances (in units of spatial bins) by which remapping caused recurring place cells (from all rats included in the analyses of Figure 3) to shift their place fields toward (negative shift values) versus away from (positive shift values) the center of the short path where shock was delivered. In each graph, inset p-value shows the significance for a z-test comparison between zero and the mean of the distribution. The distributions did not differ significantly from zero in the drug-free, scopolamine, or barrier training conditions, indicating that place cells showed no bias for shifting toward or away from the shock or barrier location in any condition. (B) Graphs show distributions of the absolute distance (in units of spatial bins) by which remapping caused recurring place cells to shift their place fields before versus after avoidance learning. Inset p-values show results of a ranksum comparison between each distribution’s median shift value versus the medians of the distributions for the other two conditions. The median shift distance was significantly larger in the drug-free condition than in the scopolamine or barrier conditions, consistent with findings reported in the main text showing that remapping occurred preferentially in the drug-free condition (since larger shifts of place field centers are consistent with more place cell remapping). Median shift distances did not differ significantly between the scopolamine and barrier conditions, confirming that remapping was less prevalent in these two conditions than in the drug-free condition.
Figure 3—figure supplement 5
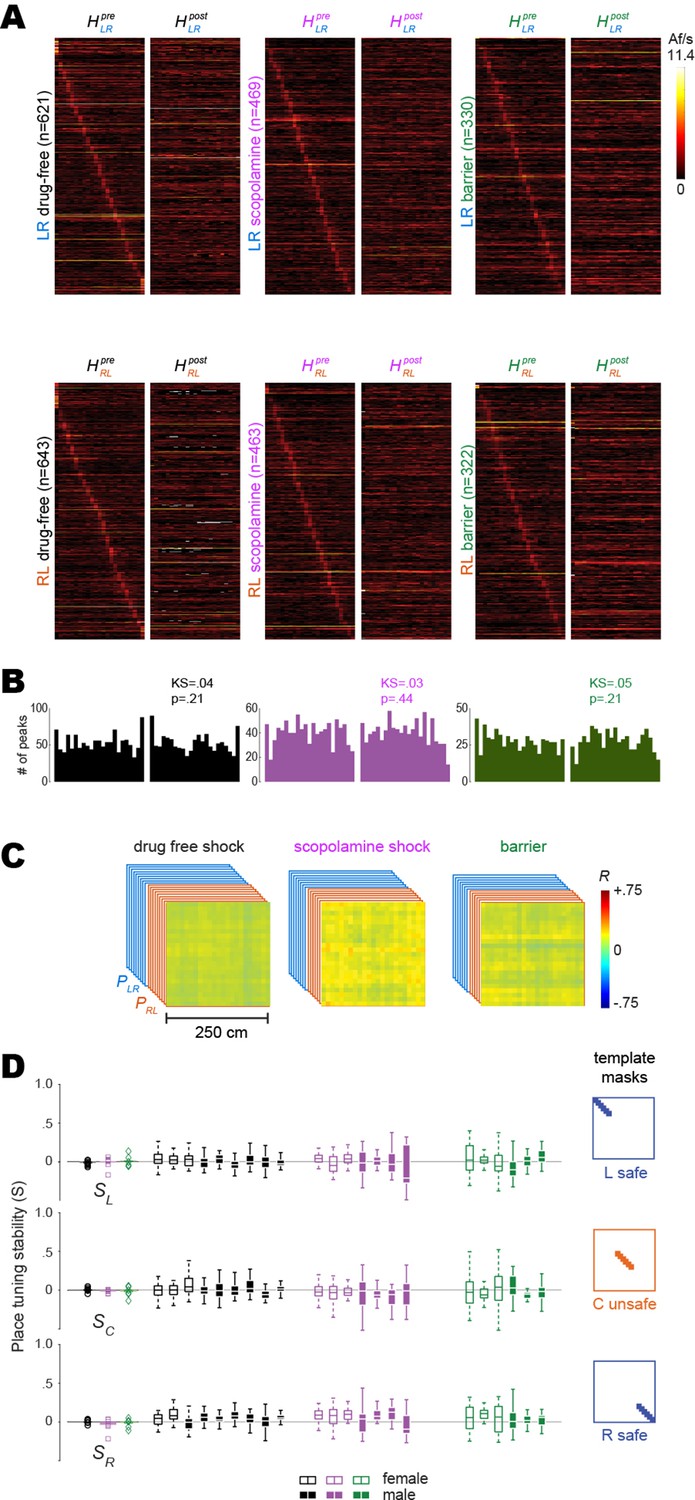
Shuffled analysis of remapping.
Results plotted in panels (A–D) were performed as described for corresponding results in Figure 3, except that prior to analysis, the deconvolved spike train from every beeline trial was circularly shifted by a random amount against position tracking data from the trial. (A) Heatmap pairs show pre and post tuning curves for recurring place cells (same population of cells as in Figure 3 which were classified as place cell based on their unshuffled trains) that were spatially tuned in the LR (top row) and RL (bottom row) running direction; both heatmaps in each pair are co-sorted by peak locations of the shuffled tuning curve from the pre session. (B) Distributions of shuffled tuning curve peak locations (LR and RL combined) are no longer concentrated preferentially at the ends of the track. (C) Mean population vector correlation matrices calculated from shuffled tuning curves for the three training conditions; uniformly distributed positive values (greater than zero) reflect a tendency for cells to have similar baseline firing rates across sessions. (D) Left column: graphs show scatter plots of each rat’s place tuning stability scores (S); means did not differ significantly from zero. Results for L, C, and R track zones are shown top, middle, and bottom rows, respectively. Middle columns: boxplots show median and range of template-selected population vector correlation bins in each rat. Right column: templates used to select peri-diagonal correlation values from the L, C, and R track zones.
Figure 4
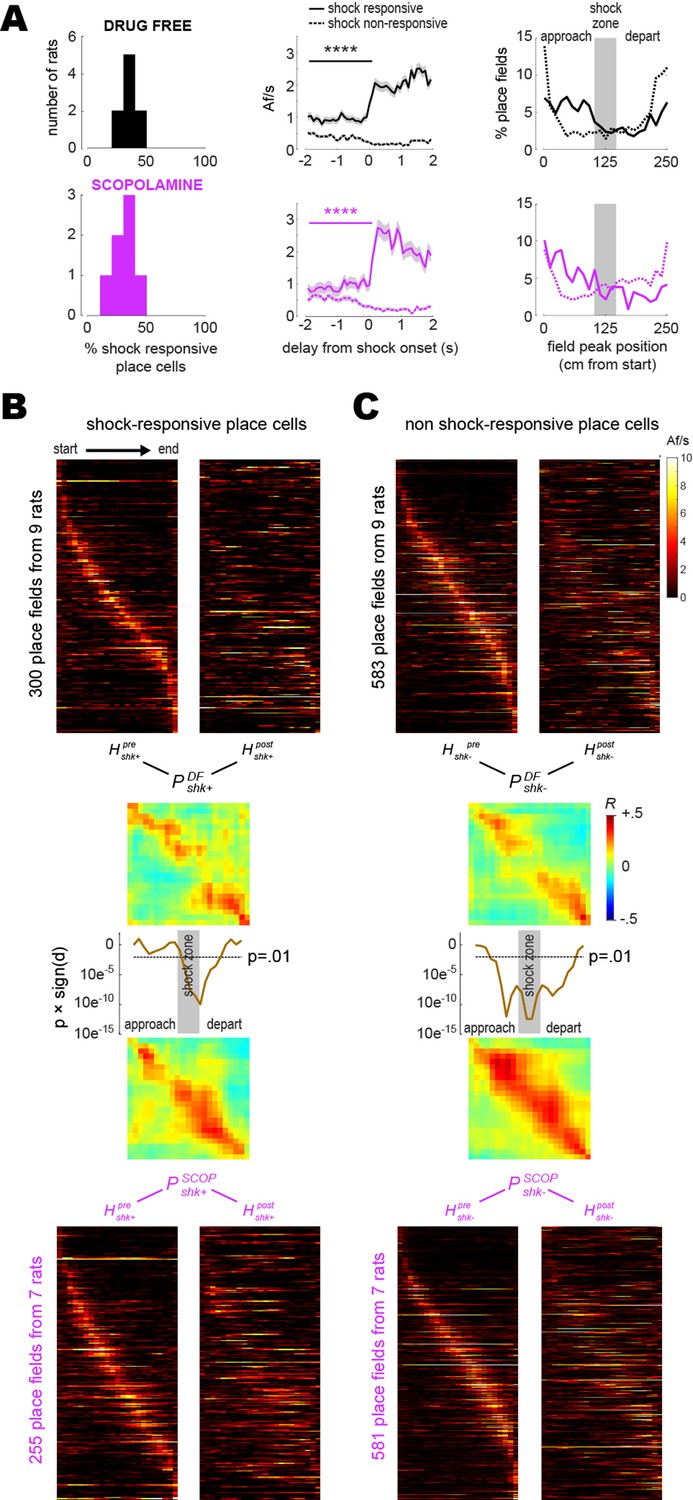
Shock-evoked responses of place cells.
(A) Left column: frequency distribution of shock-responsive place cell percentages in each rat. Middle column: population-averaged Af/s rates (from all rats combined) for shock-responsive versus non shock-responsive place cells. Right column: spatial distribution of place field peak locations during the training session, prior to grid electrification; x-axis shows distance traveled between the start (left) and end (right) of the short path in the current running direction (LR or RL). (B) Heatmaps (LR and RL tuning curves combined) are plotted for shock-responsive place cells in the drug-free (top) versus scopolamine (bottom) conditions during pre- (left) and post- (right) training sessions (rows are co-sorted on peaks from the pre-training session, columns are sorted so that the rat’s running direction goes from left to right for both LR and RL tuning curves); P matrices show pre- vs. post-extinction population vector correlations for shocks given drug-free (top) or on scopolamine (bottom); line graphs show that signed p-values (y-axis, log scale) fall below .01 at center track positions where drug-free shocks induced more remapping than shocks on scopolamine. (C) Same as (B) but for shock non-responsive place cells. ****p<0.0001.
Videos
Video 1
Video demonstrating behavior and calcium imaging recorded from one rat performing linear alternation along the short path of the maze.
(A) Position of the rat (red dot). (B) Motion-corrected video of calcium fluorescence. (C) Processed demixed/denoised CaImAn output (spatial contours modulated by denoised calcium trace). (D) Right half shows calcium activity of 290 identified neurons in the video, sorted by their preferred firing direction (teal/pink) and location along the track. Current time highlighted in the center gray region.
Additional files
Download links
A two-part list of links to download the article, or parts of the article, in various formats.
Downloads (link to download the article as PDF)
Open citations (links to open the citations from this article in various online reference manager services)
Cite this article (links to download the citations from this article in formats compatible with various reference manager tools)
Hippocampal place cell remapping occurs with memory storage of aversive experiences
eLife 12:e80661.
https://doi.org/10.7554/eLife.80661


