A unified neural account of contextual and individual differences in altruism
- Zurich Center for Neuroeconomics, Department of Economics, University of Zurich, Switzerland
- Centre for Human Brain Health, School of Psychology, University of Birmingham, United Kingdom
- University Research Priority Program 'Adaptive Brain Circuits in Development and Learning' (URPP AdaBD), University of Zurich, Switzerland
Figures
Figure 1 with 2 supplements
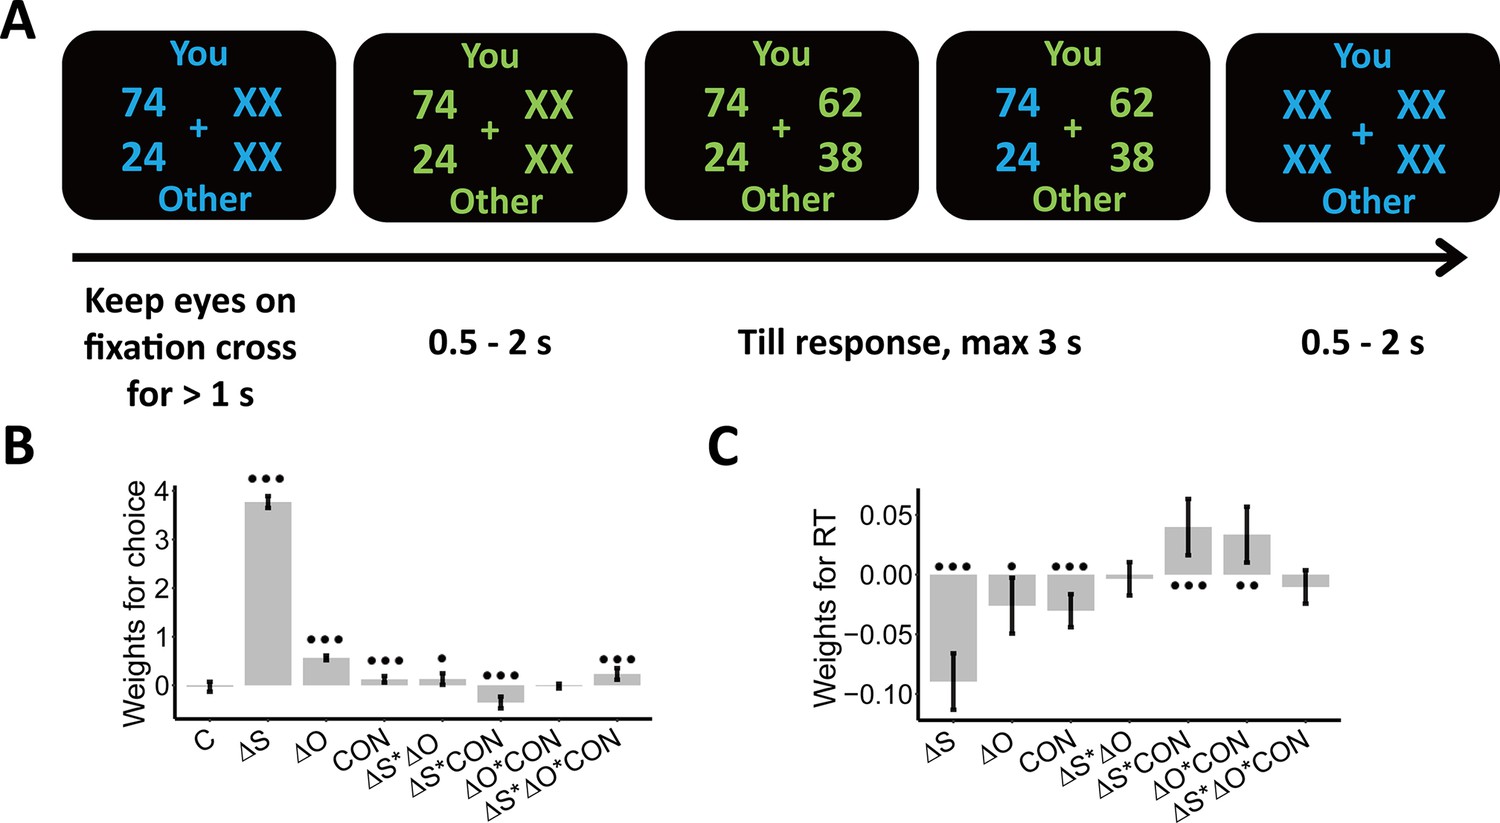
Experimental design and behavioral results.
We employed a modified dictator game to measure individuals’ wealth distribution behaviors. (A) Example of display in a single trial. In the task, participants played as proposers to allocate a certain amount of monetary tokens between themselves and anonymous partners. At the beginning of each trial, participants were presented with one reference option in blue and were asked to keep their eyes on the central cross for at least 1 s to start the trial, as indicated by the change in font color from blue to green. When the second option was presented, participants had to choose between the two options within 3 s. The selected option was highlighted in blue before the inter-trial interval. Font color assignment to phases (i.e. blue and green to response) was counterbalanced across participants. (B) Payoff information and context affect choice systematically. The generalized linear mixed-effects model shows the effects of multiple predictors on the probability to choose the second option; (C) Payoff information and context affect response times systematically. The linear mixed-effects model shows the effects of multiple predictors on response times (RTs). , Self-payoff Change; , Other-payoff Change; CON, Context; C, Constant; •••, p < 0.001; ••, p < 0.01; •, p < 0.05. Error bars indicate 95% confidence interval (CI) of the estimates, N=38.
Figure 1—figure supplement 1

Payoff schedule.
There were two inequality contexts in the task: disadvantageous inequality (DIS) and advantageous inequality (ADV). In the left panel, each dot represents one allocation option and each gray line represents one pair of options that was presented to participants. Blue dots are options in DIS and pink dots are options in ADV. Dots in the center of the circle are the first options, and diamond dots are the second options. Middle and right panels show the distributions of the self-/other-payoff changes between the second and the first option ( and ) in DIS and ADV, respectively. These two sets of payoff matrix (top panel and bottom panel) have the same reference options and similar distributions of alternative options. By having such payoff matrices of all trials, we matched self-/other-payoff differences and the resulting absolute levels of inequality across both contexts and also across the second and the first options. This allowed us to compare choices and response times, as well as neural processing of different choice features (self- and other-payoff, inequality) between the two contexts.
Figure 1—figure supplement 2
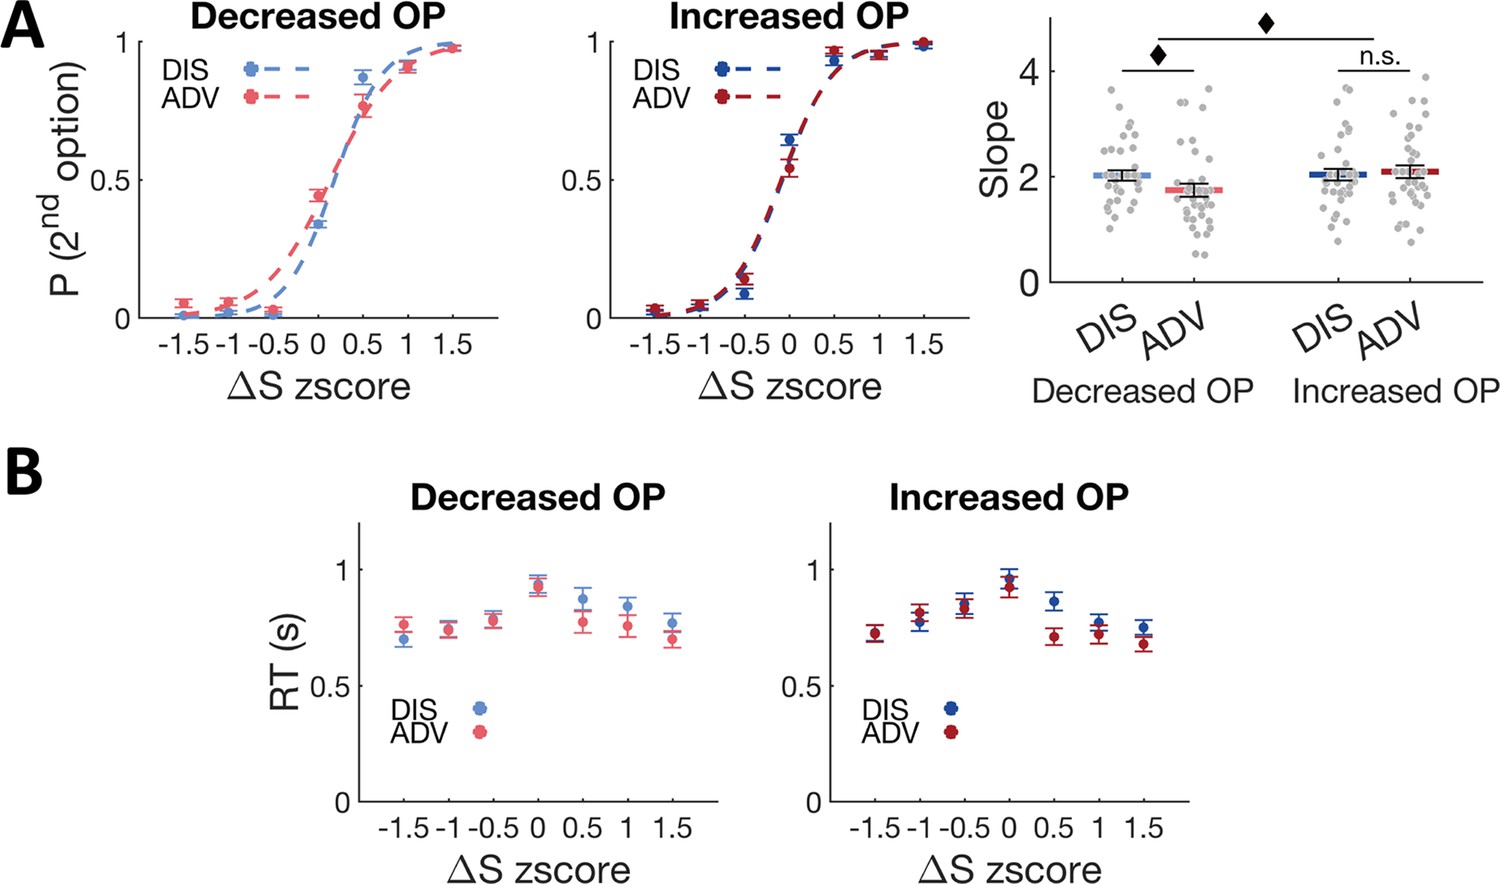
Model-free behavioral results.
(A) Psychometric functions show the effects of (self-payoff change between the second option and the first option) on the probability to choose the second option across contexts (CON) and other-payoff change levels (left and middle panels); right panel shows the interactive effect between context and other-payoff change over the slope of the psychometric functions in the left and middle panels. Decreased OP, trials in which the second option decreases other-payoff; Increased OP, trials in which the second option increases other-payoff. (B) Plots show the effects of on RTs across Decreased (Left panel) and Increased OP trials (right panel). OP, other-payoff. ♦, p < 0.1; n.s, not significant. Error bars indicate standard errors of the mean (SEMs), N = 38.
Figure 2 with 1 supplement
Model fits and the relationship between the ERP signal and model predictions.
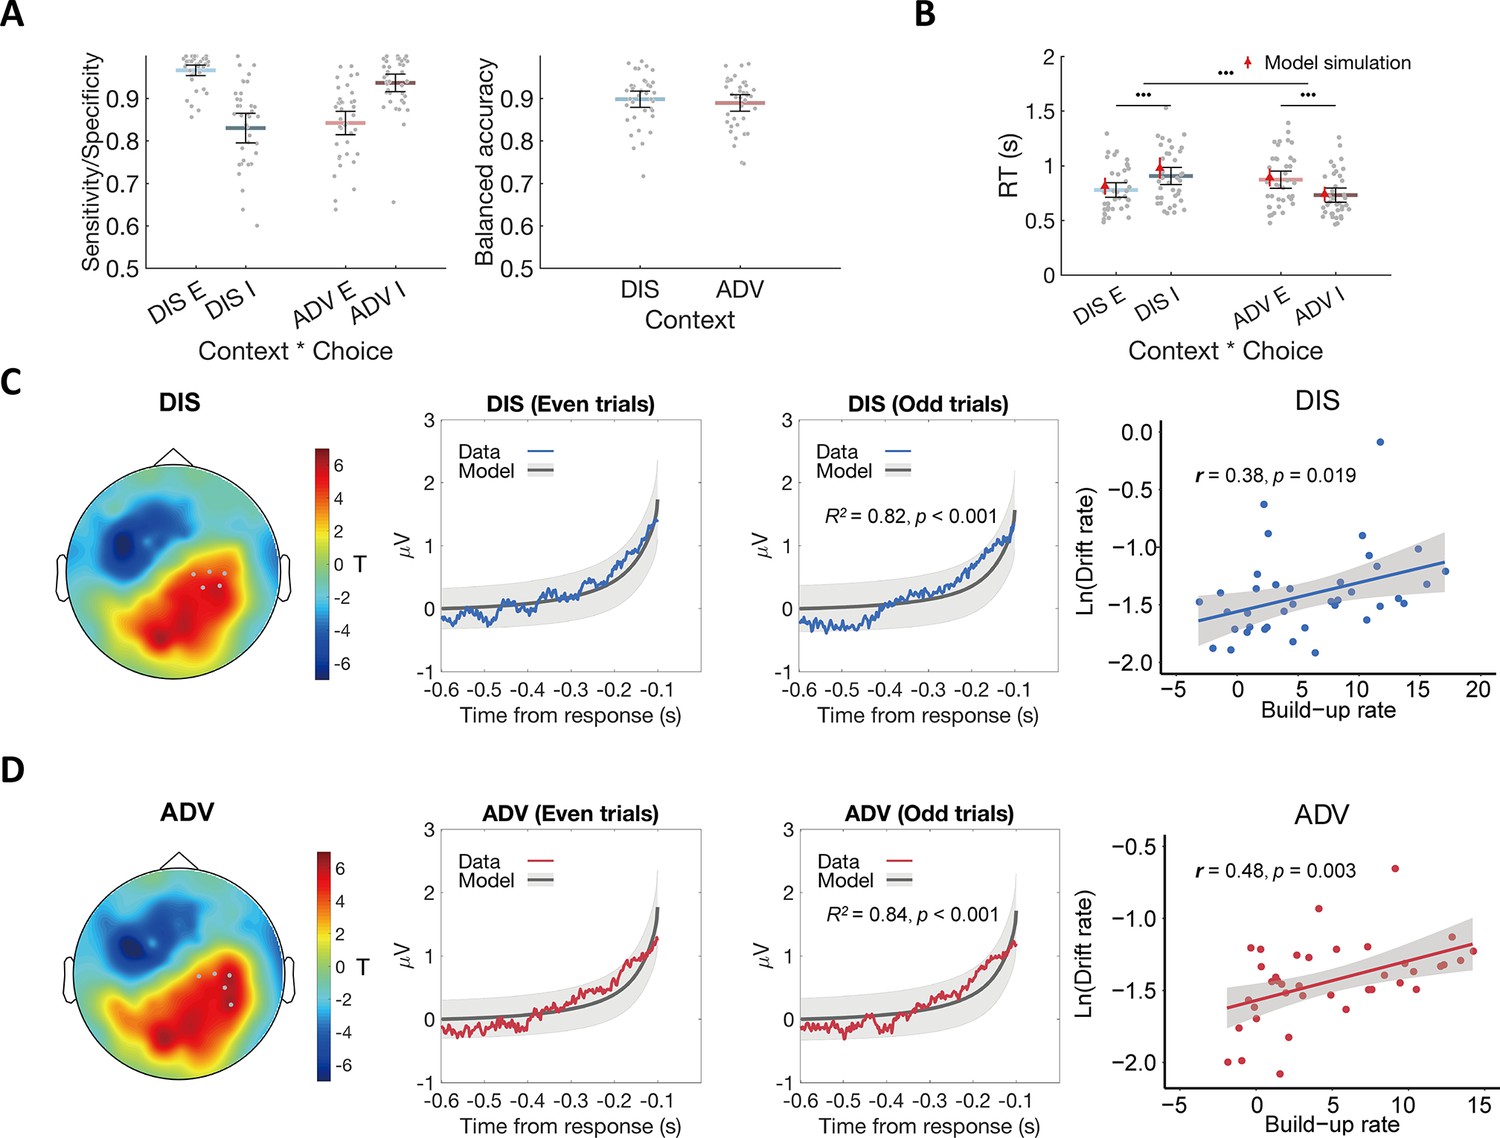
(A) The OU model predicts choices across contexts. Left panel: Model performance on sensitivity of equal choice (E) and specificity of unequal choice (I) in each context. Right panel: Model performance on balanced accuracy in each context. DIS, disadvantageous context; ADV, advantageous context; E, equal choice; I, unequal choice. (B) The OU model recovers RT effects over context and choice in participants’ behavioral data. Black error bars display means ± 95% confidence intervals (CIs), N = 38. Each grey dot indicates one participant. The red triangle dots and error bars represent the model simulation mean and 95% CIs. •••, p < 0.001. (C) & (D) Comparable neural evidence accumulation signals in both contexts. For each context (C for DIS, D for ADV), response-locked epochs were divided into even and odd trials to perform cross-validation analyses. Leftmost panels show the topographic scalp distributions of associations between ERP amplitude and OU model predictions in even trials. Grey dots highlight channels that survived the threshold. Middle-left panels show the observed averaged ERP data in the identified clusters shown in leftmost panels (colored lines) and normalized OU model predictions for even-numbered trials. Middle-right panels show the relationships between the model predictions and ERP signals of the independent half of data (odd-numbered trials) in the identified clusters shown in the leftmost panels. Colored lines represent average ERP data extracted from the identified clusters. Grey lines represent the means of model-predicted EA traces, and grey shaded areas represent ± 1 standard error of the mean (SEM) of the model-predicted EA traces, N = 38. Rightmost panels show the correlations between the built-up rates of the identified clusters and the OU model parameter of drift rates across participants.
Figure 2—figure supplement 1
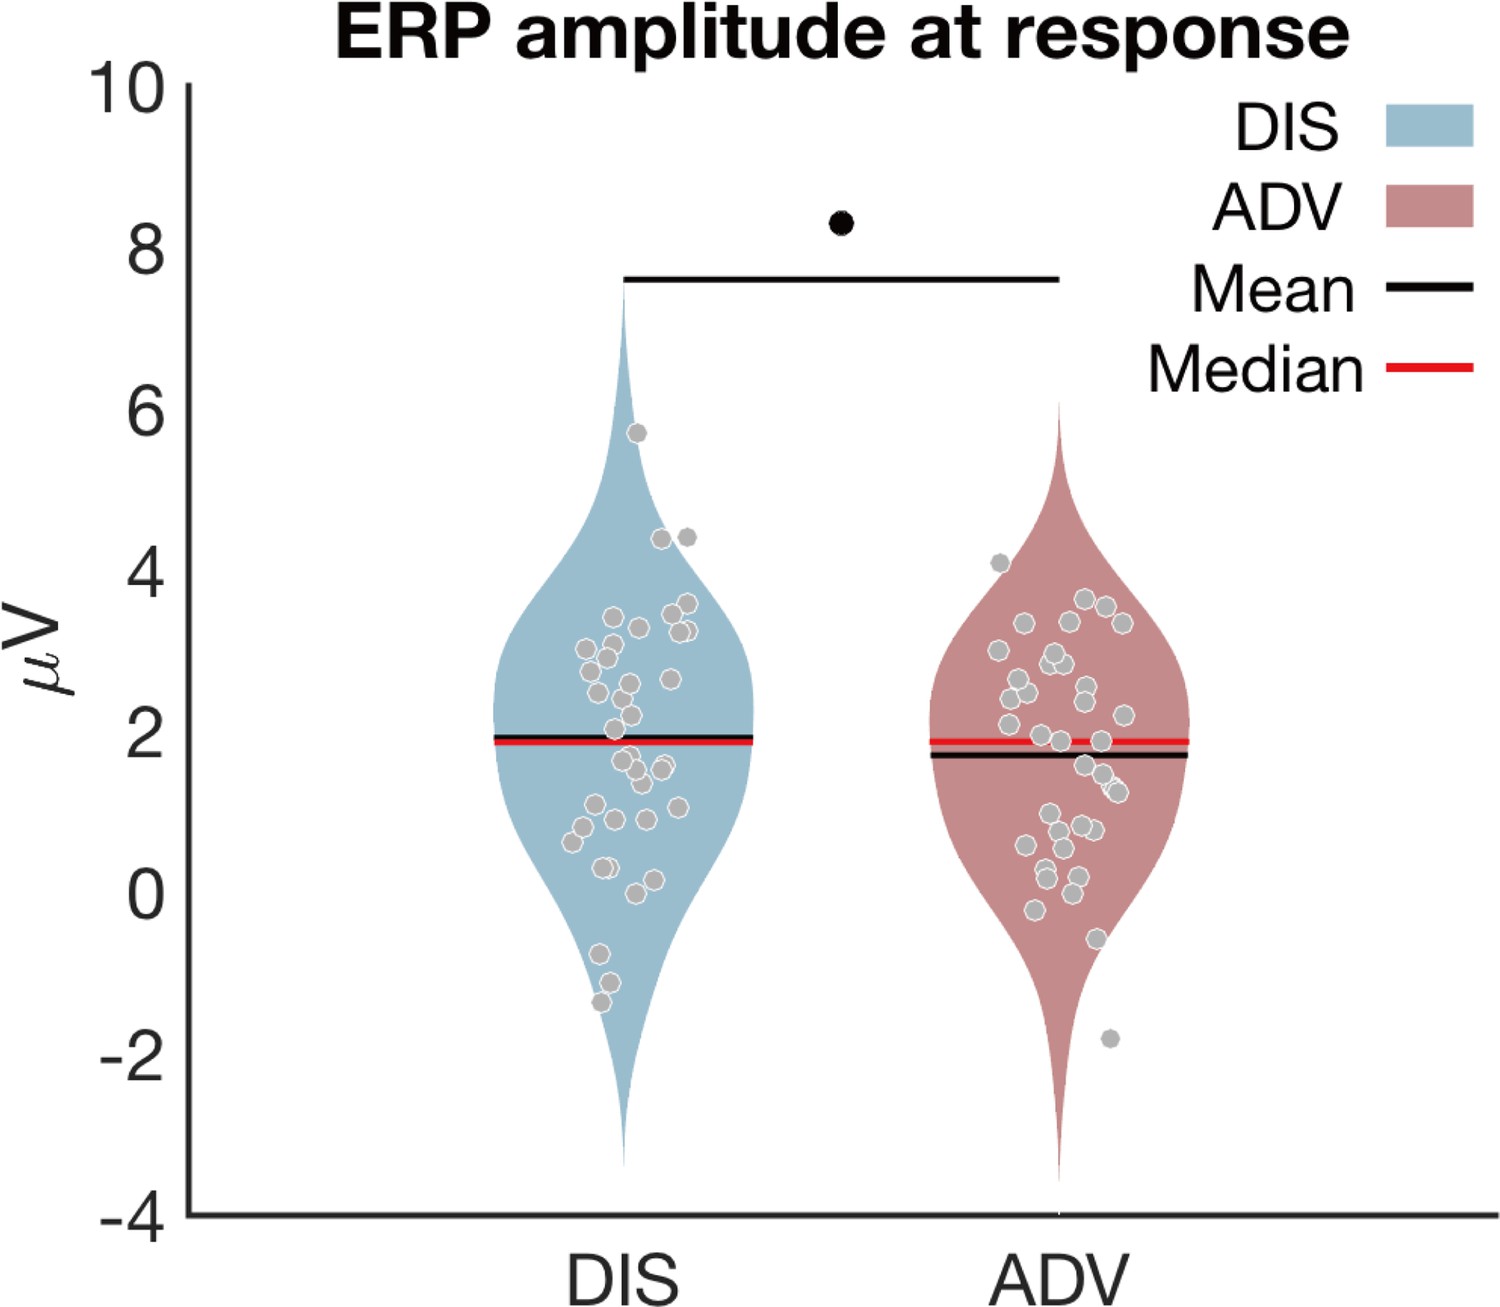
ERP amplitude at response across inequality contexts.
The averaged ERP amplitudes in the channels shown in Figure 2C and D at response (i.e. in the time window of 100–0ms before response) were greater in DIS (1.91±0.25) compared to the ADV context (1.70±0.22; DIS vs ADV: 95% CI [0.01, 0.42], Cohen’s d = 0.33, t(37) = 2.12, p = 0.04), echoing the observation that decision threshold was higher in DIS than ADV context.
Figure 3 with 5 supplements
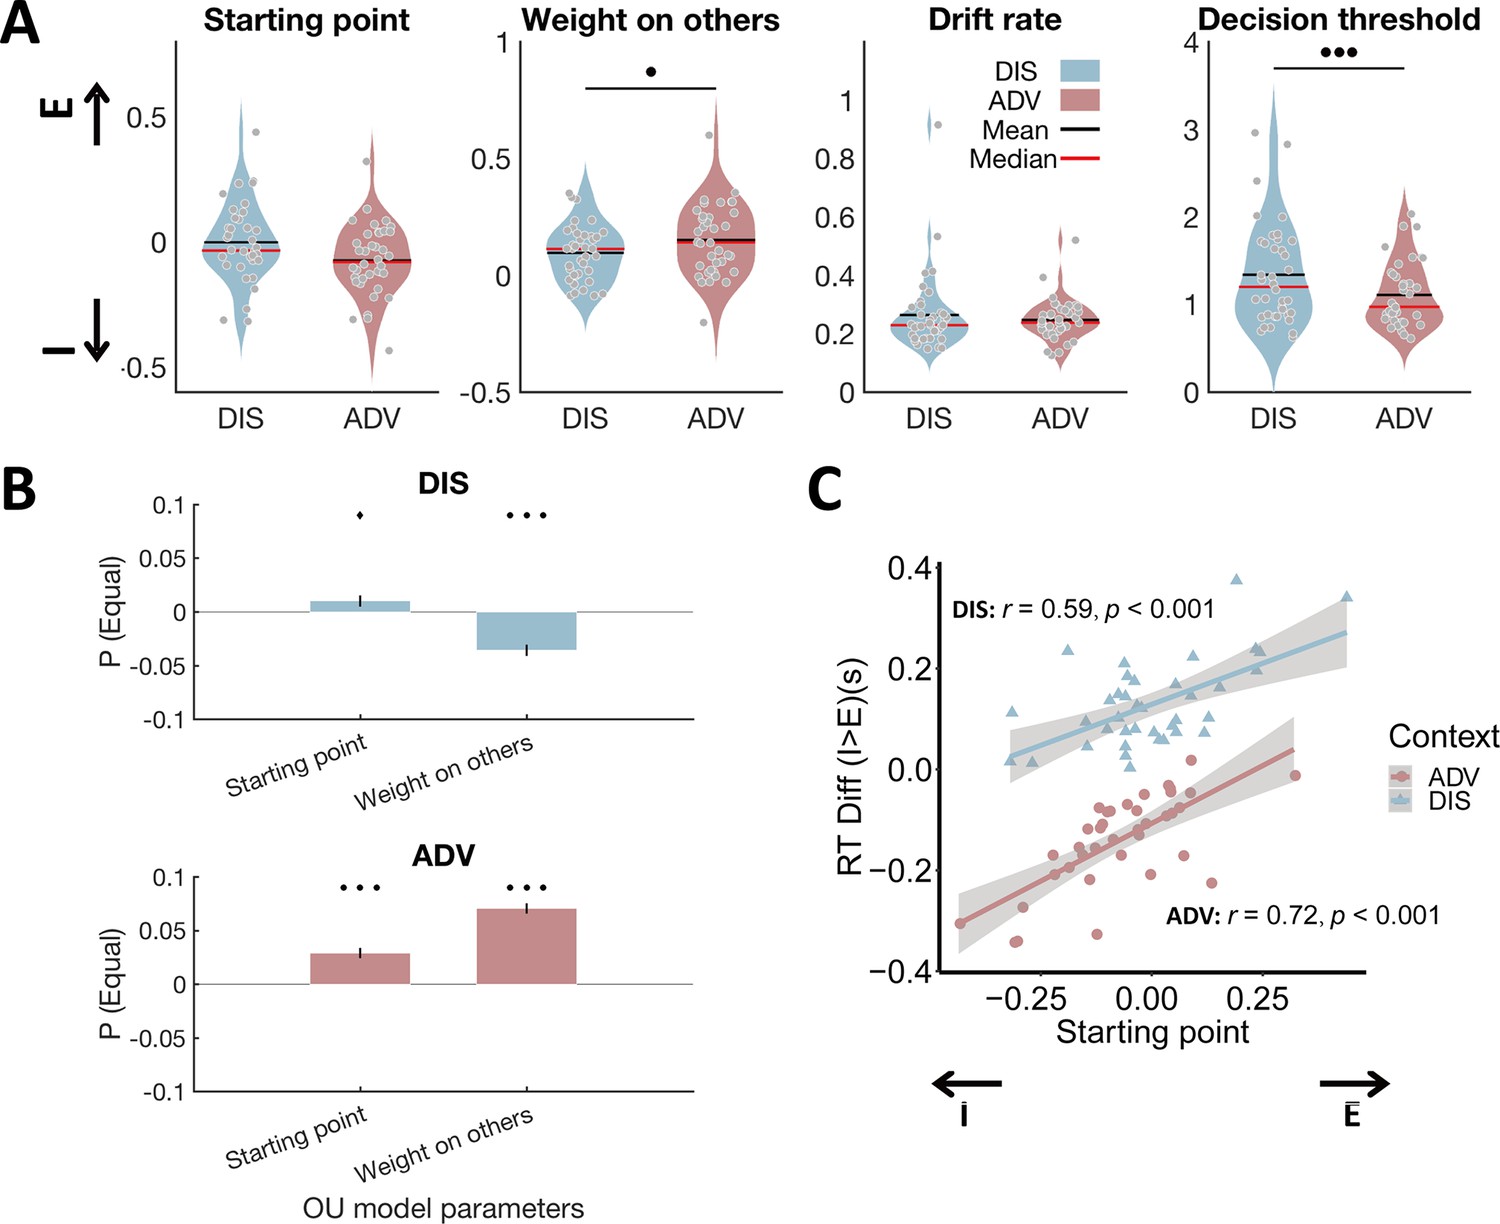
Model parameters differ between inequality contexts and show the expected relations to model-free behavioral data.
(A) Relative to DIS, ADV increased weight on others and reduced decision threshold. Each grey dot represents one participant. E, starting point closer to equal option; I, starting point closer to unequal option. (B) Multiple regressions show that the probability to choose the equal option is related to a starting point closer to the equal option in both contexts, and a higher weight on others in ADV and a lower weight on others in the DIS context. Error bars indicate standard errors of the estimates, N = 38. (C) Individuals with starting points closer to the equal option responded more slowly to unequal relative to equal choices in both contexts. E, starting point closer to equal option; I, starting point closer to unequal option. •••, p < 0.001; ••, p < 0.01; ♦, p < 0.1.
Figure 3—figure supplement 1

OU model parameters in the two inequality contexts.
Nondecision time and leak strength did not differ between the DIS and ADV contexts. Each grey dot represents one participant, and the violin plots represent the distributions, N = 38. In line with our expectations, nondecision time and leak strength, as two parameters of no-interest, do not contribute to the difference in decision processes of altruism between different inequality contexts.
Figure 3—figure supplement 2

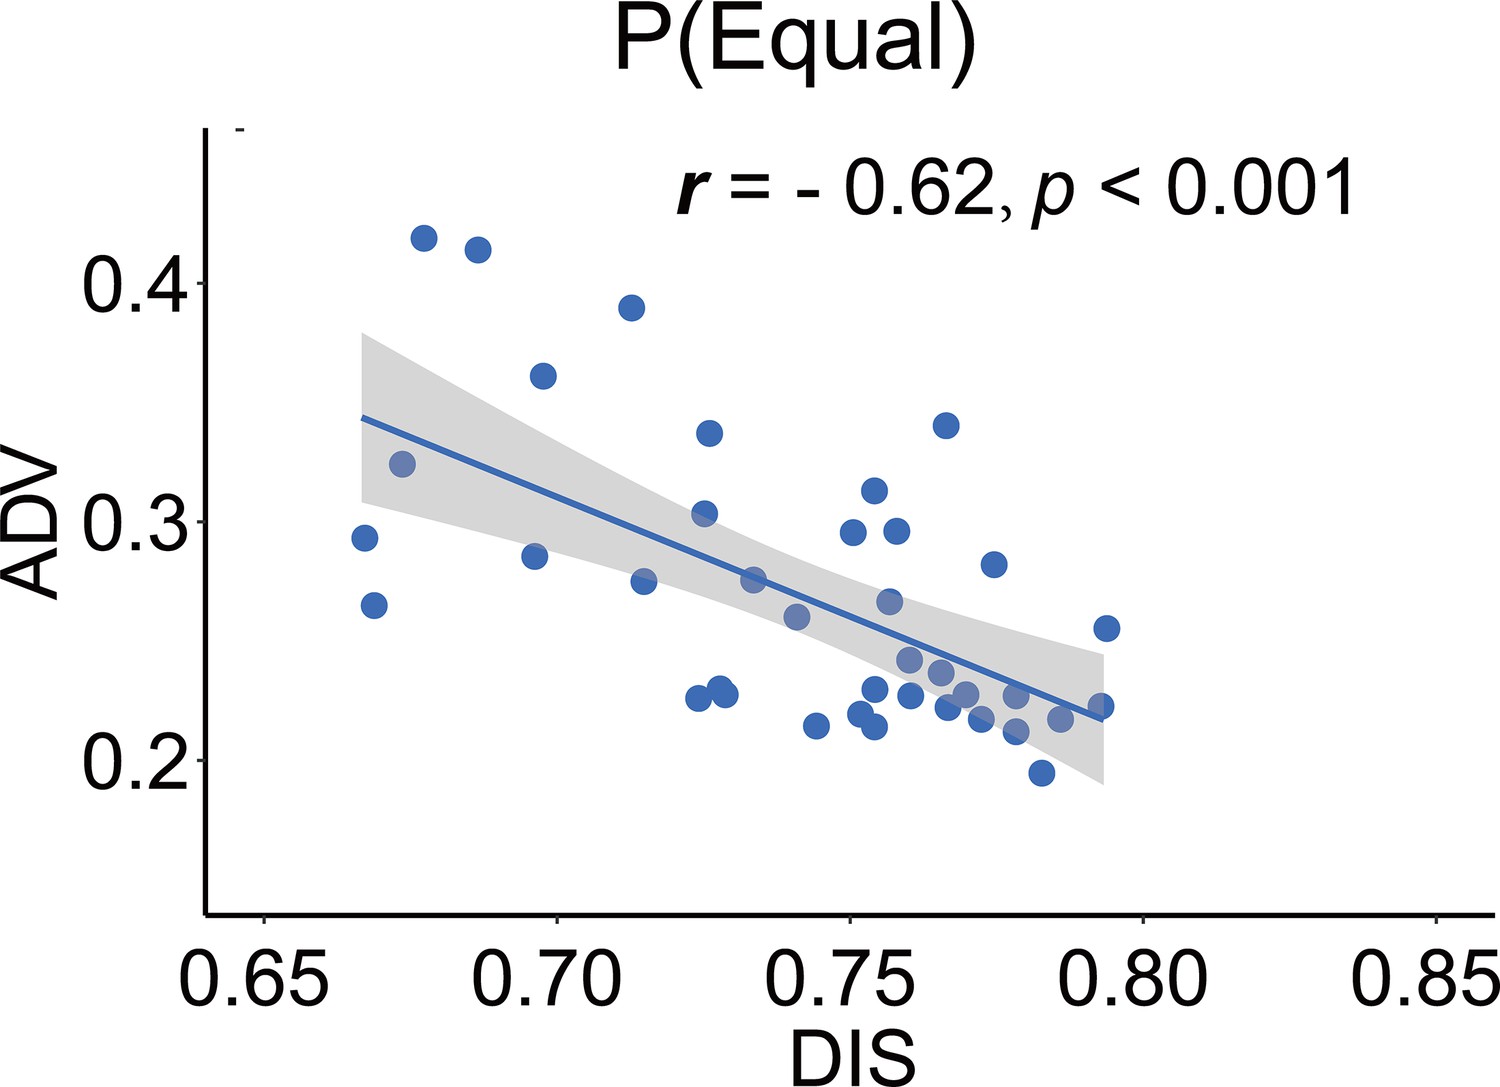
Correlations of OU parameters between ADV and DIS contexts.
All fitted parameters are correlated across the two equality contexts, suggesting use of a comparable decision mechanism.
Figure 3—figure supplement 3
Correlation of the probabilities to choose the more equal option in the ADV and DIS contexts.
Significant correlation of the probability to choose the more equal option between ADV and DIS also implied employment of a similar choice mechanism across contexts.
Figure 3—figure supplement 4
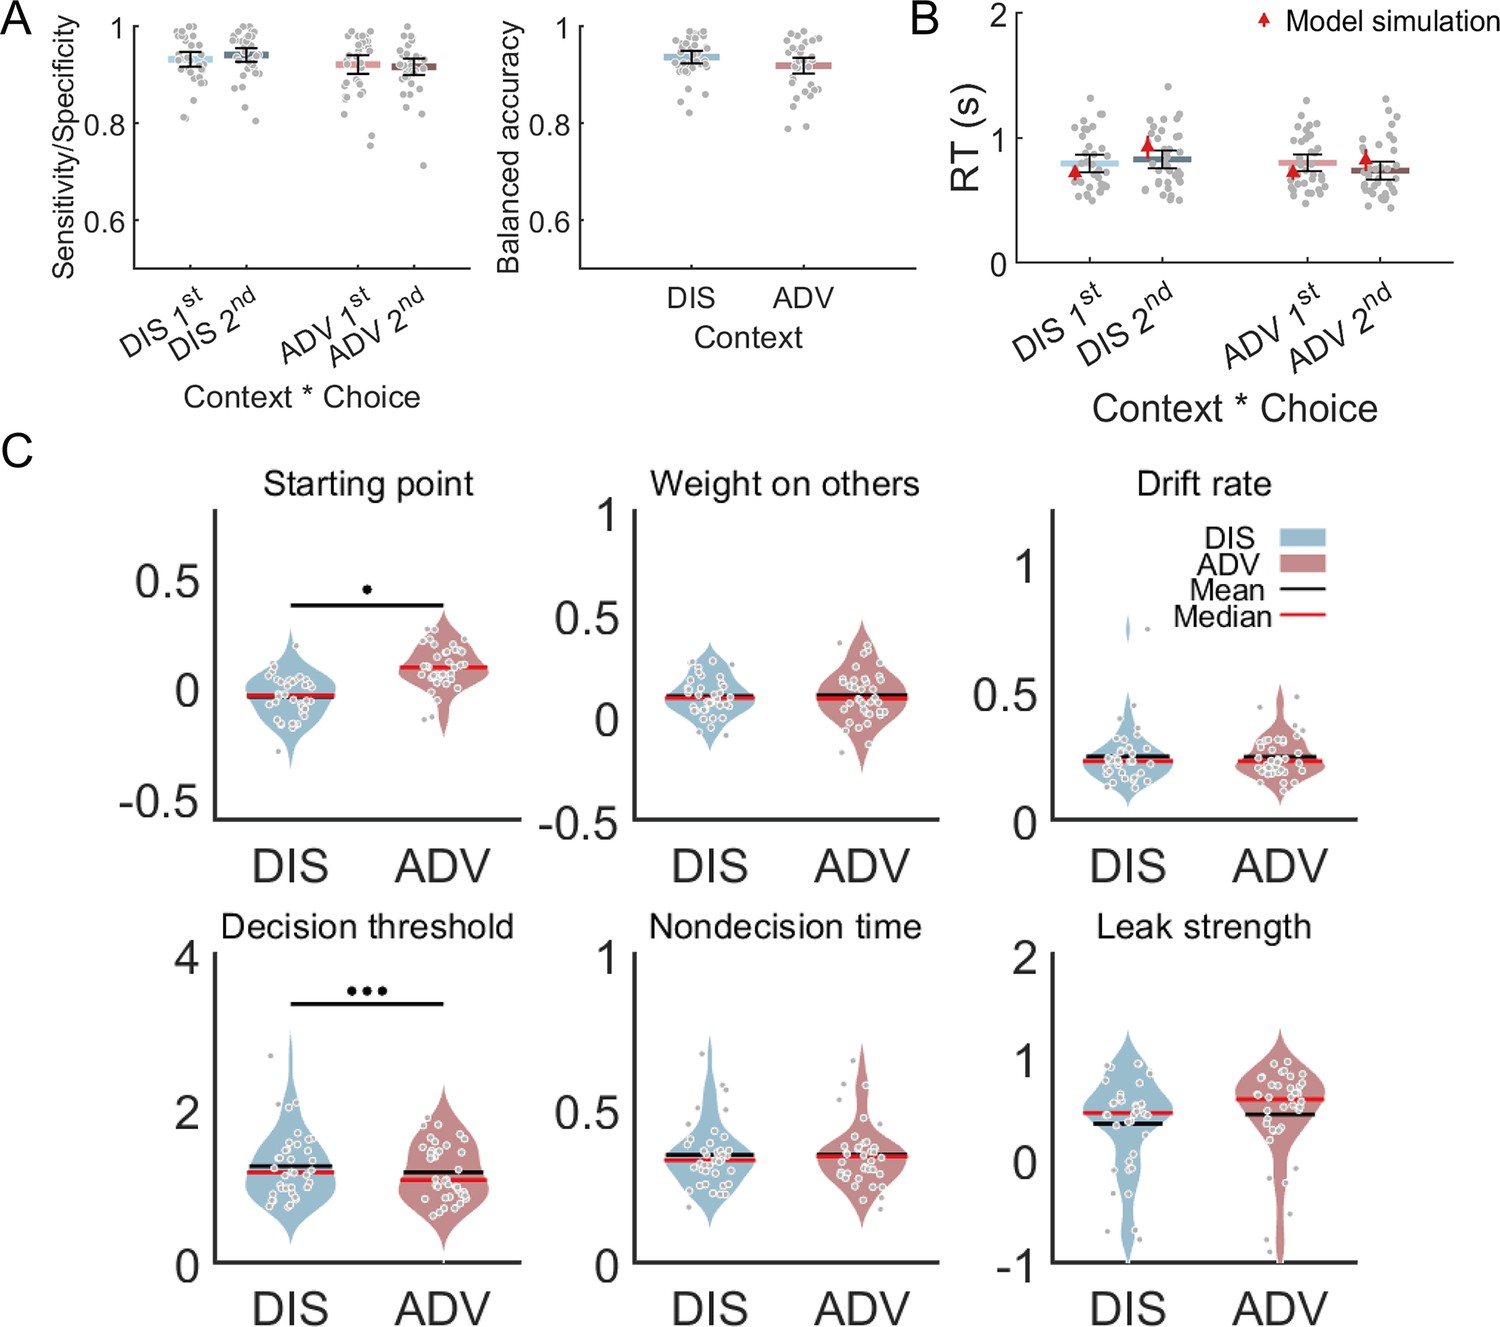
Model fits and parameters across inequality contexts.
(A) The OU order model predicts choices across contexts. Left panel: Model performance on sensitivity of the first choice and specificity of the second choice in each context. Right panel: Model performance on balanced accuracy in each context. DIS, disadvantageous context; ADV, advantageous context. (B) The OU order model recovers RT effects over context and choice in participants’ behavioral data. Black error bars display means ± 95% confidence intervals (CIs). Each grey dot indicates one participant, N = 38. The red triangle dots and error bars represent model simulation mean and 95% CIs. •••, p < 0.001. (C) Relative to DIS, ADV drove the starting point towards the second offer and reduced decision threshold. Each grey dot represents one participant. More positive starting point is closer to the second option, N = 38.
Figure 3—figure supplement 5
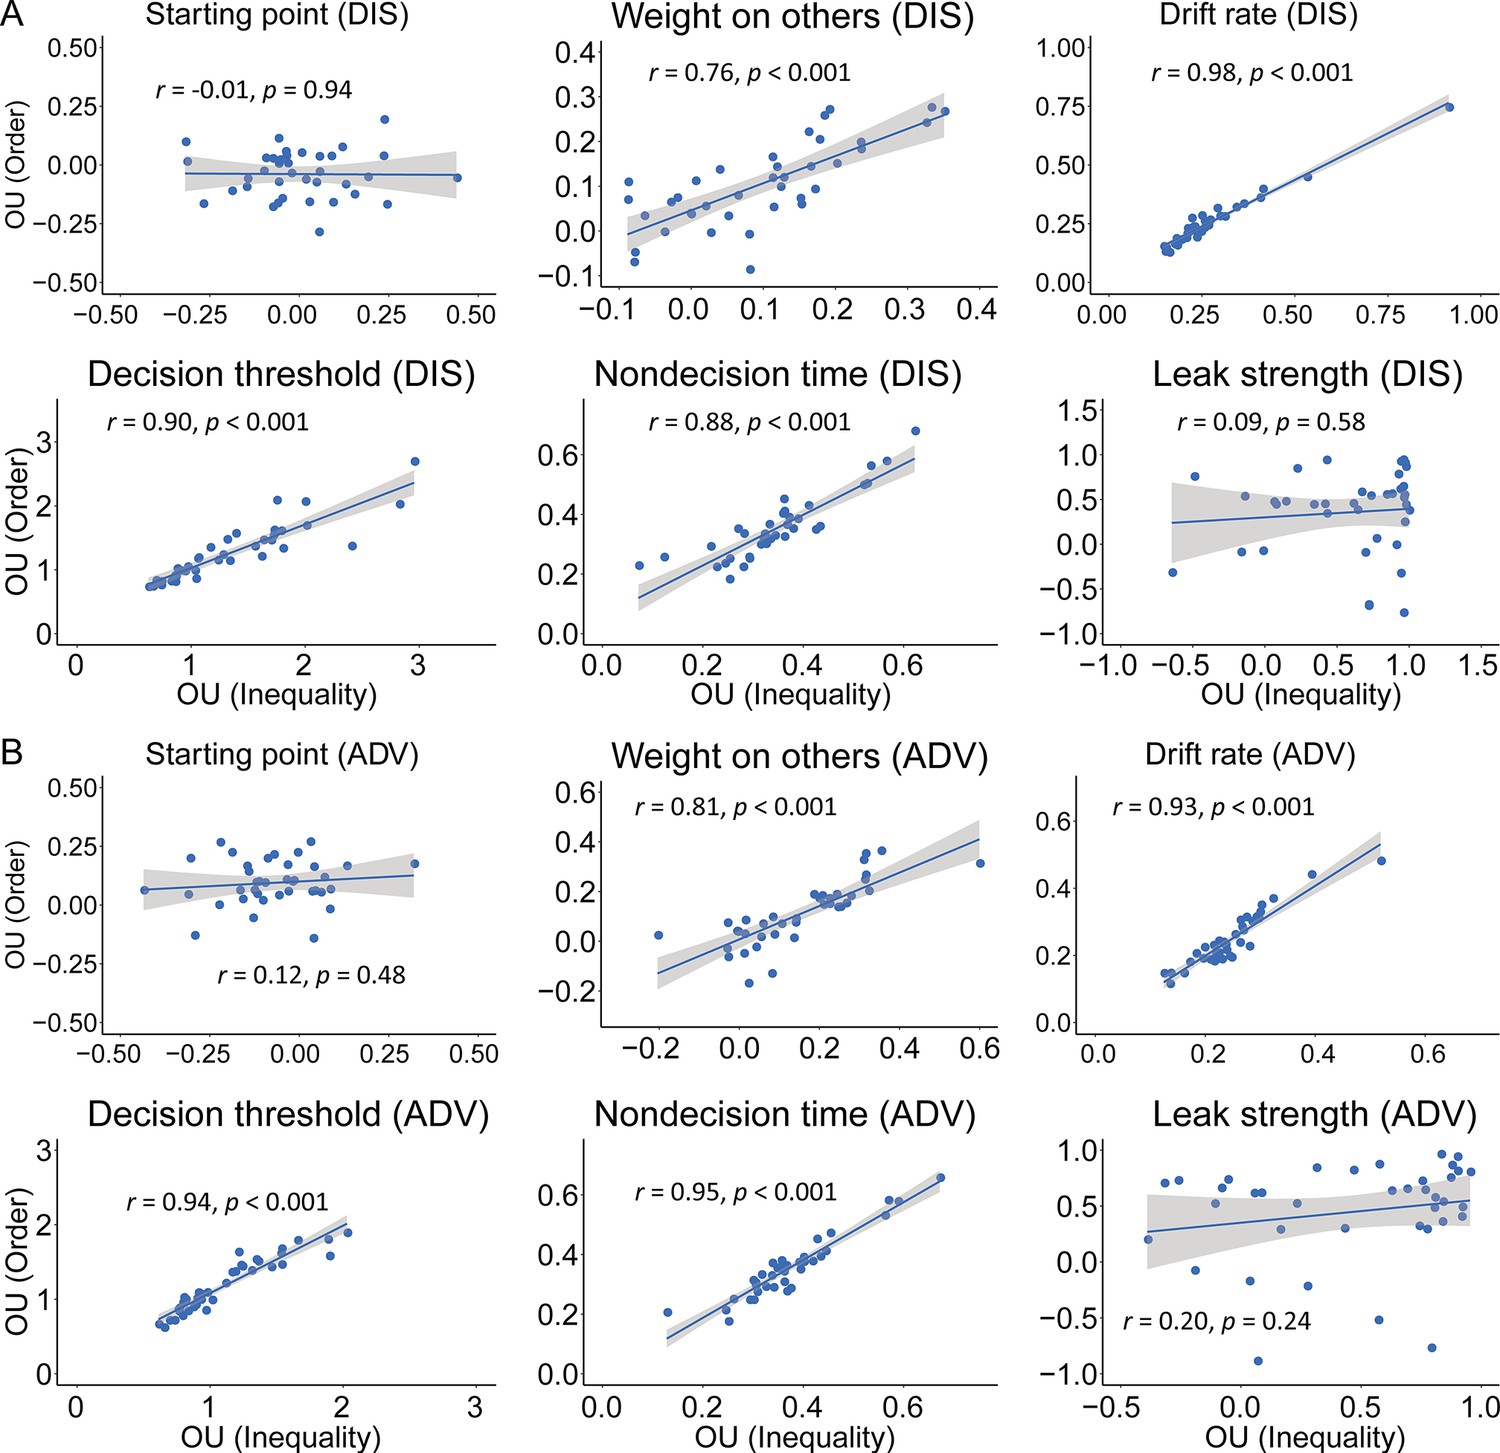
Correlations of parameters between the OU order model and the winning OU model (Inequality) in the DIS (A) and ADV (B) contexts.
Weight on others, drift rate, decision threshold, and non-decision time are highly correlated between the two models in both contexts.
Figure 4 with 2 supplements
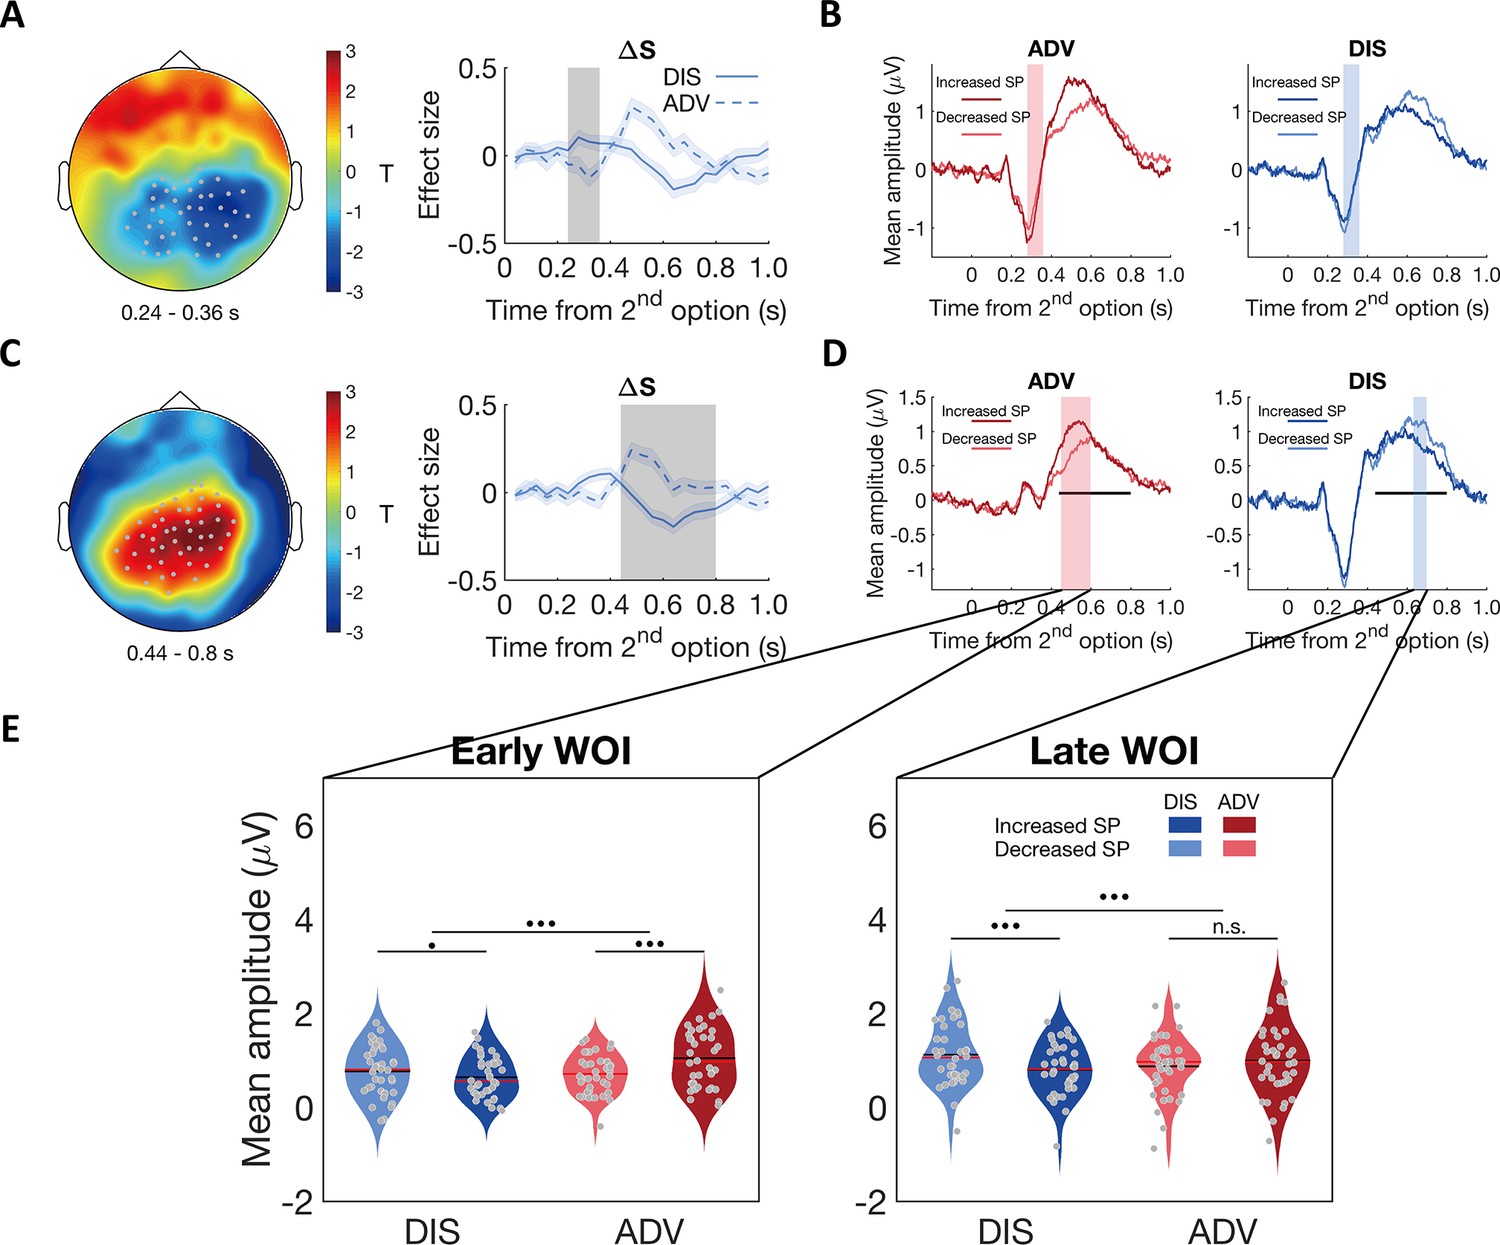
Contextual differences in neural processing of self-payoff change revealed by stimulus-locked ERPs.
(A) & (C) ERP correlations with self-payoff change () show opposite signs for the two inequality contexts, in the time windows of ~240–360ms (A) and ~440–800ms (C): left panels, topographic scalp distributions of context differences; right panels, temporal dynamics of the parametric effect strengths of self-payoff change () in the identified clusters. Grey dots highlight channels that survived the threshold, grey shaded areas indicate the durations of the significant effects, and colored shaded areas indicate ±1 SEMs in (A) and (C), N = 38. (B) and (D) Average ERP waveforms for the parametric effect of in each context during the windows of ~240–360ms (B) and ~440–800ms (D) (For statistic information, see Appendix 1). Significant clusters surviving the cluster correction for multiple comparisons at p < 0.05 are reported. Increased SP, trials in which the second option increases self-payoff; Decreased SP, trials in which the second option decreases self-payoff. Colored shaded areas indicate the duration of significant interaction between context and self-payoff change in (B). Black lines indicate the duration of significant interaction between context and self-payoff change identified in (C), and colored shaded areas in (D) indicate separate durations of the significant interaction effect of self-payoff change and context over ERP waveforms in the time window identified in (C). (E) Self-payoff processing occurs at different time windows in the two contexts. For the significant cluster shown in (C), effects lasted from ~450 to 600ms after stimulus onset in ADV (D, pink shaded area), and from ~630 to 700ms after stimulus onset in DIS (D, blue shaded area). ERP responses are averaged magnitudes derived from each window of interest (WOI) in each condition. ERP responses to self-payoff change are stronger in an earlier WOI (~450–600ms, left panel) in the ADV context, and stronger in a later WOI (~630–700ms, right panel) in the DIS context. For the early WOI (left panel), increased self-payoff (Increased SP) was related to stronger neural responses than decreased self-payoff (Decreased SP) in ADV, but there was no difference in neural responses between decreased self-payoff and increased self-payoff in DIS (left panel). For the late WOI, decreased self-payoff (Decreased SP) was related to stronger neural responses than increased self-payoff (Increased SP) in DIS, but there was no difference in neural responses between increased self-payoff and decreased self-payoff in ADV (right panel). For statistical information, see Appendix 1. Increased SP, trials in which the second option increases self-payoff; Decreased SP, trials in which the second option decreases self-payoff. Red lines, Median; black lines, mean. •••, p < 0.001; •, p < 0.05; n.s., not significant.
Figure 4—figure supplement 1
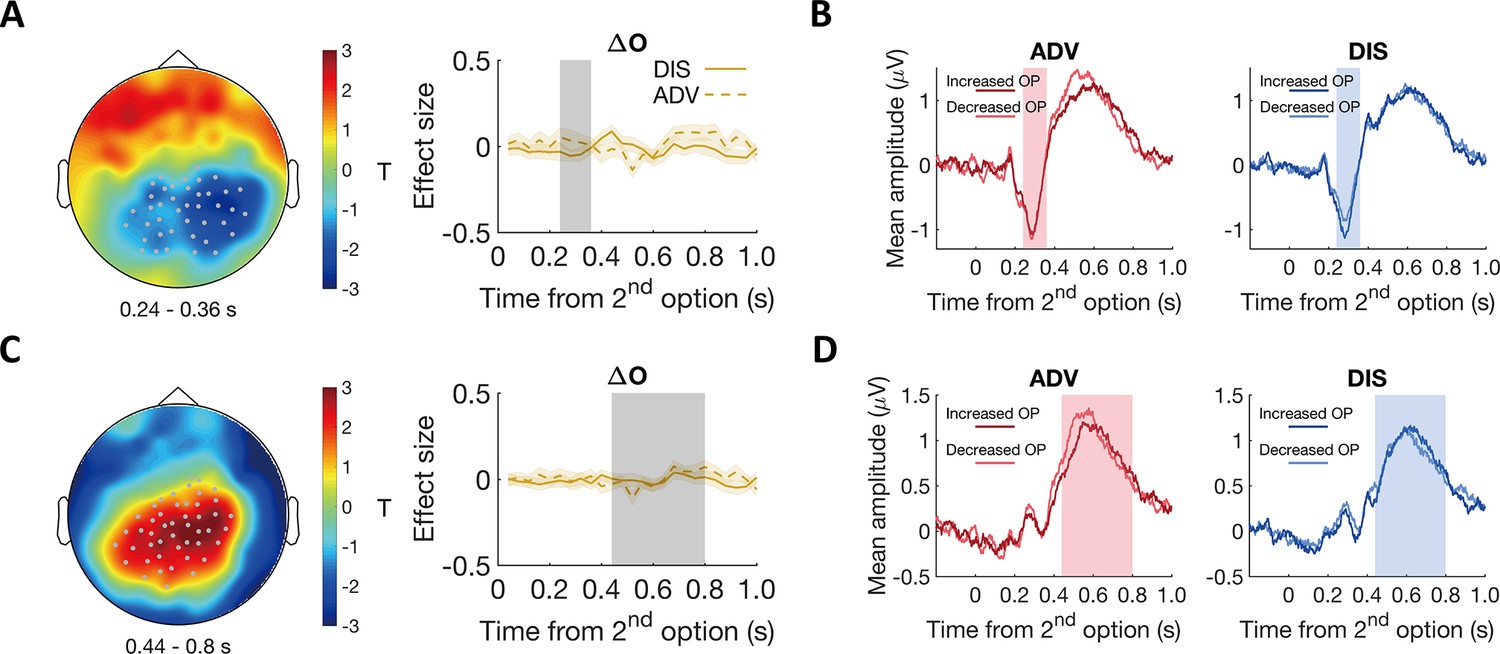
Stimulus-locked ERP control analysis of other-interest by context.
To confirm the specificity that context effects in neural processing were mainly evident in ERP correlations with self-payoff. We examined the (coefficient over other-payoff change ()) maps and revealed no ERP component that showed a significant effect of in either context and no differential effects of across contexts. Here, we further examine temporal dynamics of the parametric effect strengths of other-payoff change () in the specific clusters identified for the context-dependent effects of self-payoff change () in the analyses reported in the main text, and reveal no significant effect. (A and C) Left panels, topographic scalp distributions showing the significant interaction effects of self-payoff () by context in the time windows of ~240–360ms (A) and ~440–800ms (C). Grey dots highlight channels that survive the statistical threshold. (A and C) Right panels, temporal dynamics of the parametric effect strengths of other-payoff () in the identified clusters related to self-payoff () in left panels. Grey-shaded areas indicate the durations of the significant effects of self-payoff (), and colored-shaded areas indicate ±1 SEMs in (A) and (C), N = 38. (B and D) Average ERP waveforms for the effect of other-payoff () by context derived from clusters shown in (A and C) left panels. In both the time window of ~240–360ms after stimulus onset (B, marked by pink and blue shaded areas) and the time window of ~440–800ms after stimulus onset (D, marked by pink and blue shaded areas), no significant effect of other-payoff () is observed in the ERP waveforms. Pink and blue shaded areas indicate the durations of the significant effects of self-payoff change () by context in (B and D). Increased OP, trials in which the second option increases other-payoff; Decreased OP, trials in which the second option decreases other-payoff.
Figure 4—figure supplement 2

Whole brain analyses suggest that the effect on ERP responses occurs earlier in the ADV than in the DIS context.
The spatially and temporally unbiased whole-brain analysis of the ERP data (not constraining signals to the cluster identified in the initial regression analysis) revealed the same temporal differences between contexts as shown in the main text. These timing differences suggest that the different behavior in the two inequality contexts may relate to a temporally distinct pattern of how neural processing is focused on integrating inequality context with individuals’ assessments of differences in self-payoffs of the options. (A and B) Topographic scalp distributions of the interaction effect between self-payoff change () and context at two temporally separate time windows. Grey dots highlight channels which survive the threshold. (C) Average ERP waveforms for the effect of in ADV during the window of ~450–598ms after stimulus onset. (D) Average ERP waveforms for the effect of in DIS during the window of ~632–698ms after stimulus onset. Black lines indicate the duration of significant interaction between context and self-payoff change, and colored shaded areas indicate the durations of the significant effect of self-payoff change in each context(C and D). Increased SP, trials in which the second option increases self-payoff relative to the first option; Decreased SP, trials in which the second option decreases self-payoff relative to the first option.
Figure 5 with 5 supplements
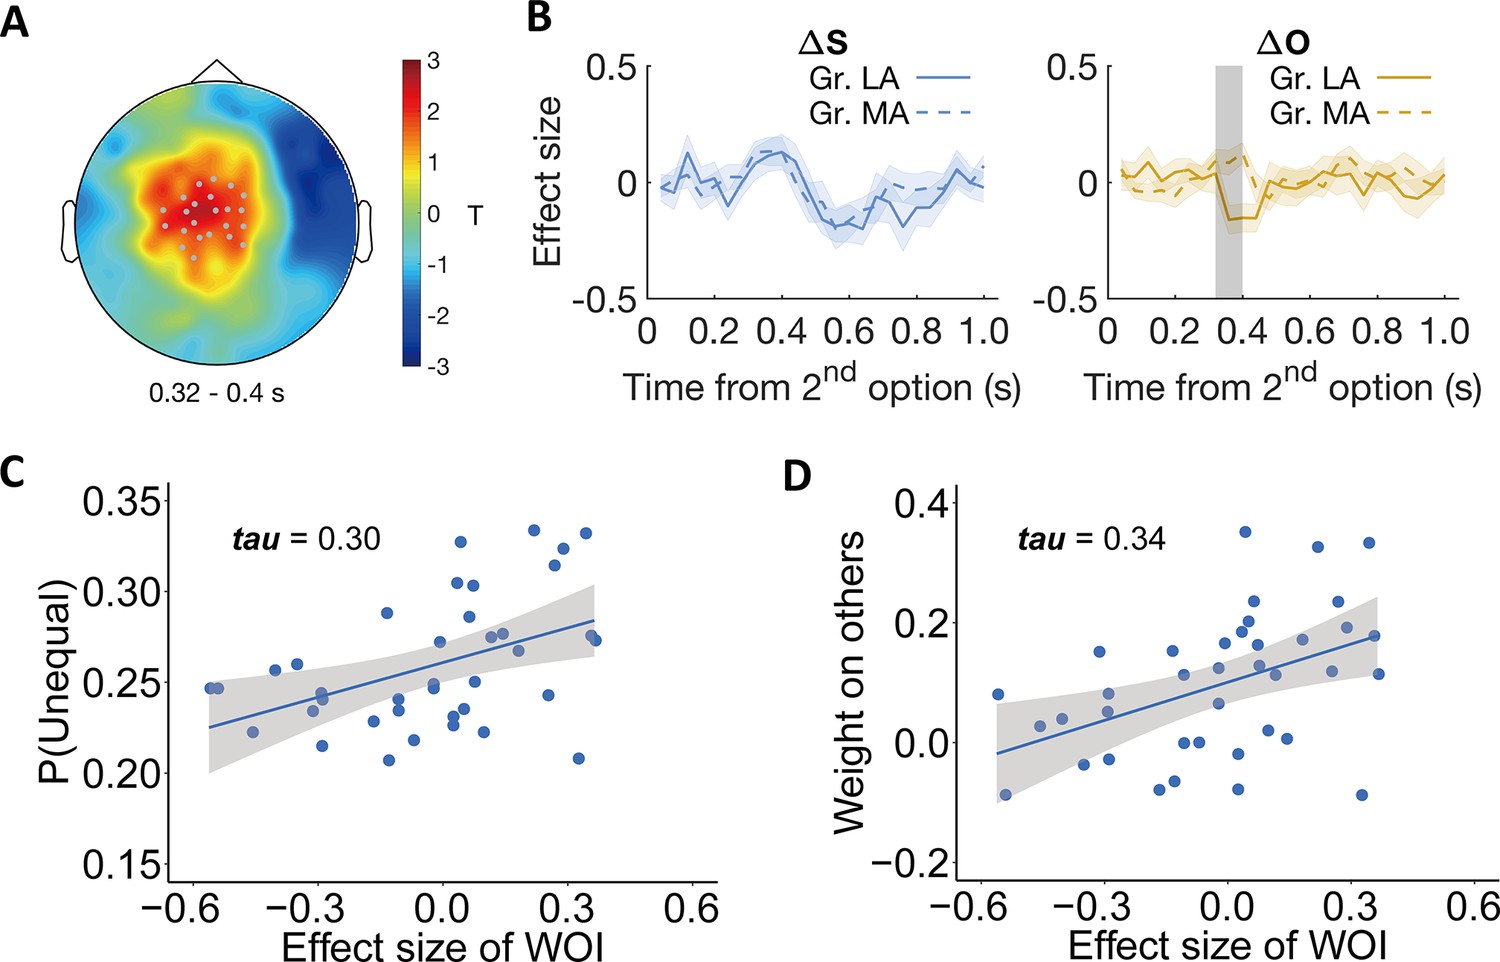
Individual differences relate to differential neural processing of other-payoffs in the stimulus-locked ERP analysis.
Participants were divided into more altruistic (MA) and less altruistic groups (LA) based on the model parameter weight on others. (A) Topographic scalp distribution of the difference between MA and LA groups in ERP correlation with other-payoff difference () in the DIS context. The significant effect lasted from ~320 to 400ms after stimulus onset. Grey dots highlight channels that survived the threshold. (B) Specificity of the effect for . Temporal dynamics of the parametric effect strengths of self-payoff change (, left) and other-payoff change (, right) in the identified cluster. Colored shaded areas indicate ±1 SEMs. Gr., group. Grey shaded area indicates the duration of the significant effect. Significant clusters surviving the cluster correction for multiple comparisons at p < 0.05 are reported, N(LA) = 19, N(MA) = 19. (C–D) Neural effects relate to behavior. The plots show the correlations between the effect strengths of other-payoff change () in the identified cluster and the probability to choose the unequal option (C) and the OU parameter of weight on others (D).
Figure 5—figure supplement 1
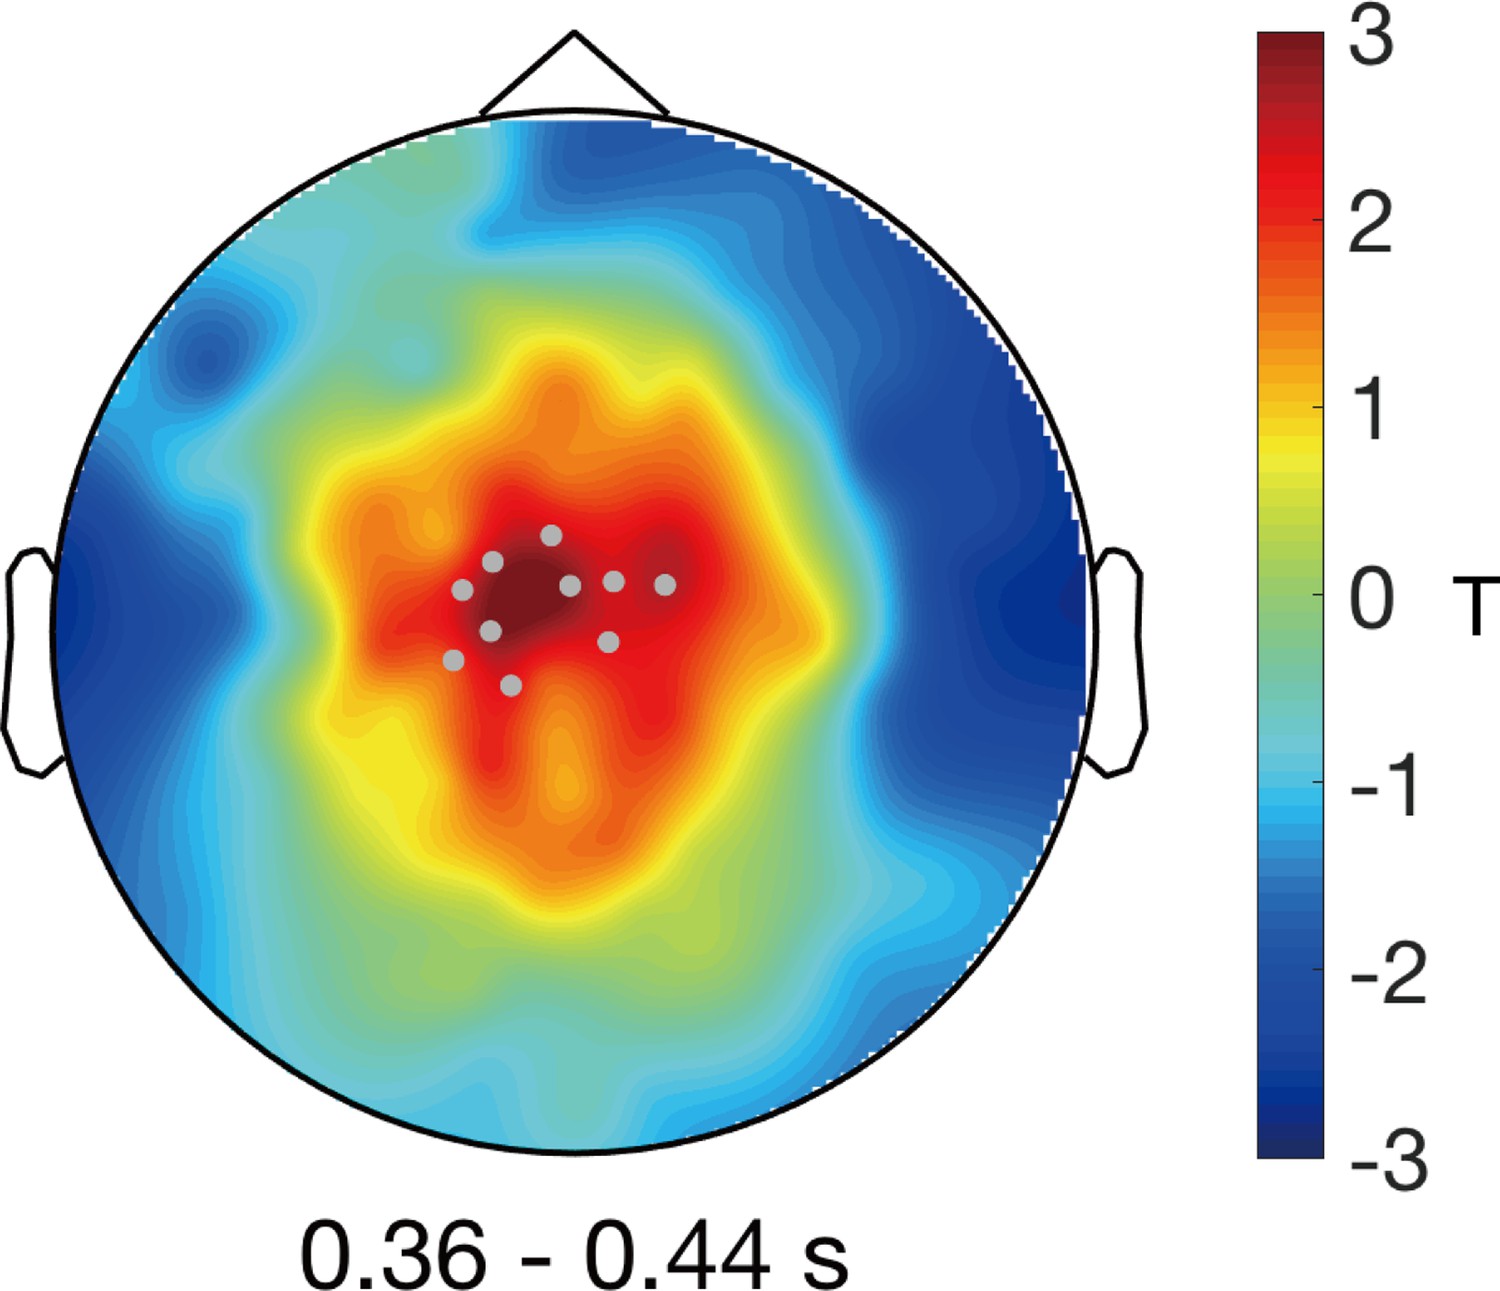
Correlation analysis between the model-parameter weight on others and neural responses to other-payoff change () in the DIS context.
In the main text, we show that for a centrofrontal cluster and the time window of ~320–400ms after stimulus onset, larger increases of other-payoff were associated with a more negative ERP response in the less versus more altruistic group (median-split the weight on others (ω), Figure 5A and B). A continuous correlation analysis over all participants reveals a similar temporal-spatial cluster as that displayed in Figure 5A, suggesting that the more altruistic a participant, the less negative the responses (in the time window of ~360–440ms after stimulus onset) to larger increases of other-payoff.
Figure 5—figure supplement 2
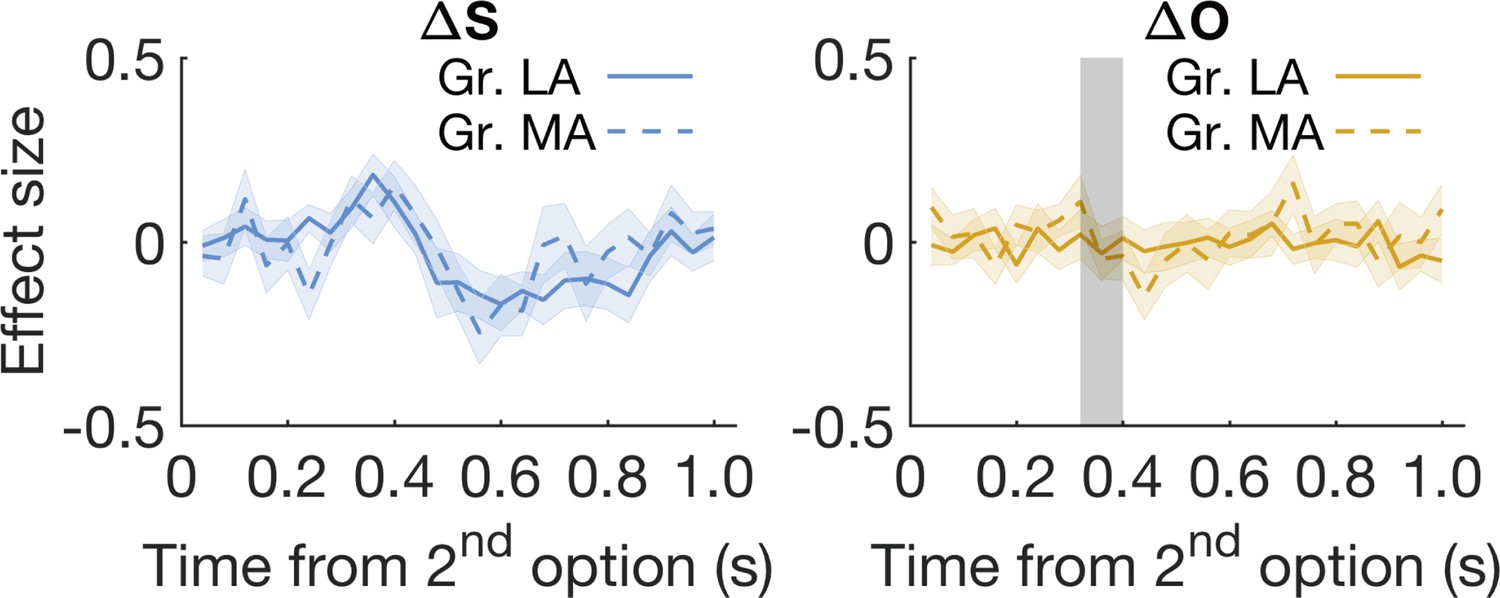
Stimulus-locked ERP analysis of other-interest by altruistic preferences.
Participants were divided into two groups (MA vs LA) based on median-split of the starting point parameter in the DIS context (similar to the corresponding analyses based on ω reported in the main text). Temporal dynamics of the parametric effect strengths of self-payoff (, left) and other-payoff (, right) in the cluster identified in the individual difference analysis of neural processing of other-payoff () based on weight on others. Colored shaded areas indicate ±1 SEMs, N(LA) = 19, N(MA) = 19. Grey shaded area indicates the duration of the significant effect identified in the individual difference analysis of the OU parameter of weight on others. Gr., group. These findings indicated that the individual difference effect of neural processing of was specific for ω (weight placed on others’ payoffs), and was not evident for (starting point).
Figure 5—figure supplement 3
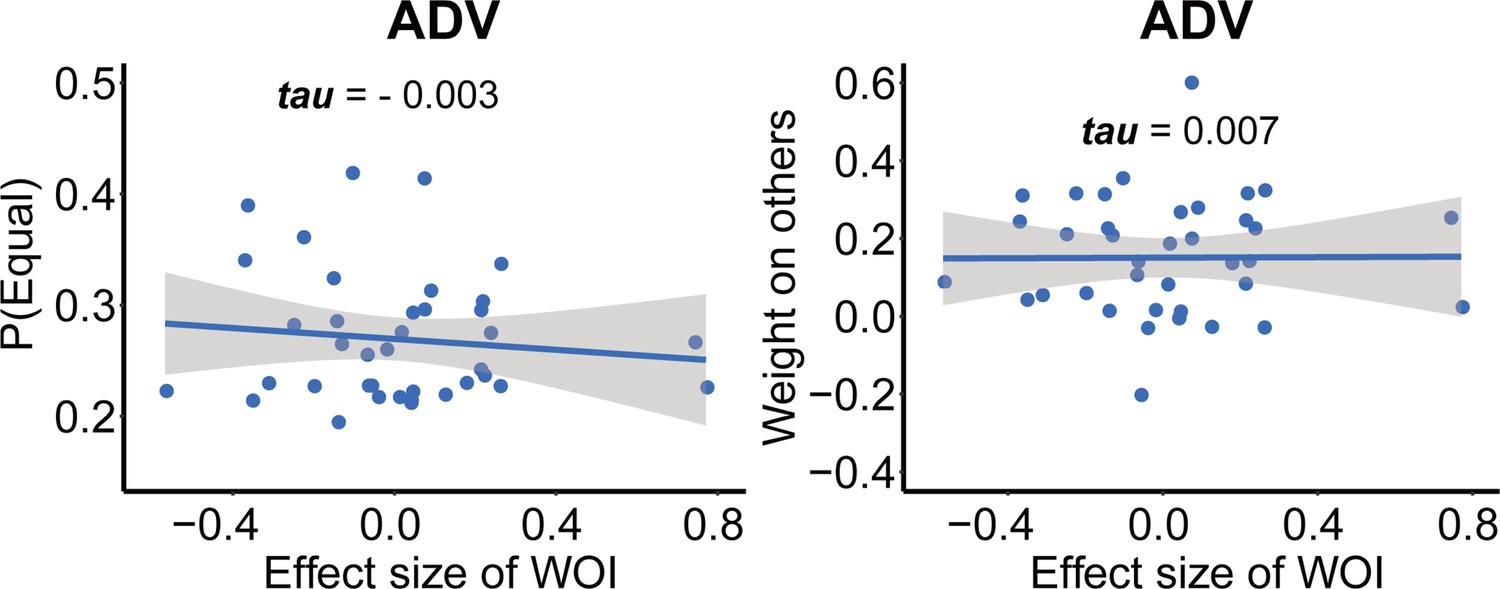
Individual difference analyses in the ADV context.
Correlations between the effect strengths of other-payoff () in ADV (from the cluster identified in the individual difference analysis in DIS) and the probability to choose the more equal option (left), and the OU parameter weight on others (right) in the ADV context. All these correlations are insignificant, showing the specificity of the effects for the DIS context.
Figure 5—figure supplement 4

Individual differences relate to differential neural processing of other-payoff in the stimulus-locked ERP analysis.
Average ERP waveforms for the parametric effect of other-payoff change () in each group during the windows of ~320–400ms. Increased other-payoff (OP) was associated with a stronger negative-going response than decreased other-payoff (OP) for the less altruistic group (A), but not for the more altruistic group (B). Increased OP, trials in which the second option increases other-payoff; Decreased OP, trials in which the second option decreases other-payoff. Gr., group; MA, more altruistic group; LA, less altruistic group.
Figure 5—figure supplement 5

Parametric effects of in the more altruistic (MA) and the less altruistic (LA) groups.
To confirm that individual differences in neural processing of choice-relevant information are unrelated to the context effects, we also compared the more- versus less-altruistic groups in terms of how they processed self-payoff. This showed that irrespective of the grouping parameter (i.e., weight on others or starting point), more altruistic and less altruistic groups exhibited similar neural processing of self-payoff differences in those identified clusters. (A) & (B) Topographic scalp distributions of significant effects by context in the time windows of ~240–360ms (A) and ~440–800ms (B) as shown in Figure 4A and C. (C) For the early effect (~240–360ms), MA and LA groups categorized based on weight on others (upper panels) and based on starting point (lower panels) both showed similar dynamic effects as shown in Figure 4A. (D) For the late effect (~440–800ms), MA and LA groups categorized based on weight on others (upper panels) and based on starting point (lower panels) also showed similar effects as shown in Figure 4C. Grey dots highlight channels that survive the threshold in (A) and (B). Blue shaded areas indicate ±1 SEMs, and grey shaded areas indicate the durations of the significant effects identified in Figure 4A and C, N(LA) = 19, N(MA) = 19.
Figure 6 with 1 supplement
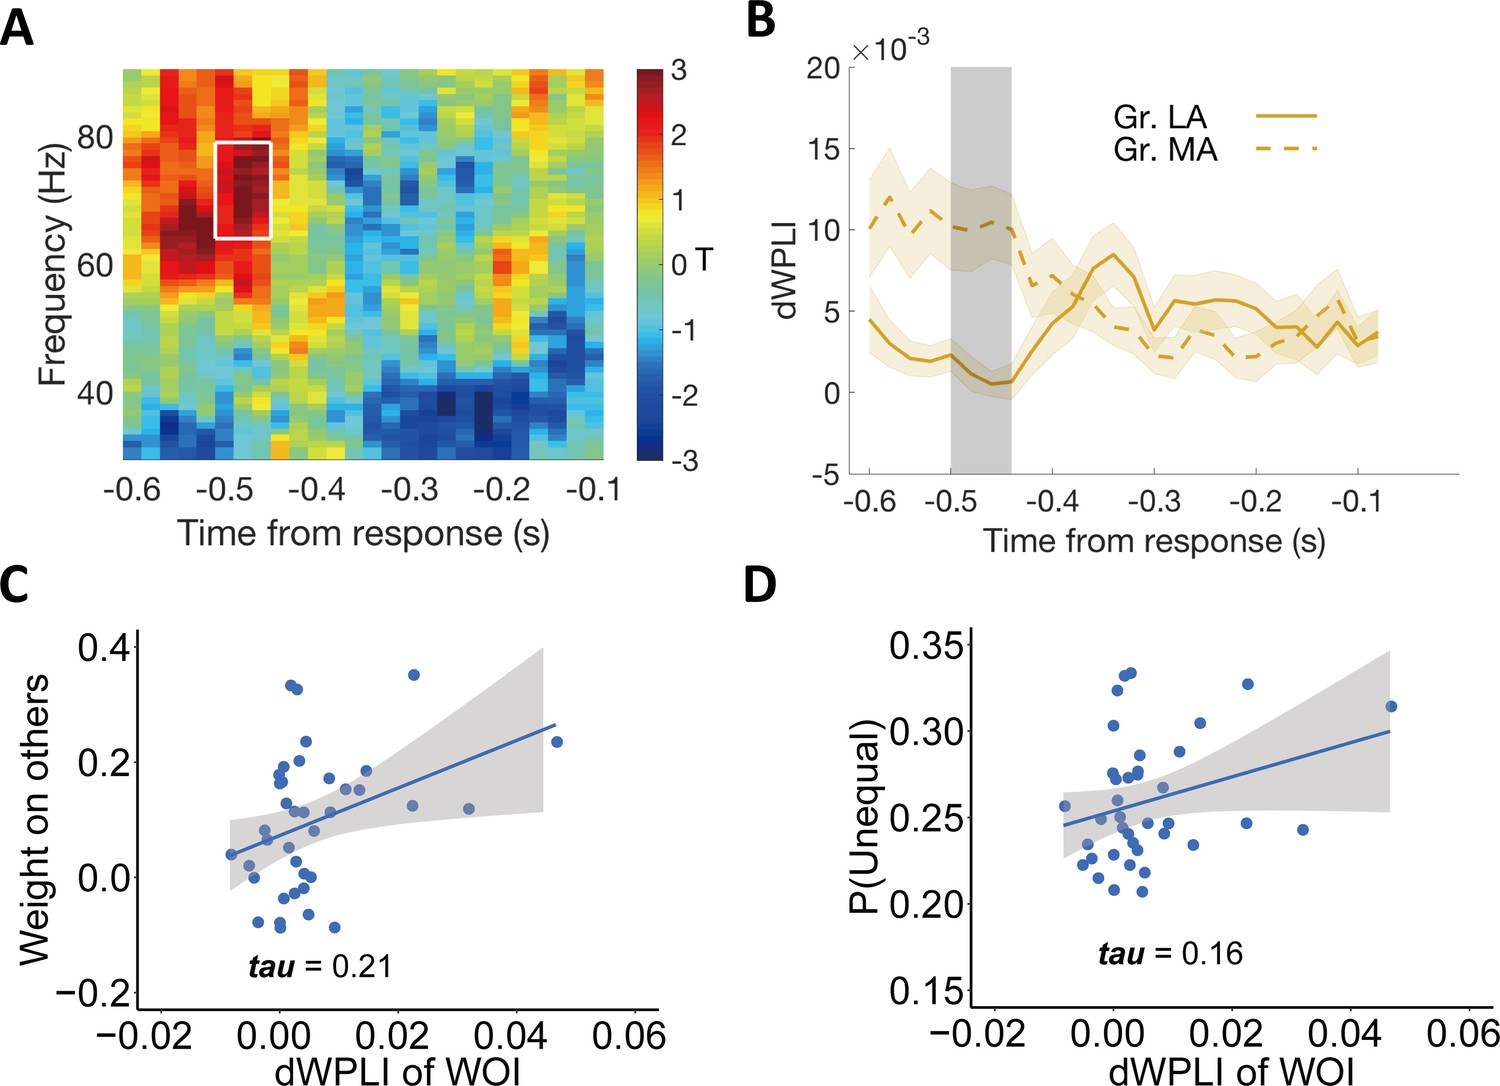
Individual differences in altruism relate to frontal-parietal synchronization.
(A) Heatmap showing T-statistics for the differences between the more altruistic (MA) minus less altruistic (LA) group in phase coupling (dWPLI) between the frontal cluster shown in Figure 5A and the parietal cluster shown in Figure 2C, in the DIS context. A significant effect was identified in the gamma-band frequency range (~64–79 Hz) at the time window of ~520–460ms before response (highlighted in white box). (B) Temporal dynamics of the average dWPLI strengths in the ~64–79 Hz frequency range. Grey shaded area indicates the duration of the significant effect. Colored shaded areas indicate ±1 SEMs. Gr., group. Significant clusters surviving the cluster correction for multiple comparisons at p < 0.05 are reported, N(LA) = 19, N(MA) = 19. (C) Correlation between the strength of frontal-parietal synchronization (dWPLI) in the identified time-frequency cluster and the OU parameter of weight on others. (D) Correlation between the strength of frontal-parietal synchronization (dWPLI) in the identified time-frequency cluster and the probability to choose the unequal option in the DIS context.
Figure 6—figure supplement 1
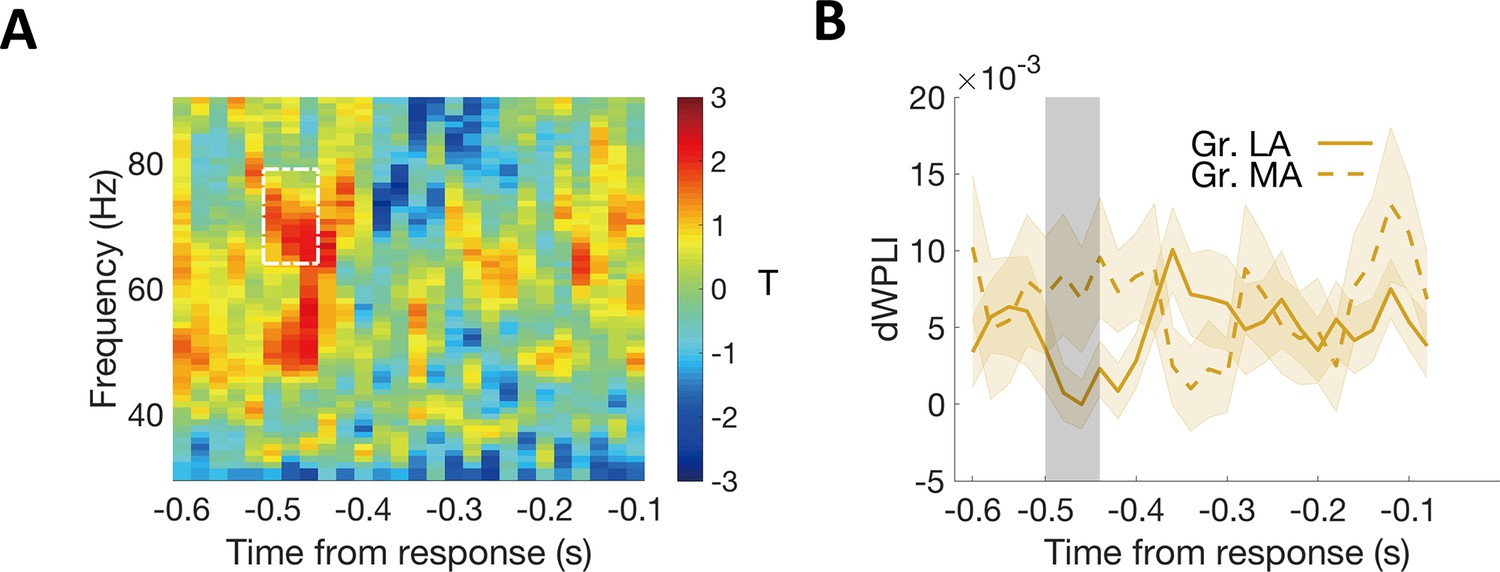
Relationship between altruism and frontal-parietal synchronization in the ADV context.
We do not have a specific hypothesis regarding the relationship between inter-regional synchronization and altruistic preferences for the ADV context. Nevertheless, we still tested whether synchronization between centro-frontal regions associated with others’ payoff processing and the parietal evidence accumulation regions is associated with altruistic preferences in the ADV context. No significant temporal-frequency cluster was identified by this analysis. (A) Heatmap showing t-statistics for the differences between the more altruistic (MA) minus less altruistic (LA) group in phase coupling (dWPLI) between the frontal cluster shown in Figure 5A and the parietal cluster shown in Figure 2D, in the ADV context. White dashed box indicates the temporal-frequency cluster showing significant effect in the DIS context. (B) Temporal dynamics of the average dWPLI strengths in the ~64–79 Hz frequency range in the ADV context. Grey shaded area indicates the duration of the significant effect in the DIS context. Colored shaded areas indicate ±1 SEMs, N(LA) = 19, N(MA) = 19. GR, group.
Additional files
-
MDAR checklist
- https://cdn.elifesciences.org/articles/80667/elife-80667-mdarchecklist1-v1.docx
-
Supplementary file 1
Generalized linear mixed-effects model results of choice data.
- https://cdn.elifesciences.org/articles/80667/elife-80667-supp1-v1.docx
-
Supplementary file 2
Generalized linear mixed-effects model results of choice data show that the presentation order (i.e., first or second) of the more equal or unequal option does not bias individuals’ choices.
- https://cdn.elifesciences.org/articles/80667/elife-80667-supp2-v1.docx
-
Supplementary file 3
Linear mixed-effects model results of RT data.
- https://cdn.elifesciences.org/articles/80667/elife-80667-supp3-v1.docx
-
Supplementary file 4
Bounds of OU parameters.
- https://cdn.elifesciences.org/articles/80667/elife-80667-supp4-v1.docx
-
Supplementary file 5
Model comparison results.
- https://cdn.elifesciences.org/articles/80667/elife-80667-supp5-v1.docx
Download links
A two-part list of links to download the article, or parts of the article, in various formats.
Downloads (link to download the article as PDF)
Open citations (links to open the citations from this article in various online reference manager services)
Cite this article (links to download the citations from this article in formats compatible with various reference manager tools)
A unified neural account of contextual and individual differences in altruism
eLife 12:e80667.
https://doi.org/10.7554/eLife.80667


