Promoting Fc-Fc interactions between anti-capsular antibodies provides strong immune protection against Streptococcus pneumoniae
- Medical Microbiology, University Medical Center Utrecht, Utrecht University, Netherlands
- Biomolecular Mass Spectrometry and Proteomics, Bijvoet Center for Biomolecular Research and Utrecht Institute for Pharmaceutical Sciences, Utrecht University, Netherlands
- Netherlands Proteomics Center, Netherlands
- Genmab, Netherlands
Figures
Figure 1 with 4 supplements

Promoting Fc-Fc interactions between CPS6-IgG1 enables complement activation on S. pneumoniae (Spn) 6B.
(a) Schematic representation of antibody binding to antigen on a target surface. IgGs can cluster into hexamers via non-covalent interaction between their Fc domains and thus form an optimal docking platform for C1q. (b) Left: schematic illustration of S. pneumoniae showing the location of its dominant surface structure, the polysaccharide capsule (CPS), and antibodies recognition that confer type-specific protection. The capsule forms the outermost layer of encapsulated strains of S. pneumoniae and for most cases is covalently attached to the outer surface of the cell wall peptidoglycan. Right: binding of CPS-IgG1wild-type (WT) or containing the single-point hexamerization-enhancing mutations, E430G or E345K, to S. pneumoniae surface. (c) Binding of WT and hexamerization-enhancing mutated (E430G or E345K) CPS6-IgG1 to S. pneumoniae 6B (ST6B), detected with Alexa647-conjugated F(ab’)2-goat anti-human kappa antibody by flow cytometry. (d–f) Complement components C1q, C4b, and C3b deposition on S. pneumoniae 6B after incubation with 2.5% IgG/IgM-depleted serum supplemented with WT or hexamerization-enhancing mutated (E430G or E345K) CPS6-IgG1. All detected with Alexa647-conjugated F(ab’)2-goat anti-mouse immunoglobulins antibody by flow cytometry. (c–f) Data are expressed relative to the 8 µg WT value and presented as means ± SD of three independent experiments. Dashed line represents background (no IgG) level. Two-way ANOVA was used to compare across dose–response curves at the various concentrations the differences between the WT and the E430G or E345K variants. When significant, it is displayed as *p<0.05; ***p<0.001; ****p<0.0001.
Figure 1—figure supplement 1
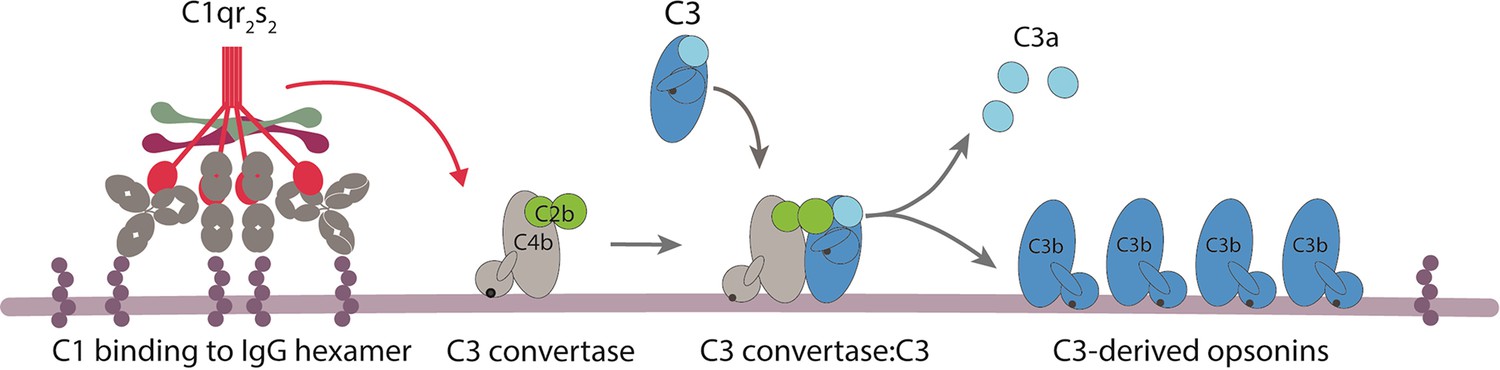
Overview of complement classical pathway activation.
The binding of C1 complex (C1qr2s2) to bacterium-bound antibodies triggers the activation of the classical pathway. C1 complex consists of an antibody recognition unit (C1q) and four associated proteases (two copies of C1r and C1s). C1s will cleave C4 and C2 to generate a surface-bound C3 convertase (C4b2b) that catalyses the rapid deposition of C3b molecules onto the target surface. C1 binding to antibodies occurs via the globular heads of C1q. Due to a low affinity of each gC1q domain for an IgG, avid binding of C1q requires clustering of surface-bound IgGs into an ordered hexamer that is held together via non-covalent Fc-Fc contact between neighboring antibodies.
Figure 1—figure supplement 2
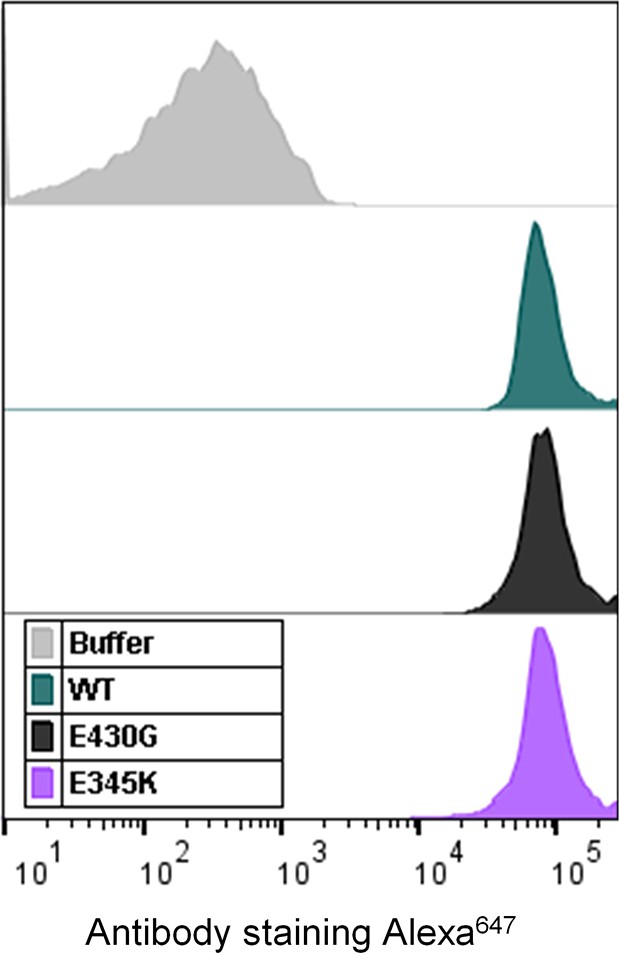
Representative flow cytometry histogram overlay showing equal binding of CPS6-IgG1 wild-type (WT), CPS6-IgG1-E430G and E345K mutants (4 µg/ml) to pneumococcal serotype 6B.
Buffer control (gray) represents bacteria in the absence of antibodies.
Figure 1—figure supplement 3
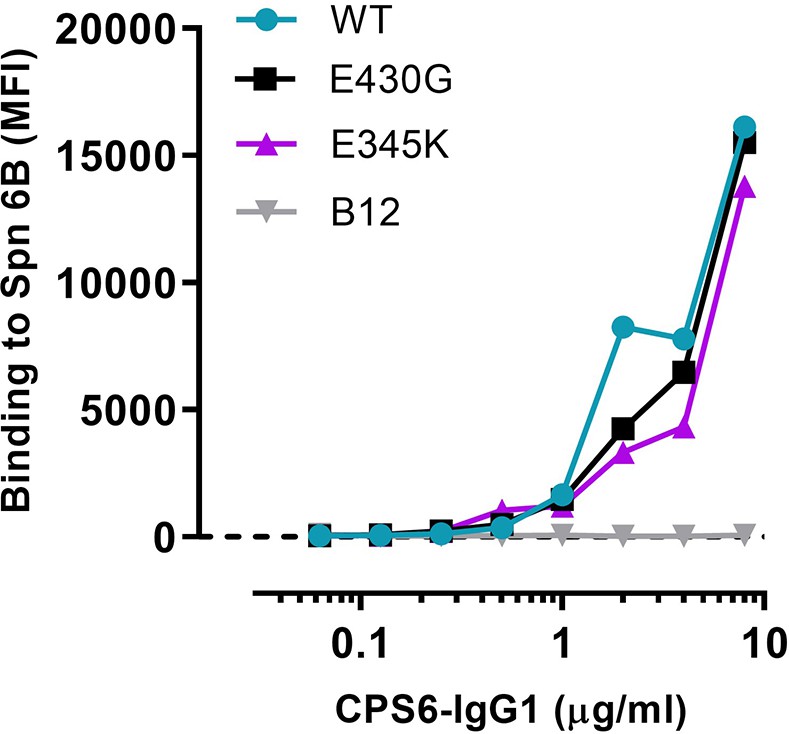
Representative graph of Figure 1c.
Binding of CPS6-IgG1 WT or hexamer-enhancing mutations, E430G and E345K, to S. pneumoniae serotype 6B expressed as mean fluorescence index values. Antibody b12 (B12), which recognizes HIV protein gp120, was included as an unrelated negative control. Data represent mean fluorescence intensity (MFI) from one experiment. Dashed line represents background (no IgG) level.
Figure 1—figure supplement 4
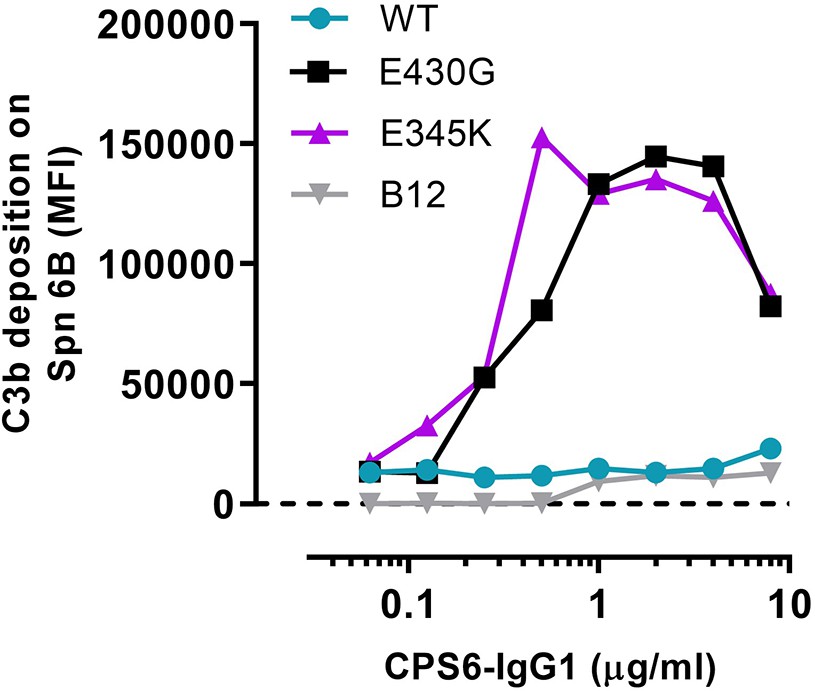
Representative graph of Figure 1d.
Complement C3b deposition (comparison between CPS6-IgG1-WT, E430G, and E345K variants) onto S. pneumoniae (Spn) serotype 6B. Antibody b12 (B12), which recognizes HIV protein gp120, was included as an unrelated negative control. Data represent mean fluorescence intensity (MFI) from one experiment. Dashed line represents background (no IgG) level.
Figure 2 with 5 supplements
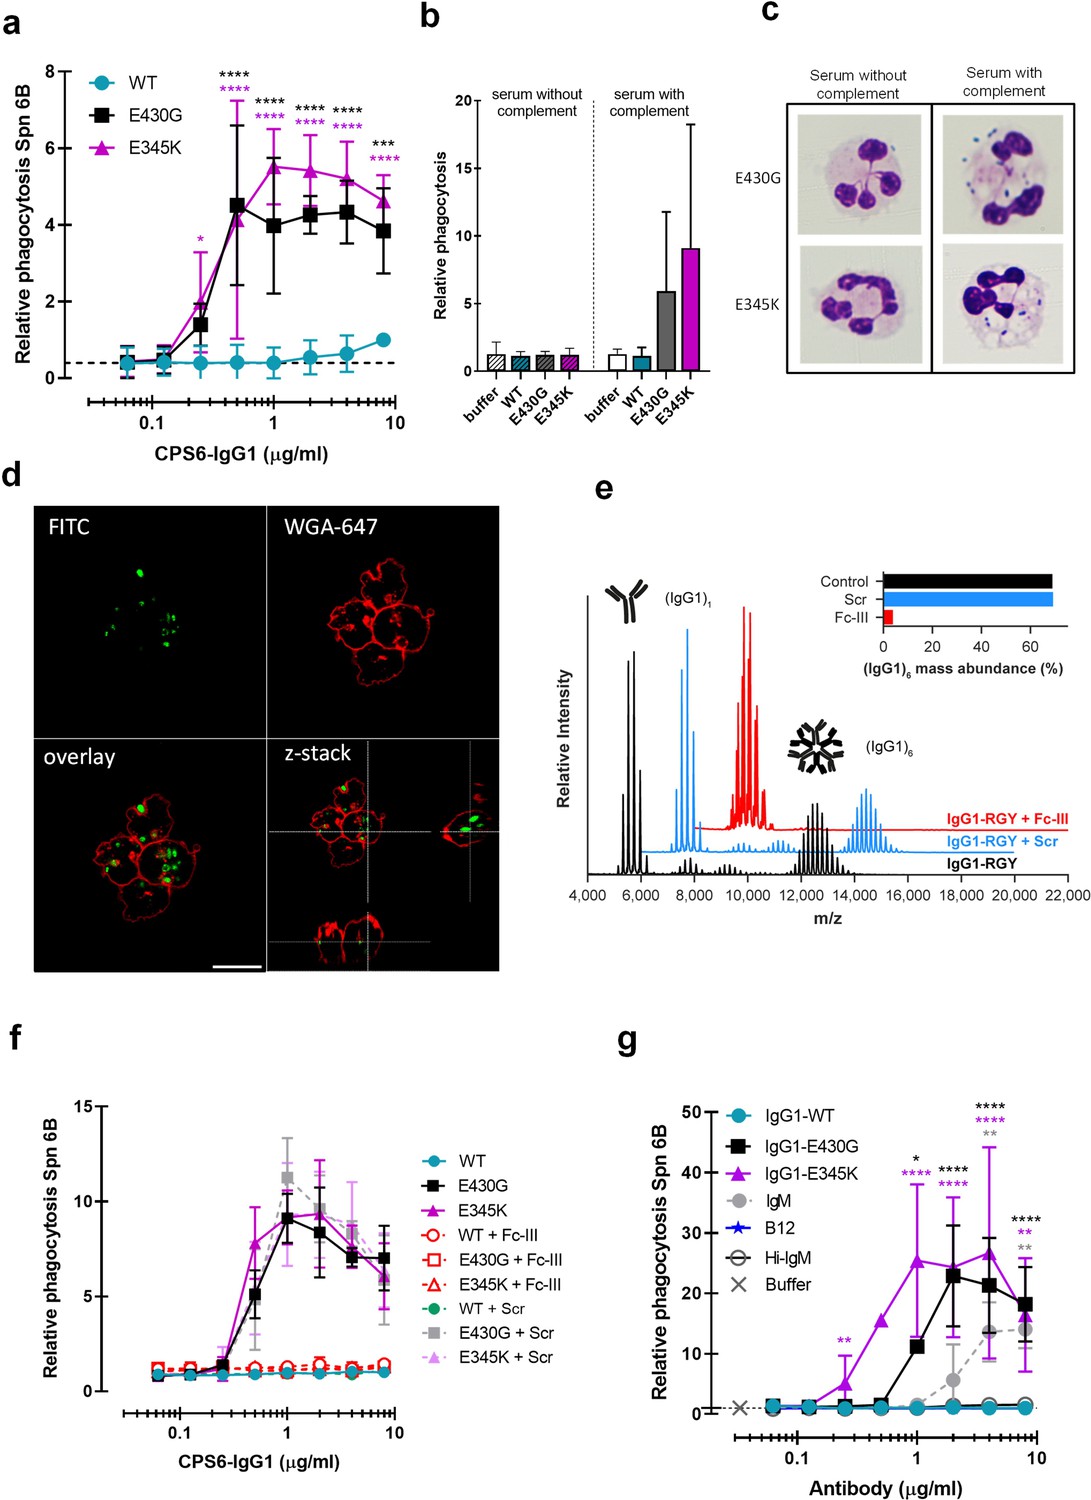
Hexamerization-enhanced variants of CPS6-IgG1 trigger complement-dependent phagocytosis of serotype 6B S. pneumoniae.
(a) Phagocytosis in the presence of complement. Fluorescently labeled bacteria uptake by human neutrophils in the presence of 2.5% IgG/IgM-depleted serum supplemented with CPS6-IgG1-WT versus E430G and E345K variants. (b) Comparison of S. pneumoniae (Spn) serotype 6B phagocytosis by CPS6-IgG1-WT, E430G, or E345K antibody variants at 4 µg/ml in the presence of 2.5% IgG/IgM-depleted serum without (striped bars) or with active complement cascade (non-striped bars). (c) Microscopy image of pneumococcal phagocytosis by human neutrophils in the presence of 5% IgG/IgM-depleted serum with or without active complement, supplemented with 8 µg/ml CPS6-IgG1-E430G or E345K variant. Cytospin preparations were stained with Giemsa–May–Grünwald (Diff-Quik) and pictures taken using a ×100 objective to visualize cytoplasmic internalization. (d) Confocal microscopy images of S. pneumoniae 6B internalization by human neutrophils in the presence 2.5% IgG/IgM-depleted serum with active complement, supplemented with 4 µg/ml CPS6-IgG1-E345K variant. Bacteria were labeled with FITC (green) and neutrophils were visualized with WGA-Alexa 647 (red). Orthogonal view is representative for a total of three Z-stacks per condition. Scale bar: 10 μm. (e) Native mass spectra of IgG1-RGY in the absence (black) and presence of Fc-Fc inhibitor peptide Fc-III (red) or a scrambled version Scr (blue). Spectra are shifted for clarity and monomeric (IgG1)1 and hexameric (IgG1)6 mass peaks are indicated. Inset represents the percentage (IgG1)6 for each sample. (f) Phagocytosis of fluorescently labeled S. pneumoniae 6B after incubation with 2.5% IgG/M-depleted serum supplemented with CPS6-IgG1-WT, CPS6-IgG1-E430G, or CPS6-IgG1-E345K in the presence or absence of 10 μg/ml Fc-Fc inhibitory peptide (Fc-III) and a scrambled version (Scr). (g) Phagocytosis of Spn 6B in the presence of anti-pneumococcal CPS6-IgM antibodies compared to CPS6-IgG1-WT, E430G, and E345K. Antibody b12 (anti-vitamin B12), which recognize HIV protein gp120, (B12) antibody was included as an unrelated negative control. (a, b, f, g) Bacterial uptake is displayed as the mean fluorescence value of neutrophils relative to CPS6-IgG1-WT at the highest concentration tested (8 μg/ml). Data represent mean ± SD of three independent experiment. (a) Dashed line represents background (buffer) level. Two-way ANOVA was used to compare across dose–response curves at the various concentrations the differences between the WT and the E430G or E345K variants. When significant, it is displayed as *p<0.05; ***p<0.001; ****p<0.0001.
Figure 2—figure supplement 1
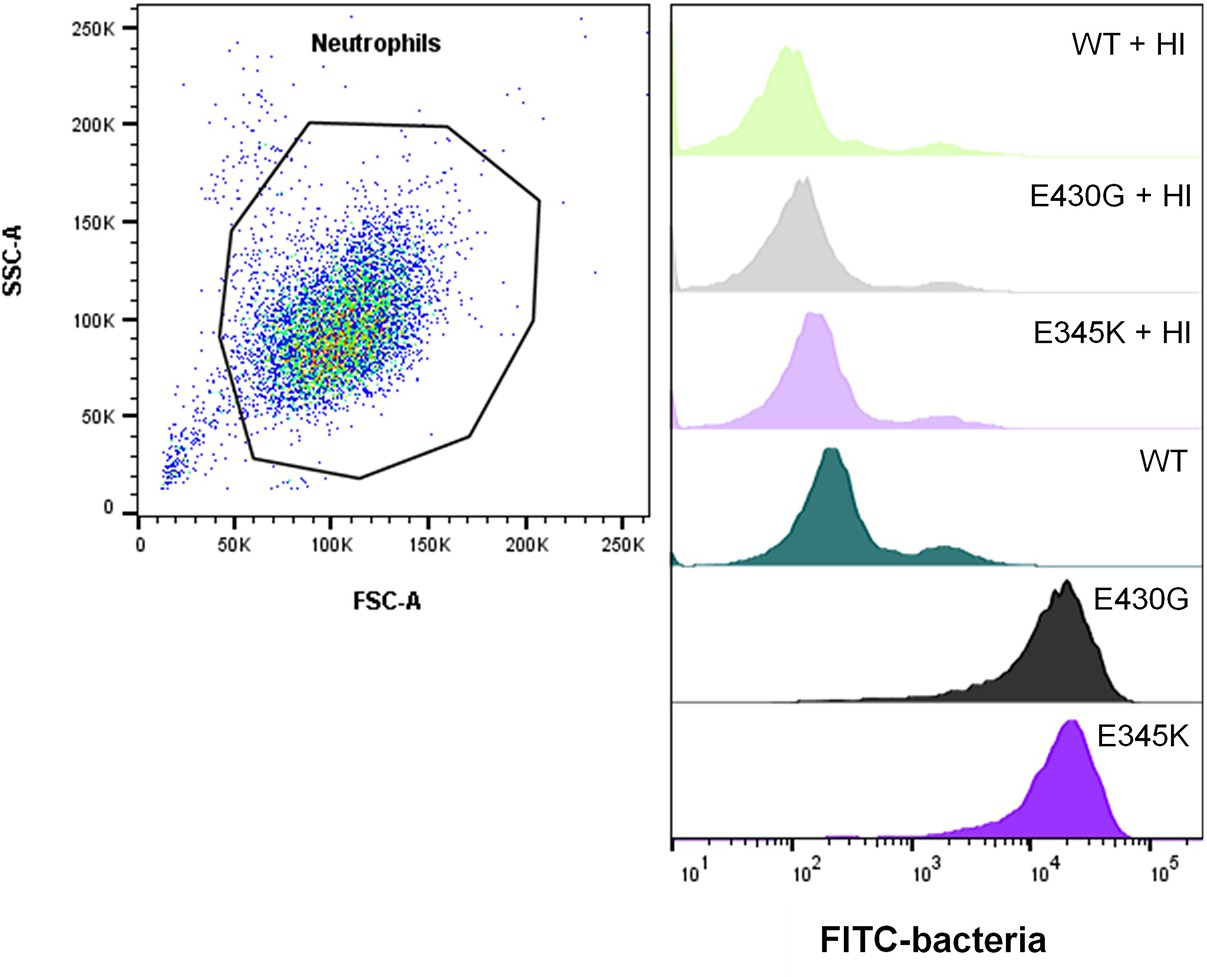
Representative flow cytometry analysis of pneumococcal serotype 6B phagocytosis by neutrophils.
Left: scatter plot of neutrophils and indicated gate setting for analysis. Right: histogram overlay showing the FITC fluorescence of gated neutrophils in the presence of CPS6-IgG1-WT, CPS6-IgG1-E430G, or E345K mutants (4 µg/ml) plus 2.5% heat-inactivated (HI; no active complement) or normal IgG/IgM-depleted serum.
Figure 2—figure supplement 2
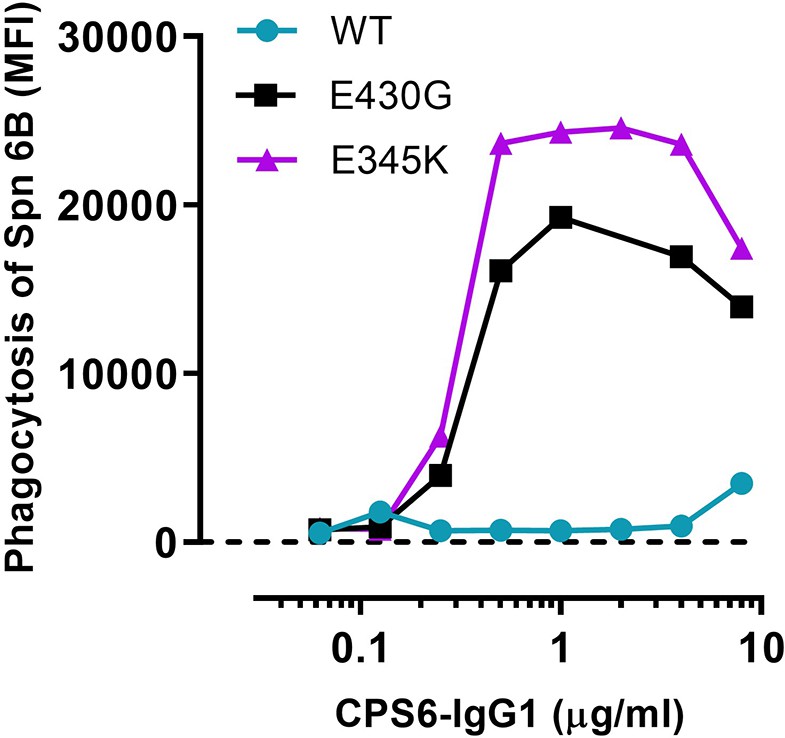
Representative graph of Figure 2a.
Phagocytosis of S. pneumoniae (Spn) serotype 6B by human neutrophils in the presence of 2.5% IgG/IgM-depleted serum supplemented with CPS6-IgG1-WT versus E430G and E345K variants. Data represent mean fluorescence index (MFI) of one experiment. Dashed line represents background (buffer) level.
Figure 2—figure supplement 3
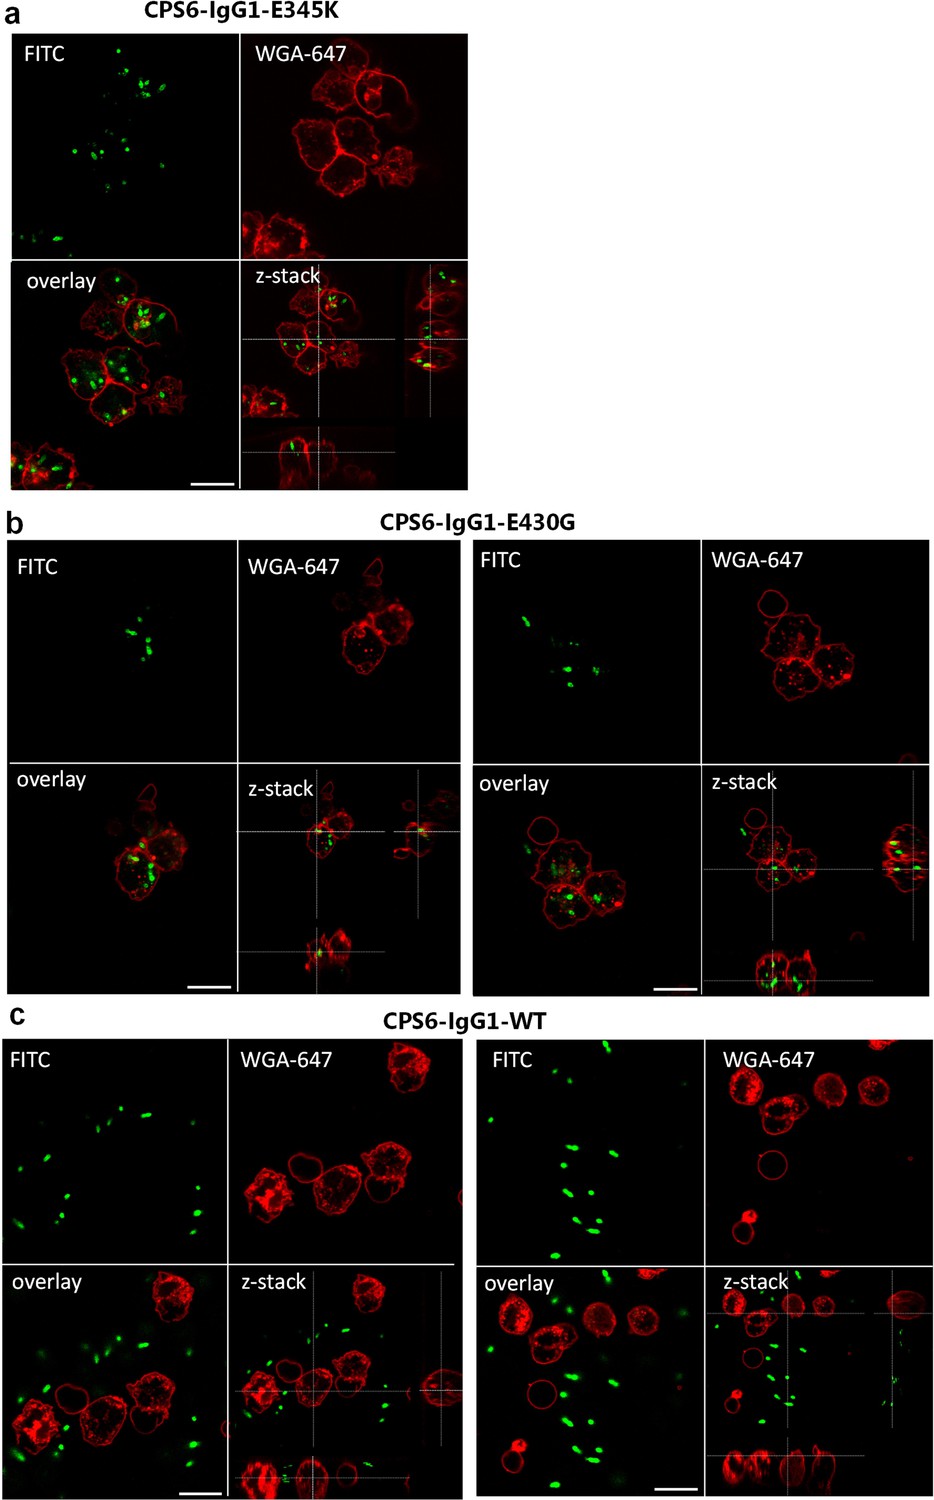
Confocal microscopy images of S. pneumoniae 6B internalized by human neutrophils in the presence of 2.5% IgG/IgM-depleted serum with active complement, supplemented with 4 µg/ml CPS6-IgG1-WT (a), E430G (b), or E345K variant (b).
Bacteria were labeled with FITC (green) and neutrophils were visualized with WGA-Alexa 647 (red). Orthogonal views are representative for a total of three Z-stacks per condition. Scale bars: 10 μm.
Figure 2—figure supplement 4
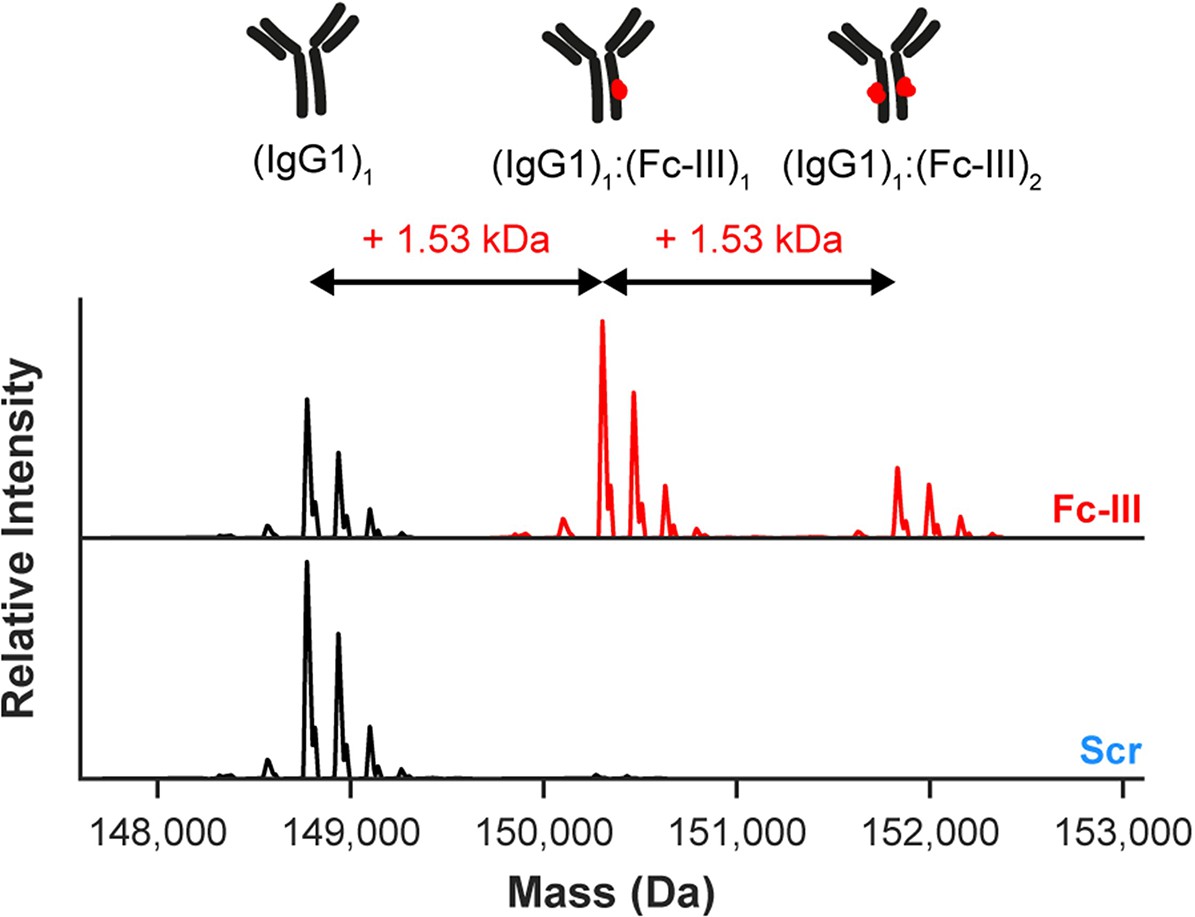
Deconvoluted native mass spectra showing that the masses of anti-CD52 IgG1 glycoforms (black) are shifted when incubated with Fc-III (red), but not with Scr (blue).
This shift corresponds to binding of one or two copies of Fc-III to a single IgG1 molecule.
Figure 2—figure supplement 5
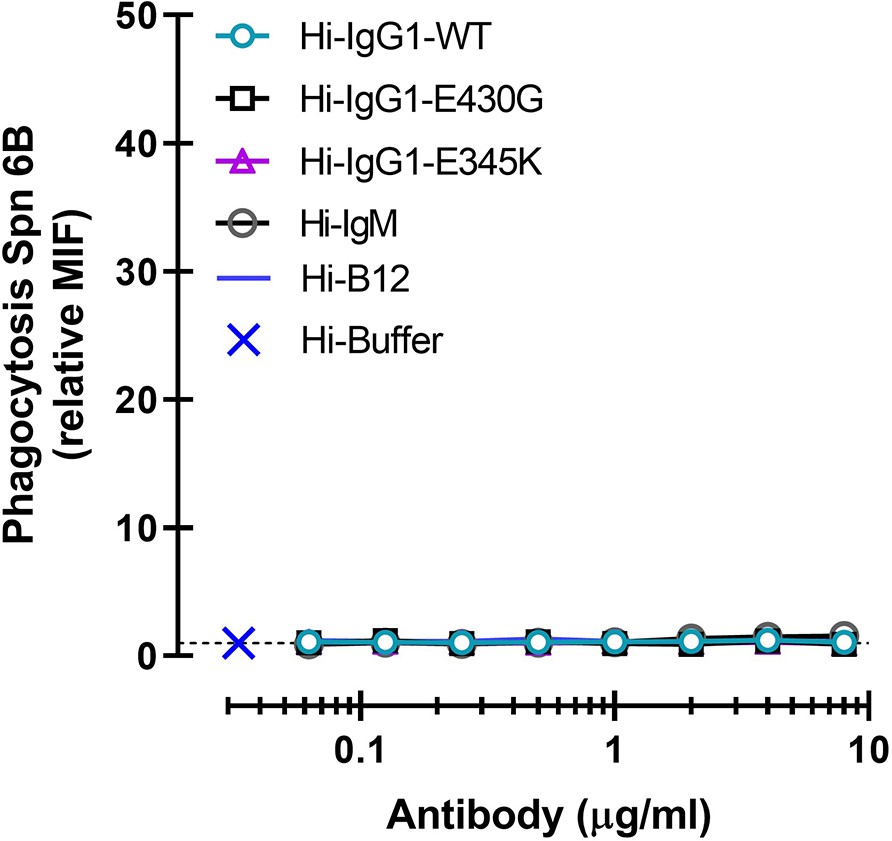
Phagocytosis of S. pneumoniae (Spn) 6B in the presence of heat-inactivated 2.5% IgG/IgM-depleted serum supplemented with CPS6-IgG1-WT versus E430G, E345K variants or CPS6-IgM.
Antibody b12 (B12), which recognize HIV protein gp120, was included as an unrelated negative control. Bacterial uptake is displayed as the mean fluorescence value of neutrophils relative to CPS6-IgG1-WT with complement-active IgG/IgM-depleted serum at the highest concentration tested (8 μg/ml) presented in Figure 2f. Data represent mean ± SD of three independent experiment. Dashed line represents background (buffer) levels, without antibody.
Figure 3 with 1 supplement
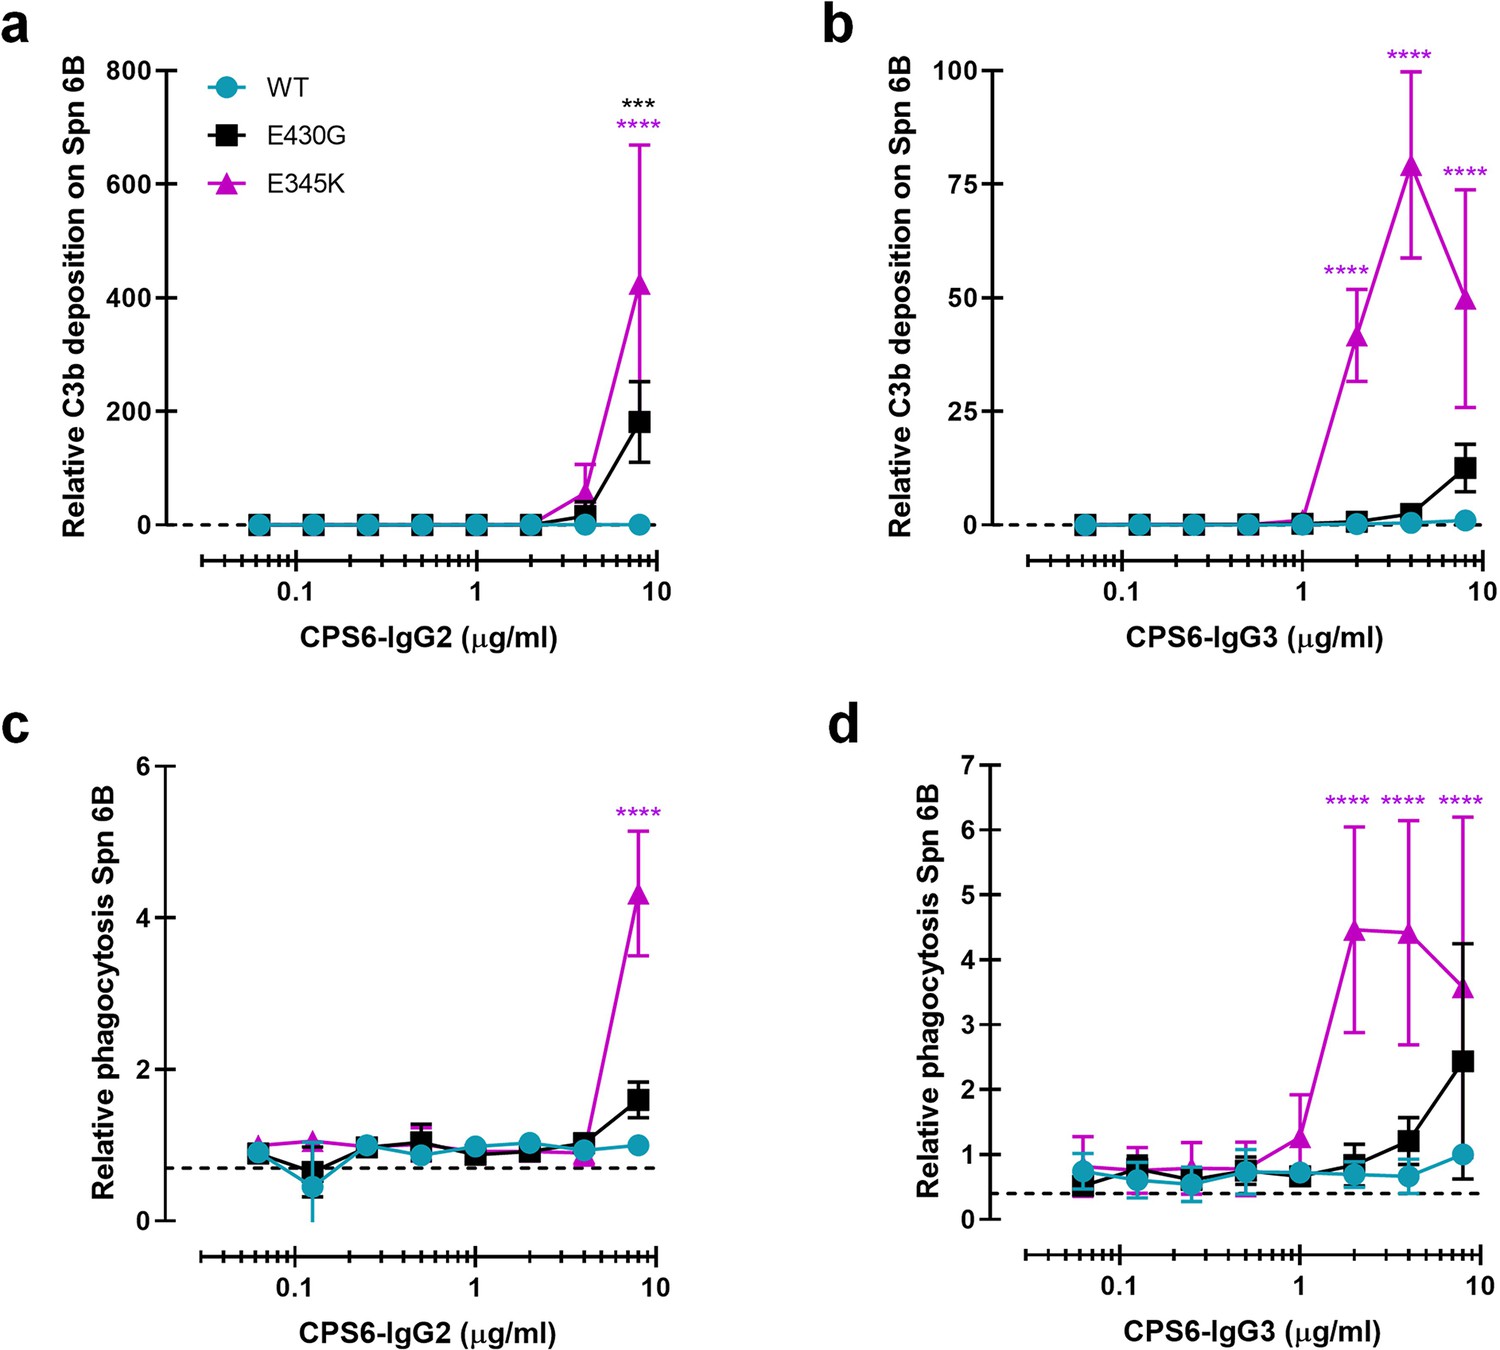
Introduction of E430G or E345K mutation in CPS6-IgG2 and CPS6-IgG3 improves complement activation and phagocytosis of S. pneumonia (Spn).
(a, b) C3b deposition on serotype 6B surface after incubation of bacteria with CPS6-IgG2 (a) or CPS6-IgG3 (b) antibody variants in the presence of 2.5% IgG/IgM-depleted serum and detected with a monoclonal murine anti-human C3d antibody by flow cytometry. (c, d) Fluorescent serotype 6B bacterial phagocytosis by human neutrophils detected by flow cytometry after incubation in the presence of CPS6-IgG2 (c) or CPS6-IgG3 (d) hexamerization-enhanced variants, E430G and E345K, plus 2.5% IgG/IgM-depleted serum. All data are presented as mean fluorescence relative to the highest CPS-IgG-WT concentration tested (8 µg/ml). Dashed line represents background (no IgG) level. Data represent mean ± SD of at least two independent experiments. Two-way ANOVA was used to compare across dose–response curves at the various concentrations the differences between the WT and the E430G or E345K variants. When significant, it is displayed as *p<0.05; ***p<0.001; ****p<0.0001.
Figure 3—figure supplement 1
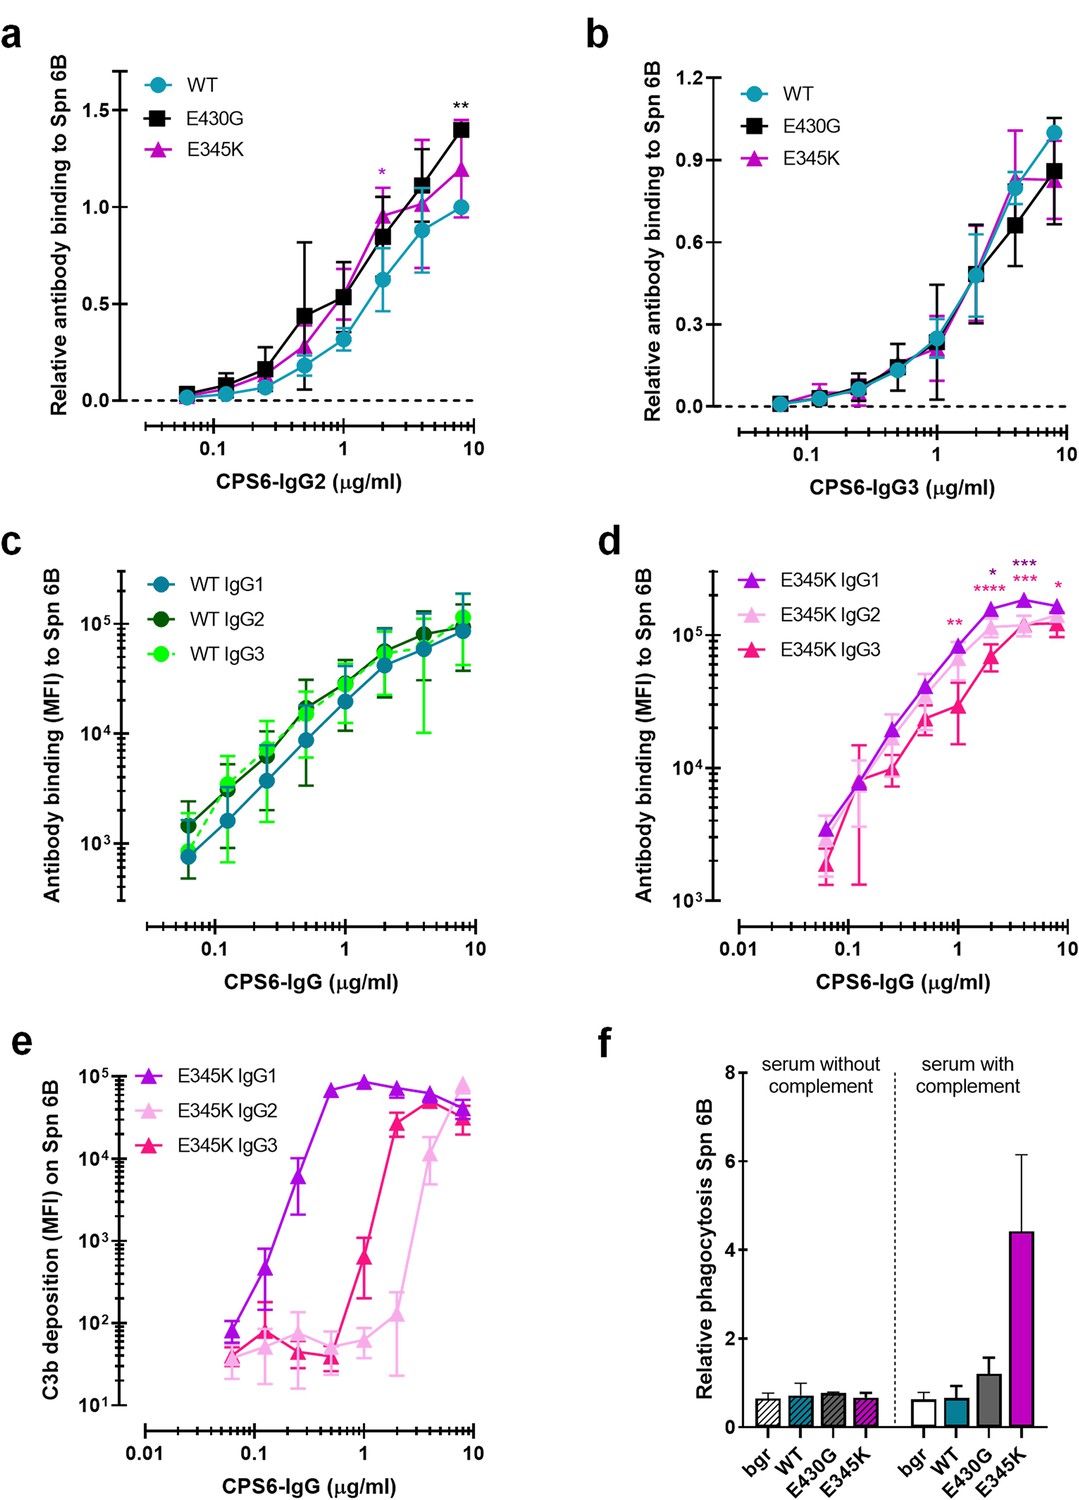
Comparison of IgG2 and IgG3 anti-CPS6 antibodies.
(a, b) Binding of CPS6-WT, E430G and E345K mutants as IgG2 (a) or IgG3 (b) variants to S. pneumoniae serotype 6B. Data are expressed relative to the 8 µg WT value and presented as means ± SD of three independent experiments. Dashed line represents background (no IgG) level. (c, d) Comparison of IgG1, IgG2, and IgG3 WT (c) and their E345K variants (d) binding to S. pneumoniae serotype 6B, expressed as mean ± SD of geometric mean fluorescence intensities (MFI) from three independent experiments. (e) Comparison of the complement C3b deposition of the IgG1, IgG2, and IgG3 E345K variants onto serotype 6B pneumococci. Data are mean ± SD of geometric MFI from three independent experiments. (f) Phagocytosis of S. pneumoniae serotype 6B by CPS6-IgG3-E345K in 2.5% IgG/IgM-depleted serum without (HI) or with an active complement system presented relative to the MFI of IgG3-WT at 8 µg/ml. Bar graphs represent the relative phagocytosis values at 4 µg/ml of IgG3 WT, E430G, and E345K mutant in 2.5% IgG/IgM-depleted serum without (striped bars) or with an active complement system (non-striped bars). Gray bars (Buffer) represent bacteria uptake by human neutrophils when antibodies were omitted. Data are mean ± SD of three independent experiments. Two-way ANOVA was used to compare across dose–response curves at the various concentrations the differences between the WT and the E430G or E345K variants. When significant, it is displayed as *p<0.05; ***p<0.001; ****p<0.0001.
Figure 4 with 1 supplement
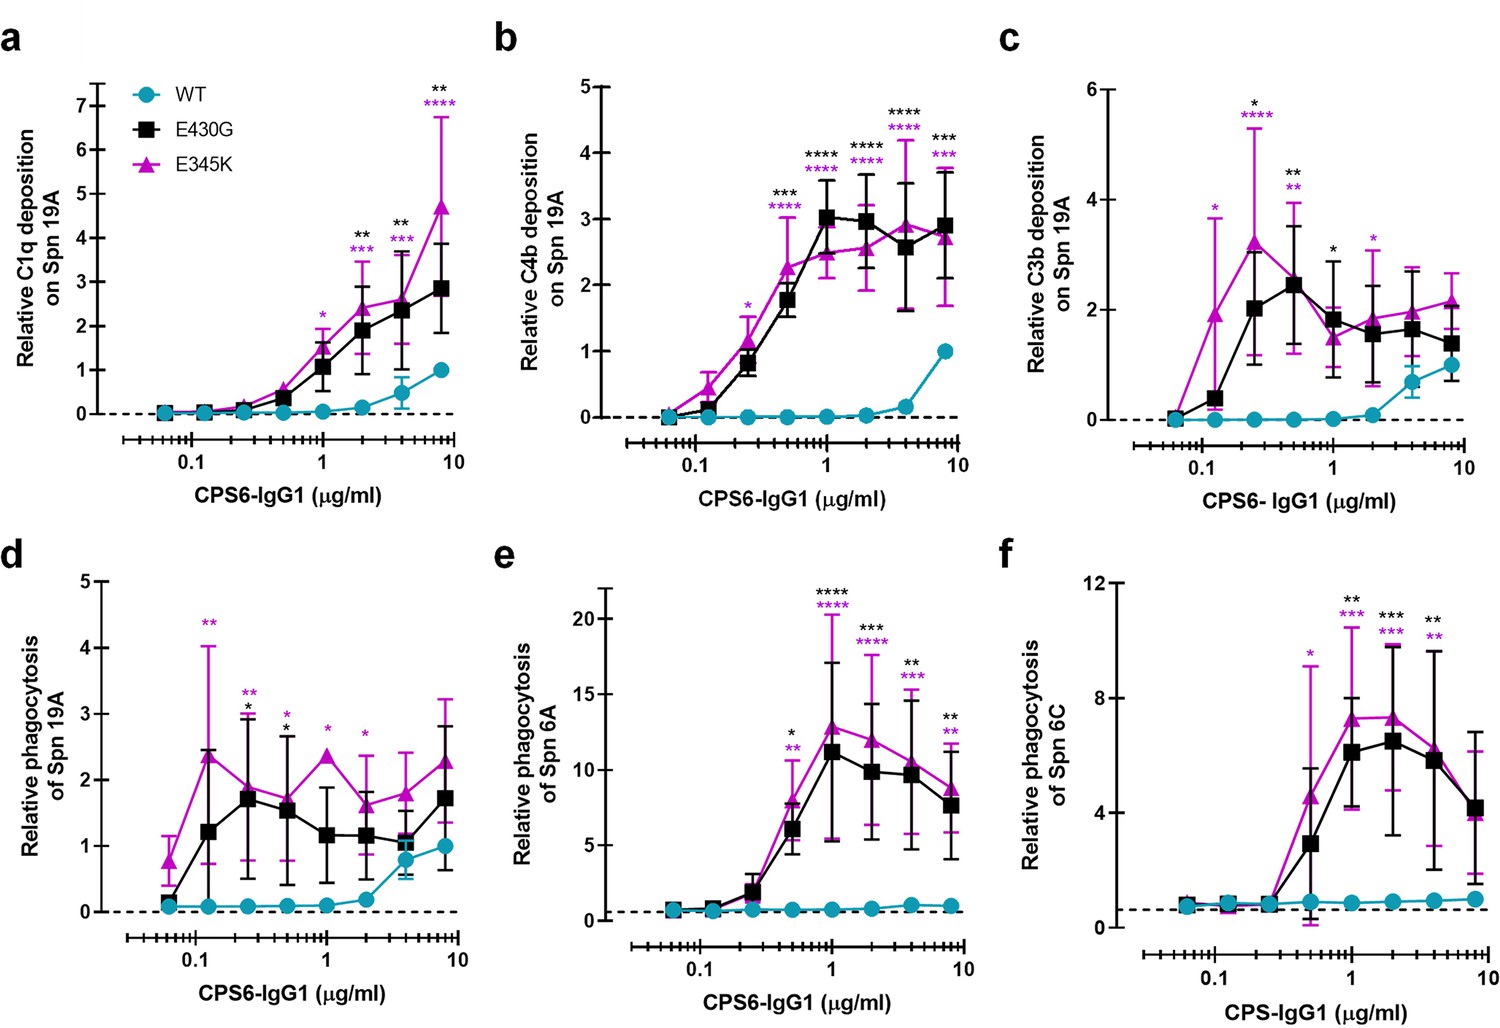
Enhanced Fc-Fc interactions strongly improves complement mediated phagocytosis of CPS6-IgG1-targeted S. pneumoniae serotypes.
(a–c) Complement deposition on S. pneumoniae serotype 19A (Spn 19A) detected by flow cytometry after incubation with 2.5% IgG/IgM-depleted serum supplemented with CPS6-IgG1 (WT versus E430G and E345K variants). Detection of complement C1q (a), C4b (b), and C3b (c) deposition was done using a monoclonal anti-human C1q, C4d, or C3d antibody, respectively. (d–f) Phagocytosis of fluorescently labeled S. pneumoniae serotype 19A (d), serotype 6A (e), and serotype 6C (f) by human neutrophils in the presence of 2.5% IgG/IgM-depleted serum supplemented with CPS6-IgG1-WT versus E340G and E345K variants. Bacterial uptake was quantified by flow cytometry as the mean fluorescence of the neutrophils. All data represent relative mean ± SD of three independent experiments and displayed by the relative fluorescence index compared to CPS6-IgG1-WT at 8 µg/ml. Dashed line represents background (no IgG) level. Two-way ANOVA was used to compare across dose–response curves at the various concentrations the differences between the WT and the E430G or E345K variants. When significant, it is displayed as *p<0.05; ***p<0.001; ****p<0.0001.
Figure 4—figure supplement 1
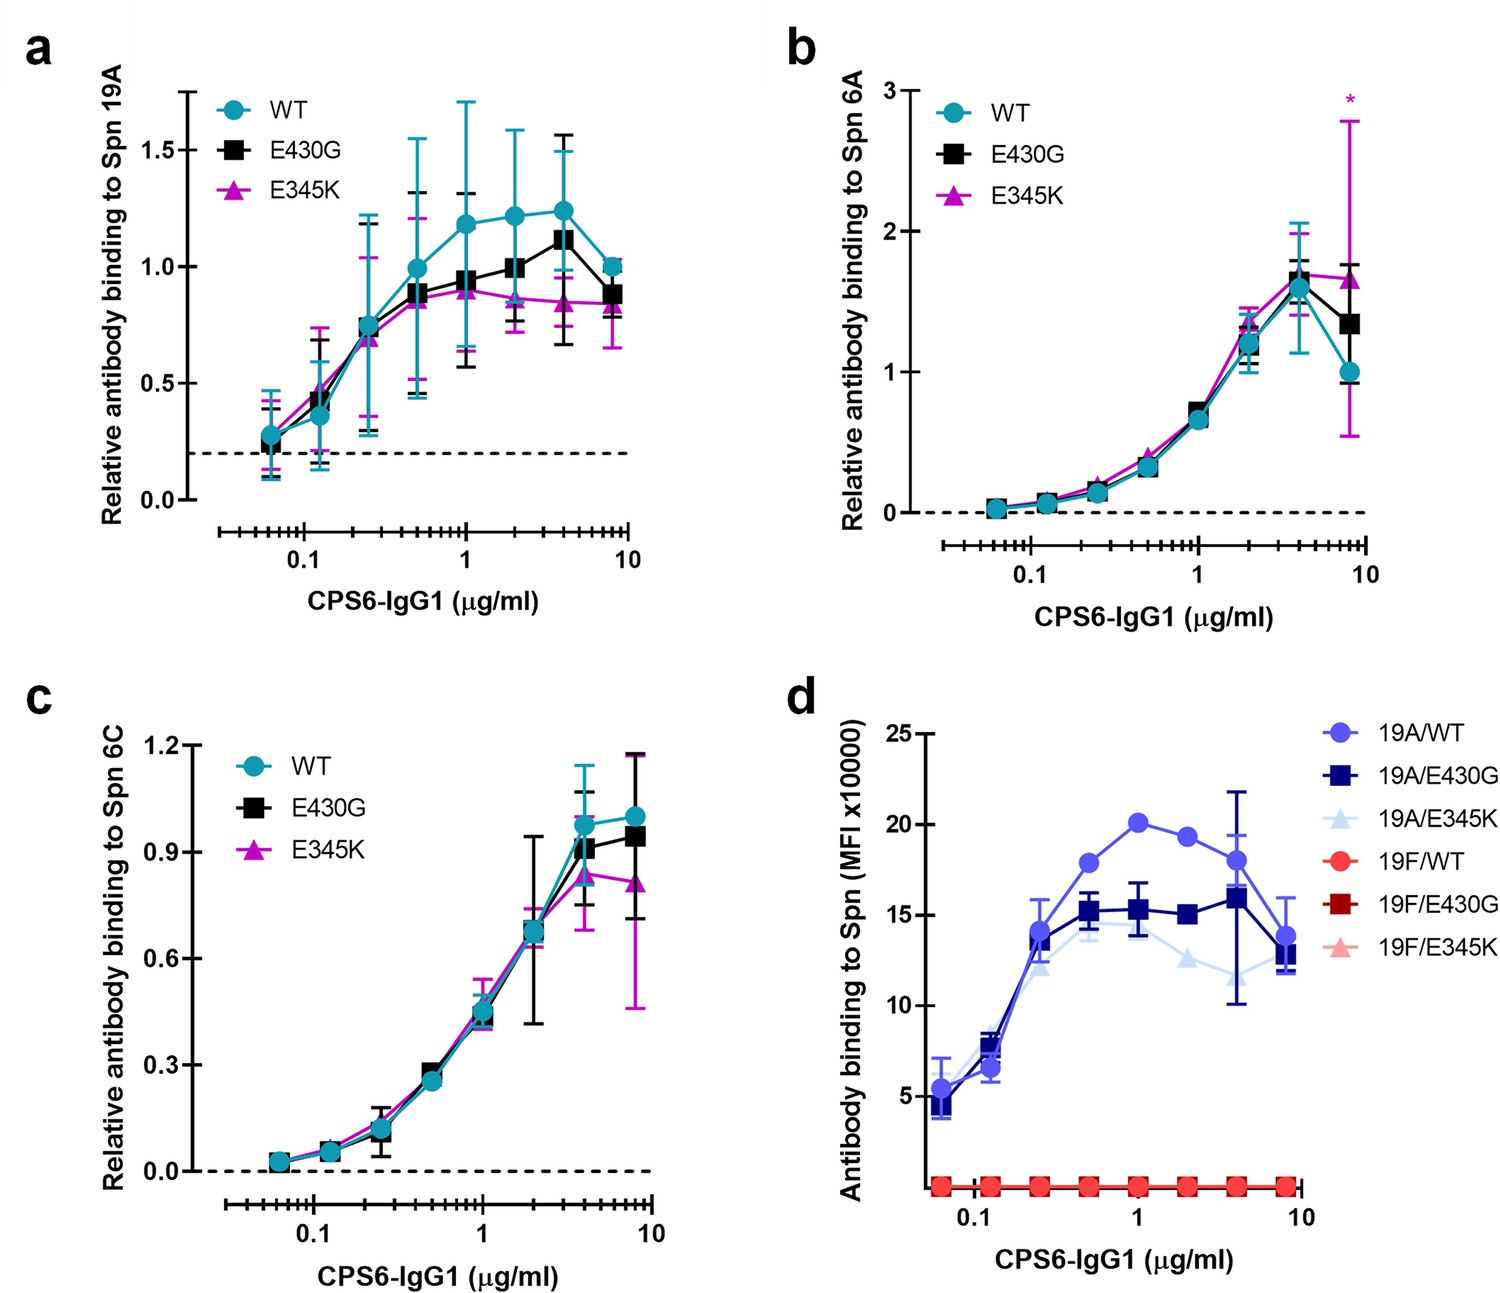
Comparative binding of CPS6-IgG1 monoclonal antibody variants to S.pneumoniae serogroup 6 and 19.
(a–d) Binding of CPS6-IgG1-WT or hexamer-enhancing mutations, E430G and E345K, to S. pneumoniae (Spn) serotype 19A (a), 6A (b), 6C (c) but not to serotype 19F (d). (a–c) Data represent relative fluorescence mean index ± SD of three independent experiments compared to the highest CPS-IgG1-WT concentration tested (8 µg/ml). Two-way ANOVA was used to compare across dose–response curves at the various concentrations the differences between the WT and the E430G or E345K variants. When significant, it is displayed as *p<0.05; ***p<0.001; ****p<0.0001. (d) Data are expressed as mean ± SD of mean geometric fluorescence intensities (MFI) of two independent experiments. Dashed line represents background (no IgG) level. Two-way ANOVA was used to compare across dose–response curves at the various concentrations the differences between the WT and the E430G or E345K variants. When significant, it is displayed as *p<0.05; ***p<0.001; ****p<0.0001.
Figure 5 with 2 supplements
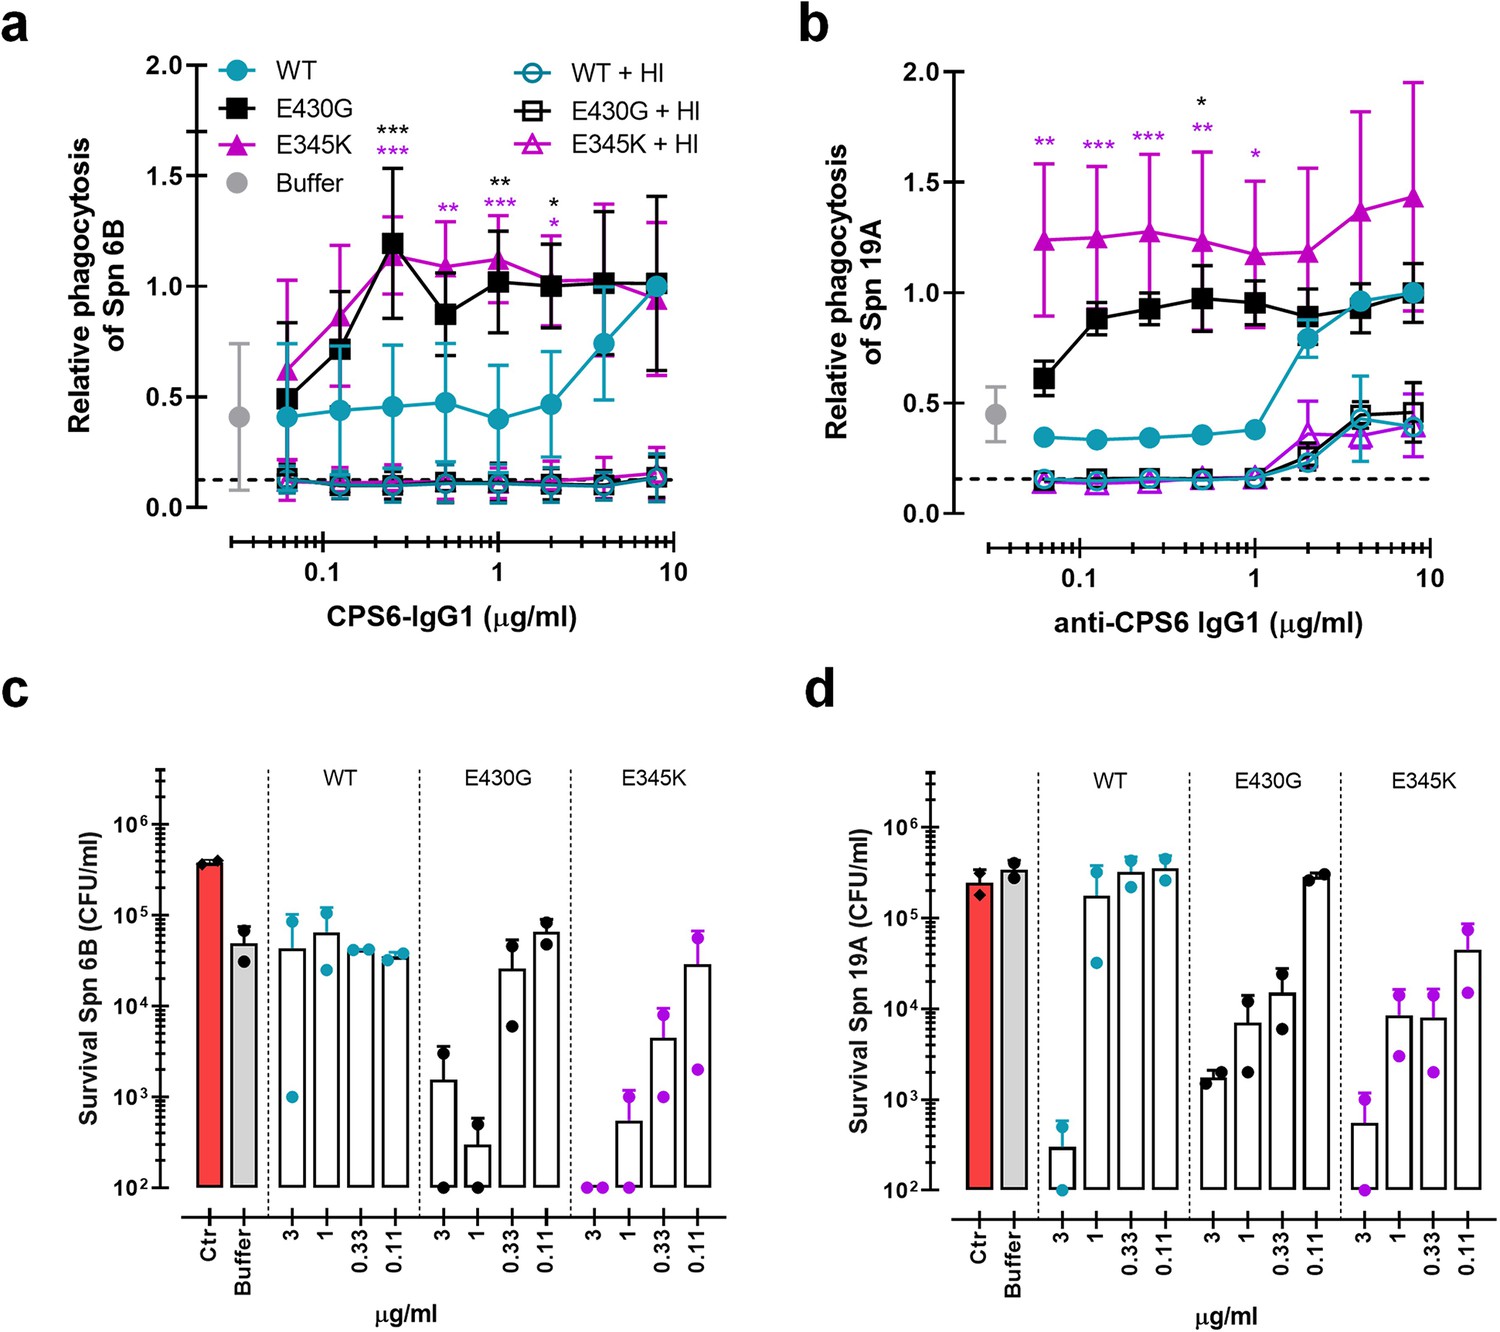
Monoclonal antibodies against S. pneumoniae capsule polysaccharide 6 can be modified for enhanced phagocytosis and opsonophagocytic killing by human neutrophils.
(a, b) Phagocytosis by human neutrophils of fluorescently labeled S. pneumoniae (Spn) serotype 6B (a) or serotype 19A (b) in the presence of 5% normal human serum (NHS) as complement source supplemented with CPS6-IgG1-wild-type (WT) versus E430G and E345K hexamerization-enhanced variants. Same conditions for phagocytosis but in the presence of 5% NHS without complement activity (heat inactivated [HI]) is represented by empty colored boxes. Bacterial uptake was quantified by flow cytometry as the fluorescence of the neutrophils. Data represent relative fluorescence mean index ± SD of three independent experiments compared to the highest CPS-IgG1-WT concentration tested (8 µg/ml). Dashed line represents background (no IgG) level, and Buffer refers to the same condition with HPS (no IgG present). Two-way ANOVA was used to compare across dose–response curves at the various concentrations the differences between the WT and the E430G or E345K variants. When significant, it is displayed as *p<0.05; ***p<0.001; ****p<0.0001.(c, d) Opsonophagocytic killing of S. pneumoniae serotype 6B (c) or serotype 19A (d) in the presence of 5% NHS and CPS6-IgG1-WT versus CPS6-IgG1-E430G or CPS6-IgG1-E345K mutant. Bacterial survival was determined after 45 min incubation with human neutrophils by counting colony formation units (CFU) on blood agar plates. Red bars (Ctr) represent initial bacterial inoculum, whereas gray bars (Buffer) represent bacterial killing when antibodies were omitted. Data represent the mean ± SD of two independent experiments with duplicate counting (representing four experimental points).
Figure 5—figure supplement 1
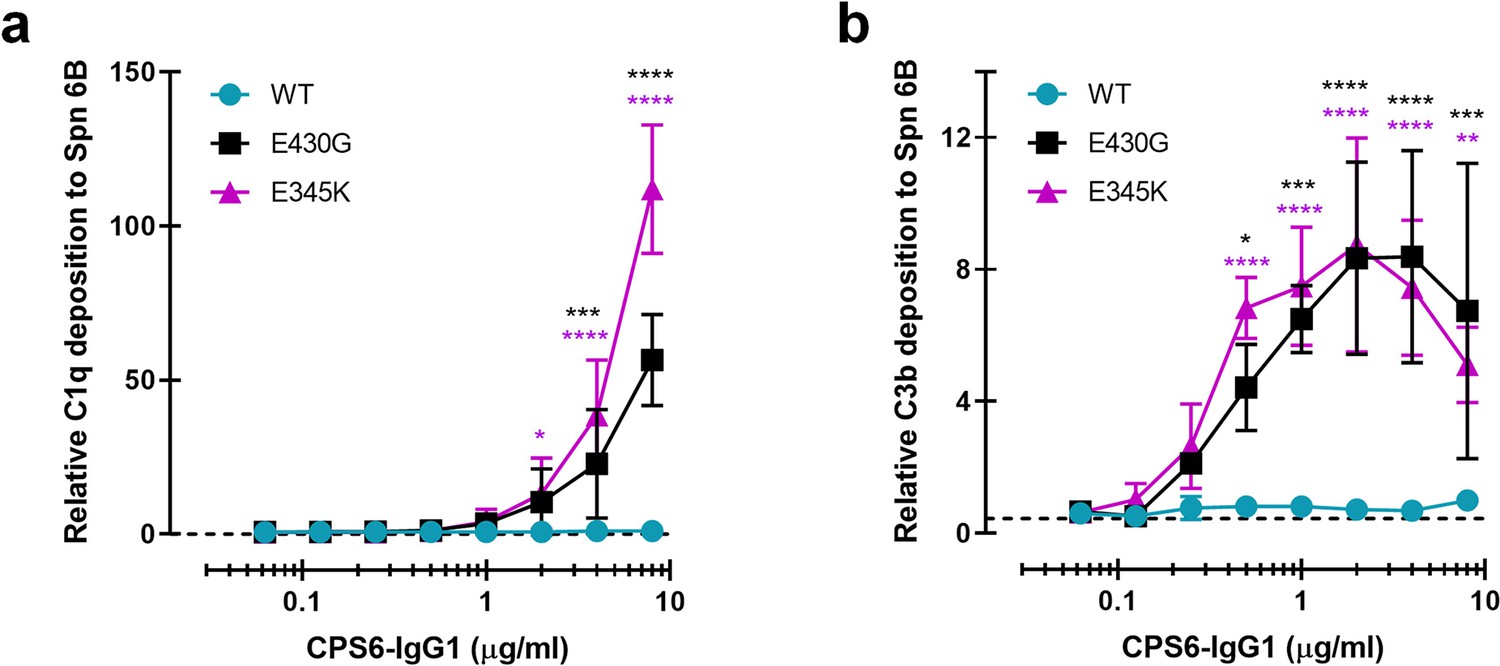
CPS6-IgG1-E430G and E345K hexamerization-enhancing antibody variants potenciate complement deposition on S. pneumoniae (Spn) 6B in the presence of human normal sera.
(a) C1q binding and (b) C3b deposition onto serotype 6B surface after incubation of bacteria with CPS6-IgG1 antibody variants, in the presence of 5% human normal sera and detected with a monoclonal murine anti-human C1q and C3d antibody, respectively, by flow cytometry. Data represent mean ± SD of three (a) or two (b) independent experiments and are expressed relative to the highest CPS6-IgG1-WT concentration tested (8 μg/ml). Dashed line represents background (no IgG) level. Two-way ANOVA was used to compare across dose–response curves at the various concentrations the differences between the WT and the E430G or E345K variants. When significant, it is displayed as *p<0.05; ***p<0.001; ****p<0.0001.
Figure 5—figure supplement 2
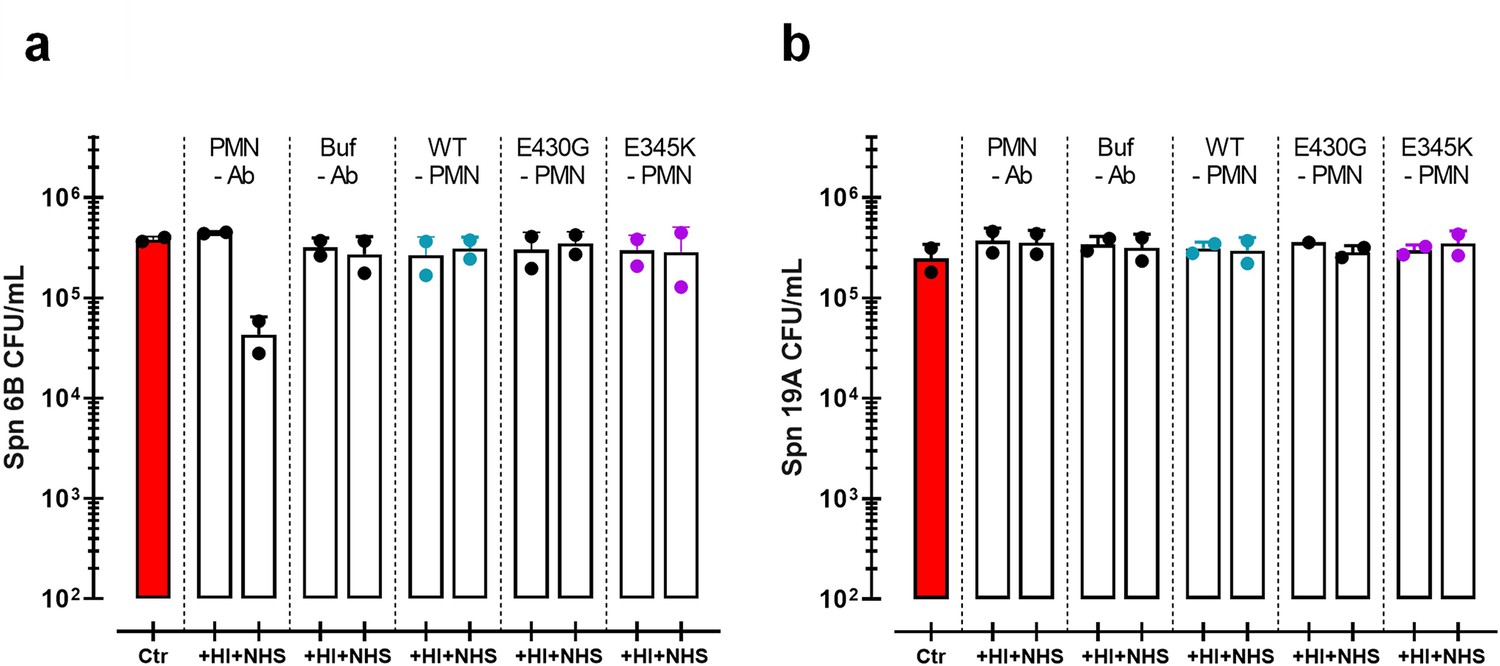
Opsonophagocytic killing of S. pneumoniae in human normal sera.
(a, b) Controls used for opsonophagocytic killing of S. pneumoniae (Spn) serotype 6B (a) or 19A (b) in the presence of 5% heat inactivated (+HI) or normal human sera (+NHS). Controls in the absence (-Ab) of mAb contain only neutrophils (PMN) or only buffer (Buf). Controls of only CPS6-IgG1-WT versus CPS6-IgG1-E430G or CPS6-IgG1-E345K mutant are without neutrophils (-PMN). Bacterial killing was determined after 45 min incubation with human neutrophils by colony formation unit (CFU) counting in blood agar plates. Red bars represent initial bacterial inoculum for the experiment. Data represent the mean ± SD of two independent experiments with duplicate counting (representing four experimental points).
Figure 6 with 4 supplements
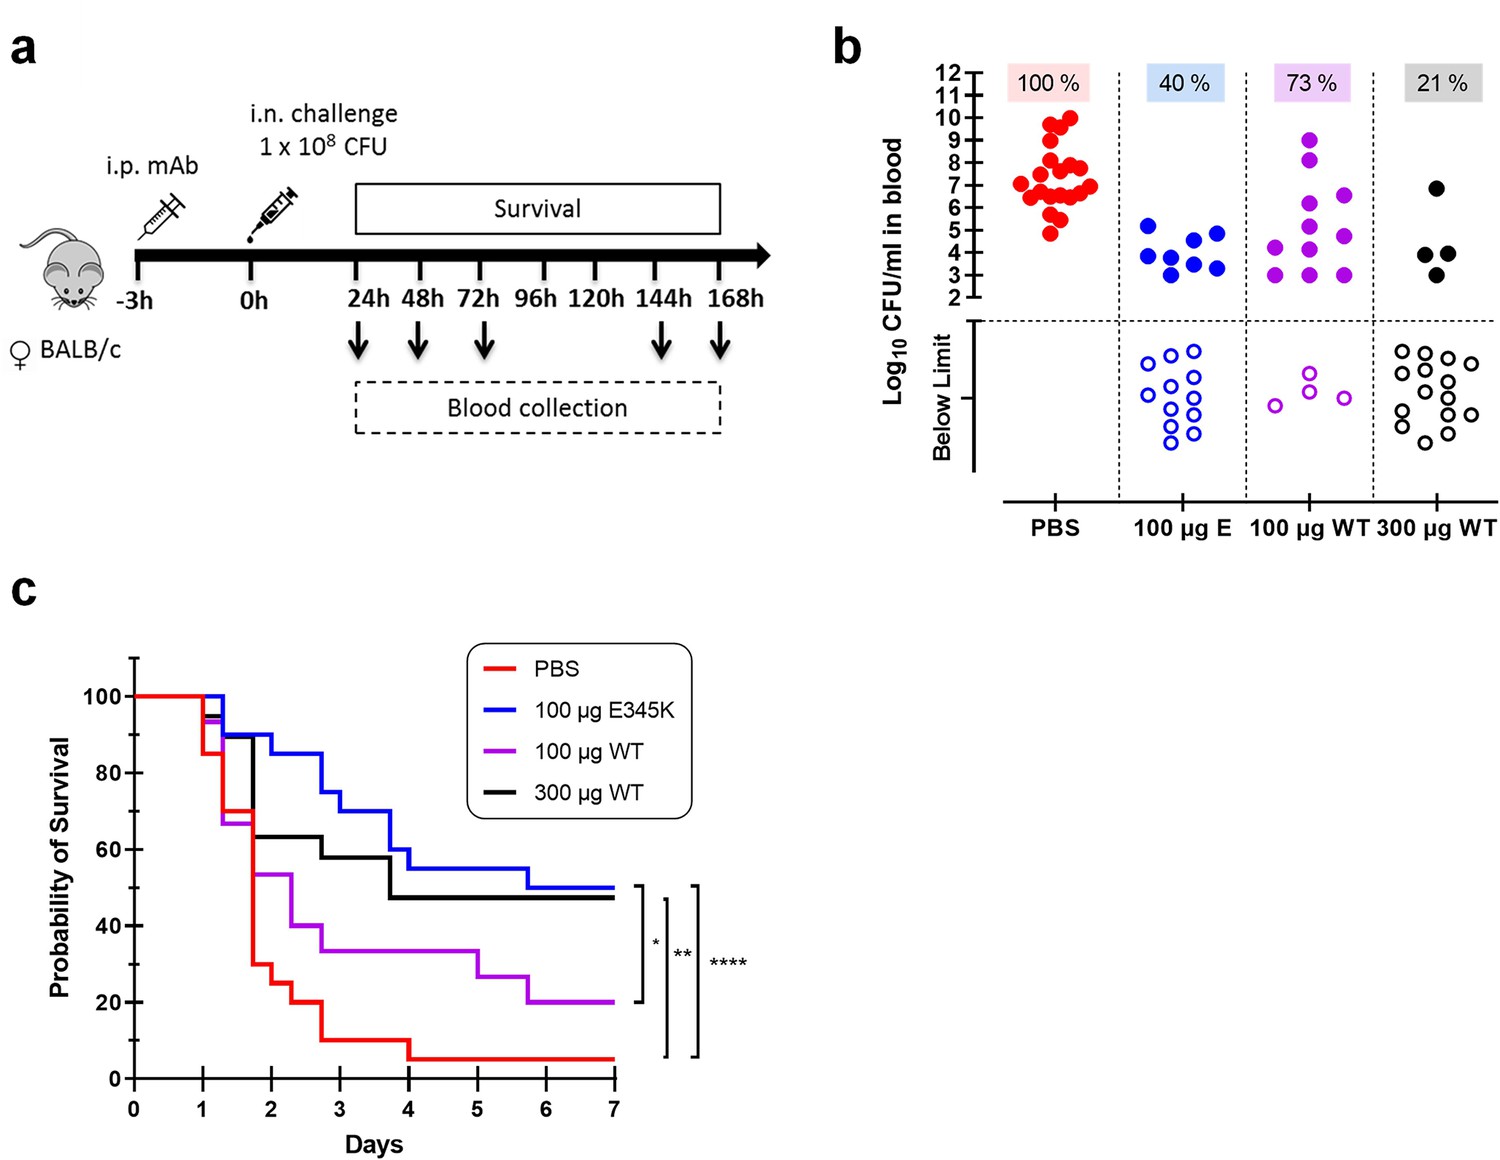
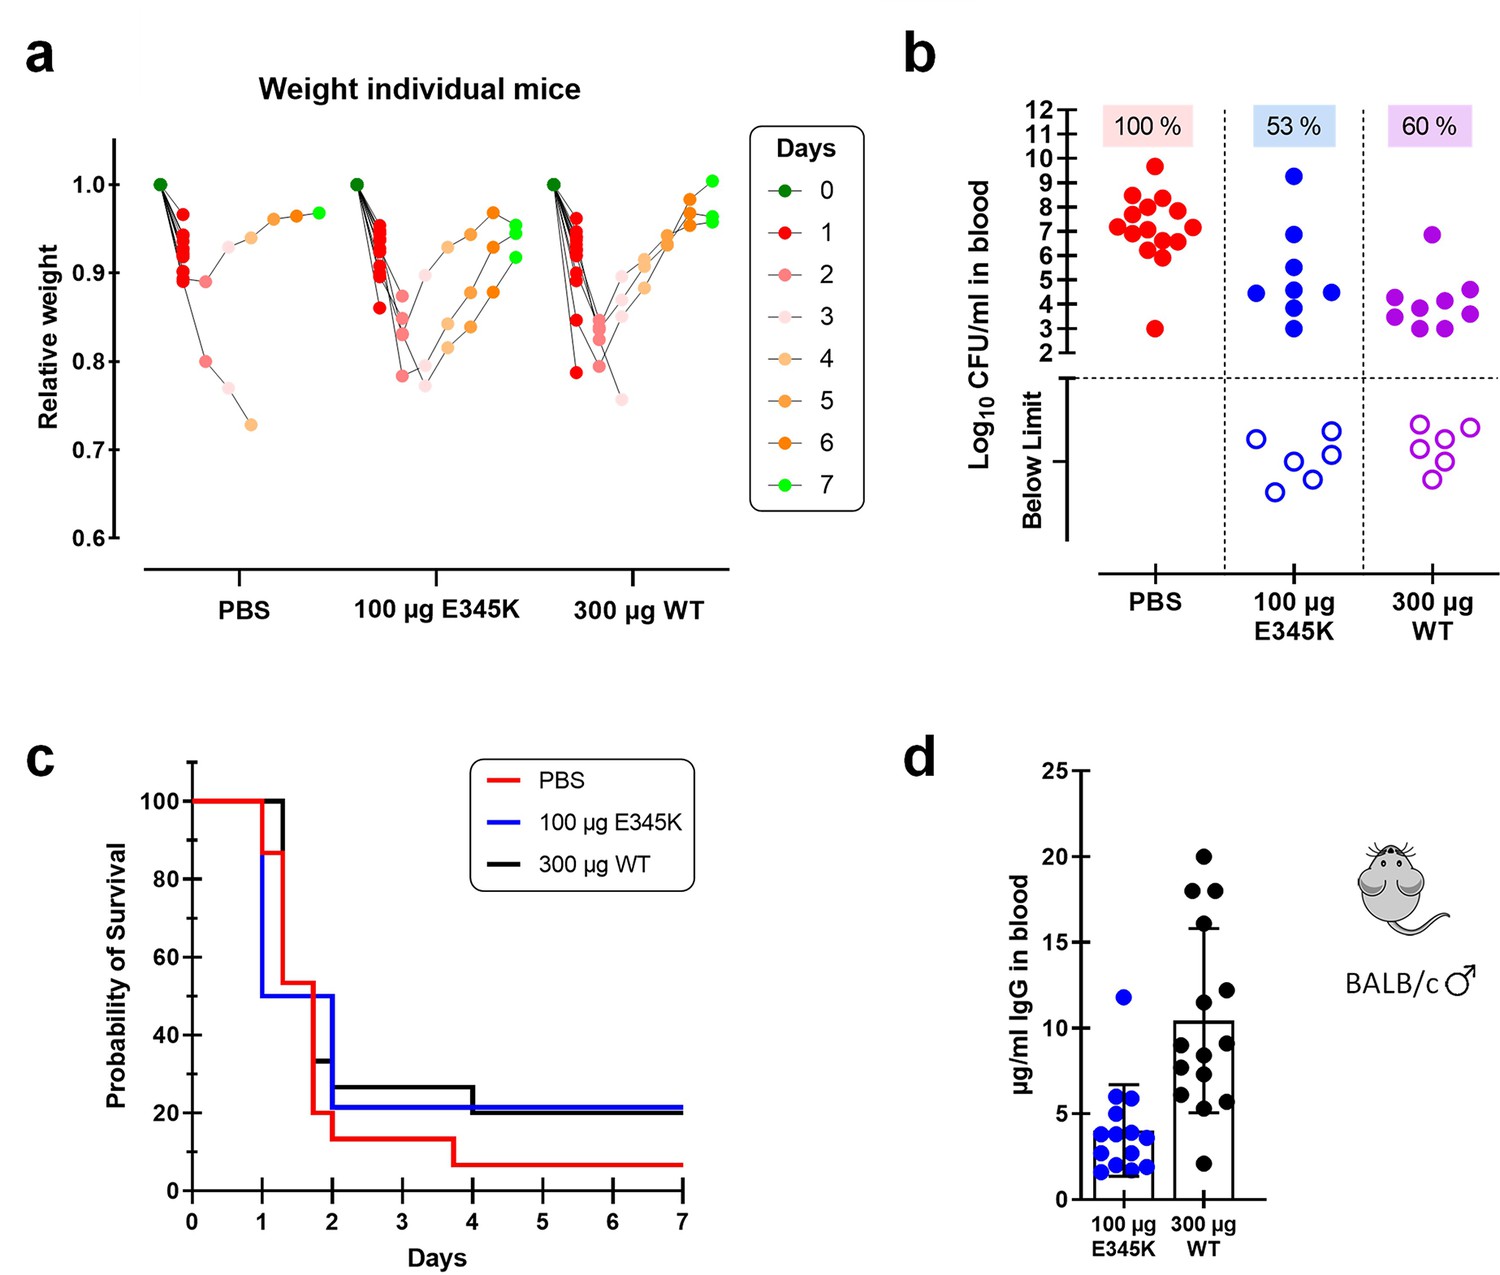
CPS6-IgG1-E345K mAb provides enhanced protection against invasive pneumococcal infection in mice.
(a) Schematic representation of the infection model. Female BALB/c mice were passively immunized via intraperitoneal injection (i.p.) with PBS, 100 µg CPS6-IgG1-E345K, or 100 or 300 µg CPS6-IgG1-WT monoclonal antibody (mAb) 3 hr before infection. Mice were challenged intranasally (i.n.) with 1 × 10⁸ CFU S. pneumoniae serotype 6A in 50 µl PBS. Every day after challenge, blood was taken from the tail vein, serially diluted, and plated on blood agar plates for bacterial colony counting (CFU). (b) Bacteremia in mice blood 24 hr after bacterial challenge representing mAb capacity to control bacterial spread from lungs to the systemic circulation (PBS 100%, 20/20; 100 µg E345K 40%, 8/20; 100 µg WT 73%, 11/15; 300 µg WT 21%, 4/15). Each symbol represents an individual mouse, closed symbols represent mice that developed bacteremia, and open symbols represent mice below the threshold of CFU detection marked by the dotted line. Mice survival was monitored in parallel for 7 days (c). The data are combined from three separate experiments with 5–8 mice for each treated group in each experiment resulting in 20 mice per group (only 15 mice for the 100 µg CPS6-IgG1-WT group). Statistical analysis was performed using log-rank (Mantel–Cox) test and is displayed when significant as *p≤0.1, **p≤0.01, or ****p≤0.0001.
Figure 6—figure supplement 1
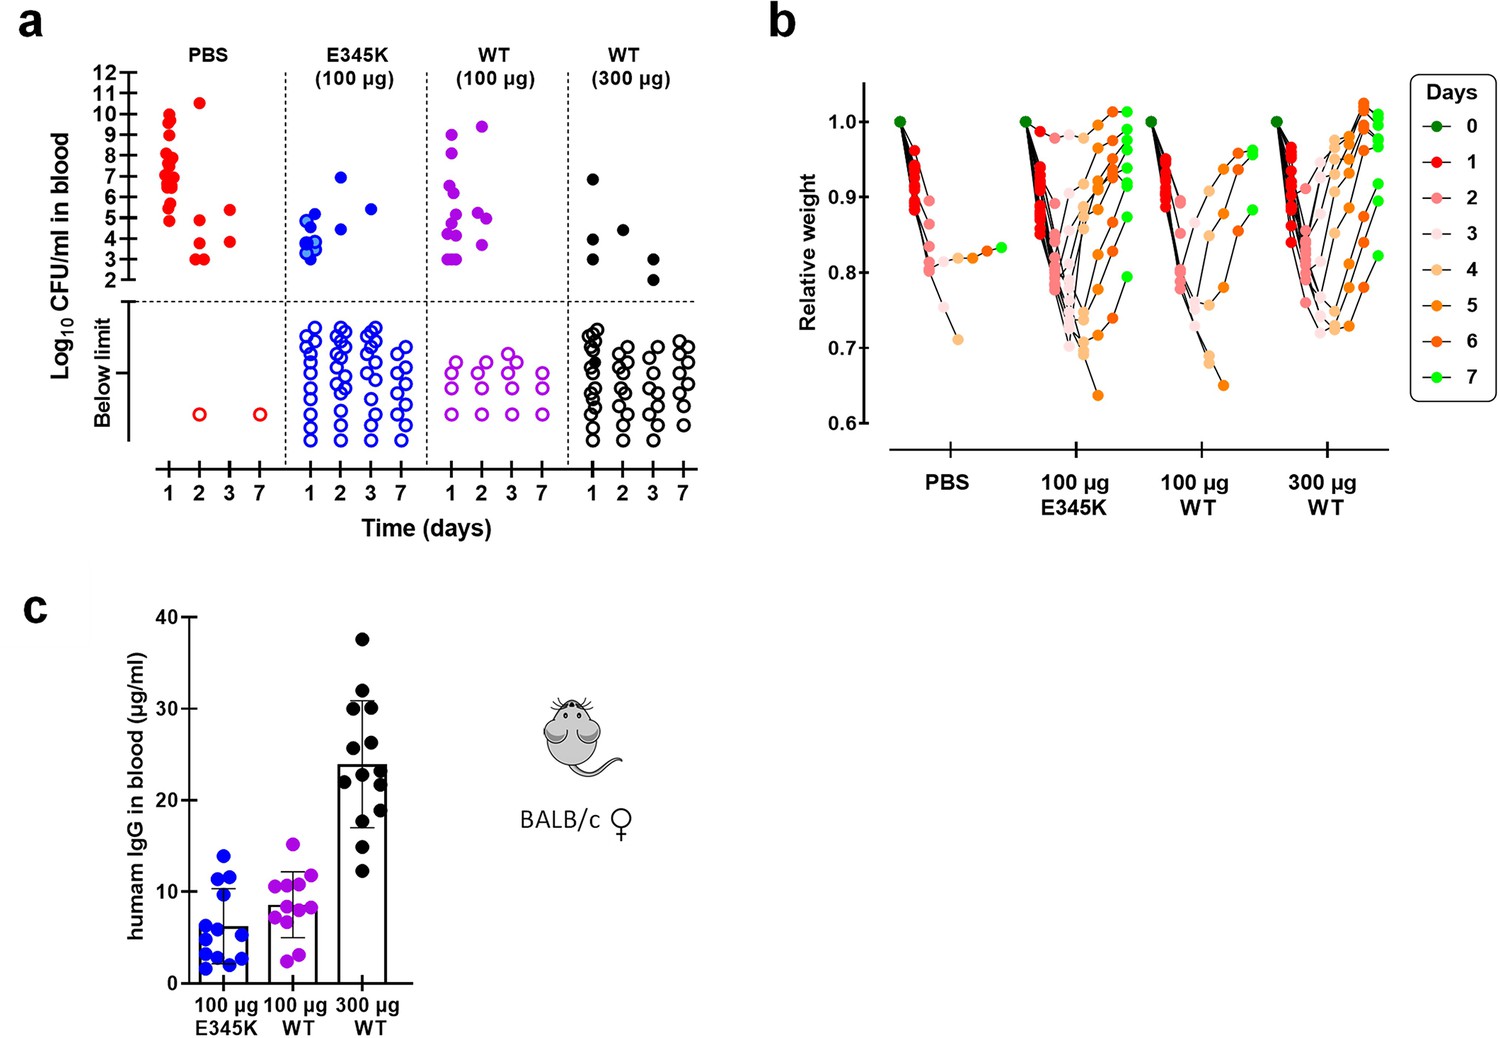
Female BALB/c mice protection model.
(a) Bacterial counts in blood collected from surviving female mice on days 1, 2, 3, and 7 after challenge with 1 × 10⁸ CFU S. pneumoniae 6A in order to compare protection capacity against bacteremia in mice passively immunized with only PBS, CPS6-IgG1 wild-type (WT), or with the E345K hexamerization-enhanced mutant. Each symbol represents an individual mouse, and the dotted line marks threshold of detection (2 log10 CFU/ml). (b). Weight of the individual mice as determined each day following the passive immunization for each treatment group. Data are expressed as relative weight values up to 7 days after bacteria challenge compared to the initial weight of each animal at the start of the experiment on day 0. (c) Human IgG detected by ELISA in mice sera 24 hr after passive immunization with 100 or 300 µg CPS6-IgG1-wild-type (WT) or CPS6-IgG1-E345K expressed as mean µg/ml ± SD. All data are pooled from three independent experiments with finally 20 mice for PBS, 100 µg CPS6-IgG1-E345K, and 300 µg CPS6-IgG1-WT groups, and 15 mice for 100 µg CPS6-IgG1-WT group.
Figure 6—figure supplement 2
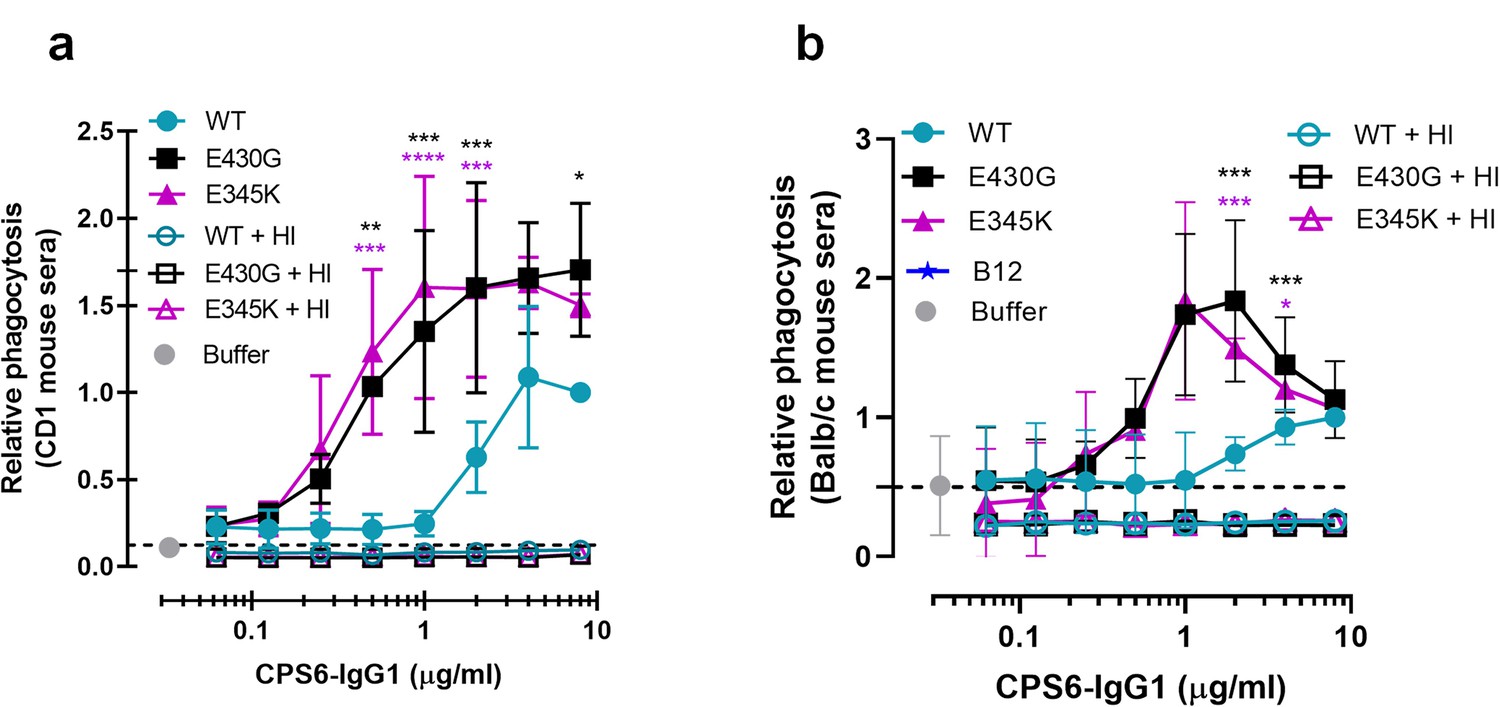
Human CPS6-IgG1 antibody variants induce complement-dependent phagocytosis of serotype 6B S. pneumoniae in the presence of mouse sera.
Fluorescently labeled bacteria uptake by human neutrophils in the presence of 2.5% CD1 mice (a) or Balb/c mice (b) serum supplemented with CPS6-IgG1-WT, E430G or E345K variants. Antibody b12 (B12), which recognizes HIV protein gp120, was included as an unrelated negative control. Same conditions for phagocytosis but in the presence of serum without complement activity (heat inactivated [HI]) is represented by empty colored boxes. Bacterial uptake was quantified by flow cytometry as the fluorescence of the neutrophils. Data represent relative fluorescence mean index ± SD of three independent experiments compared to the highest CPS-IgG1-WT concentration tested (8 µg/ml). Dashed line represents background (no IgG) level, and Buffer refers to the same condition with mouse complement (no IgG present). Two-way ANOVA was used to compare across dose–response curves at the various concentrations the differences between the WT and the E430G or E345K variants. When significant, it is displayed as *p<0.05; ***p<0.001; ****p<0.0001.
Figure 6—figure supplement 3
Protective efficacy in male mice of engineered CPS6-IgG1-E345K.
(a) Male BALB/c mice (n = 15 per group) passively immunized with PBS, 300 µg CPS6-IgG1-wild-type (WT) or 100 µg/ml CPS6-IgG1-E345K (E345K) were challenged 3 hr after with 1 × 10⁸ CFU S. pneumoniae serotype 6A and monitored for weight loss (a), bacteremia (b), and survival (c) for 7 days. (a) Data are expressed as relative weight values compared to the initial weight of each animal at the start of the experiment at day 0. (b) Dotted lines mark threshold of detection of bacteremia in mice blood 24 hr after bacteria challenge, representing mAb capacity to control bacterial spread from lungs to the systemic circulation. Each symbol represents an individual mouse, and closed dots represent mice that developed bacteremia. (c) Mice survival was monitored in parallel for 7 days. (d) Human IgG titers measured by ELISA in mice sera collected 24 hr after passive immunization with monoclonal antibody.
Figure 6—figure supplement 4
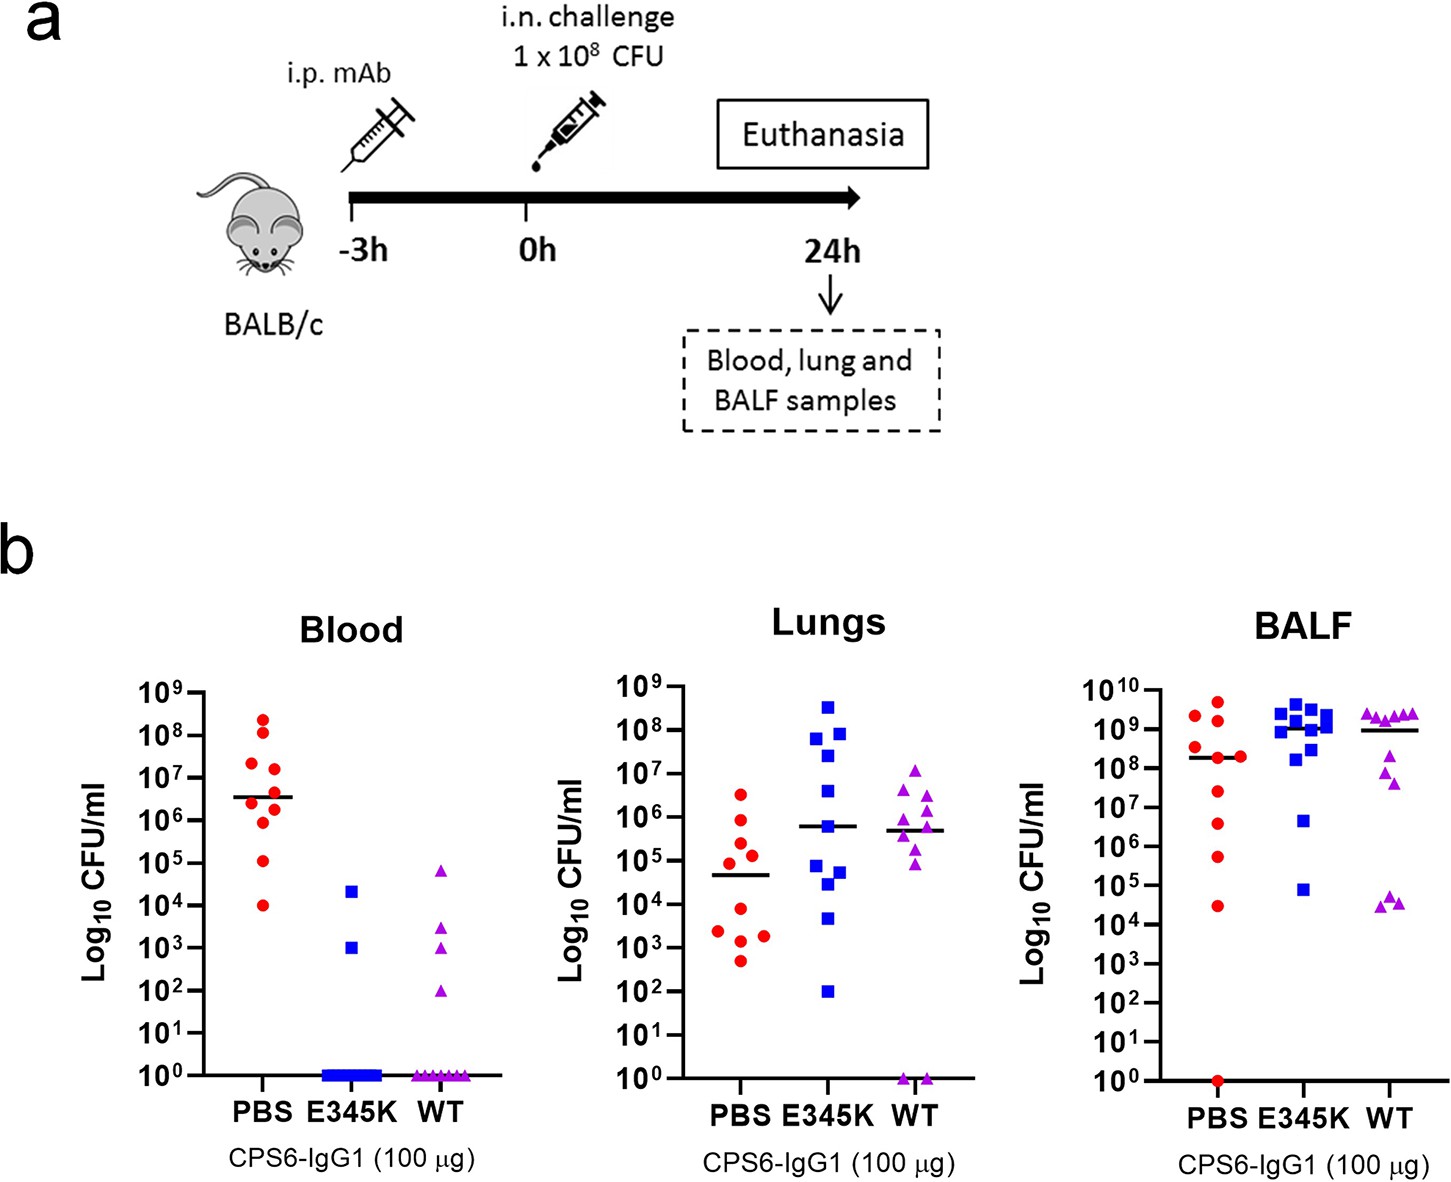
Local protection capacity of engineered CPS6-IgG1-E345K in mice.
(a) BALB/c mice (n = 12, six males and six females) passively immunized with PBS or 100 µg of CPS6-IgG1-wild-type (WT) or CPS6-IgG1-E345K (E) were challenged with 1 × 10⁸ CFU of S. pneumoniae serotype 6A. (b) Mice were euthanized after 24 hr to analyze bacteria loads in blood, lungs, and bronchioalveolar lavage fluid (BALF). Each symbol represents an individual mouse.
Figure 7 with 1 supplement
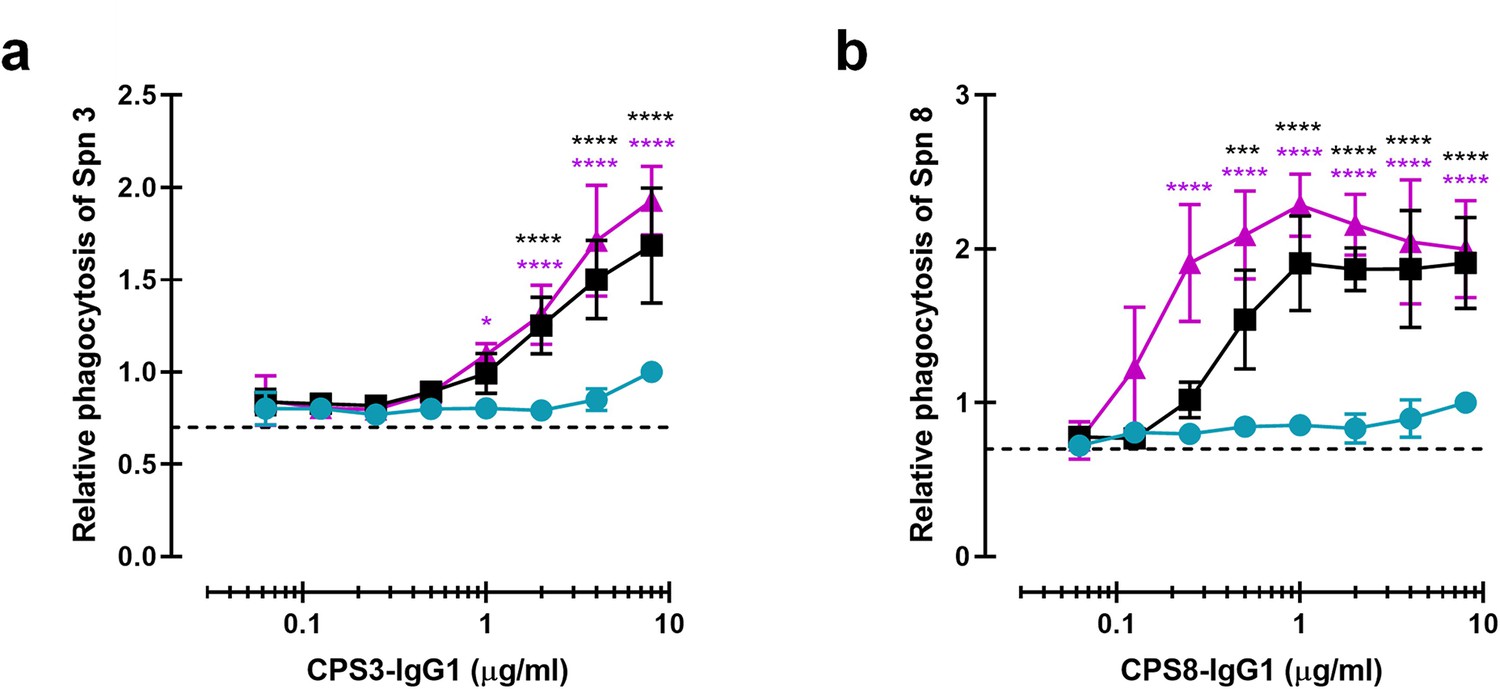
Monoclonal antibodies against CPS can be modified for enhanced complement-mediated pneumococcal phagocytosis.
(a, b) Phagocytosis by human neutrophils of fluorescence-labeled S. pneumoniae (Spn) serotype 3 (a) and serotype 8 (b) after incubation with 5% human normal sera supplemented with CPS-IgG1-WT, CPS-IgG1-E430G, or CPS-IgG1-E345K variant. All data represent relative fluorescence mean index ± SD of three independent experiments compared to the highest CPS-IgG1-WT concentration tested (8 µg/ml). Dashed line represents background (no IgG) level. Two-way ANOVA was used to compare across dose–response curves at the various concentrations the differences between the WT and the E430G or E345K variants. When significant, it is displayed as *p<0.05; ***p<0.001; ****p<0.0001.
Figure 7—figure supplement 1
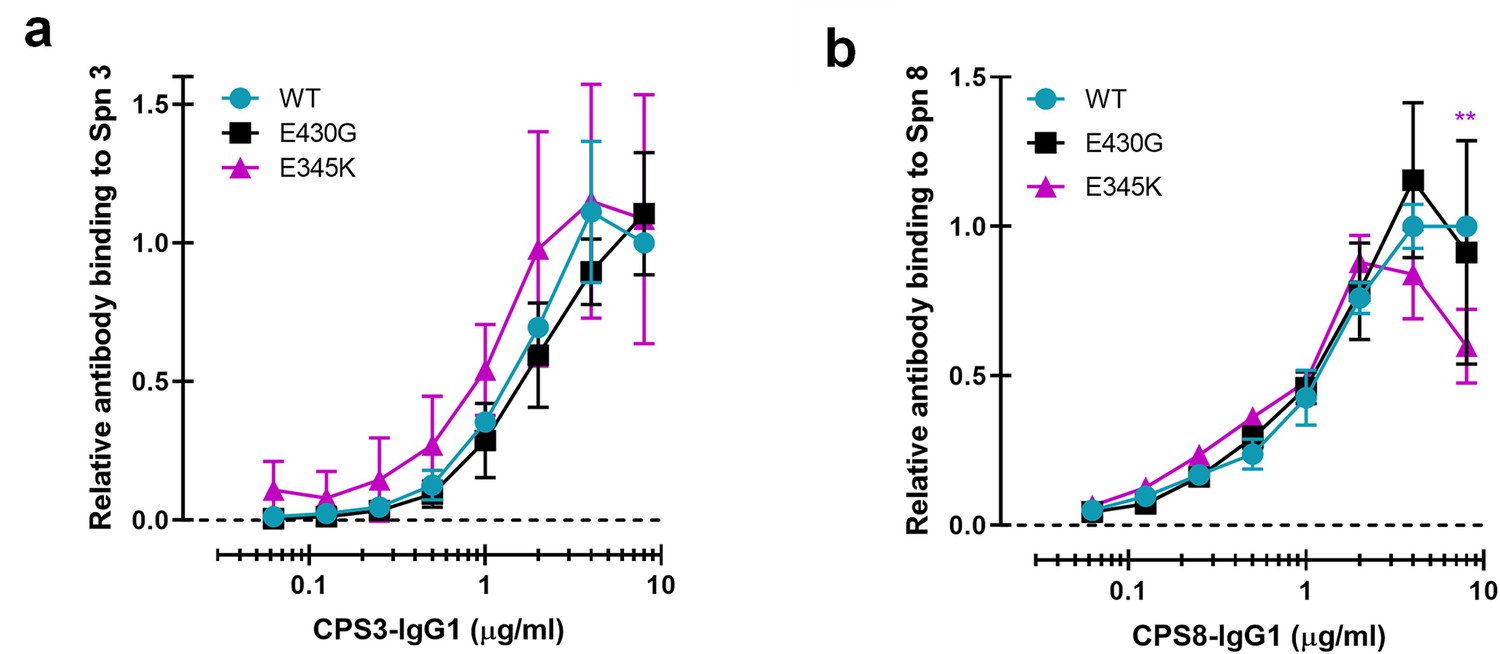
Comparative binding of CPS3 and CPS8-IgG1 antibody variants to S. pneumoniae strains.
(a, b) Equal binding of CPS3-IgG1-WT (a) or CPS8-IgG1-WT (b) antibody, and their E430G and E345K variants to S. pneumoniae (Spn) serotype 3 and 8, respectively. All data represent relative fluorescence mean index ± SD of three independent experiments compared to the highest CPS-IgG1-WT concentration tested (8 µg/ml). Dashed line represents background (no IgG) level. Two-way ANOVA was used to compare across dose–response curves at the various concentrations the differences between the WT and the E430G or E345K variants. When significant, it is displayed as *p<0.05; ***p<0.001; ****p<0.0001.
Additional files
-
Supplementary file 1
Protein sequences used for antibody production.
Variable and constant heavy and light chain protein sequences used for antibody production. The residues E345 and E430 are highlighted in light gray and dark gray, respectively. The adapted amino acids for this study are highlighted in red.
- https://cdn.elifesciences.org/articles/80669/elife-80669-supp1-v1.docx
-
MDAR checklist
- https://cdn.elifesciences.org/articles/80669/elife-80669-mdarchecklist1-v1.pdf
Download links
A two-part list of links to download the article, or parts of the article, in various formats.
Downloads (link to download the article as PDF)
Open citations (links to open the citations from this article in various online reference manager services)
Cite this article (links to download the citations from this article in formats compatible with various reference manager tools)
Promoting Fc-Fc interactions between anti-capsular antibodies provides strong immune protection against Streptococcus pneumoniae
eLife 12:e80669.
https://doi.org/10.7554/eLife.80669


