Mutant SF3B1 promotes malignancy in PDAC
- Department of Biology, Institute of Molecular Health Sciences, ETH Zurich, Switzerland
- Institute of Pharmacology and Toxicology, University of Zurich, Switzerland
- Department of Computer Science, Biomedical Informatics Group, ETH Zurich, Switzerland
- Swiss Institute of Bioinformatics, Switzerland
- Department of Biology, ETH Zurich, Switzerland
- Biomedical Informatics Research, University Hospital Zurich, Switzerland
Figures
Figure 1 with 1 supplement
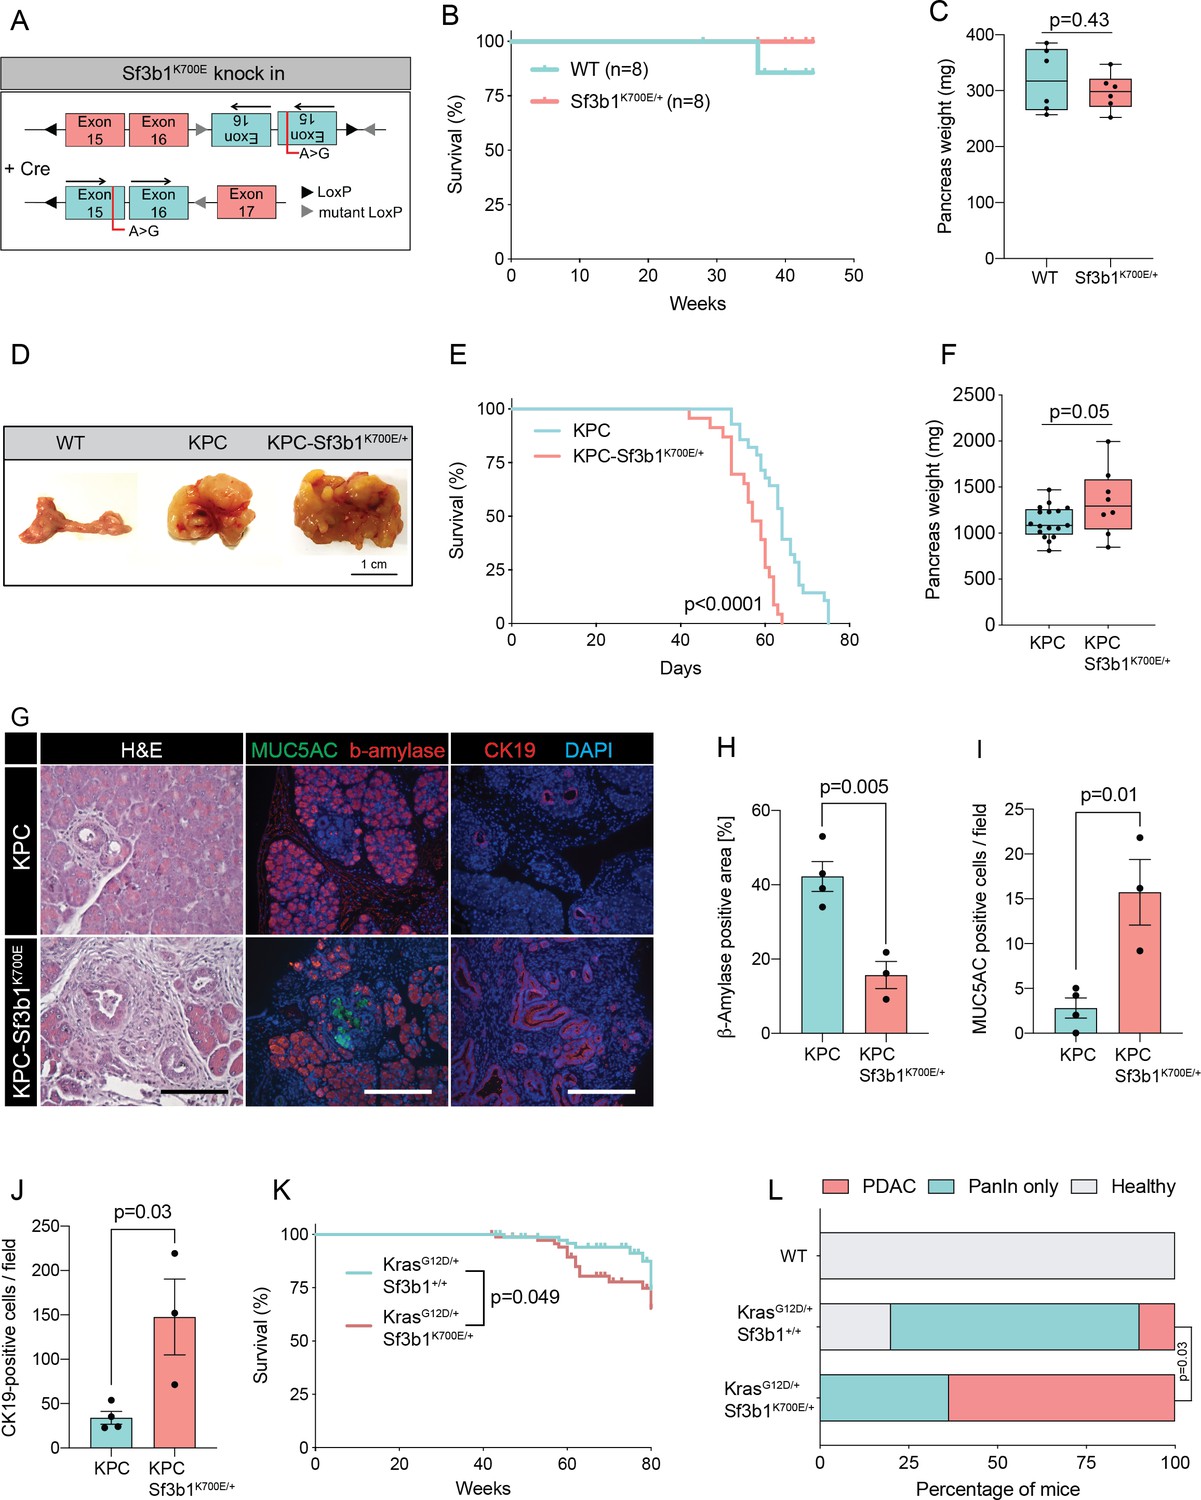
Sf3b1K700E increases aggressiveness of murine PDAC.
(A) Schematic overview of the Sf3b1K700E/+ knockin model. Arrows indicate direction of the translatable code of the gene. An A to G conversion at base position 2098, induced by Cre-recombination, results in a lysine to glutamic acid mutation at amino acid position 700 of the protein. (B) Survival of WT and Sf3b1K700E/+ mice followed over 300 days (n=8). (C) Pancreas weight of WT and Sf3b1K700E/+ mice at 300 days of age (3 males and 3 females for each genotype). Two-tailed unpaired t-test was used to compute the indicated p-value. (D) Representative photographs of WT, KPC, and KPC-Sf3b1K700E/+ pancreata of mice 9 weeks old mice. (E) Survival of KPC and KPC-Sf3b1K700E/+ mice, p-value was determined by Log-rank (Mantel-Cox) testing. (F) Pancreatic weight of KPC and KPC-Sf3b1K700E/+ mice at 9 weeks of age. Two-tailed unpaired t-test was used to compute the indicated p-value. (G) Representative micrograph images of H&E, MUC5AC, β-amylase and CK19 staining of KPC and KPC-Sf3b1K700E/+ pancreata of 5-week-old mice. Scale bar is 50 μM (H&E) or 100 μM (IF). (H) Quantification of β-amylase (H), MUC5AC (I) and CK19 (J) staining shown in (G). Per specimen, the average value of 5 random microscopy fields is displayed, a two-tailed unpaired t-test was used to compute the indicated p-value. Error bar represents standard error of the mean (SEM). (K) Survival of KrasG12D/+ and KrasG12D/+; Sf3b1K700E/+ mice. p-Value was determined by Log-rank (Mantel-Cox) testing. (L) Percentage of mice at 43 weeks of the indicated genotypes showing PanINs (blue) or PanINs and PDAC formation (red). p-Value indicates significance of the difference in PDAC formation, computed by Chi-square test.
Figure 1—figure supplement 1

Sf3b1K700E increases aggressiveness of murine PDAC.
(A) Incidence of mutations in splicing factors in PDAC patients derived from the ICGC database (PACA-AU, n=391 and PACA-CA, n=268). (B) Incidence of SF3B1 missense mutations in PDAC patients derived from PACA-AU and PACA-CA. (C) Representative Sanger-sequencing results of the Sf3b1K700E/+ mutation (T>C) of cDNA isolated from pancreata at 43 weeks of age of Ptf1a-Cre (WT) or Ptf1a-Cre; Sf3b1K700E/+ (Sf3b1K700E/+) mice. (D) Representative micrograph images of CK19 staining of WT and Sf3b1K700E/+ pancreata of 43-week-old mice. Scale bar is 100 μM. (E) Quantification of β-amylase staining. Per specimen, the average value of 5 random microscopy fields is displayed, a two-tailed unpaired t-test was used to compute the indicated p-value. (F) Representative micrograph images of CK19 staining of KPC and KPC-Sf3b1K700E/+ pancreata of 9-week-old mice. Scale bar is 100 μM. (G) Quantification of CK19 staining of KPC and KPC-Sf3b1K700E/+ pancreata of 9-week-old mice. Per specimen, the average value of 5 random microscopy fields is displayed, a two-tailed unpaired t-test was used to compute the indicated p-value. (H) Representative micrograph images of Masson Goldner staining of KPC and KPC-Sf3b1K700E/+ pancreata of 9-week-old mice. Scale bar is 100 μM. (I) Quantification of collagen positive area (Masson Goldner staining) of KPC and KPC-Sf3b1K700E/+ pancreata of 9-week-old mice. Per specimen, the average value of 5 random microscopy fields is displayed, a two-tailed unpaired t-test was used to compute the indicated p-value. (J) Representative micrograph images of H&E staining of KPC and KPC-Sf3b1K700E/+ pancreata of 5-week-old mice. Scale bar is 50 μM. (K) Quantification of ADM structures of KPC and KPC-Sf3b1K700E/+ pancreata of 5-week-old mice. Per specimen, the average value of 5 microscopy fields of areas without or with minimal PanIN formation is displayed, a two-tailed unpaired t-test was used to compute the indicated p-value. Error bar represents SEM. (L) Affected area (including PanINs and PDAC) of WT, KrasG12D/+ and KrasG12D/+; Sf3b1K700E/+ pancreata at 43 weeks of age. Mann-Whitney test was used to compute the indicated p-value. (M–N) Photographs (M) and weight (N) of pancreata 2 weeks after orthotopic transplantation of KPC and KPC-Sf3b1K700E/+ cells. Scale bar is 1 cm.
Figure 2 with 1 supplement
Sf3b1K700E induces downregulation of EMT.
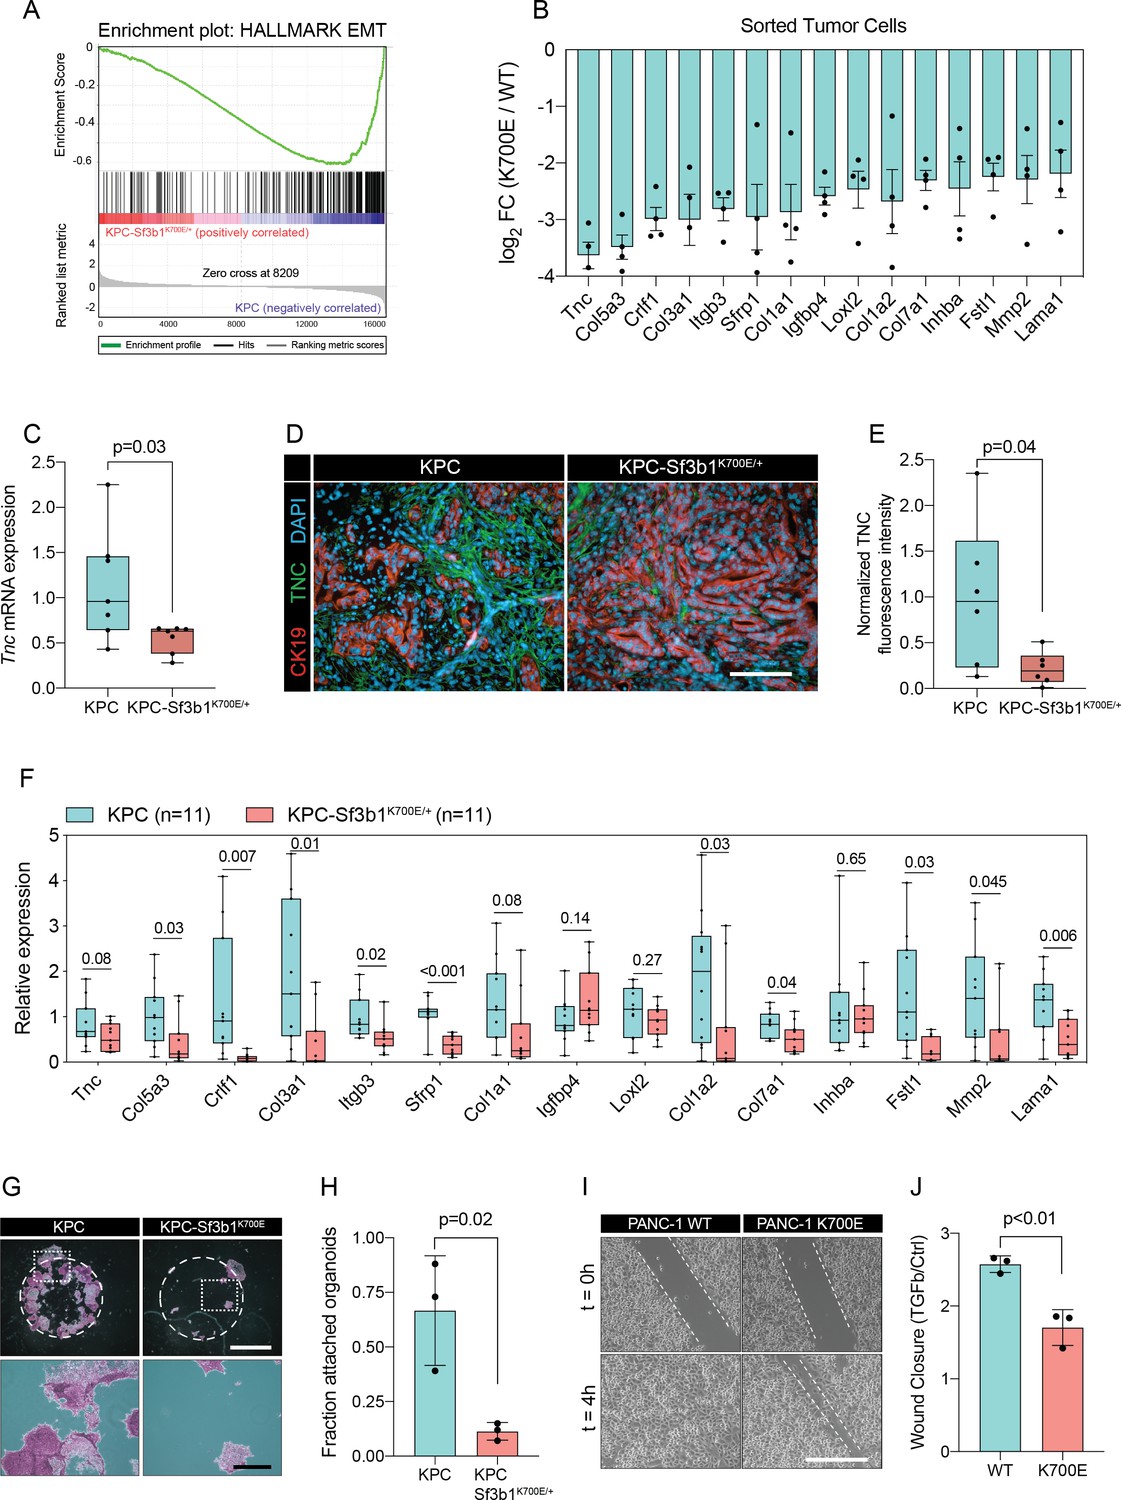
(A) Gene-set enrichment analysis (GSEA) enrichment plot of epithelial-mesenchymal transition (EMT), representing the most deregulated pathway of the GSEA-Hallmark pathways when comparing KPC (n=3) and KPC-Sf3b1K700E/+ (n=4) sorted tumor cells. (B) Top 15 of downregulated genes of the GSEA-EMT gene list in sorted KPC-Sf3b1K700E/+ cells (FDR < 0.05, logCPM >1). (C) Tnc expression in KPC (n=7) and KPC-Sf3b1K700E/+ (n=7) tumors, assessed by RT-qPCR. Error bar represent SEM. Two-tailed unpaired t-test was used to compute the indicated p-value. (D) Representative Immunofluorescence staining of CK19 (red) and TNC (green) in murine PDAC samples, counterstained with DAPI (blue). Scale bar is 50 μm. (E) Quantification of TNC staining in KPC (n=6) and KPC-Sf3b1K700E/+ (n=6) tumors. The averaged area of TNC staining in three randomly chosen fields per tumor specimen was compared by a two-tailed unpaired t-test. (F) The expression of the EMT genes displayed in (B) was assessed by RT-qPCR in tumor cells (KPC, n=11 and KPC-Sf3b1K700E/+ n=11) after one passage of ex-vivo culture. For analysis, Ct-values of the indicated genes were normalized to Actb and a two-tailed unpaired t-test was used to compute the indicated p-values. (G) Representative micrographs of KPC (n=3) and KPC-Sf3b1K700E/+ (n=3) cancer organoid lines treated with TGF-β1 (10 ng/ml) for 48 hr. Matrigel was detached prior to staining with crystal violet, allowing quantification of cells migrated through the matrigel matrix and attached at the cell culture plate. Scale bar is 1 mm (panel above) or 100 μm (panel below). (H) Quantification of micrographs shown in (G). The fraction of attached organoids was calculated by dividing the number of attached organoids by the number of total organoids contained in the matrigel dome. The experiment was performed independently three times for every cell line, the average of all replicates is shown. Error bar represents SEM. Two-tailed unpaired t-test was used to compute the indicated p-value. (I) Representative micrographs of wound healing assay of PANC-1 WT and PANC-1 SF3B1K700E/+ cells pre-treated with TGF-β1 (10 ng/ml) for 24 hours at the indicated time points after performing the scratch. Scale bar is 100 μm. (J) Quantification of wound healing assay of PANC-1 WT and PANC-1 SF3B1K700E/+ cells, displaying the ratio of wound-closure of cells treated with TGF-β1 or without (Ctrl). The experiment was independently performed three times. Error bar represents standard deviation (SD). A two-tailed unpaired t-test was used to compute the indicated p-values.
Figure 2—figure supplement 1
Sf3b1K700E induces downregulation of EMT.
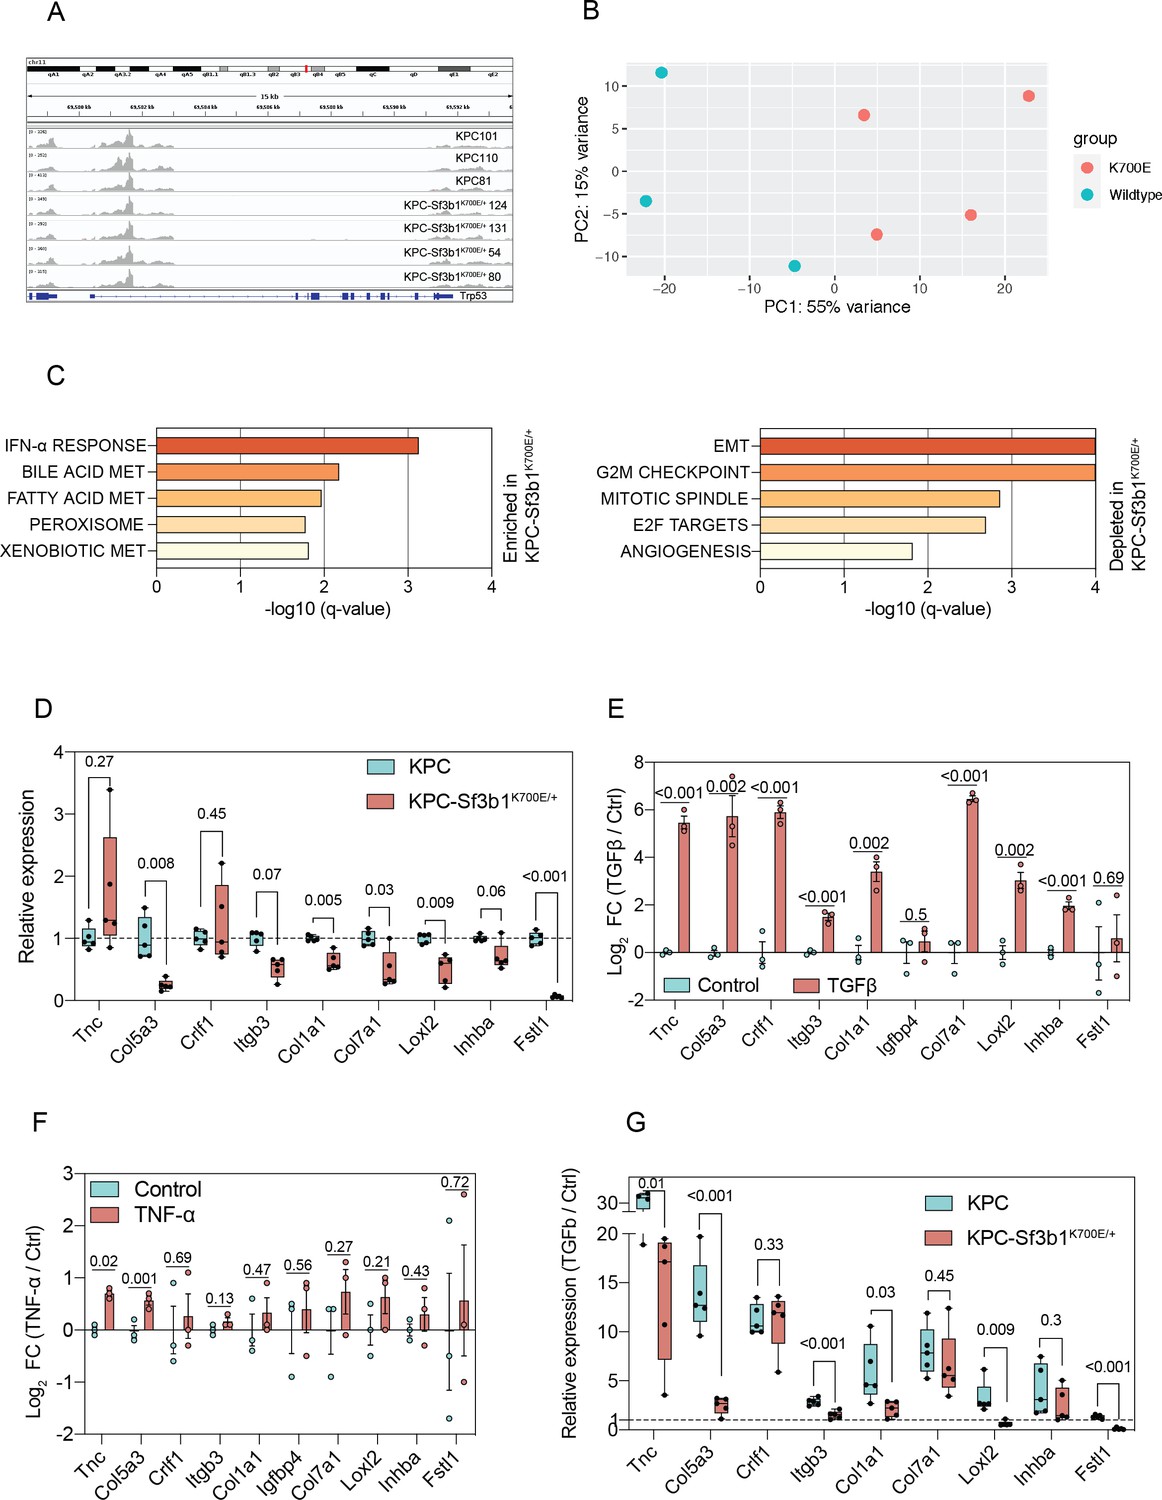
(A) Integrated genome viewer (IGV) displaying RNA-seq reads of Trp53 of sorted KPC and KPC-Sf3b1K700E/+ cells. (B) Principal component analysis showing the variance in two dimensions in relation to the genotypes of the sorted tumor cells (Wildtype = KPC, K700E=KPC-Sf3b1K700E/+). (C) Results of GSEA analysis, displaying most enriched (top) and depleted (bottom) GSEA-Hallmark pathways in KPC-Sf3b1K700E/+ animals. (D) RT-qPCR analysis of EMT genes of KPC (n=3) and KPC-Sf3b1K700E/+ (n=3) in vitro activated cancer cell lines. The experiment was performed independently four times for every cell line, the average of all replicates is shown. Error bar represent SEM. Col3a1, Sfrp1, Igfbp4, Col1a2, Mmp2, and Lama1 were not detected and therefore excluded from analysis (see methods for details). Two-tailed unpaired t-test was used to compute the indicated p-values. (E, F) RT-qPCR analysis of EMT genes displayed in Figure 2B in three different KPC cell lines treated with TGF-β1 (10 ng/ml) (E) or TNF-α (100 ng/ml) (F) for 24 hr. The experiment was performed independently three times for every cell line. Error bar represent SEM. Col3a1, Sfrp1, Igfbp4, Col1a2, Mmp2, and Lama1 were not detected and therefore excluded from analysis (see methods for details). (G) RT-qPCR analysis of EMT genes of KPC (n=3) and KPC-Sf3b1K700E/+ (n=3) in vitro activated cancer cell lines treated with TGF-β1 (10 ng/ml) for 24 hr. The experiment was performed independently four times for every cell line, the average of all replicates and SEM is shown.
Figure 3 with 1 supplement
Sf3b1K700E reduces TGF-β-induced apoptosis.
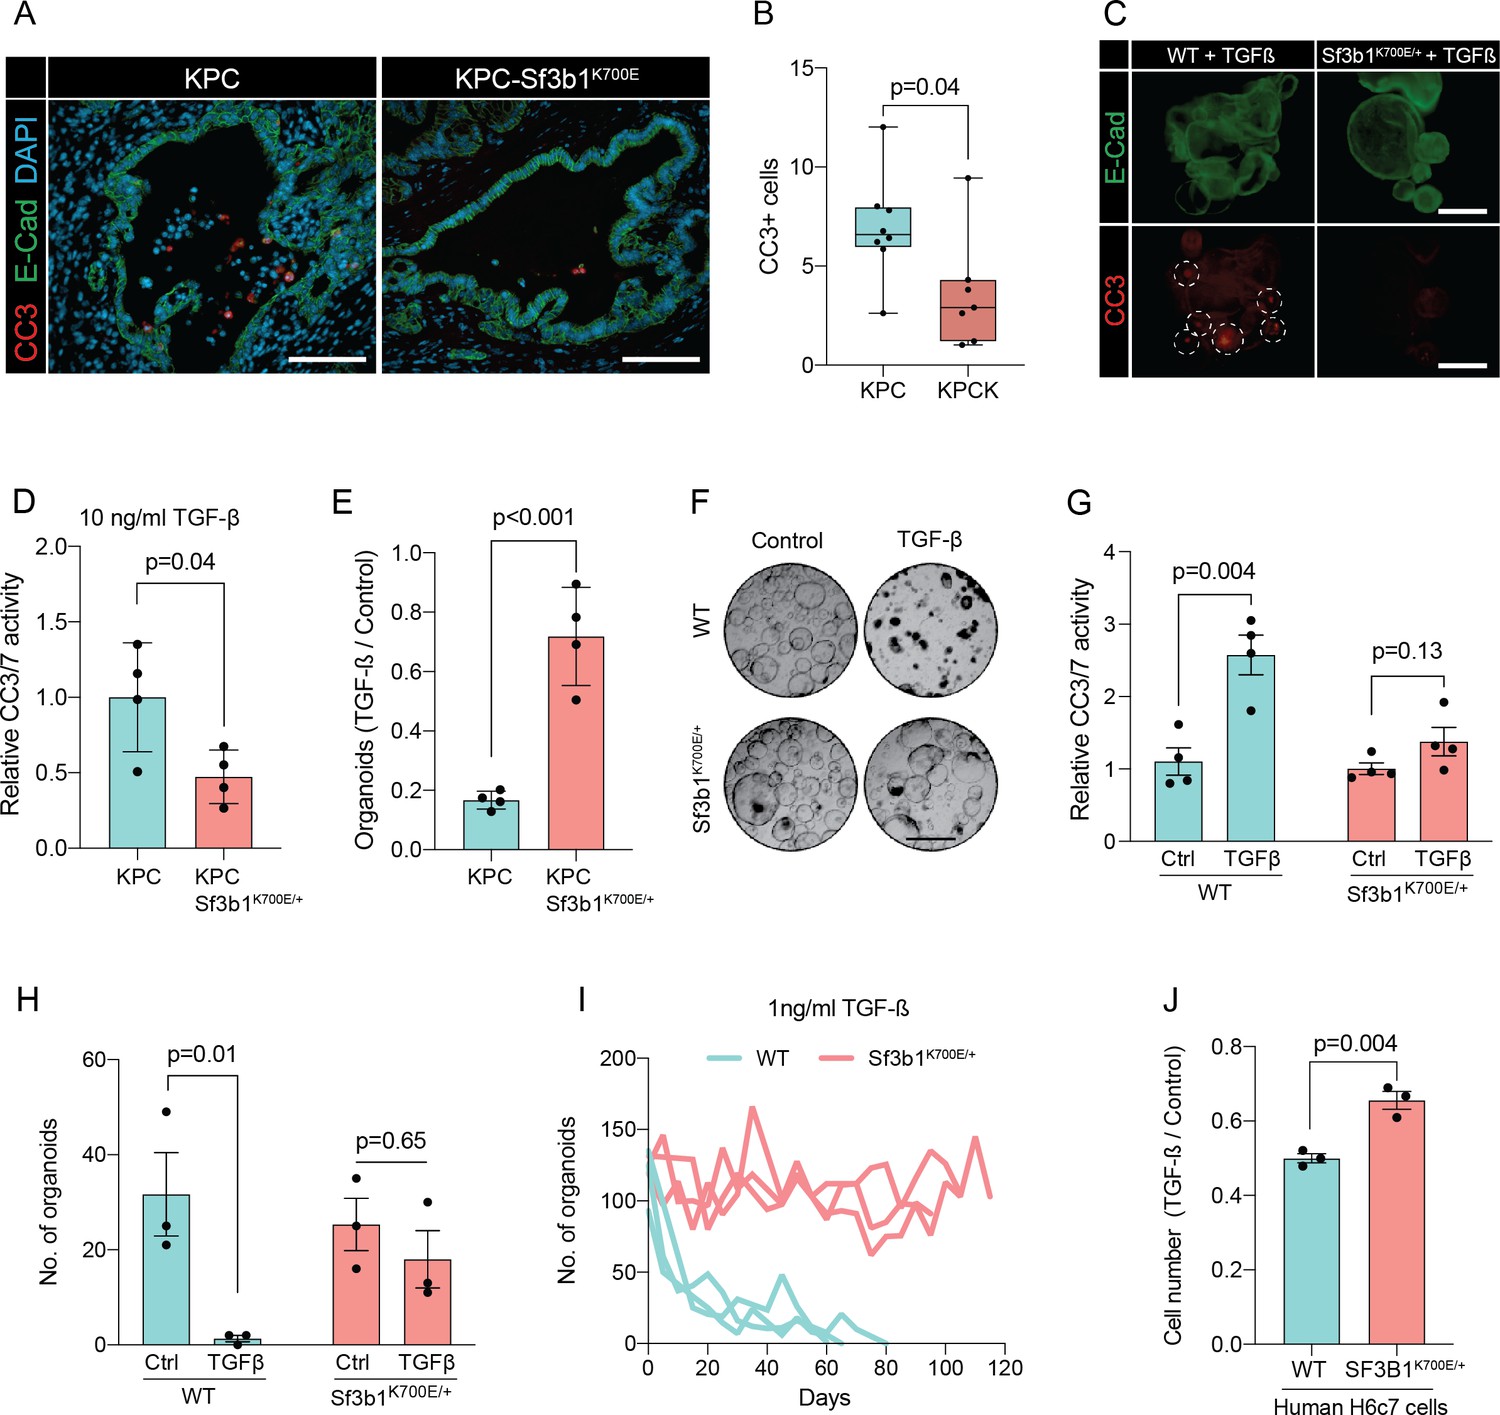
(A) Representative microscopy images of E-Cadherin (green) and CC3 (red) in murine PDAC samples. Scale bar is 50 μm. (B) Quantification of CC3 positive cells in KPC (n=8) and KPC-Sf3b1K700E/+ (n=7) tumor samples. The average number of CC3 positive cells of 5 microscopic fields is plotted, a two-tailed unpaired t-test was used to compute the indicated p-value. (C) Immunofluorescence staining of E-Cadherin (green) and Cleaved Caspase 3 (CC3, red) in WT and Sf3b1K700E/+ organoids exposed to TGF-β1 (10 ng/ml) for 12 hr. CC3-positive cells are highlighted by white dashed lines. Scale bar is 100 μm. (D) Quantification of Cleaved Caspase 3 and 7 (CC3/7) activity measured by Caspase-Glo assay of KPC (n=3) and KPC-Sf3b1K700E/+ (n=4) in vitro activated cancer cell lines treated with TGF-β1 (10 ng/ml) for 24 hr. The experiment was repeated independently twice for every cell line, the average of the replicates is shown, error bar represents SEM. Two-tailed unpaired t-test was used to compute the indicated p-value. (E) Quantification of viable organoids of the indicated genotype exposed to 10 ng/ml TGF-β1 for 48 hr, normalized to organoid numbers of untreated control samples. Each data point shows a different organoid line. For each organoid line, the experiment was independently performed three times, the average of replicates and SEM is plotted. Two-tailed unpaired t-test was used to compute the indicated p-value. (F) Representative microscopy images of WT and Sf3b1K700E/+ organoids exposed to 10 ng/ml TGF-β1 for 48 hr. Scale bar is 500 μM. (G) Quantification of CC3/7 in WT and Sf3b1K700E/+ organoids exposed to 10 ng/ml TGF-β1 for 48 hr. The experiment was repeated independently four times, error bar represents SEM. Two-tailed unpaired t-test was used to compute the indicated p-values. (H) Quantification of viable organoids of the indicated genotype exposed to 10 ng/ml TGF-β1 for 48 hr, normalized to organoid numbers of untreated control samples. Each data point shows a different organoid line. For each organoid line, the experiment was independently performed three times, the average of replicates and SEM is plotted. Two-tailed unpaired t-test was used to compute the indicated p-values. (I) Organoid count of organoids cultured in medium containing 1 ng/ml TGF-β1 for up to 120 days. One organoid line per genotype was used, the experiment was repeated three times independently. (J) Viability of the human pancreatic duct cell line H6c7 overexpressing wildtype or mutated SF3B1 after 72 hr of exposure to 10 ng/ml TGF-β1 assessed by crystal violet staining. The optical density of TGF-β1-treated cells was normalized to untreated control cells. The experiment was independently performed three times, error bar represents SD. A two-tailed unpaired t-test was used to compute the indicated p-value.
Figure 3—figure supplement 1

Sf3b1K700E reduces TGF-β-induced apoptosis.
(A) Representative microscopy images of CC3 (red) in KPC tumor samples. Scale bar is 50 μm. (B) Quantification of CC3 positive cells according to location (inside of PanIN lumen or outside of lumen) in 6 KPC tumor samples. (C) Representative microscopy images of FN1 (green) in murine PDAC. Scale bar is 50 μm. (D) Blinded quantification of luminal necrosis in KPC (n=5) and KPC-Sf3b1K700E/+ (n=6) tumor samples. The average number of necrotic cells per PanIN lesion is plotted, two-tailed unpaired t-test was used to compute the indicated p-value. (E) Proliferation of pancreatic ductal organoids derived from WT and Sf3b1K700E/+ mice without TGF-β1 supplementation. Error bar represent SEM. Two-tailed unpaired t-test was used to compute the indicated p-value. (F) Organoid count of organoids of the indicated genotypes exposed to 10 ng/ml TGF-β1 for 48 hr. Error bar represent SEM. Two-tailed unpaired t-test was used to compute the indicated p-value. (G) Organoid count of organoids cultured in medium containing 2 ng/ml TGF-β1 for the indicated period of time. One organoid line for each genotype was used, the experiment was independently performed twice. Error bar represent SEM. (H) Representative microscopy images of WT and Sf3b1K700E/+ organoids exposed to 1, 2, or 5 ng/ml TGF-β1 at the indicated number of passages. Scale bar is 500 μM. (I) Viability of indicated cell lines overexpressing wildtype or mutated SF3B1 after 72 hr of exposure to 10 ng/ml TGF-β1. The experiment was independently performed twice, error bar shows SD. A two-tailed unpaired t-test was used to compute indicated p-values (J) Normalized growth of the pancreatic duct cell line H6c7 overexpressing SF3B1-WT or SF3B1-K700E after 4 days of culture in normal growth medium. The experiment was independently performed twice, error bar shows SD. A two-tailed unpaired t-test was used to compute indicated p-value.
Figure 4 with 1 supplement
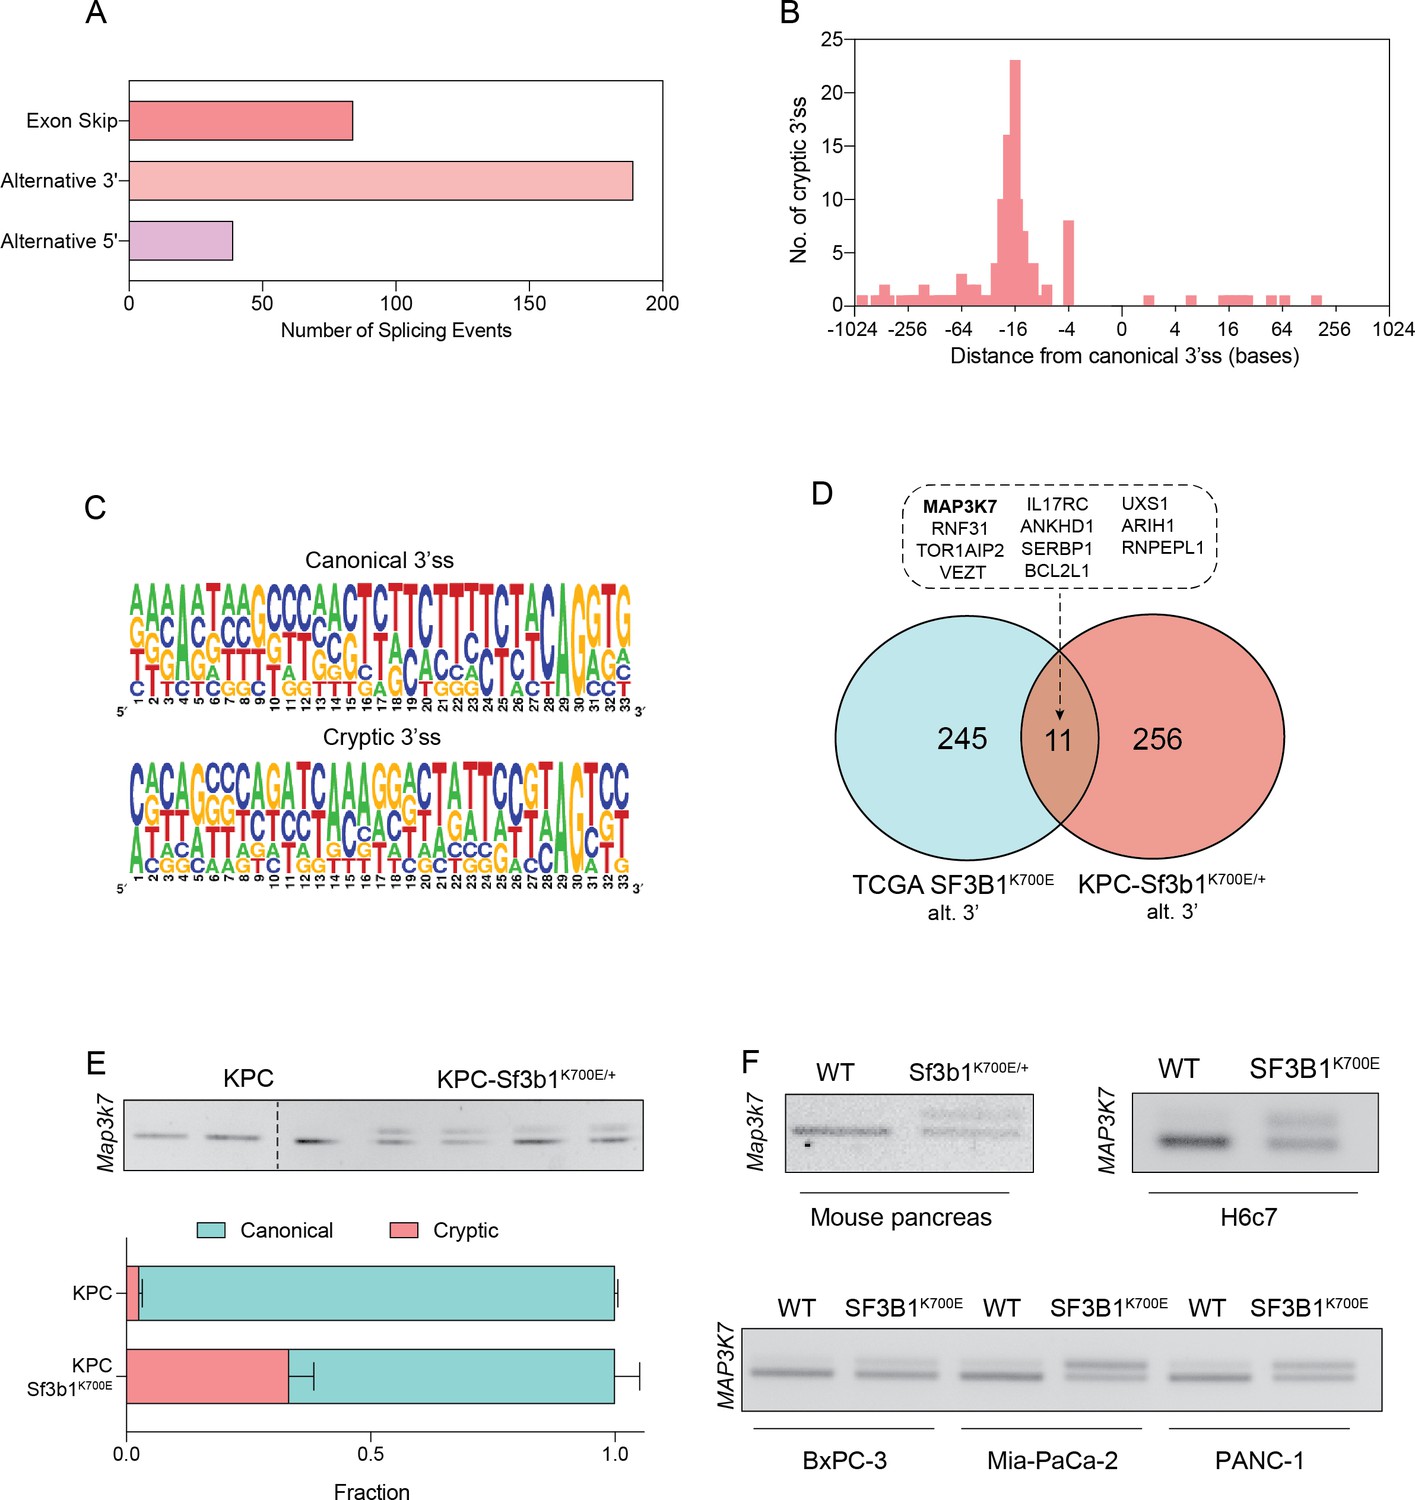
SF3B1-K700E induces aberrant splicing of MAP3K7 in human and mouse PDAC.
(A) Summary of alternative splice events detected in KPC-Sf3b1K700E/+ sorted tumor cells (PSI > 0.1, p<0.01). (B) Histogram displaying the distance of cryptic 3’splice-site (ss) from the adjacent canonical 3’ss in sorted KPC-Sf3b1K700E/+ tumor cells on a logarithmic scale. (C) Consensus 3’ ss motif in proximity of the canonical (top) and the cryptic (bottom) 3’ ss for 7 alternative 3’ splicing events identified in sorted KPC-Sf3b1K700E/+ tumor cells. (D) Venn-diagram depicting alternative 3’ splice events in the pan-cancer data-set (PSI > 0.05 and p<1–10) and sorted KPC-Sf3b1K700E/+ tumor cells (PSI > 0.1, p<0.01). (E) Representative gel image (top) and NGS-results (bottom) of Map3k7 cDNA isolated from sorted KPC (n=3) and KPC-Sf3b1K700E/+ tumor cells (n=4). The amplicon includes the 3’ splice site of exon 4 and 5, the upper band (114 bp) of the gel image represents the non-canonical transcript variant, the lower band (94 bp) represents the canonical isoform. Dashed line indicates cropping of gel image. (F) Representative gel image of RT-PCR amplicon of Map3k7 cDNA isolated from WT and Sf3b1K700E/+ pancreata and from the indicated human cell lines. The upper band of the gel image represents the non-canonical transcript variant, the lower band represents the canonical isoform. The length of the amplicon derived from murine pancreas cells is 114 bp (canonical) and 137 bp (non-canonical) and from human cell lines 94 bp (canonical) and 114 bp (non-canonical).
Figure 4—figure supplement 1
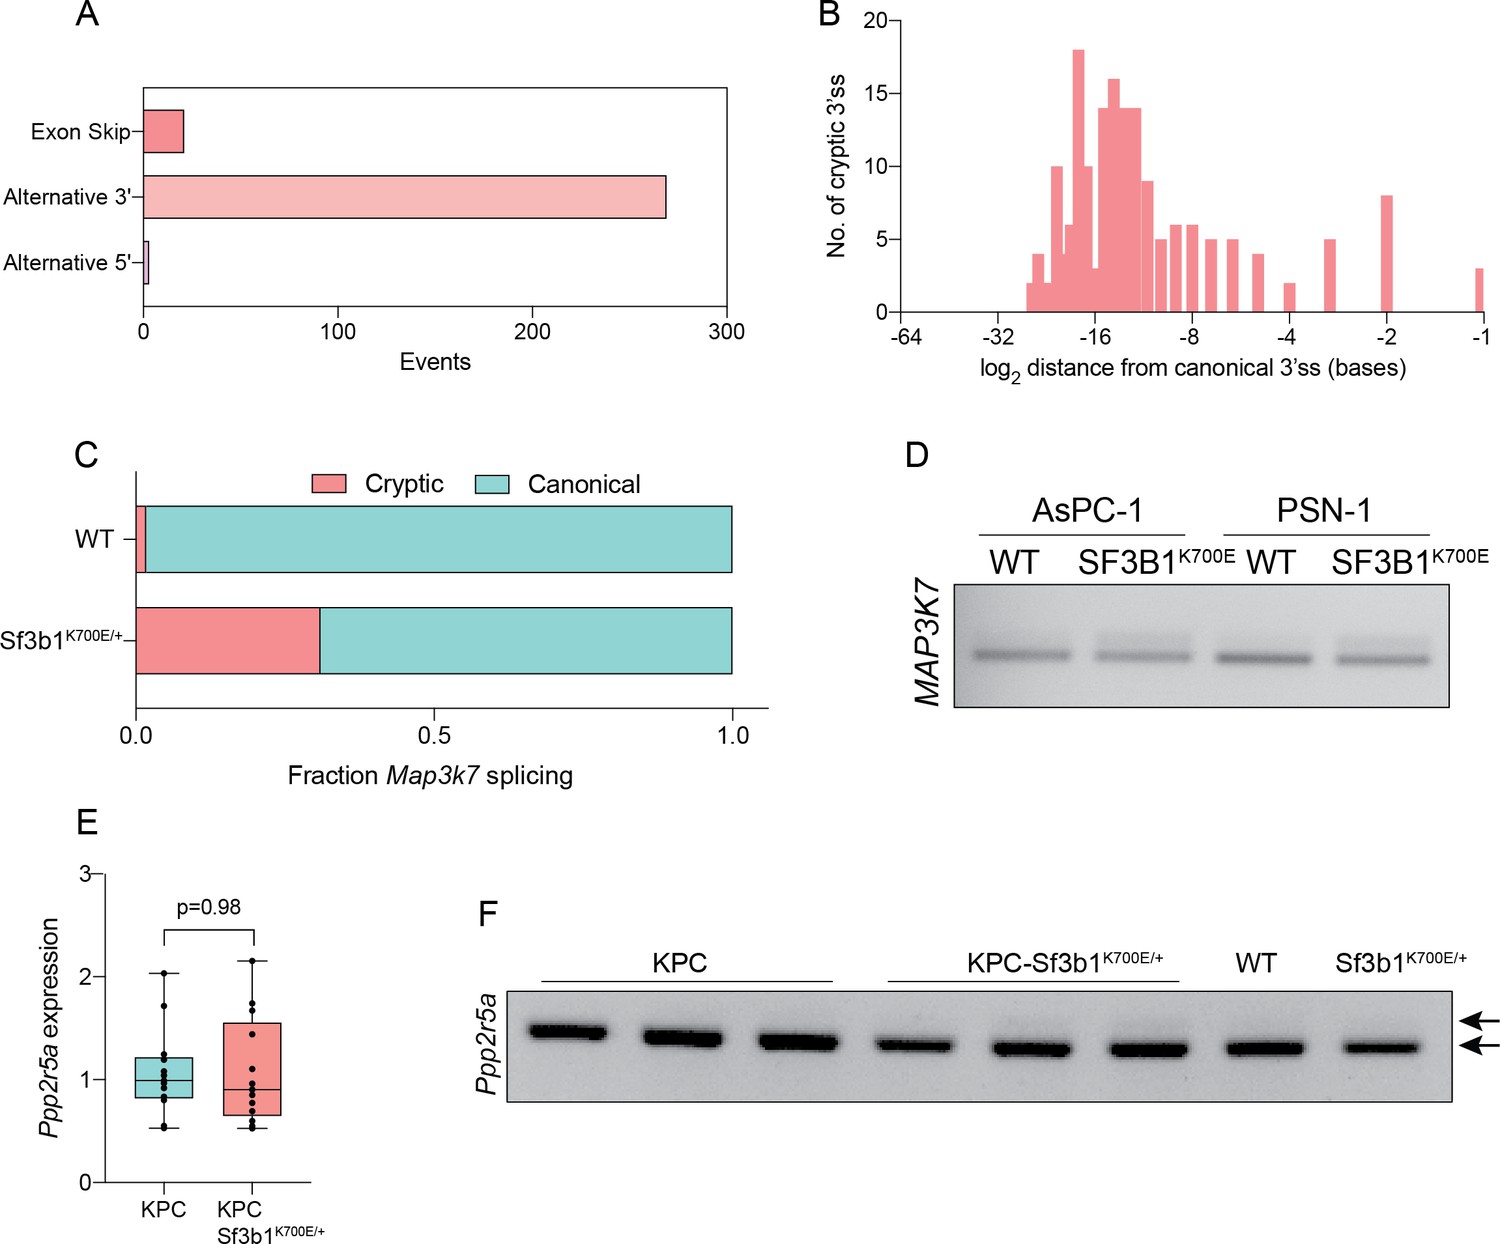
SF3B1-K700E induces aberrant splicing of MAP3K7 in human and mouse PDAC.
(A) Pan-cancer analysis of alternative splice-events identified in solid tumors carrying the SF3B1K700E mutation (PSI >0.05, FDR <1–10). (B) Histogram displaying the distance of cryptic 3’ss from the adjacent canonical 3’ss on a logarithmic scale in solid tumors carrying the SF3B1K700E mutation. (C) NGS-results of Map3k7 cDNA isolated from WT and Sf3b1K700E/+ pancreas organoids (n=1). (D) RT-PCR amplicon of MAP3K7 cDNA isolated from four human PDAC cell lines overexpressing wildtype SF3B1 (OE WT) or K700E-mutated SF3B1 (OE K700E). The amplicon includes the 3’ splice site of exon 4 and 5, the upper band (114 bp) of the gel image represents the non-canonical isoform, the lower band (94 bp) the canonical isoform. (E) RT-qPCR of Ppp2r5a expression in KPC (n=13) and KPC-Sf3b1K700E/+ (n=12) cancer-derived organoid lines. Two-tailed unpaired t-test was used to compute the indicated p-value. (F) RT-PCR amplicon of Ppp2r5a cDNA isolated from sorted KPC (n=3) and KPC-Sf3b1K700E/+ (n=4), as well as WT and Sf3b1K700E/+ pancreas organoids. The amplicon includes the 3’ splice site of exon 4 and 5, whereby the length of the canonical isoform is 250 bp and the upper arrowhead represents the predicted size (265 bp) of the non-canonical isoform.
Figure 5 with 1 supplement
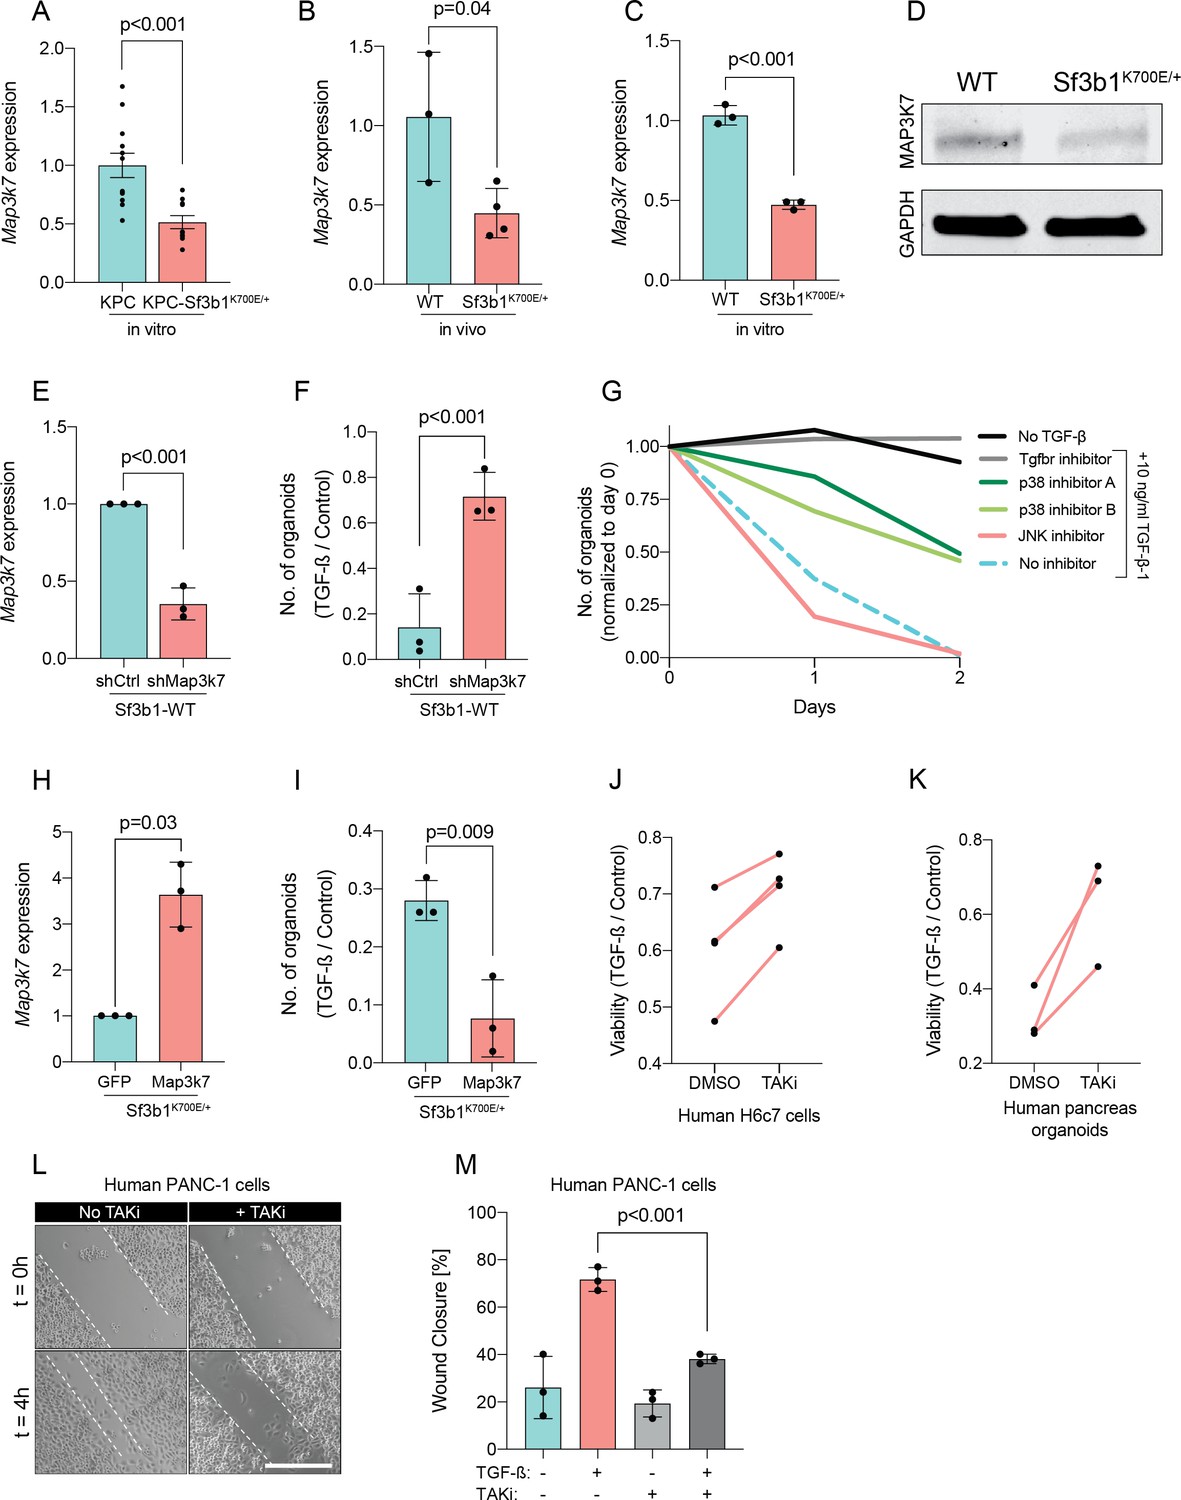
Reduction in Map3k7 lowers sensitivity to TGF-β1.
(A–C) RT-qPCR data showing Map3k7 expression in KPC (n=13) and KPC-Sf3b1K700E/+ (n=12) ex vivo tumor cultures (A), as well as WT (n=3) and Sf3b1K700E/+ (n=4) pancreata (B) and organoid lines (C). For analysis, Ct-values of Map3k7 were normalized to Actb and a two-tailed unpaired t-test was used to compute the indicated p-values. Data show mean and standard error of the mean in A, B and C. (D) Representative Western blot gel-image of MAP3K7 (molecular weight 78 kDa) and GAPDH (molecular weight 37 kDa) in WT and Sf3b1K700E/+ organoids. (E) RT-qPCR analysis of Map3k7 in cells transduced with a shMap3k7 compared to a control shRNA. Error bar represents SD, a two-tailed unpaired t-test was used to compute the indicated p-values. (F) Quantification of viable WT and Sf3b1K700E/+ murine pancreatic duct organoids or WT transduced with control shRNA (shCtrl) or shRNA targeting Map3k7 (shMap3k7). The organoids were exposed to 10 ng/ml TGF-β1 for 24 hr prior to analysis. The experiment was independently performed three times. Error bar represents SD, a two-tailed unpaired t-test was used to compute the indicated p-value. (G) Viability of wildtype (WT) organoids cultured in medium containing 10 ng/ml TGF-β1, supplemented with chemical inhibitors targeting the indicated effectors of TGF-β1-signalling. Two independent experiments are summarized. Further details are provided in the methods section. (H) RT-qPCR analysis of Map3k7 in cells transduced by lentivirus with an overexpression construct of Map3k7, compared to overexpression of GFP. Error bar represents SD, a two-tailed unpaired t-test was used to compute the indicated p-values. (I) Quantification of viable murine pancreatic duct organoids with stable overexpression of Map3k7, exposed to 10 ng/ml TGF-β1 for 96 hr. Data represents one organoid line per condition, the experiment was independently performed three times. Error bar represents SD, a two-tailed unpaired t-test was used to compute the indicated p-value. (J–K) Viability of human pancreatic duct H6c7 cells (J) or human pancreatic duct organoids (K) exposed to 10 ng/ml TGF-β1 with addition of the MAP3K7 inhibitor Takinib (TAKi, 5 μM) or DMSO. The viability was assessed after 48 hr of TGF-β1 treatment and normalized to cells grown in absence of TGF-β1. The experiment was independently performed four (J) or three (K) times. (L) Representative micrographs of wound healing assay of PANC-1 cells pre-treated with TGF-β1 (10 ng/ml) for 24 hr, with or without addition of 5 μM TAKi, at the indicated time points after performing the scratch. Scale bar is 50 μM. (M) Quantification of wound healing assay shown in (L). The experiment was independently performed three times. Error bar represents SD, a two-tailed unpaired t-test was used to compute the indicated p-values.
Figure 5—figure supplement 1

Reduction in Map3k7 lowers sensitivity to TGF-β1.
(A) Western blot gel-image of MAP3K7 (molecular weight 78 kDa) and GAPDH (molecular weight 37 kDa) in a KPC cell line transduced with a control shRNA (shCtrl) or a shRNA targeting Map3k7 (shMap3k7). (B) RT-qPCR analysis of EMT genes displayed in Figure 2F in a KPC cell line transduced with a control shRNA (shCtrl) or a shRNA targeting Map3k7 (shMap3k7) treated with TGF-β1 (10 ng/ml) for 24 hr. The experiment was performed independently three times, error bar represents SD. (C) Organoid count normalized to untreated organoids of respective genotypes at passage 0. Duct organoids of indicated genotypes / treated with shRNA were exposed to 1 ng/ml TGF-β1 for 25 days. Data represents one organoid line per condition, the experiment was independently performed three times. Error bar represents SD, a one-way ANOVA was used to compute the indicated p-values.
Author response image 1

Impact of altered Map3k7 levels in an orthotopic PDAC model.
(A) Relative gene expression of Map3k7 in KPC cells transduced with shRNA targeting Map3k7 (shMap3k7), normalized to KPC cells transduced with scrambled control shRNA (shCtrl). 3 biological replicates are shown., error bar represents SD. (B) Weight of tumors derived by orthotopical transplantation of shMap3k7 and shCtrl KPC cells. 5 biological replicates are shown, error bar represents SEM. (C) Relative gene expression of EMT genes in tumors derived by orthotopic transplantation of shCtrl and shMap3k7 cells. 4 biological replicates are shown. (D) Relative gene expression of Map3k7 in KPC-Sf3b1K700E cells transduced with an overexpression vector of Map3k7 (OE Map3k7), normalized to control KPC cells without Map3k7 overexpression. 3 biological replicates are shown, error bar represents SD. A two-sided student’s t-test was used to calculate significance. (E) Weight of tumors derived by orthotopical transplantation of Map3k7 overexpressing KPC-Sf3b1K700E cells (n=5) and control KPC-Sf3b1K700E cells (n=4). Error bar represents SEM. (F) Relative gene expression of EMT genes in tumors derived by orthotopic transplantation of KPC-Sf3b1K700E cells with- and without overexpression of Map3k7. 4 biological replicates are shown. A two-sided student’s t-test was used to calculate significance in Figure 2A-F.
Tables
Author response table 1
Mutual exclusivity analysis of public PDAC databases (ICGC, CPTAC, QCMG, TCGA, UTSW), including 910 patients.
Mutation frequency is 25% for SMAD4, 5% for TGF-ΒR2, 3% for SMAD2, 2.6% for TGF-ΒR1, 1.4% for SMAD3, 0.7% for SF3B1-K700E, 0.7% for TGF-ΒR3, 0.4% for SMAD1. Analysis was performed on cbioportal.org.
| A | B | p-Value | q-Value | Tendency |
|---|---|---|---|---|
| SF3B1: MUT=K700E | SMAD1 | 0.974 | 0.974 | Mutual exclusivity |
| SF3B1: MUT=K700E | SMAD2 | 0.823 | 0.974 | Mutual exclusivity |
| SF3B1: MUT=K700E | SMAD3 | 0.917 | 0.974 | Mutual exclusivity |
| SF3B1: MUT=K700E | SMAD4 | 0.524 | 0.974 | Mutual exclusivity |
| SF3B1: MUT=K700E | TGF-ΒR1 | 0.851 | 0.974 | Mutual exclusivity |
| SF3B1: MUT=K700E | TGF-ΒR2 | 0.268 | 0.682 | Co-occurrence |
| SF3B1: MUT=K700E | TGF-ΒR3 | 0.961 | 0.974 | Mutual exclusivity |
Additional files
-
Supplementary file 1
Differential gene expression analysis of sorted KPC and KPC-Sf3b1K700E tumor cells, displaying logFC, logCPM, P-Value, False discovery rate (FDR) and EntrezID.
- https://cdn.elifesciences.org/articles/80683/elife-80683-supp1-v3.xlsx
-
Supplementary file 2
Splicing analysis of indicated alternative splice events in sorted KPC and KPC-Sf3b1K700E tumor cells, displaying Ensembl ID, gene name, event positions, percent spliced in (delta psi), standard deviation, p-value and FDR.
- https://cdn.elifesciences.org/articles/80683/elife-80683-supp2-v3.xlsx
-
Supplementary file 3
Name and nucleotide sequence of all primers used in the study.
- https://cdn.elifesciences.org/articles/80683/elife-80683-supp3-v3.xlsx
-
Source data 1
Uncropped gel images of Western blot an RT-PCR experiments.
- https://cdn.elifesciences.org/articles/80683/elife-80683-data1-v3.zip
-
MDAR checklist
- https://cdn.elifesciences.org/articles/80683/elife-80683-mdarchecklist1-v3.docx
Download links
A two-part list of links to download the article, or parts of the article, in various formats.
Downloads (link to download the article as PDF)
Open citations (links to open the citations from this article in various online reference manager services)
Cite this article (links to download the citations from this article in formats compatible with various reference manager tools)
Mutant SF3B1 promotes malignancy in PDAC
eLife 12:e80683.
https://doi.org/10.7554/eLife.80683


