Monoallelically expressed noncoding RNAs form nucleolar territories on NOR-containing chromosomes and regulate rRNA expression
- Department of Cell and Developmental Biology, University of Illinois at Urbana-Champaign, United States
- Department of BioHealth Informatics, School of Informatics and Computing, IUPUI, United States
- Department of Computer Science, University of Illinois at Urbana-Champaign, United States
- Centre for Chromosome Biology, School of Natural Sciences, National University of Ireland Galway, Ireland
- Pacific Biosciences, United States
- Department of Genetics and Genome Sciences, University of Connecticut School of Medicine, United States
- Ionis Pharmaceuticals Inc, United States
- Department of Biophysics and Quantitative Biology, University of Illinois at Urbana-Champaign, United States
- Department of Biochemistry, University of Illinois at Urbana-Champaign, United States
- Department of Cell and Molecular Biology, Northwestern University, United States
- Carl R. Woese Institute for Genomic Biology, University of Illinois at Urbana-Champaign, United States
- Department of Biomedical Engineering, Georgia Tech, United States
- Cancer Center at Illinois, University of Illinois at Urbana-Champaign, United States
Figures
Figure 1 with 3 supplements
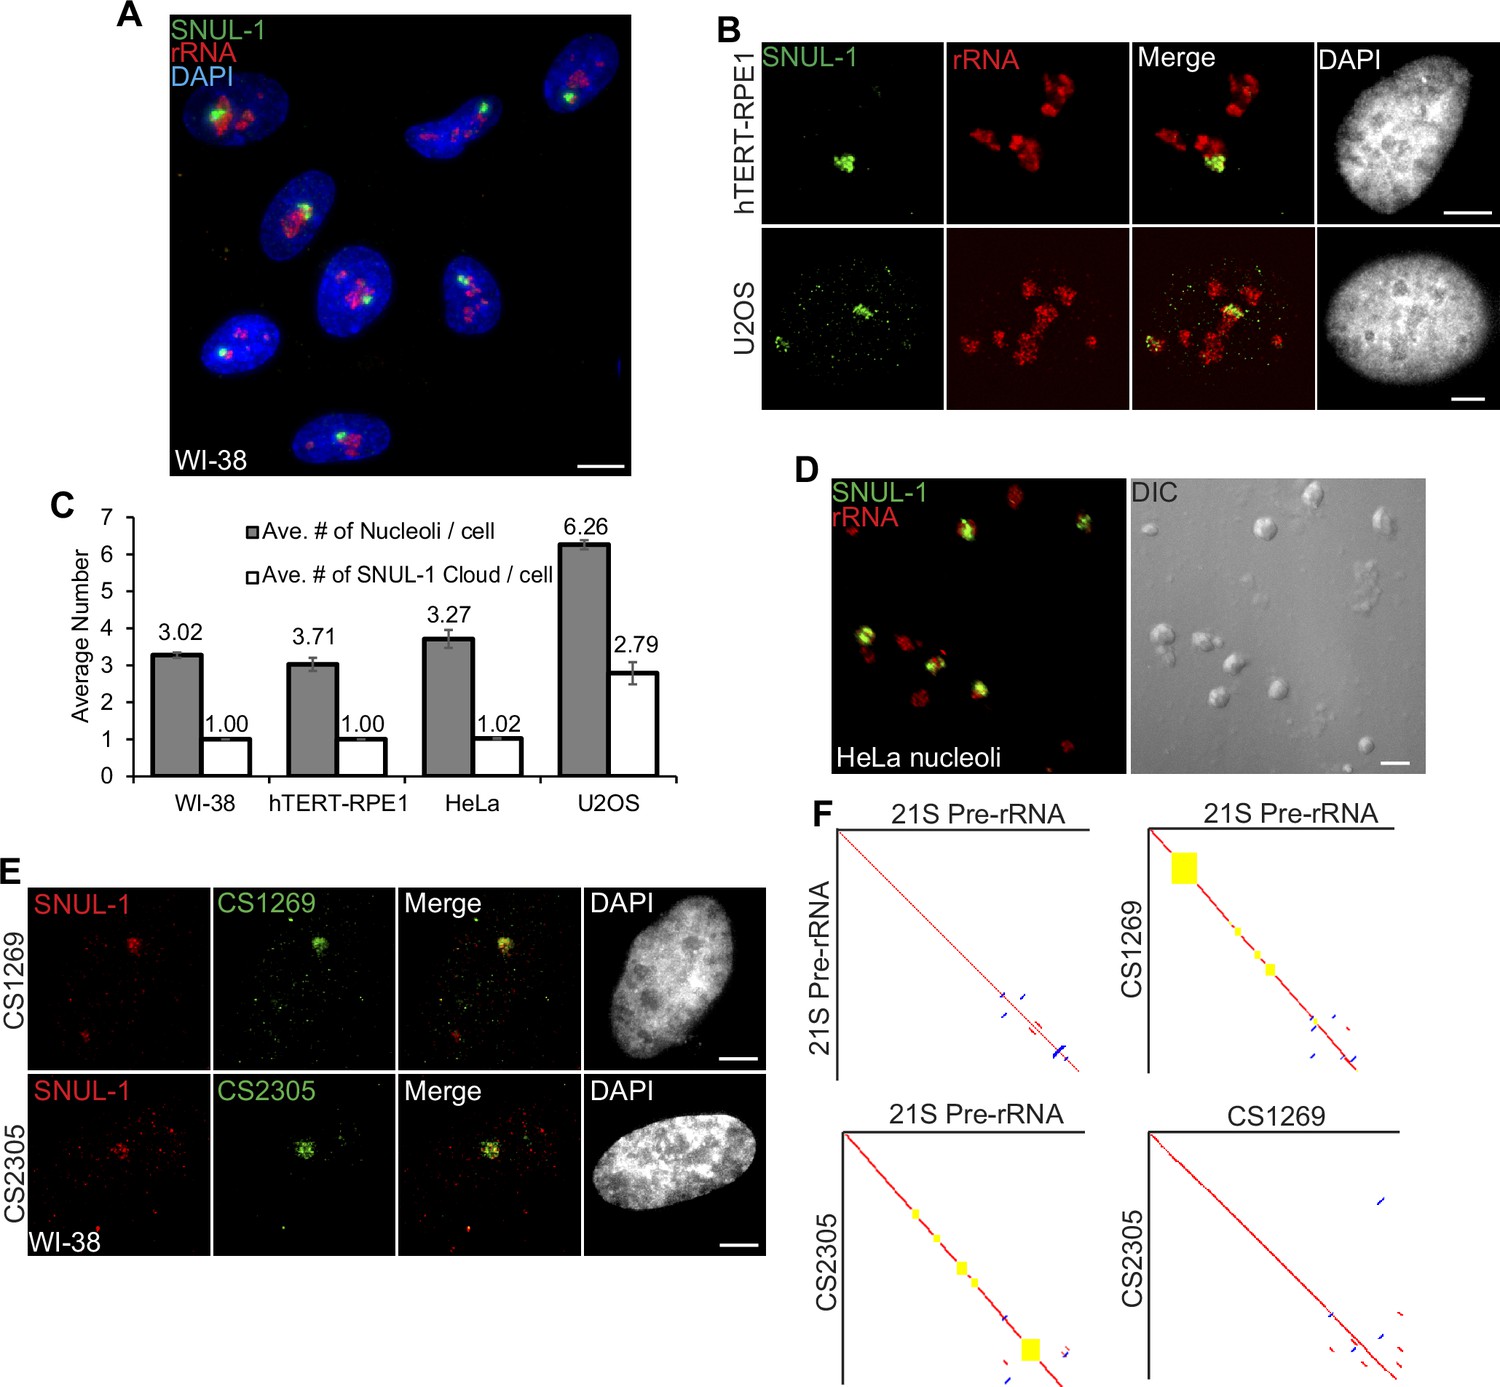
SNUL-1 forms RNA clouds in human cell lines.
(A) RNA-FISH of SNUL-1 (green) in WI-38 cells. Nucleoli are visualized by rRNA (red). (B) RNA-FISH of SNUL-1 (green) in hTERT-RPE1 and U2OS cell lines. Nucleoli are visualized by rRNA (red). (C) Graph depicting the average number of nucleoli/cell and the SNUL-1 clouds/cell in various cell lines. n = >150 cells/experiment (D) RNA-FISH of SNUL-1 (green) in biochemically isolated HeLa nucleoli marked by rRNA (red). Note that the distribution of SNUL-1 is preserved in the isolated nucleoli. (E) RNA-FISH performed using probes designed from the SNUL-1 CSs (green) and SNUL-1 (red) Probe 1 in WI-38 cells. (F) Pairwise sequence comparisons between 21 S (pre-rRNA) and 21 S, 21 S and CS1269 (SNUL-1 CS), 21 S and CS2305, and CS1269 and CS2305. Red lines indicate forward aligned regions, blue lines indicate reverse aligned regions, and yellow boxes indicate unaligned regions. All scale bars, 5 µm.
-
Figure 1—source data 1
Quantification of nucleoli and SNUL-1 cloud numbers in different cell lines.
- https://cdn.elifesciences.org/articles/80684/elife-80684-fig1-data1-v2.zip
Figure 1—figure supplement 1

SNUL-1 forms RNA clouds in human cell lines.
A RNA-FISH of SNUL-1 (green) in different human cell lines. For all images, nucleoli are visualized by rRNA (red). Scale bars, 5 µm.( B) RNA-FISH of SNUL-1 after nuclease treatments in WI-38 cells. Scale bars, 5 µm. (C) Schematic showing the truncated probes designed to determine the minimum region required for SNUL-1 hybridization. (D) RNA-FISH performed with the strand-specific ribo-probes listed in c. Scale bars, 5 µm. (E) RNA-FISH to detect SNUL-1 (green) and SNUL-2 (red) clouds in WI-38 cells. Nucleoli are visualized by rRNA (blue). Scale bars, 5 µm.
Figure 1—figure supplement 2

SNUL-1 forms RNA clouds in human cell lines.
A Local alignment between SNUL-1 Probe 4 and SNUL-2 probe. Note the imperfect [CT] repeat in SNUL-2 probe and the poor alignment between the two probes beyond the [CT]-rich region. (B) Schematic showing the workflow of the unbiased strategies to determine the full-length SNUL-1 sequence. (C) IGV snapshot showing end-to-end coverage for PACBIO-based candidate sequence 8644 from Nanopore-based sequencing. (D) RNA-FISH using probes designed from the CSs (green) and SNUL-1 (red) Probes 1 in WI-38 cells. Scale bars, 5 µm. (E) RNA-FISH with CS probes and SNUL-1 Probe 1 in WI-38 cells. Scale bars, 5 µm. (F). Signal profiles of the lines marked in D. Note that the signals shown by different probes are not completely colocalized. (G) Pairwise sequence comparisons between 21 S and CS8644, 21 S and CS2615, and 21 S and CS9572. Red lines indicate forward aligned regions, blue lines indicate reverse aligned regions, and yellow boxes indicate unaligned regions. (H) Histogram of the dissimilarity score between each isoform in the high-quality PacBio database and its best match in the human transcript database.
Figure 1—figure supplement 3
SNUL-1 forms RNA clouds in human cell lines.
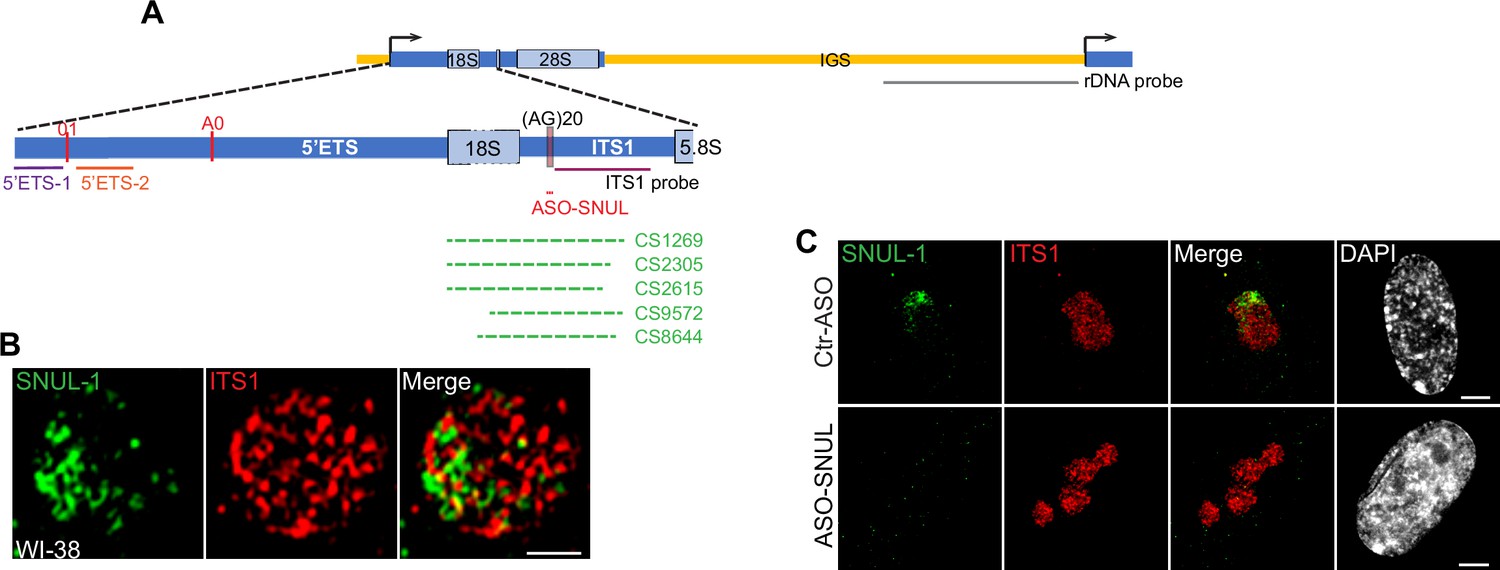
A Schematic, showing the positions of the rRNA and ITS1 probes, ASO-SNUL and SNUL-1 CS candidates relative to pre-rRNA sequence. Please note that the dashed lines represent imperfect and/or gapped alignment between sequences. (B) Representative SIM image showing the relative distribution of SNUL-1 (green) and pre-rRNA hybridized by ITS1 probe (red) within a single nucleolus. Scale bars, 1 µm. (C) RNA-FISH of SNUL-1 (green) and pre-rRNA hybridized by ITS1 probe (red) in WI-38 cells transfected by Ctr-ASO or ASO-SNUL for 72 hr. Scale bars, 5 µm. DNA is counterstained with DAPI.
Figure 2 with 1 supplement
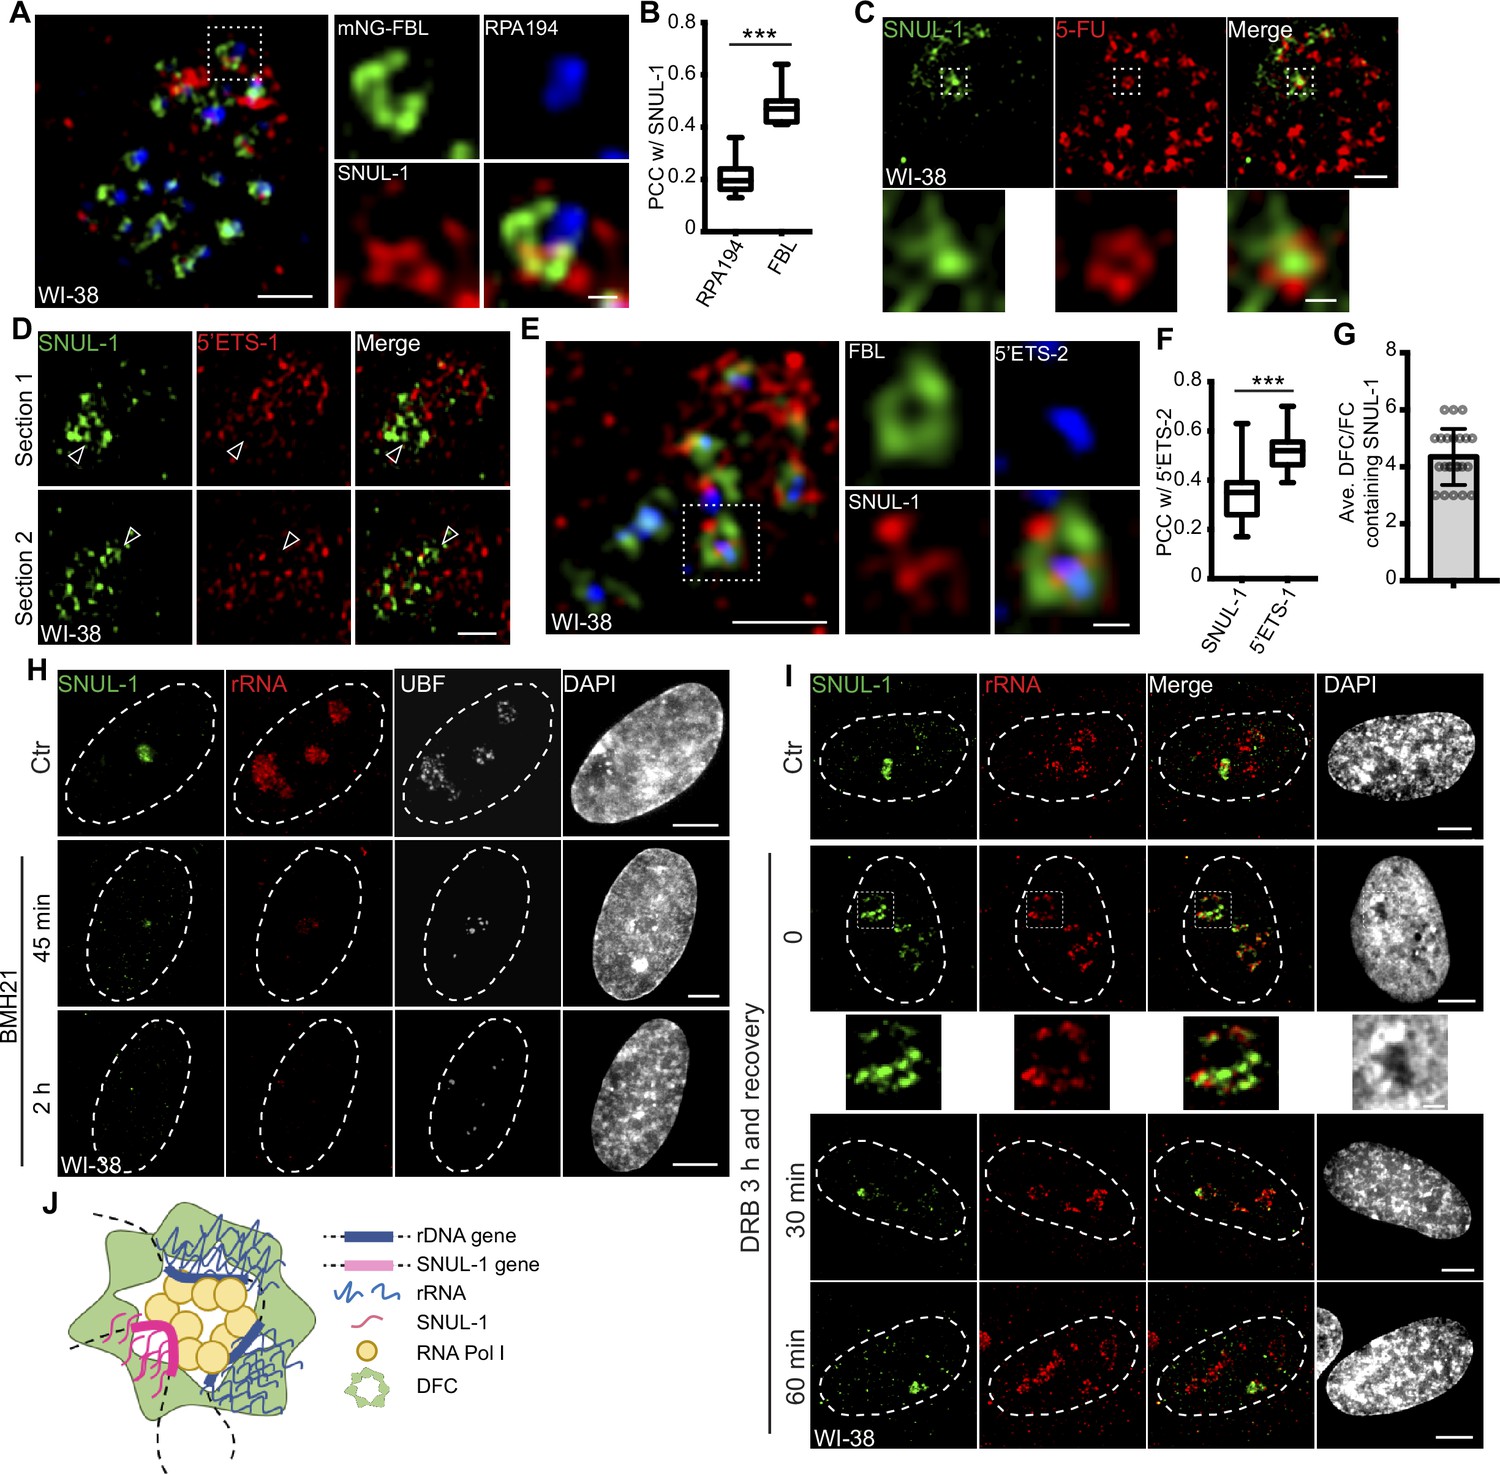
SNUL-1 is an RNA Pol I transcript and forms constrained nucleolar territory.
(A) Representative SIM image of the SNUL-1 (red) distribution relative to DFC/FC units in WI-38 cells. FC is marked by RPA194 (blue) and DFC is marked by mNeonGreen (NG)-FBL (green). Scale bars, 1 µm (main images) and 200 nm (insets). (B) Box plots showing Pearson’s correlation coefficients (PCCs) between SNUL-1 and either RPA194 (FC) or FBL (DFC). n=16 and 11, respectively. Statistical analysis was performed using Mann-Whitney test. *p<0.05, **p<0.01, ***p<0.001. Center line, median; box limits, upper and lower quartiles; whiskers, maximum or minimum of the data. (C) Representative SIM image of the SNUL-1 (green) distribution relative to the 5-FU signal (red) in WI-38 cells. Nascent RNAs are metabolically labeled by 5 min of 5-FU pulse. Scale bars, 1 µm (main images) and 200 nm (insets). (D) Two sections of SIM images from a single nucleolus showing relative distribution of SNUL-1 (green) and nascent pre-rRNA (marked by 5’ETS-1 probe) signals (red) in WI-38 cells. (E) Representative SIM image of the SNUL-1 (red) distribution relative to DFC/FC unit and pre-rRNAs in WI-38 cells. DFC is marked by FBL (green) and pre-rRNAs (blue) are detected by 5’ETS-2 probe. Scale bars, 1 µm (main images) and 200 nm (insets). (F) Box plots showing the Pearson’s correlation coefficients (PCCs) between 5’ETS-2 signal and either SNUL-1 or 5’ETS-1 signal. n=23 and 16, respectively. Statistical analysis was performed using Mann-Whitney test. *p<0.05, **p<0.01, ***p<0.001. (G) Graph depicting the average number of SNUL-1-positive DFC/FC units/nucleolus in WI-38 cells. Center line, median; box limits, upper and lower quartiles; whiskers, maximum or minimum of the data. (H) Co-RNA-FISH and IF to detect SNUL-1 (green), rRNA (red) and UBF (white) in control and BMH21-treated WI-38 cells. Scale bars, 5 µm. (I), RNA-FISH to detect SNUL-1 (green), rRNA (red) in control and DRB-treated WI-38 cells. For recovery after DRB treatment, the drug is washed off after 3 hr of treatment and RNA-FISH is performed at 0, 30, and 60 min timepoints during recovery. Scale bars, 5 µm (main images) and 1 µm (insets). (J), Model showing the association of both SNUL-1 and rRNA in the same DFC/FC unit.
-
Figure 2—source data 1
Quantification in Figure 2B, F and G.
- https://cdn.elifesciences.org/articles/80684/elife-80684-fig2-data1-v2.zip
Figure 2—figure supplement 1
SNUL-1 is an RNA Pol I transcript and forms constrained nucleolar territory.
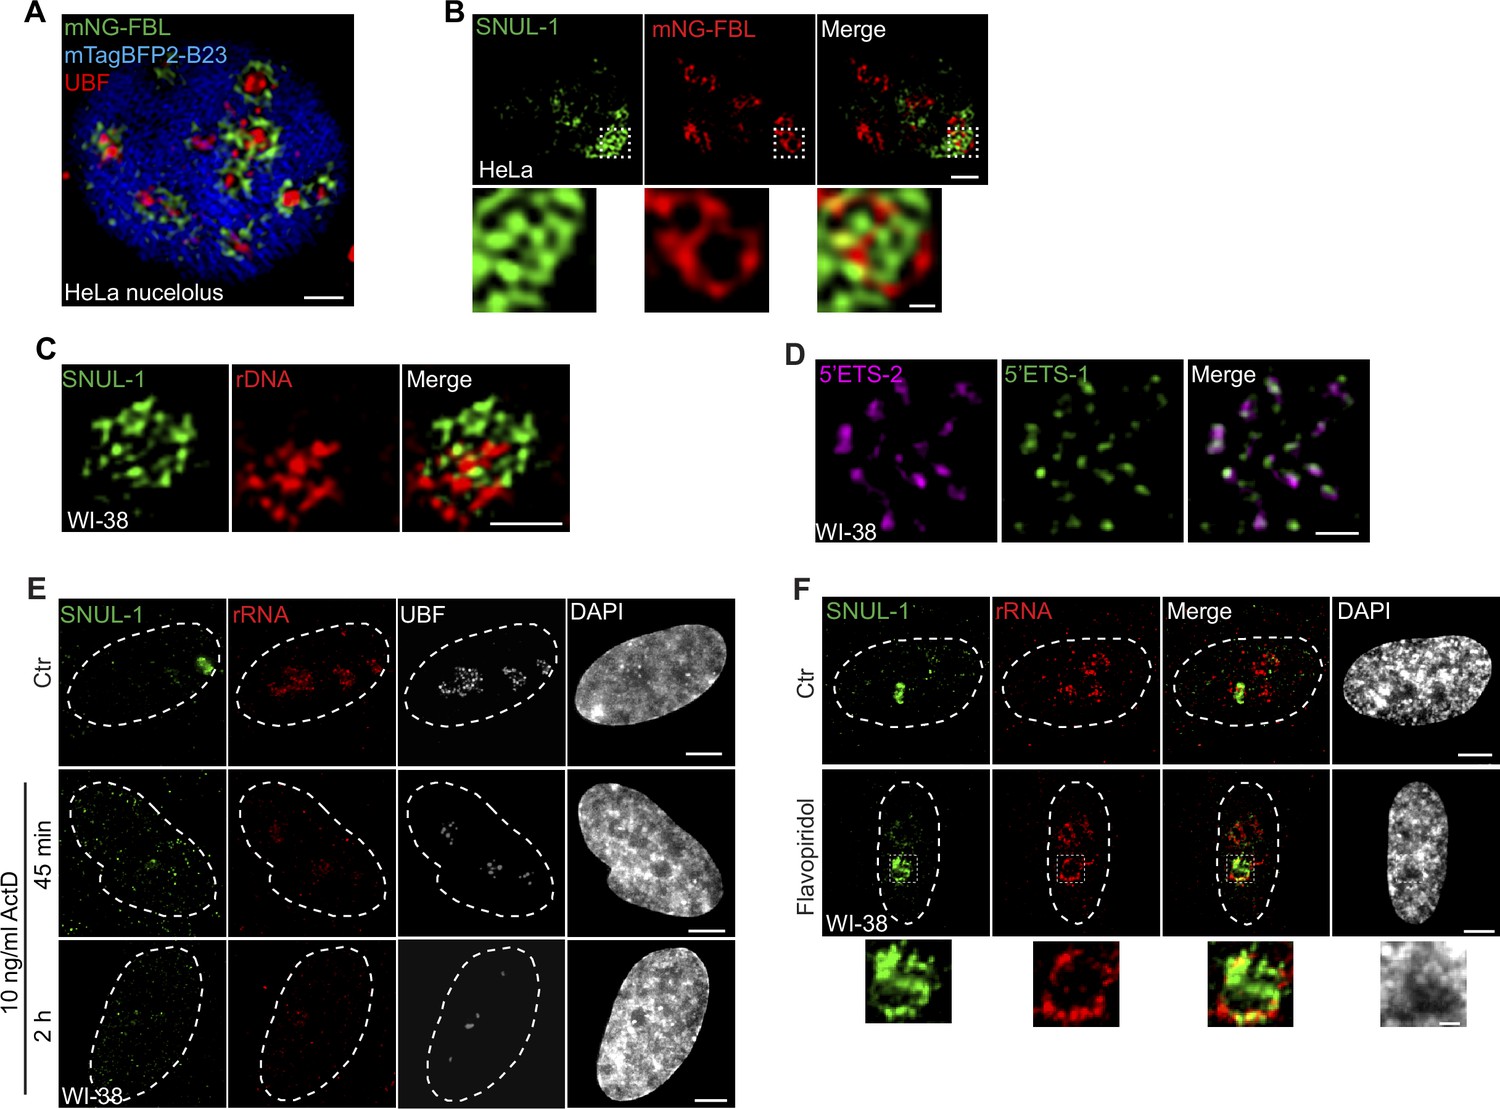
(A) Visualization of the tripartite structure within a single HeLa nucleolus by SIM. FC is marked by UBF (red), DFC is marked by mNeonGreen (mNG)-FBL (green), and GC is marked by mTagBFP2-B23 (blue). Scale bar, 1 µm. (B) Representative SIM image of a single nucleolus showing the SNUL-1 distribution relative to DFC/FC units in HeLa cells. DFC is marked by mNG-FBL. Scale bars, 1 µm (main images) and 200 nm (insets). (C) Representative SIM image showing the relative distribution of SNUL-1 (green) and rDNA (red) within a single nucleolus. Scale bars, 1 µm. Note: The prominent signal of rDNA represents clusters of inactive rDNA repeats. (D) Representative SIM image of a single nucleolus showing the distribution of nascent pre-rRNA detected by 5’ETS-1 and 5’ETS-2 probes. Scale bars, 1 µm. (E) Co-RNA-FISH and IF to detect SNUL-1 (green), rRNA (red), and UBF (white) in control and RNA pol I-inhibited (low con. Of ActD) WI-38 cells. Scale bars, 5 µm. (F) RNA-FISH to detect SNUL-1 (green), rRNA (red) in control and RNA pol II-inhibited WI-38 cells. Scale bars, 5 µm (main images) and 1 µm (insets). DNA is counterstained with DAPI.
Figure 3 with 1 supplement
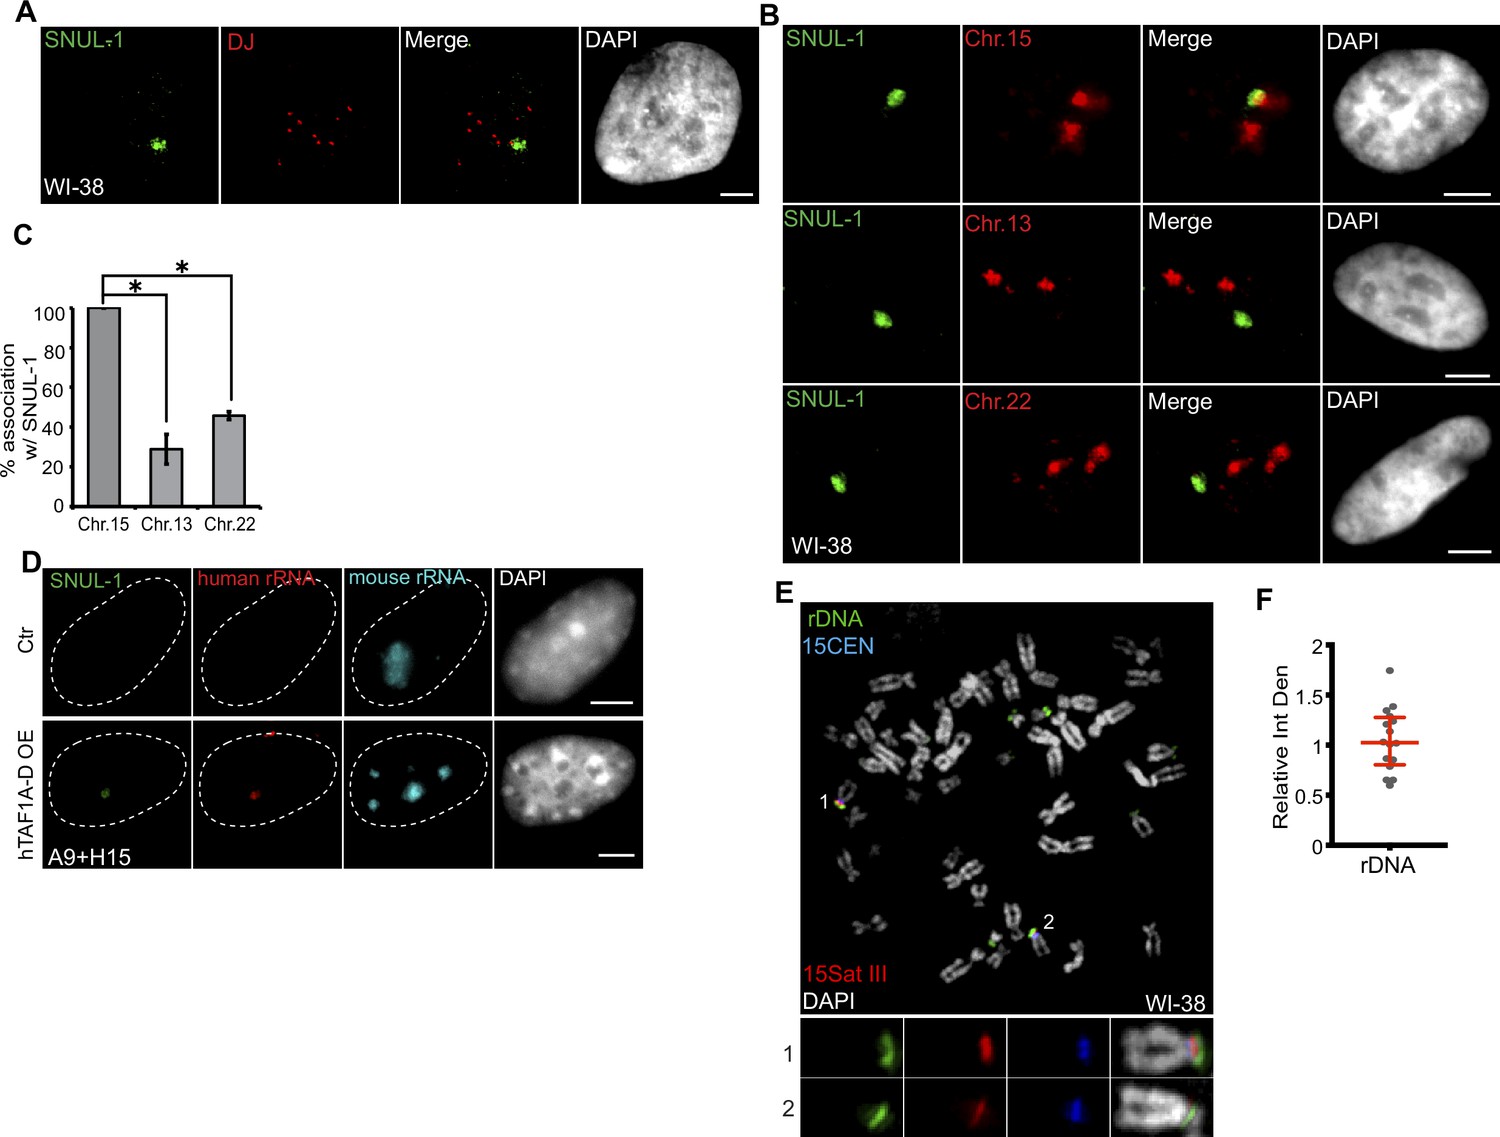
SNUL-1 is associated with the NOR of one Chr. 15 allele.
(A) DNA-RNA-FISH of SNUL-1 RNA (green) and distal junction (DJ) DNA (red) in WI-38 cells. (B) DNA-RNA-FISH of SNUL-1 RNA and Chr. 15, Chr. 13, and Chr. 22 marked by probes painting the q-arms of the chromosomes in WI-38 cells. (C) Quantification of the association rates between SNUL-1 and NOR containing chromosomes. Data are presented as Mean ± SD from biological triplicates.>50 cells were counted for each of the biological repeats. Student’s unpaired two-tailed t-tests were performed. *P<0.05. (D) RNA-FISH to detect SNUL-1 (green), human rRNA (red) and mouse rRNA (blue) in control and hTAF1A-D overexpressed A9 +H15 cells. Dotted lines mark the boundary of the nuclei. (E) DNA-FISH showing rDNA and CEN15 and 15 Sat III contents on Chr. 15 in WI-38 metaphase chromosomes. The two alleles of Chr.15 are marked by 15Sat III and 15CEN, rDNA arrays are detected by a probe within the IGS region (See Figure 1—figure supplement 3A). (F) Relative integrated density of the two Chr. 15 rDNA arrays is calculated by dividing the measurement of the rDNA signal on the Chr. 15 with larger 15Sat III by that of the one on the Chr.15 with smaller 15Sat III. All scale bars, 5 µm. DNA is counterstained with DAPI.
-
Figure 3—source data 1
Quantification of association rates between SNULs and different chromosomes in Figure 3C.
- https://cdn.elifesciences.org/articles/80684/elife-80684-fig3-data1-v2.zip
Figure 3—figure supplement 1

SNUL-1 is associated with the NOR of one Chr. 15 allele.
(A) RNA-FISH showing the distribution of SNUL-1 in WI-38 cells during mitosis. Arrows point at the prominent SNUL-1 cloud in early G1 daughter nuclei. Arrow heads point at the relatively weak SNUL-1 cloud in early G1 phase of daughter nuclei. Scale bars, 5 µm. (B) RNA-FISH of SNUL-1 and rRNA in early G1 daughter nuclei. Arrows point at the prominent SNUL-1 clouds. Arrow heads point at the relatively weak SNUL-1 clouds. Scale bars, 5 µm. (C) DNA-RNA-FISH to detect SNUL-1 RNA and 15CEN in early G1 hTRET-RPE1 daughter nuclei. Scale bars, 5 µm. (D) DNA-RNA-FISH to detect SNUL-1 RNA and Chr.15 in the nucleus. The two alleles of Chr.15 are marked by either probe painting the q-arms of the chromosome (IMR-90 cells), or 15CEN (hTRET-RPE1, MCH065, and HTD114 cells). (E) DNA-RNA-FISH to detect SNUL-2 RNA and Chr. 13 marked by the probe painting the q-arm of the chromosome in WI-38 nucleus. Scale bars, 5 µm. (F) Quantification of the association rates between SNUL-2 and Chr13. Data are presented as Mean ± SD from biological triplicates.>100 cells were counted for each of the biological repeats. (G) DNA-FISH showing the rDNA contents on Chr.15 in hTRET-RPE1 metaphase chromosomes. The two alleles of Chr.15 are marked by 15Sat III and 15CEN. rDNA arrays are detected by a probe within the IGS region. (H) Relative integrated density of the rDNA contents on the two Chr.15 rDNA arrays is calculated by dividing the measurement of the larger rDNA signal by the smaller rDNA cloud. Data are presented as Median and interquartile range. n=15. (I) Immuno-RNA & DNA-FISH showing SNUL-1 (green), Chr. 15 alleles (red) and UBF (blue) in early G1 phase WI-38 daughter nuclei. Scale bars, 5 µm (main images) and 2 µm (insets). (J) SNUL-1 localization and 5-FU incorporation in WI-38 telophase/early G1 daughter nuclei. Scale bars, 5 µm. DNA is counterstained with DAPI.
-
Figure 3—figure supplement 1—source data 1
Quantification of association rates between SNULs and different chromosomes in Figure 3—figure supplement 1F.
- https://cdn.elifesciences.org/articles/80684/elife-80684-fig3-figsupp1-data1-v2.zip
-
Figure 3—figure supplement 1—source data 2
Quantification of relative integrated density of the rDNA on the two Chr.15 alleles in Figure 3—figure supplement 1H.
- https://cdn.elifesciences.org/articles/80684/elife-80684-fig3-figsupp1-data2-v2.zip
Figure 4 with 1 supplement

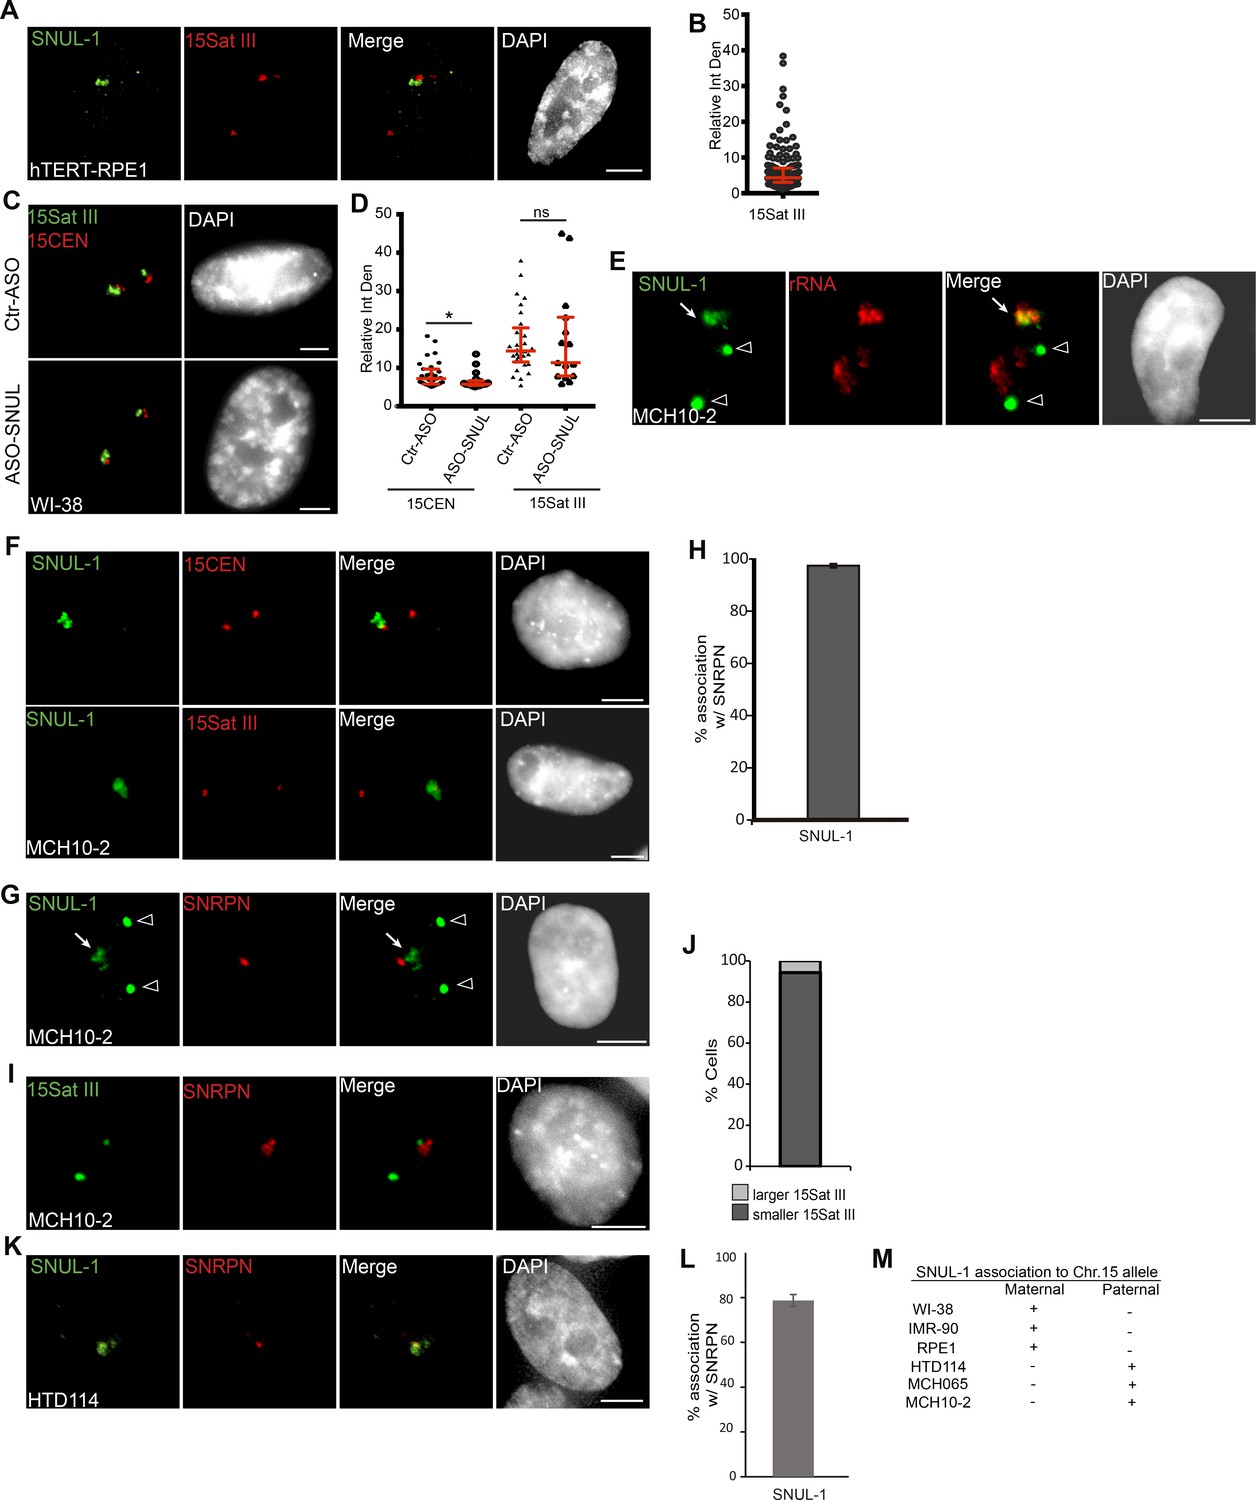
The SNUL-1 cloud displays mitotically-inherited random monoallelic association.
(A) Representative RNA-FISH images showing the association of SNUL-1 with the 15Sat III or 15CEN in WI-38 nuclei. (B) Plot showing the relative integrated density of the 15Sat III signal in WI-38 nuclei. The relative integrated density is calculated by dividing the measurement of the larger DNA-FISH signal by that of the smaller DNA-FISH signal. Data are presented as Median and interquartile range. n=60. (C) Representative RNA-FISH images showing the association of SNUL-1 cloud with 15Sat III or 15CEN in MCH065 nuclei. (D) Quantification of the association rates between SNUL-1 and the smaller 15Sat III in MCH065 nuclei. Data are presented as Mean ± SD from biological triplicates.>50 cells were counted for each of the biological repeats. (E) Representative RNA-FISH images showing the localization SNUL-1 along with the SNRPN and SPA2 transcription site on the paternal allele of Chr. 15 in WI-38 nucleus. Dotted lines mark the boundary of the nucleus. (F) Quantification of the association rate between SNUL-1 and the transcription sites of SNRPN and SPA2 in WI-38 cells. Data are presented as Mean ± SD from biological triplicates.>35 cells were counted for each of the biological repeats. (G) Representative RNA-FISH images showing the distribution of SNUL-1 (green) and SNUL-2 (red) in control and Aza-dC (500 nM) and TSA (80 nM) treated WI-38 nuclei. (H) Quantification of the percentage of cells showing one or two SNUL-1clouds in control and Aza +TSA-treated WI-38 cells. Data are presented as Mean ± SD from biological triplicates.>50 cells were counted for each of the biological repeats. Student’s unpaired two-tailed t-tests were performed. *p<0.05. (I), RNA-FISH to detect SNUL-1 clouds in control and Aza +TSA-treated WI-38 nuclei. Nucleoli are visualized by rRNA (red). (J) DNA-RNA-FISH of SNUL-1 RNA and 15CEN in control and Aza +TSA-treated WI-38 nuclei. (K) DNA-RNA-FISH to detect SNUL-1 RNA and 15Sat III in control and Aza +TSA-treated in WI-38 nuclei. All scale bars, 5 µm. DNA is counterstained by DAPI.
-
Figure 4—source data 1
Quantification in Figure 4D, F and H.
- https://cdn.elifesciences.org/articles/80684/elife-80684-fig4-data1-v2.zip
Figure 4—figure supplement 1
The SNUL-1 cloud displays mitotically-inherited random monoallelic association.
(A) DNA-RNA-FISH showing the localization SNUL-1 RNA cloud and 15Sat III in hTERT-RPE1 cell nucleus. (B) Plot showing the relative integrated density of the 15Sat III signals. Relative integrated density is calculated by dividing the score of the larger 15Sat III signal by that of the smaller 15Sat III signal. Data are presented as Median and interquartile range. n=149. (C) DNA-FISH to detect 15Sat III and 15CEN in Ctr and SNUL-depleted WI-38 nuclei. (D) Plot showing the relative integrated density of the 15Sat III or 5CEN signals in control and SNUL-depleted WI-38 cells. Relative integrated density is calculated by dividing the measurement of the larger DNA-FISH signal by that of the smaller DNA-FISH signal. Data are presented as Median and interquartile range. n=30. Mann-Whitney tests are performed. *p<0.05; ns, not significant. (E), RNA-FISH showing the distribution of SNUL-1 and rRNA in MCH2-10 nuclei. Arrows point at the SNUL-1 cloud. Arrowheads mark two non-nucleolar foci of unknown origin hybridized by the SNUL-1 probe only in MCH2-10 nuclei. (F) DNA-RNA-FISH of SNUL-1 RNA and 15CEN or 15Sat III in MCH2-10 IPSC nuclei. Please note that the SNUL-1 probe-hybridized non-nucleolar foci is observed only after RNA-FISH and not after RNA-DNA-FISH treatments. (G) Representative RNA-FISH image showing the localization of SNUL-1 cloud and SNRPN transcription site in MCH2-10 IPSC nucleus. Arrows point at the SNUL-1 cloud. Arrowheads mark two non-nucleolar foci of unknown origin hybridized by the SNUL-1 probe only in MCH2-10 nuclei. (H) Quantification of the association rates between SNUL-1 and SNRPN in MCH2-10 IPSCs. Data are presented as Mean ± SEM from biological triplicates.>50 cells were counted for each of the biological repeats. (I) Representative DNA-RNA-FISH image to detect SNRPN RNA and 15Sat III in MCH2-10 nucleus. (J) Quantification of the association rates between SNRPN RNA signal and the smaller and larger 15Sat III in MCH2-10 cells.>100 cells were counted. (K) Representative RNA-FISH image showing the localization of SNUL-1 cloud and SNRPN transcription site in HTD114 cells. (L) Quantification of the association rates between SNUL-1 and SNRPN in HTD114 cells. Data are presented as Mean ± SEM from biological duplicates.>80 cells were counted for each of the biological repeats. (M) SNUL-1 association to Chr.15 allele in different cell lines. All scale bars, 5 µm. DNA is counterstained with DAPI.
-
Figure 4—figure supplement 1—source data 1
Quantification in Figure 4—figure supplement 1B,D,H and J.
- https://cdn.elifesciences.org/articles/80684/elife-80684-fig4-figsupp1-data1-v2.zip
Figure 5 with 7 supplements
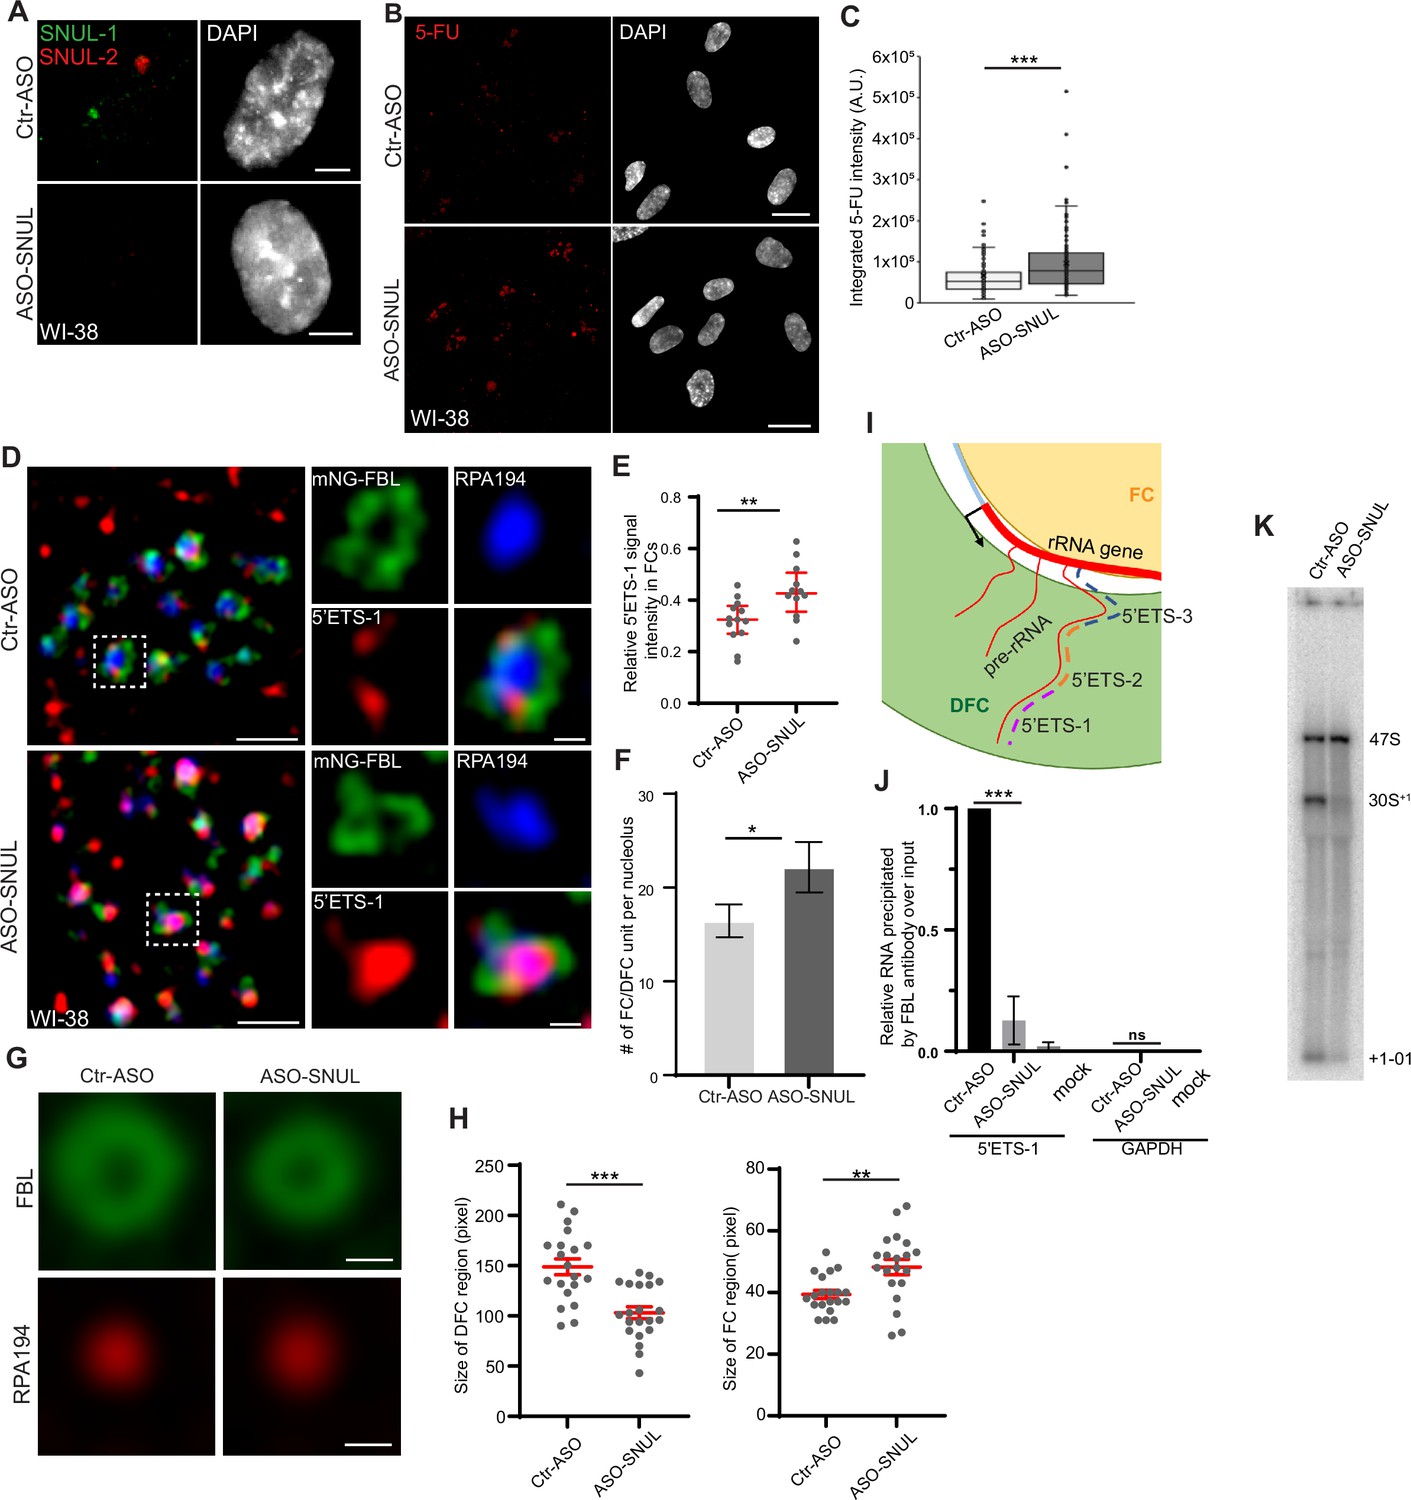
SNUL-1 influences rRNA biogenesis.
(A) RNA-FISH of SNUL-1 (green) and SNUL-2 (red) in WI-38 cells transfected with ctr-ASO or ASO-SNUL oligonucleotides. (B) 5-FU immunostaining in control and SNUL-depleted WI-38 cells. Scale bars, 5 µm. Ctr-ASO and ASO-SNUL-treated cells were pulse labeled by 5-FU for 20 min. Scale bars, 20 µm. (C) Boxplots of integrated 5-FU intensity per nucleus in control and SNUL-depleted WI-38 cells. Center line, median; box limits, upper and lower quartiles; whiskers, maximum or minimum of the data. Mann-Whitney test is performed. n=100. *p<0.05, **p<0.01, ***p<0.001. (D), SIM image of a single nucleolus showing the nascent pre-rRNA detected by 5’ETS-1 probe (red) in Ctr and SNUL-depleted cells. DFC is marked by mNG-FBL (green) and FC is marked by RPA194 (blue). Scale bars, 1 µm (main images) and 200 nm (insets). (E), Quantification of relative 5’ETS-1 intensity in FC of nucleolus in Ctr-ASO and ASO-SNUL cells. Center line, median. Mann-Whitney test is performed. **p<0.01.>50 DFC/FC units from 10 to 15 nucleoli were counted for each sample. (F) Quantification of the average number of FC/DFC unit per nucleolus in control and SNUL-depleted WI-38 cells. Data are presented as Mean ± SEM from nine biological repeats.>15 nucleoli were counted from each experiment. *p<0.05. (G) Averaged images of FC or DFC unit in control and SNUL-depleted WI38 cells. DFC is marked by FBL and FC is marked by RPA194. Scale bars, 200 nm. (H) Quantification of FC and DFC unit sizes in control and SNUL-depleted WI-38 cells. Data are presented as Mean ± SEM. Center line, median. Mann-Whitney test is performed. **p<0.01, ***p<0.001. 20 DFC/FC units from different cells were counted. (I) Schematic showing the sorting of pre-rRNA in DFC/FC unit. The position of the 5’ETS regions are marked. (J) Relative 5’ETS-1 precipitated by FBL antibody in control and SNUL-depleted WI-38 cells, ***p<0.001. (K) Northern blot using 5-ETS-1 probe from total RNA isolated from control and SNUL-depleted WI-38 cells.
-
Figure 5—source data 1
Quantification in Figure 5C, E, F and H.
- https://cdn.elifesciences.org/articles/80684/elife-80684-fig5-data1-v2.zip
-
Figure 5—source data 2
Uncropped image of Northern Blot in Figure 5J.
- https://cdn.elifesciences.org/articles/80684/elife-80684-fig5-data2-v2.zip
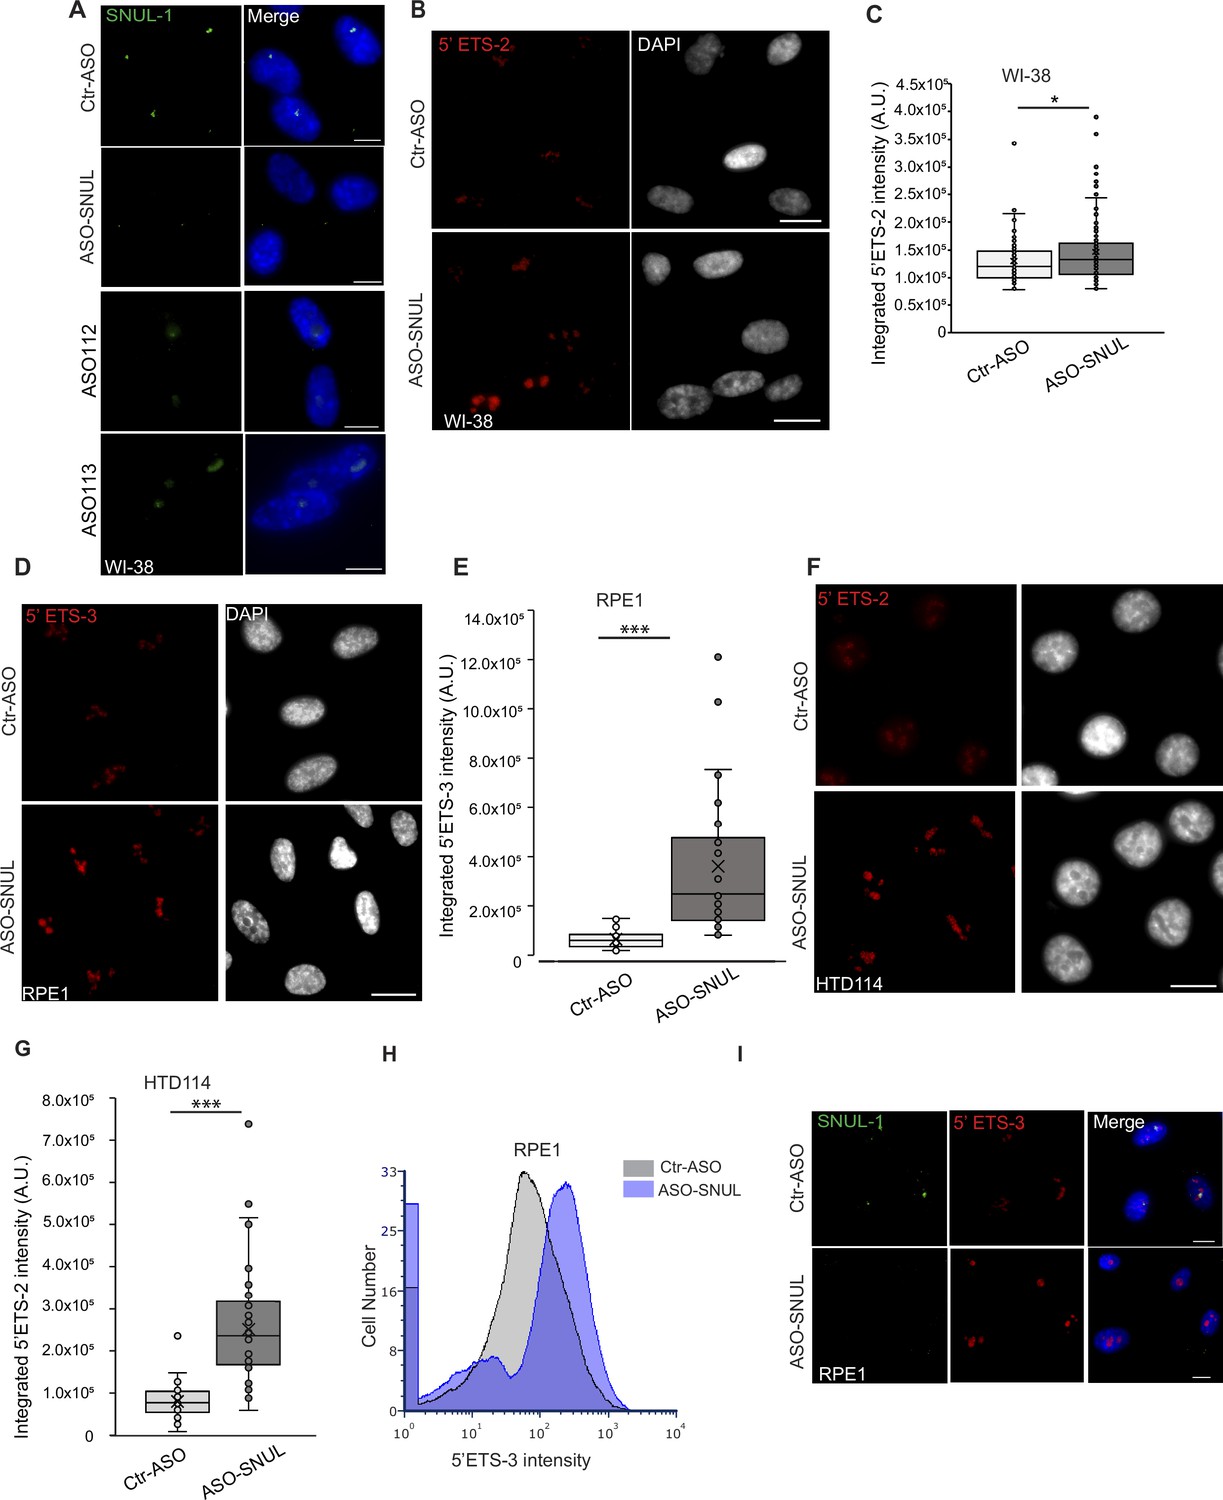
Figure 5—figure supplement 1
SNUL-1 influences rRNA biogenesis.
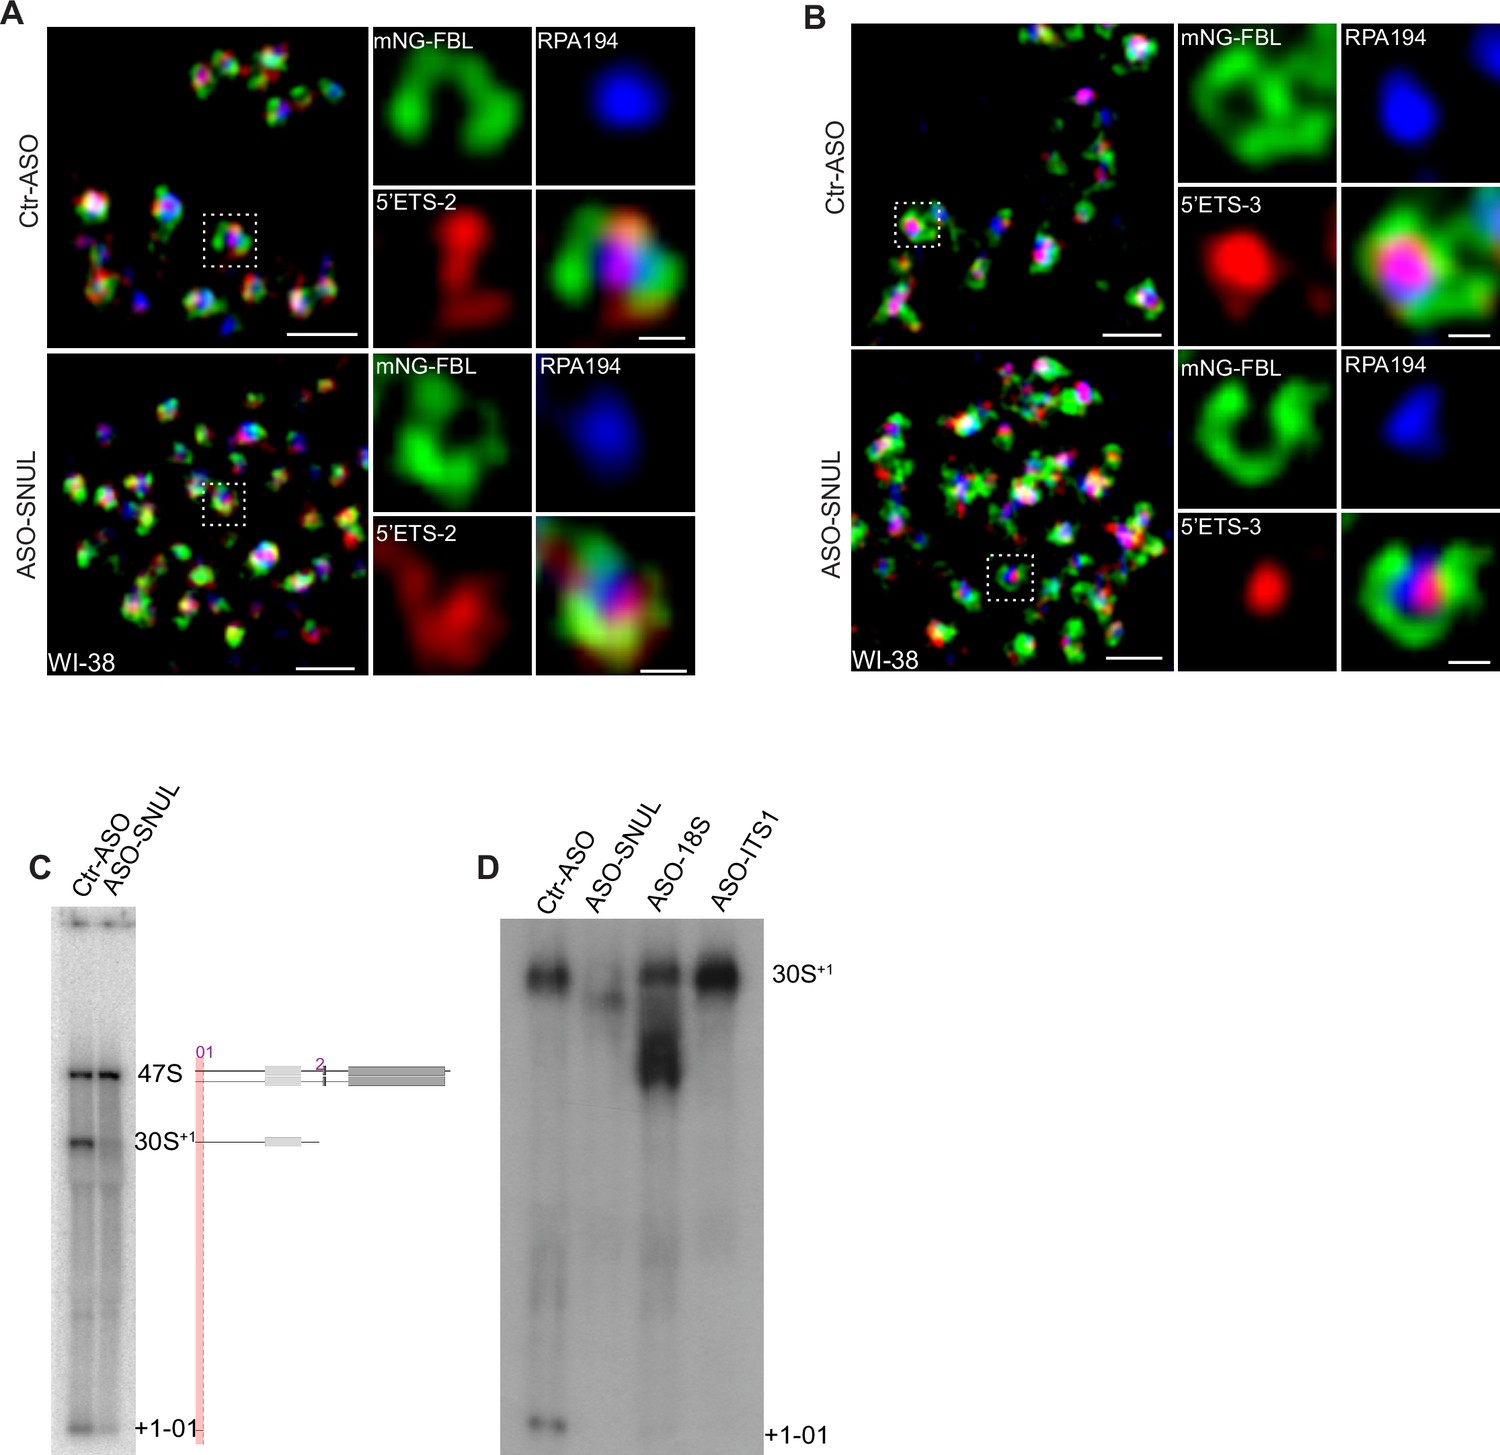
(A) Representative SNUL-1 RNA FISH in Ctr-ASO, ASO-SNUL, and ASOs targeting individual SNUL-1 CS candidates-treated cells (ASO112 and 113). Scale bars, 10 µm. (B) Representative RNA-FISH images showing nascent pre-rRNA levels (detected by 5’ ETS-2 probe) in control and SNUL-depleted cells. Scale bars, 20 µm. (C) Boxplots of integrated 5’ETS-2 intensity per nucleus in Ctr-ASO and ASO-SNUL-treated cells. Center line, median; box limits, upper and lower quartiles; whiskers, maximum or minimum of the data. Mann-Whitney test is performed. n=100 *p<0.05. (D) Representative RNA-FISH images showing nascent pre-rRNA levels (detected by 5’ ETS-3 probe) in control and SNUL-depleted RPE1 cells. Scale bars, 20 µm. (E) Boxplots of integrated 5’ETS-3 intensity per nucleus in Ctr-ASO and ASO-SNUL-treated cells. ***p<0.001. (F) Representative RNA-FISH images showing nascent pre-rRNA levels (detected by 5’ ETS-2 probe) in control and SNUL-depleted HTD114 cells. Scale bars, 20 µm. (G) Boxplots of integrated 5’ETS-2 intensity per nucleus in Ctr-ASO and ASO-SNUL-treated cells. ***p<0.001. (H), Nascent pre-rRNA levels (detected by 5’ ETS-3 probe) in control and SNUL-depleted RPE1 cells detected by RNA-FISH FLOW. (I) SIM image of a single nucleolus showing the nascent pre-rRNA detected by 5’ETS-2 probe (red) in Ctr and SNUL-depleted cells. DFC is marked by mNG-FBL (green) and FC is marked by RPA194 (blue). Scale bars, 1 µm (main images) and 200 nm (insets). (I) co-RNA-FISH to detect SNUL-1 (green) and pre-rRNA (5’ETS-3; red) in control and ASO-SNUL incubated cells. Note that the RNA-FISH is performed after heat-denaturing the cells post fixing and stringent washes to remove the bound ASOs. Scale bars, 15 µm.
-
Figure 5—figure supplement 1—source data 1
Quantification of pre-rRNA signal intensities in different cell lines, related to Figure 5—figure supplement 1C,E,G.
- https://cdn.elifesciences.org/articles/80684/elife-80684-fig5-figsupp1-data1-v2.zip
Figure 5—figure supplement 2
SNUL-1 influences rRNA biogenesis.
(A) SIM image of a single nucleolus showing the nascent pre-rRNA detected by 5’ETS-2 probe (red) in Ctr and SNUL-depleted cells. DFC is marked by mNG-FBL (green) and FC is marked by RPA194 (blue). Scale bars, 1 µm (main images) and 200 nm (insets). (B) SIM image of a single nucleolus showing the nascent pre-rRNA detected by 5’ETS-3 probe (red) in Ctr and SNUL-depleted cells. DFC is marked by mNG-FBL (green) and FC is marked by RPA194 (blue). Scale bars, 1 µm (main images) and 200 nm (insets). (C) Northern blot (presented in Figure 5I showing the schematics of the pre-rRNA species that are detected by 5’ETS-1 probe in control and SNUL-depleted cells). (D) Northern blot by 5’ETS-1 probe in control, SNUL-depleted, 18S-depleted and ITS-1 depleted cells.
-
Figure 5—figure supplement 2—source data 1
Uncropped image of Northern Blot in 1511 Figure 5—figure supplement 2C and D.
- https://cdn.elifesciences.org/articles/80684/elife-80684-fig5-figsupp2-data1-v2.zip
Figure 5—figure supplement 3

SNULs influence Chr.15 replication timing.
(A-B) Representative images of replication timing-specific hybridization (ReTiSH) showing the replication timing of rDNA regions in HTD114 control and SNUL-depleted cells. HTD114 cells are labeled with BrdU for 6 or 14 hr prior to harvest and probes targeting rDNA (green) and 15CEN (red) regions are used. (C) The relative integrated density of the rDNA signals on the two Chr.15 rDNA arrays is calculated by dividing the measurement of the rDNA signal with larger 15CEN by the one on the rDNA region with smaller 15CEN. Data are presented as Median and interquartile range. n>15.
-
Figure 5—figure supplement 3—source data 1
Quantification of ReTiSH assay showing the relative integrated density of the rDNA signal on the two Chr.15 alleles, related to Figure 5—figure supplement 3C.
- https://cdn.elifesciences.org/articles/80684/elife-80684-fig5-figsupp3-data1-v2.zip
Figure 5—figure supplement 4
SNULs influence Chr.15 replication timing.
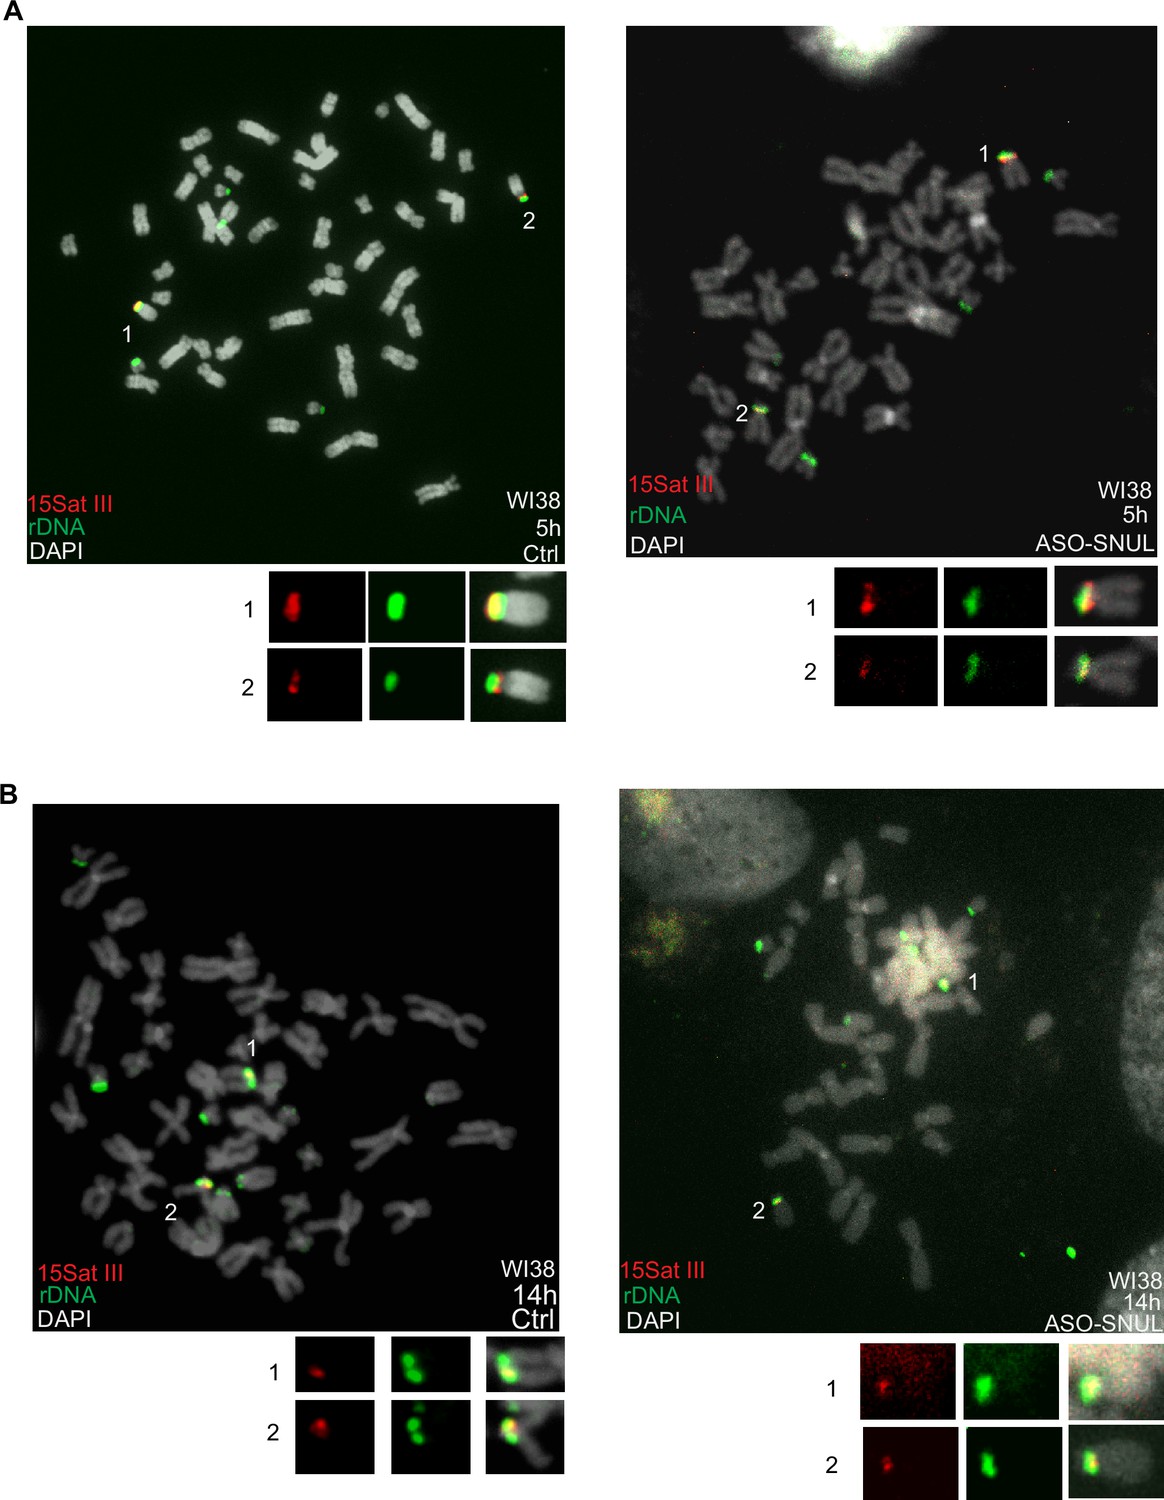
(A-B) Representative images of ReTiSH showing the replication timing of rDNA regions in WI38 control and SNUL-depleted cells. WI38 cells are labeled with BrdU for 5 or 14 hr prior to harvest and probes targeting rDNA (green) and 15Sat III (red) regions are used.
Figure 5—figure supplement 5

SNULs influence Chr.15 replication timing.
(A-B) Representative images of EdU staining followed by rDNA and 15CEN DNA FISH in HTD114 control and SNUL-depleted cells. Cells are synchronized by double thymidine block and released at different time points. EdU is added to medium 30 min before collecting the cells. The cells in different stages of S phase are imaged. For middle and late S phase, the cells show association between rDNA and EdU and cells show no association between rDNA and EdU are selected. White circle indicates rDNA signal proximal to 15CEN. Note: in HTD114 cells, maternal allele of Cen15 shows a larger 15CEN signal cloud than paternal allele. (C) Quantification of the association rates between EdU signal and rDNA signal proximal to 15CEN in HTD114 cells. Data are presented as Mean ± SEM from three biological repeats. >40 nucleoli were counted for each of the biological repeats. *p<0.05.
Figure 5—figure supplement 6
rDNA clusters do not show allele-specific histone modifications.
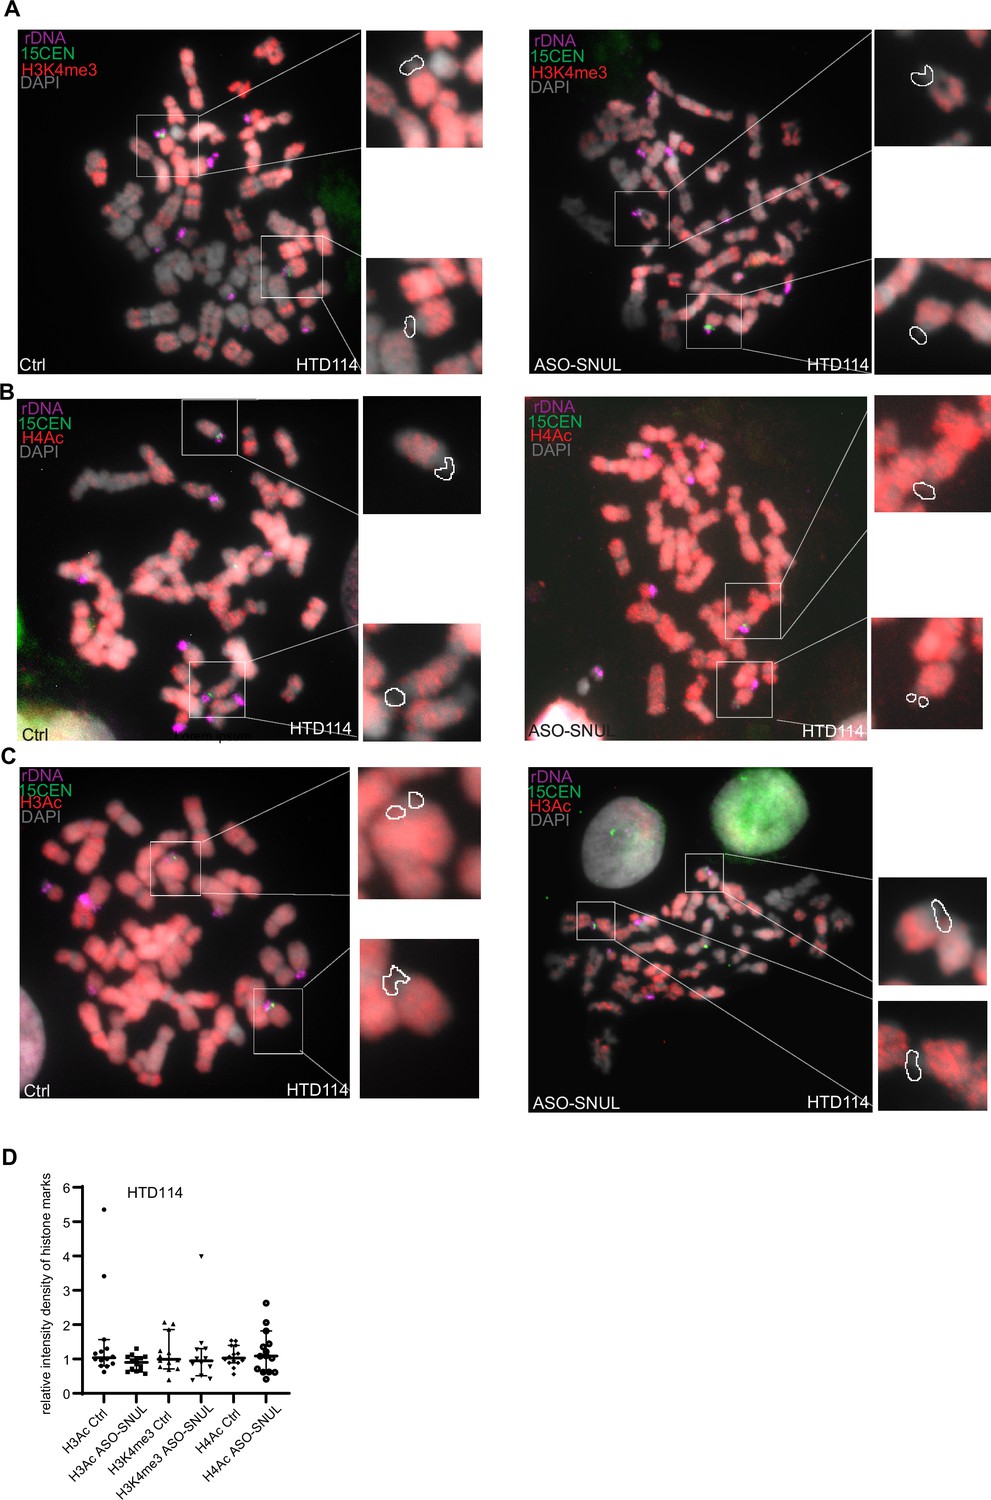
(A-C) Representative images of active histone marks (H3K4me3, H4Ac AND H3Ac) distribution in HTD114 Ctrl and SNUL-depleted metaphase spreads. DNA-FISH is performed to detect rDNA (magenta) and 15CEN (green). (D) Relative integrated density of histone mark on the two Chr. 15 rDNA regions is calculated by dividing the measurement of the histone mark signal on the rDNA region with larger 15CEN by that of the one on the rDNA region with small 15CEN. Data are presented as Median and interquartile range. n>12.
-
Figure 5—figure supplement 6—source data 1
Quantification of histone mark signal intensities on Chr.15 alleles in HTD114 cell line, related to Figure 5—figure supplement 6D.
- https://cdn.elifesciences.org/articles/80684/elife-80684-fig5-figsupp6-data1-v2.zip
Figure 5—figure supplement 7
rDNA clusters do not show allele-specific histone modifications.
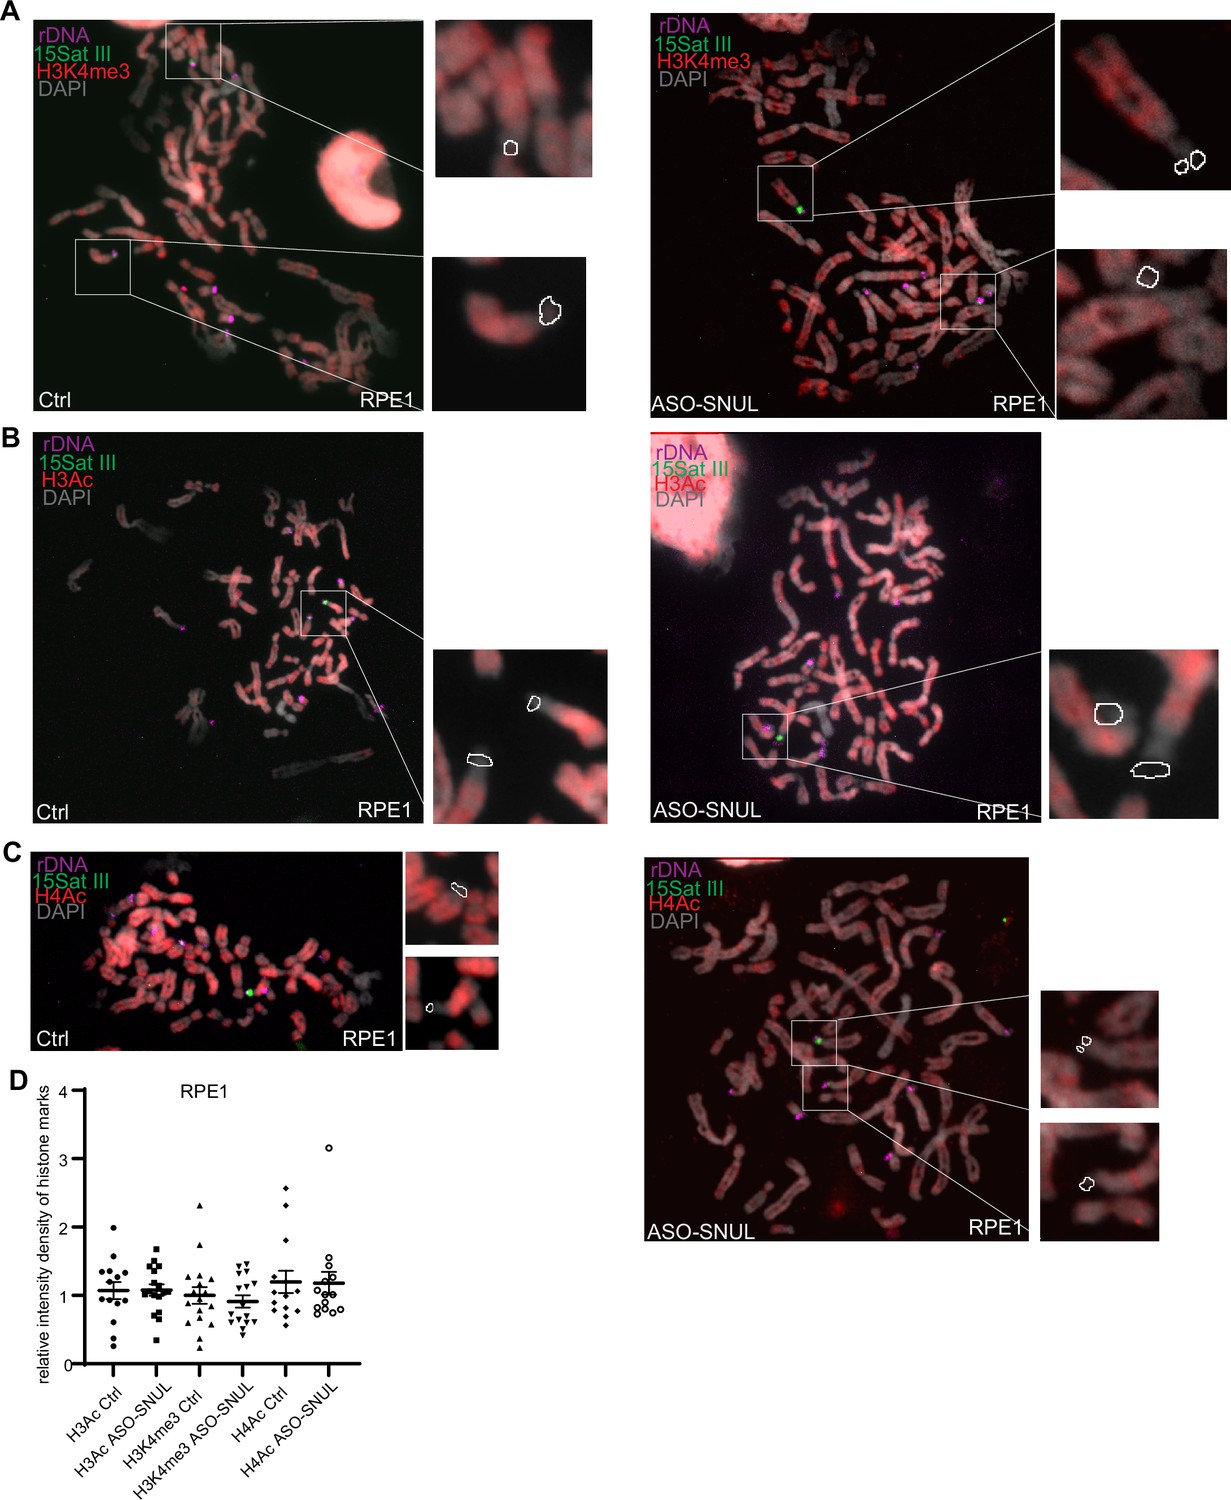
(A-C) Representative images of active histone marks (H3K4me3, H3Ac AND H4Ac) distribution in RPE1 Ctrl and SNUL-depleted metaphase spreads. DNA-FISH is performed to detect rDNA (magenta) and 15Sat III (green). (D) Relative integrated density of histone mark on the two Chr. 15 rDNA regions is calculated by dividing the measurement of the histone mark signal on the rDNA region with larger 15Sat III by that of the one on the rDNA region with small 15Sat III. Data are presented as Median and interquartile range. n>12.
-
Figure 5—figure supplement 7—source data 1
Quantification of histone mark signal intensities on Chr.15 alleles in RPE1 cell line, related to Figure 5—figure supplement 7D.
- https://cdn.elifesciences.org/articles/80684/elife-80684-fig5-figsupp7-data1-v2.zip
Author response image 1

RNA-FISH (green) using unique probes designed from the chr.
17 RNA (without including the repeat) in WI-38 cells showed the absence of SNUL-1 cloud in the nucleolus.
Tables
Author response table 1
| QUERY | nucDNA1_PK_combo__HQ_transcript/2305 |
|---|---|
| SCORE | 1743 |
| START | 2 |
| END | 2523 |
| QSIZE | 3003 |
| IDENTITY | 88.4% |
| CHROM | chr13 |
| STRAND | + |
| Ref_START | 9250197 |
| Ref_END | 9252367 |
| SPAN | 2171 |
Additional files
-
Supplementary file 1
Sequence of the SNUL-1 probe.
Please see the Excel file
- https://cdn.elifesciences.org/articles/80684/elife-80684-supp1-v2.xlsx
-
Supplementary file 2
The CS candidate sequences.
Please see the Excel file
- https://cdn.elifesciences.org/articles/80684/elife-80684-supp2-v2.xlsx
-
Supplementary file 3
The dissimilarity score between each isoform and its best match from human transcript database.
For each isoform the empirical p-value is the empirical probability of observing a dissimilarity score greater than or equal to its dissimilarity score. The product of the 5 p-values being in the order of rejects the hypothesis of all isoforms being the transcripts of the same known gene.
- https://cdn.elifesciences.org/articles/80684/elife-80684-supp3-v2.xlsx
-
Supplementary file 4
The pairwise dissimilarity for the isoforms.
The pairwise dissimilarity for the isoforms. Global pairwise alignment was used to compute the dissimilarity score for each pair of isoforms. The dissimilarity score was computed by taking the ratio of mismatching to matching sites where both isoforms do not contain gaps. For each pair of isoforms, the p-value shows the probability of observing a dissimilarity score greater than or equal to their dissimilarity by approximating the empirical distribution of pairwise dissimilarity with erlang distribution.
- https://cdn.elifesciences.org/articles/80684/elife-80684-supp4-v2.xlsx
-
Supplementary file 5
Probes used in this study.
Please see the Excel file.
- https://cdn.elifesciences.org/articles/80684/elife-80684-supp5-v2.xlsx
-
MDAR checklist
- https://cdn.elifesciences.org/articles/80684/elife-80684-mdarchecklist1-v2.docx
Download links
A two-part list of links to download the article, or parts of the article, in various formats.
Downloads (link to download the article as PDF)
Open citations (links to open the citations from this article in various online reference manager services)
Cite this article (links to download the citations from this article in formats compatible with various reference manager tools)
Monoallelically expressed noncoding RNAs form nucleolar territories on NOR-containing chromosomes and regulate rRNA expression
eLife 13:e80684.
https://doi.org/10.7554/eLife.80684


