Cardiac electrophysiological remodeling associated with enhanced arrhythmia susceptibility in a canine model of elite exercise
- Department of Pharmacology and Pharmacotherapy, University of Szeged, Hungary
- ELKH-SZTE Research Group for Cardiovascular Pharmacology, Eötvös Loránd Research Network, Hungary
- Centre for Translational Medicine and Institute of Pancreatic Diseases, Semmelweis University, Hungary
- Institute for Translational Medicine, Medical School, University of Pécs, Hungary
- Translational Pancreatology Research Group, Interdisciplinary Centre of Excellence for Research Development and Innovation, University of Szeged, Hungary
- Institute of Family Medicine, University of Szeged, Hungary
- Department of Pharmacology and Pharmacotherapy, Interdisciplinary Excellence Centre, University of Szeged, Hungary
- Department of Internal Medicine, Cardiology ward, University of Szeged, Hungary
Figures
Figure 1
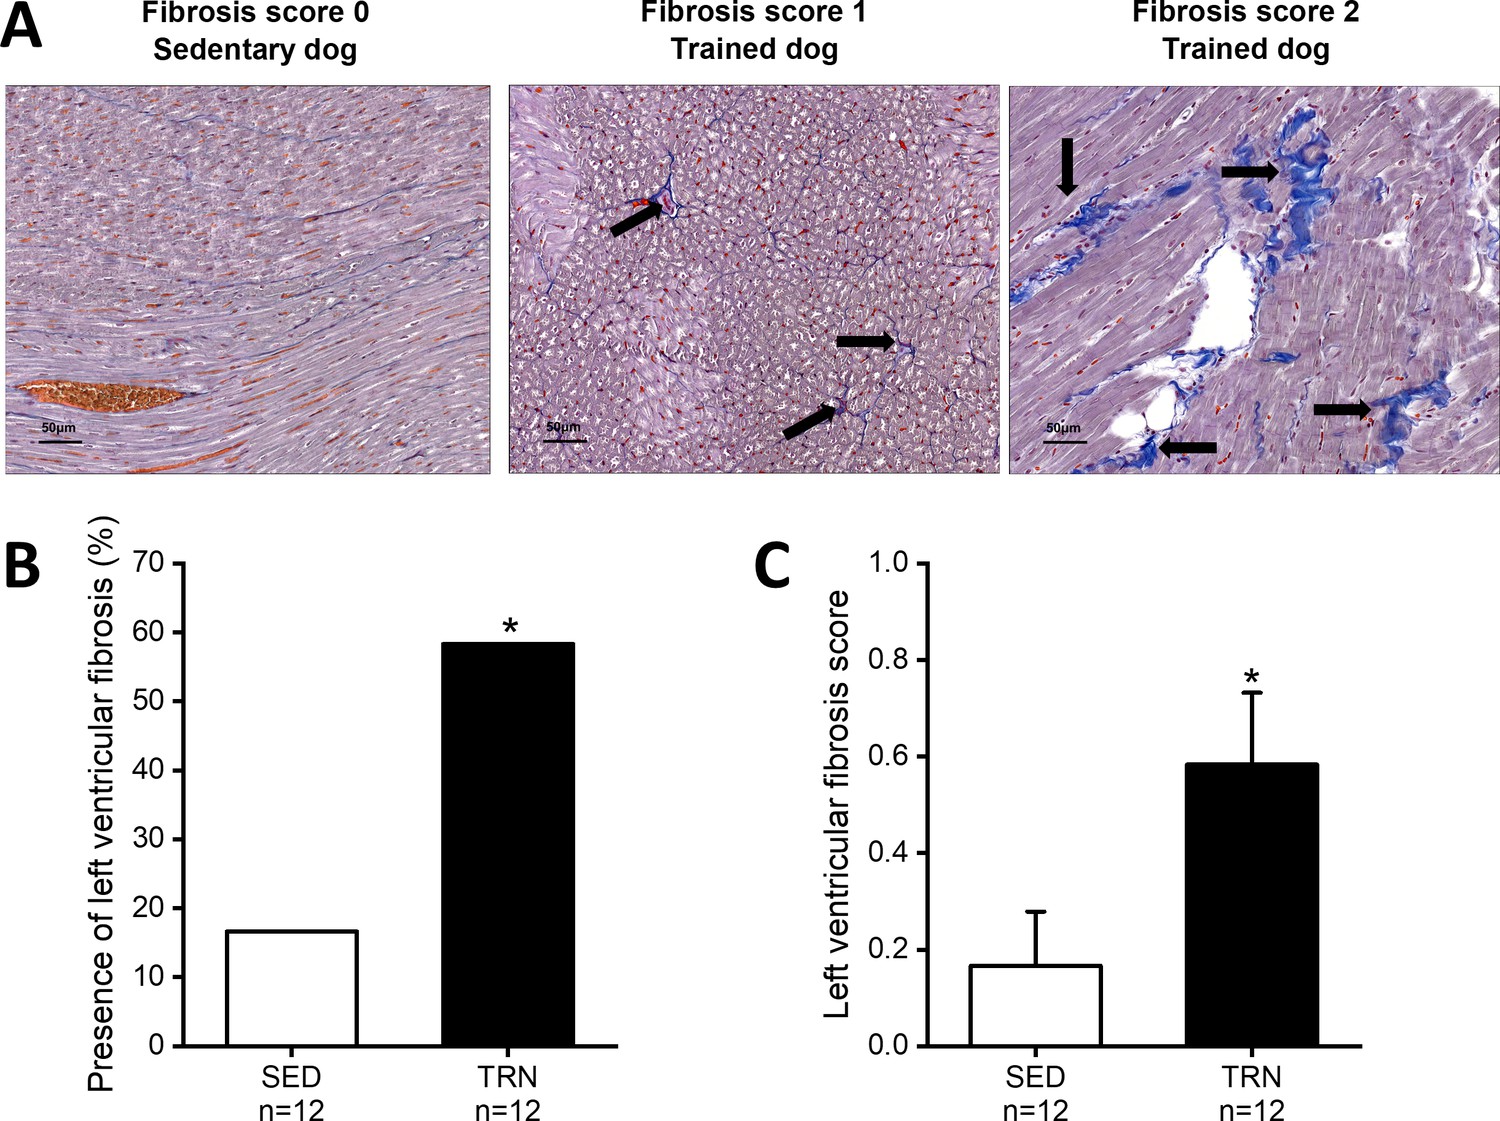
Increased level of myocardial fibrosis in the canine left ventricle.
(A) Representative histological images of left ventricular free-wall connective tissue visualized by Crossmon’s trichrome staining taken from SED dogs (fibrosis score 0=negative outcome) and the TRN dogs (fibrosis score 1=mild and fibrosis score 2=moderate level of fibrosis). Black arrows indicate the presence of fibrosis. (B) Bar chart showing the incidence of fibrosis, expressed as the percentage of the total number of animals, irrespective of the degree of fibrosis. (C) Bar chart estimating the amount of scarring via fibrosis scoring in SED and TRN dogs. The ‘n’ numbers refer to the number of dogs included. Data are expressed as mean ± SEM. *p<0.05 ‘TRN’ vs. ‘SED’ group at 16th week by chi-square test.
-
Figure 1—source data 1
The effect of chronic endurance training on the incidence of fibrosis.
- https://cdn.elifesciences.org/articles/80710/elife-80710-fig1-data1-v2.zip
-
Figure 1—source data 2
The effect of chronic endurance training on the level of fibrosis.
- https://cdn.elifesciences.org/articles/80710/elife-80710-fig1-data2-v2.zip
Figure 2
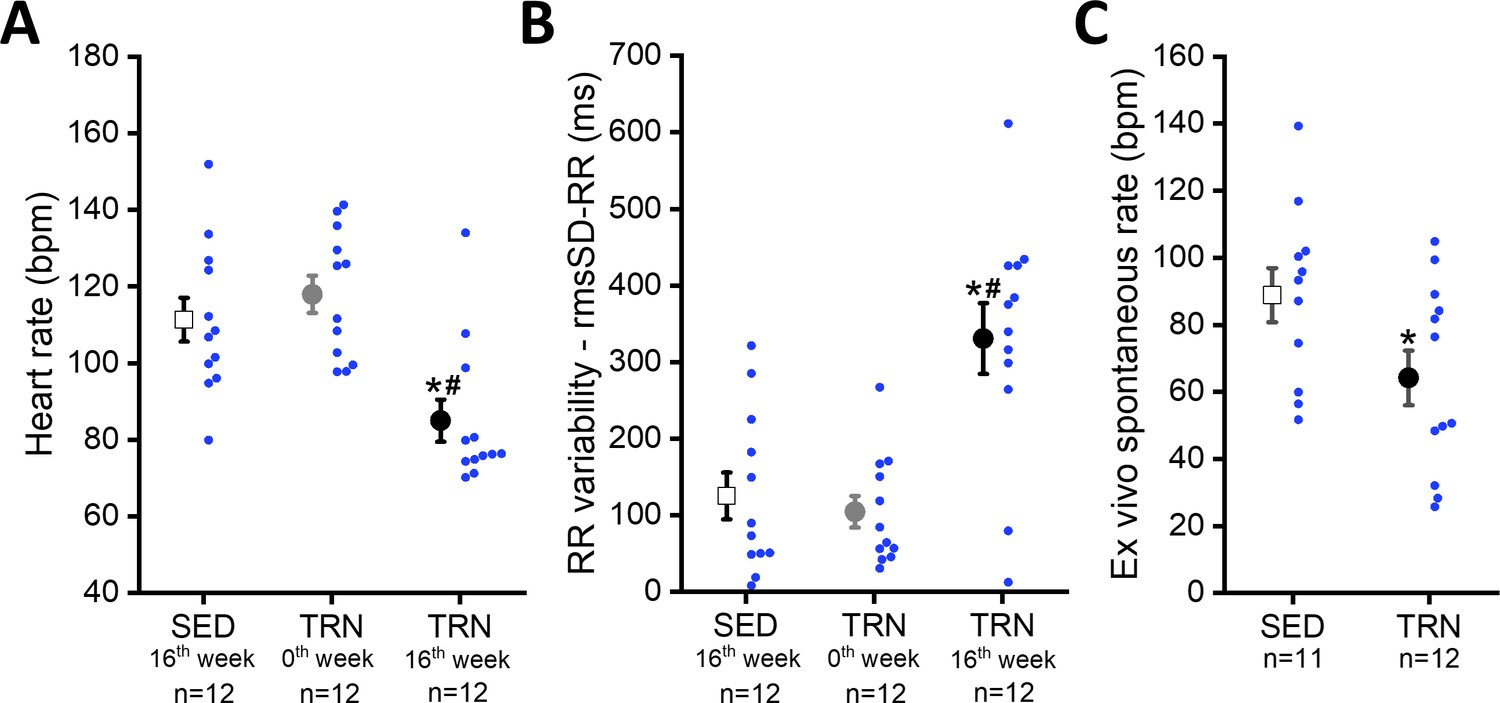
Effect of sustained training on heart rate and heart rate variability in conscious dogs and on spontaneous beating rate in isolated right atrial tissue preparations.
(A) Demonstrates the bradycardia and (B) demonstrates the heart rate variability values of conscious dogs in the SED group at the end of the training protocol (at 16th week; n=12 dogs), in the TRN group before the chronic endurance training (at 0th week; n=12), and in the TRN group after the chronic endurance training (at 16th week; n=12 dogs). RmsSD-RR, root mean square of Successive Differences of RR interval. (C) The spontaneous beating rate in isolated right atrial tissue preparations obtained from SED (n=11) dogs and TRN (n=12) dogs. The ‘n’ numbers refer to the number of dogs included. Data are expressed as mean ± SEM. Blue dots represent individual data. *p<0.05 ‘TRN’ vs. ‘SED’ group at 16th week by unpaired Student's t-test. #p<0.05 ‘TRN’ group at 16th week vs. ‘TRN’ group at 0th week by paired Student's t-test.
-
Figure 2—source data 1
Effect of chronic sustained training on the heart rate in conscious dogs.
- https://cdn.elifesciences.org/articles/80710/elife-80710-fig2-data1-v2.zip
-
Figure 2—source data 2
Effect of chronic sustained training on the RR variability in conscious dogs.
- https://cdn.elifesciences.org/articles/80710/elife-80710-fig2-data2-v2.zip
-
Figure 2—source data 3
Effect of chronic sustained training on the spontaneous beating rate in isolated right atrial tissue preparations.
- https://cdn.elifesciences.org/articles/80710/elife-80710-fig2-data3-v2.zip
Figure 3

Incidence of ventricular extra beats and ventricular fibrillation in sedentary and trained dogs after the 16-week-long vigorous training.
(A) Representative ECG recordings of escape beats and increased R–R interval variability at rest in a conscious TRN dog at 16th week. (B) Bar chart plotting the increased incidence of different ventricular extra beats (premature and escape) at rest in the TRN group vs. SED group at 16th week. (C) Reports the average of premature and ventricular escape beats across animals at rest in conscious SED and TRN dogs at 16th week. (D) Representative burst pacing ECG image in anesthetized SED and TRN dogs at 16th week. (E) Bar chart plotting the increased incidence of ventricular fibrillation (VF) in the TRN group vs. SED group following burst arrhythmia provocation. The ‘n’ numbers refer to the number of dogs included. Data are expressed as mean ± SEM. Blue dots represent individual data. *p<0.05 ‘TRN’ vs. ‘SED’ group at 16th week by Mann-Whitney U test.
-
Figure 3—source data 1
The incidence of ventricular extra beats in conscious trained and sedentary dogs at 16th week.
- https://cdn.elifesciences.org/articles/80710/elife-80710-fig3-data1-v2.zip
-
Figure 3—source data 2
The number of ventricular extra beats in conscious trained and sedentary dogs at 16th week.
- https://cdn.elifesciences.org/articles/80710/elife-80710-fig3-data2-v2.zip
-
Figure 3—source data 3
The incidence of ventricular fibrillation in anesthetized trained and sedentary dogs at 16th week.
- https://cdn.elifesciences.org/articles/80710/elife-80710-fig3-data3-v2.zip
Figure 4
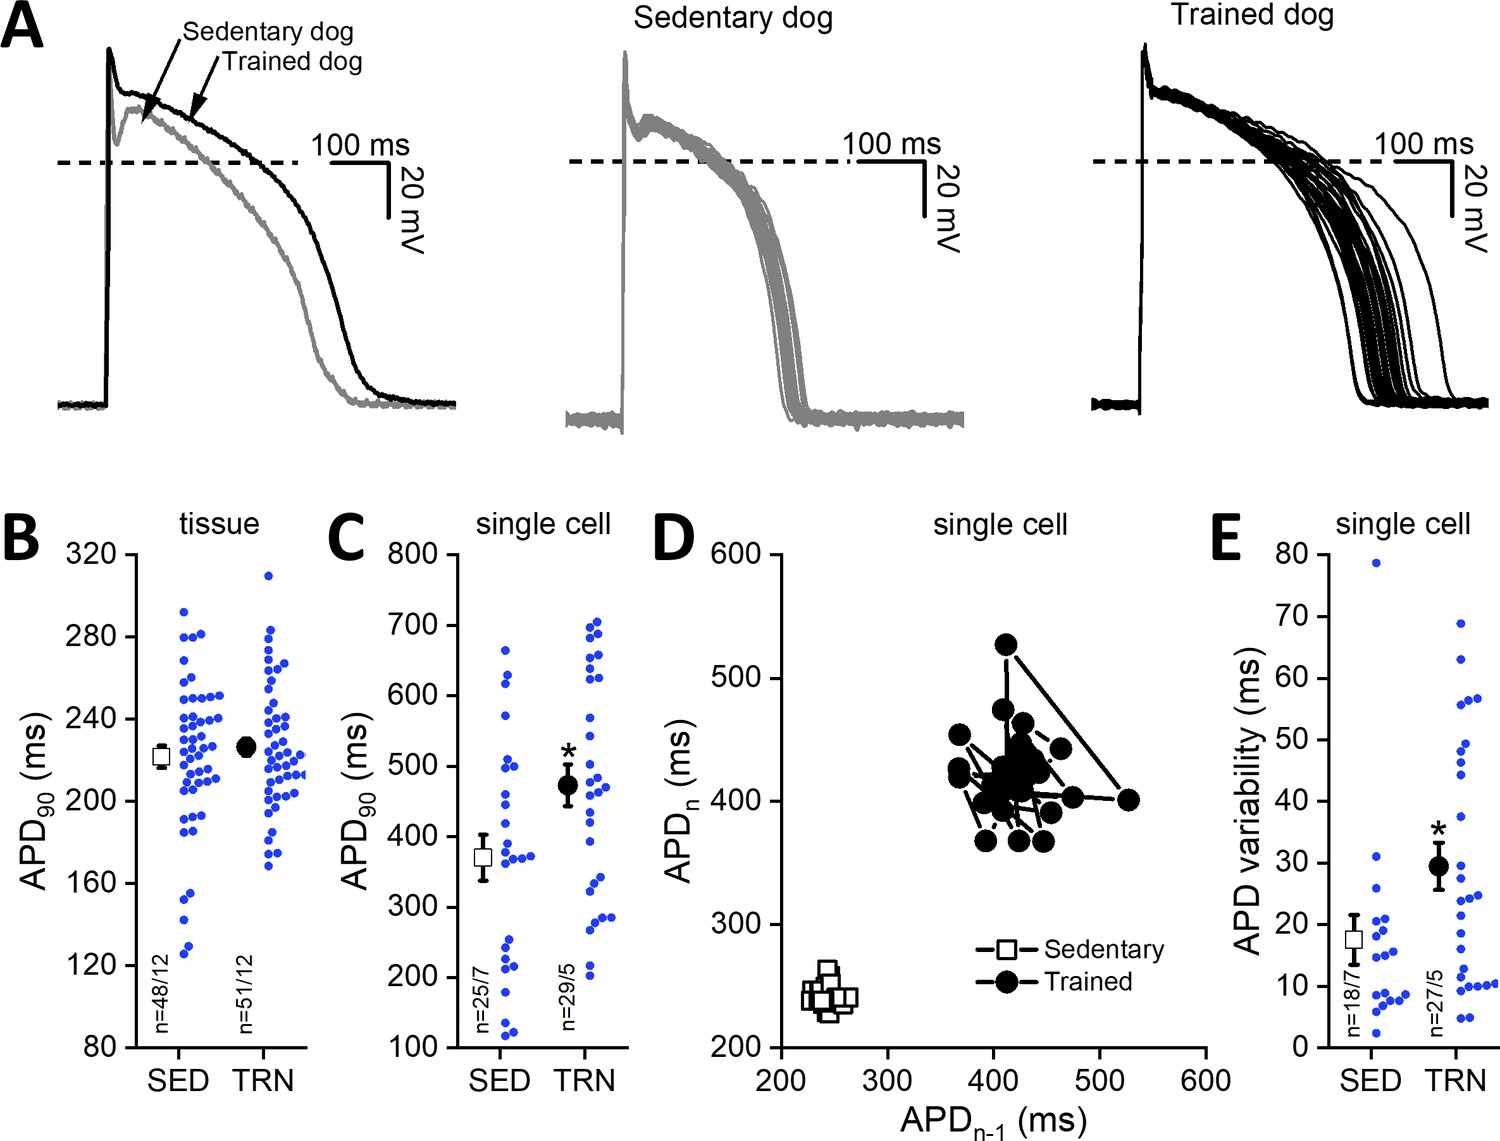
Effects of long-term sustained training on cardiac action potential duration and short-term variability in left ventricular preparations of sedentary and trained dogs.
Left panel of (A) representative action potential curves recorded from isolated left ventricular myocytes of SED and TRN dogs, showing the prolonged action potential duration in TRN dog. Central (SED) and right (TRN) panels of (A) 30–30 representative action potential curves indicating the increased variability of the action potential duration in TRN animals recorded from ventricular myocytes, respectively. (B) Graph showing the action potential duration measured at 90% repolarization (APD90) in SED and TRN dogs recorded from papillary muscle (multicellular tissue preparations; n=48 preparations/12 dogs in SED and n=51 preparations/12 dogs in TRN groups). (C) Graph showing the prolonged APD90 of enzymatically isolated left ventricular single myocytes in TRN dogs (n=25 cells/7 dogs in SED and n=29 cells/5 dogs in TRN groups). (D) Representative Poincare plot of increased APD90 variability. (E) Effect of long-term sustained training on APD90 variability of a single left ventricular myocyte (n=18 cells/7 dogs in SED and n=27 cells/5 dogs in TRN groups). The ‘n’ numbers refer to the number of preparations or cells followed by the number of dogs from which preparations or cells were obtained. Data are expressed as mean ± SEM. Blue dots represent individual data. *p<0.05 ‘TRN’ vs. ‘SED’ group at 16th week by unpaired Student's t-test.
-
Figure 4—source data 1
Effect of sustained training on the cardiac action potential duration (APD90) obtained from multicellular tissue preparations.
- https://cdn.elifesciences.org/articles/80710/elife-80710-fig4-data1-v2.zip
-
Figure 4—source data 2
Effect of sustained training on the cardiac action potential duration (APD90) obtained from left ventricular single myocytes.
- https://cdn.elifesciences.org/articles/80710/elife-80710-fig4-data2-v2.zip
-
Figure 4—source data 3
Effect of sustained training on the short-term variability of the action potential duration obtained from left ventricular single-cell myocytes.
- https://cdn.elifesciences.org/articles/80710/elife-80710-fig4-data3-v2.zip
Figure 5
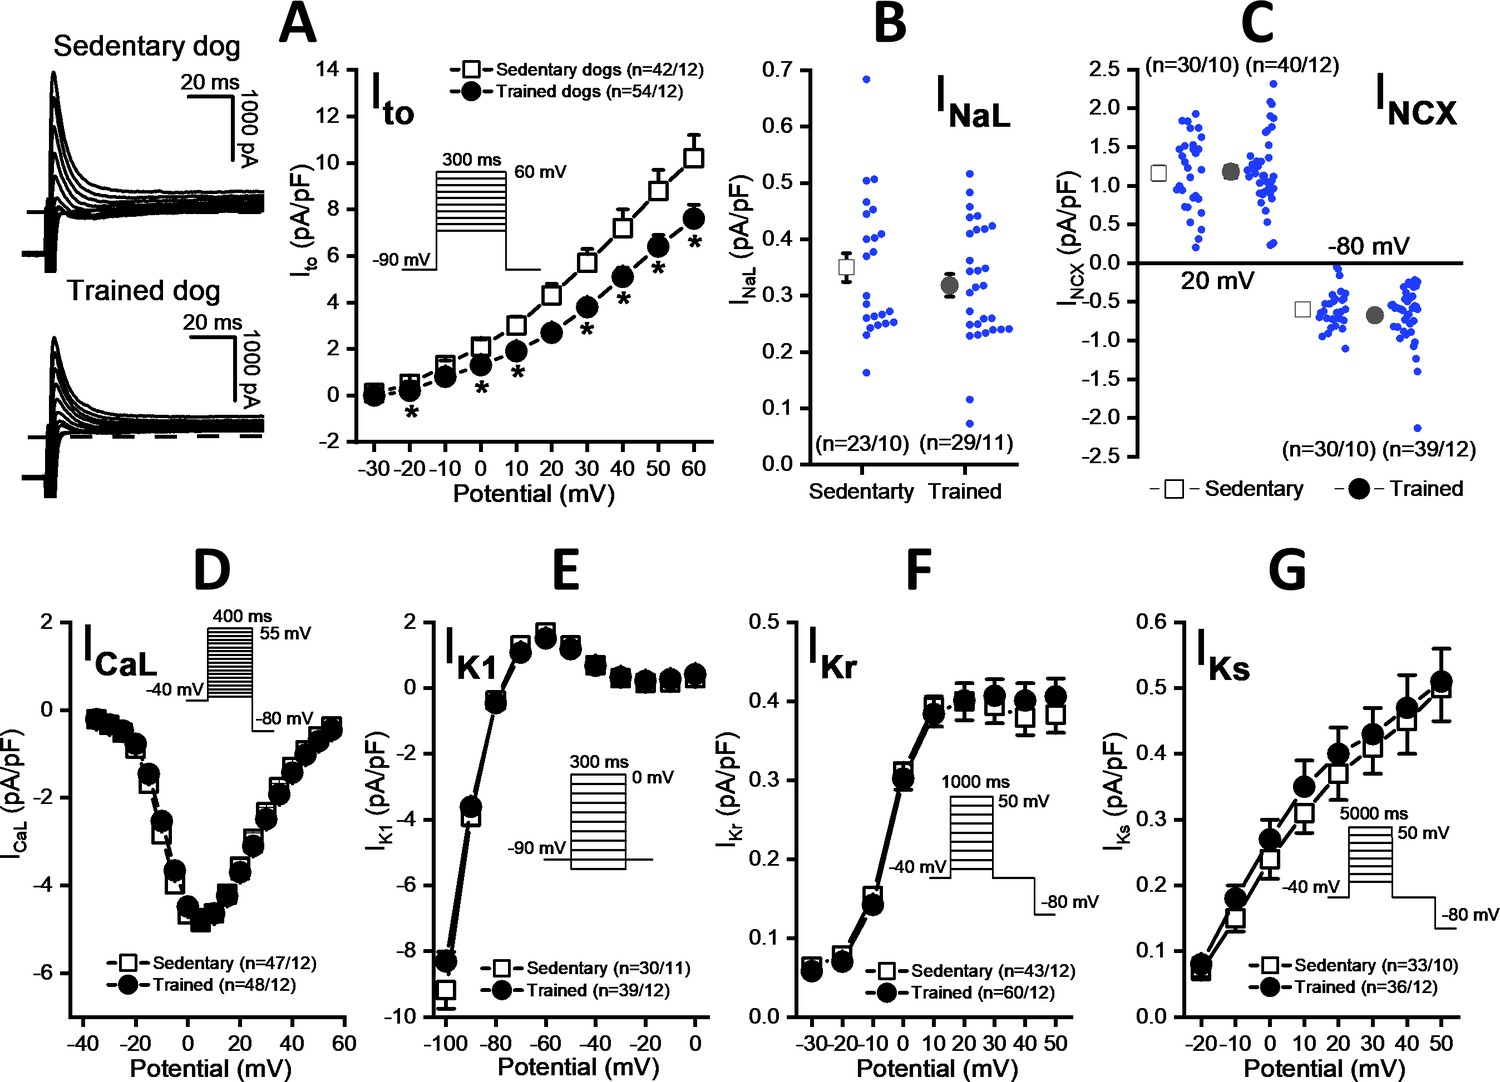
Effects of chronic sustained training on various transmembrane ionic currents in canine left ventricular myocytes.
(A) Effect of sustained training on transient outward potassium current (Ito); representative current recordings (left) and current-voltage relationships (right) in SED and TRN subjects. (B and C) Graphs indicating that sustained training has no effect on either the late Na+ current (INaL) or the Na+/Ca2+ exchange current (INCX). (D–G) The current-voltage relationships of the L-type Ca2+ current (ICaL), the inward rectifier K+ current (IK1), and the rapid (IKr) and the slow (IKs) delayed rectifier K+ currents are similar for SED and TRN subject. Insets show the voltage protocols. The ‘n’ numbers refer to the number of cells followed by the number of dogs from which cells were obtained. Data are expressed as mean ± SEM. Blue dots represent individual data. *p<0.05 ‘TRN’ vs. ‘SED’ group at 16th week by unpaired Student's t-test and Mann-Whitney U test.
-
Figure 5—source data 1
Effects of sustained training on the current-voltage relationship of the transient outward potassium current.
- https://cdn.elifesciences.org/articles/80710/elife-80710-fig5-data1-v2.zip
-
Figure 5—source data 2
Effects of sustained training on the late Na+ current.
- https://cdn.elifesciences.org/articles/80710/elife-80710-fig5-data2-v2.zip
-
Figure 5—source data 3
Effects of sustained training on the Na+/Ca2+ exchange current.
- https://cdn.elifesciences.org/articles/80710/elife-80710-fig5-data3-v2.zip
-
Figure 5—source data 4
Effects of sustained training on the current-voltage relationship of the L-type Ca2+ current.
- https://cdn.elifesciences.org/articles/80710/elife-80710-fig5-data4-v2.zip
-
Figure 5—source data 5
Effects of sustained training on the current-voltage relationship of the inward rectifier K+ current.
- https://cdn.elifesciences.org/articles/80710/elife-80710-fig5-data5-v2.zip
-
Figure 5—source data 6
Effects of sustained training on the current-voltage relationship of the rapid delayed rectifier K+ current.
- https://cdn.elifesciences.org/articles/80710/elife-80710-fig5-data6-v2.zip
-
Figure 5—source data 7
Effects of sustained training on the current-voltage relationship of the slow delayed rectifier K+ current.
- https://cdn.elifesciences.org/articles/80710/elife-80710-fig5-data7-v2.zip
Figure 6
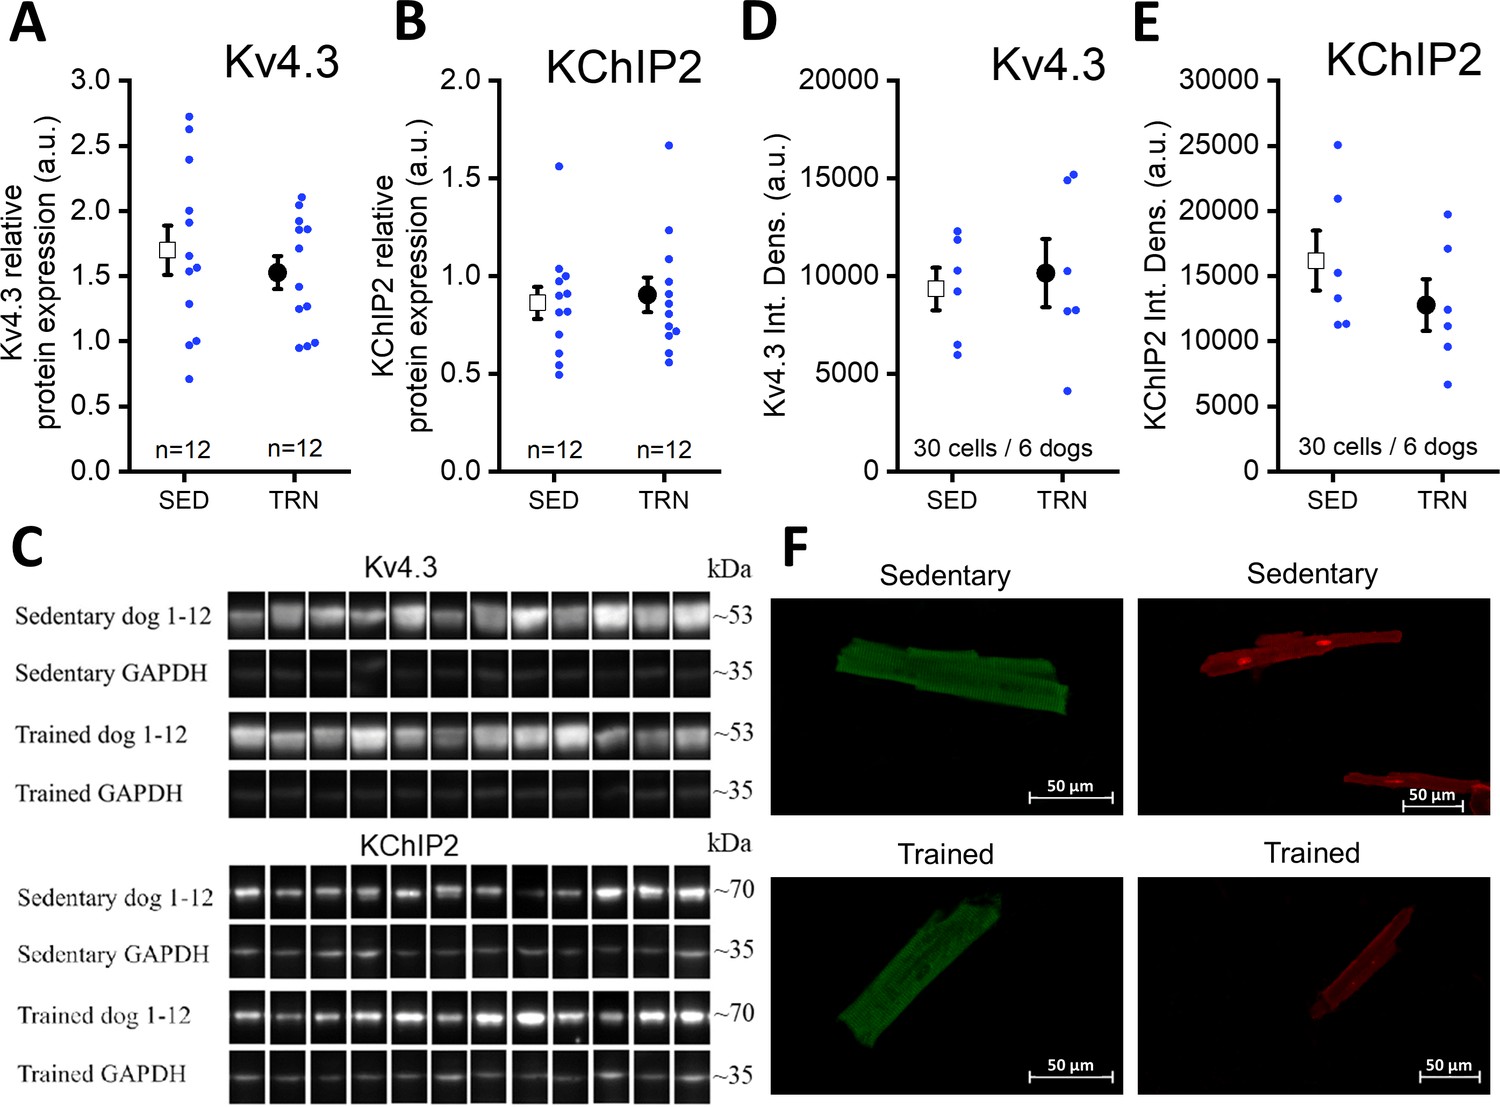
Protein expression and relative density of Kv4.3 and KChiP2 subunits determined by western blotting and immunocytochemistry in left ventricular samples from SED and TRN dogs.
(A and B) Relative protein expression of Kv4.3 and KChiP2 subunits determined by western blotting in left ventricular samples of SED (n=12) and TRN (n=12) dogs, respectively. (C) Representative image of Kv4.3 and KChIP2 bands and their corresponding loading controls (GAPDH). (D and E) Relative densities of Kv4.3 and KChiP2 protein immunolabeling obtained from SED (n=30 cells/6 dogs) and TRN (n=30 cells/6 dogs) cardiomyocytes. (F) Representative immunofluorescence images of canine cardiomyocytes with Kv4.3 and KChiP2 immunolabeling. The ‘n’ numbers refer to the number of dogs (A and B) or the number of cells followed by the number of dogs from which the cells were obtained (D and E). Data are expressed as mean ± SEM. Blue dots represent individual data.
-
Figure 6—source data 1
Relative protein expression of Kv4.3 subunit determined by western blotting in sedentary and trained dogs.
- https://cdn.elifesciences.org/articles/80710/elife-80710-fig6-data1-v2.zip
-
Figure 6—source data 2
Relative protein expression of KChiP2 subunit determined by western blotting in sedentary and trained dogs.
- https://cdn.elifesciences.org/articles/80710/elife-80710-fig6-data2-v2.zip
-
Figure 6—source data 3
Relative density of Kv4.3 subunit determined by immunocytochemistry in sedentary and trained dogs.
- https://cdn.elifesciences.org/articles/80710/elife-80710-fig6-data3-v2.zip
-
Figure 6—source data 4
Relative density of KChiP2 subunit determined by immunocytochemistry in sedentary and trained dogs.
- https://cdn.elifesciences.org/articles/80710/elife-80710-fig6-data4-v2.zip
-
Figure 6—source data 5
Original unedited membranes of western blots with the relevant bands clearly labeled.
- https://cdn.elifesciences.org/articles/80710/elife-80710-fig6-data5-v2.zip
-
Figure 6—source data 6
Original files of the full raw unedited membranes of western blots.
- https://cdn.elifesciences.org/articles/80710/elife-80710-fig6-data6-v2.zip
Figure 7
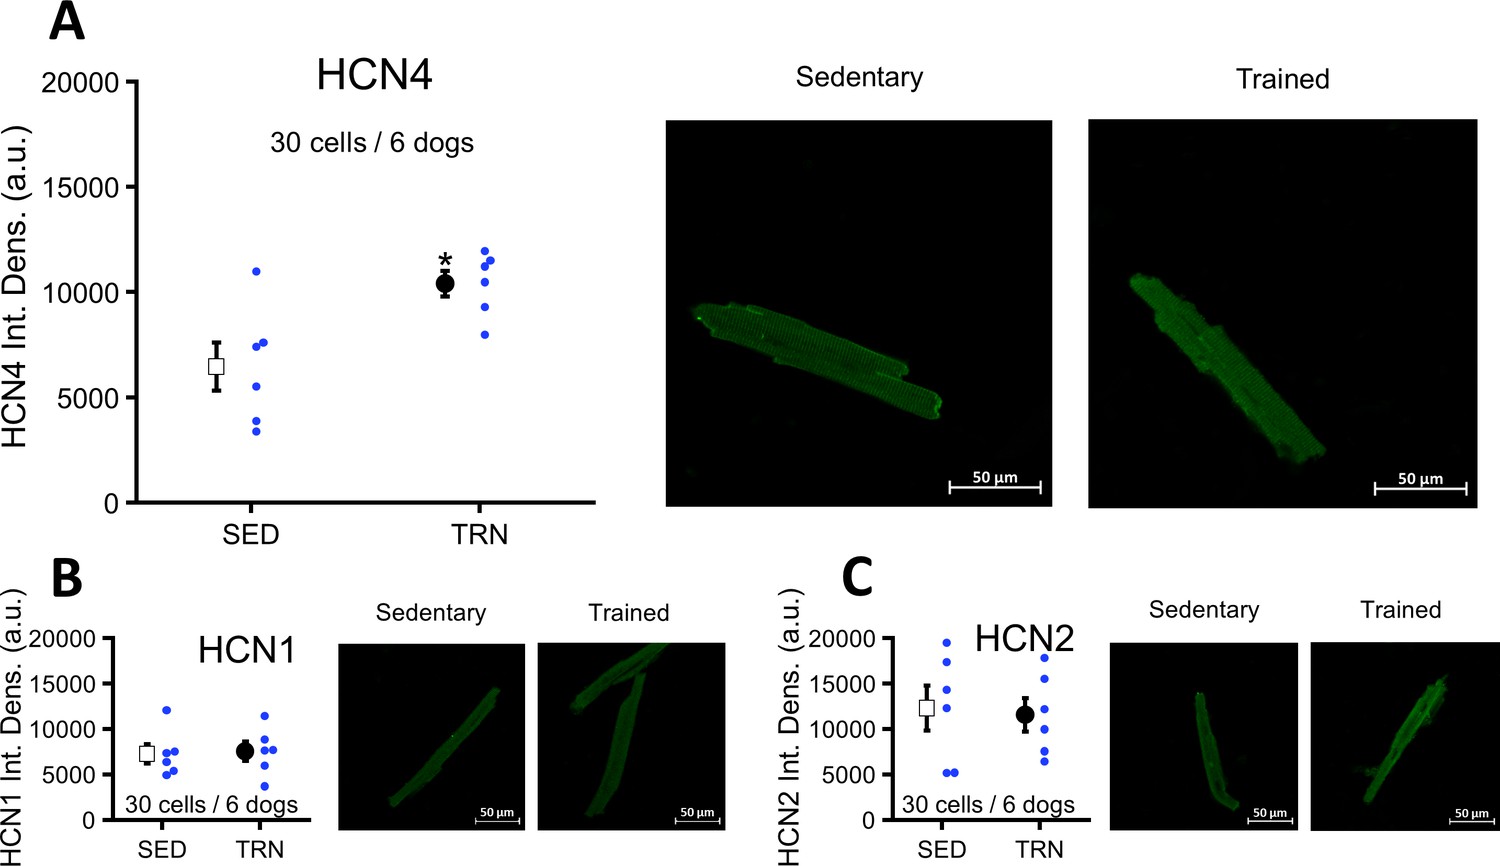
Effects of long-term vigorous training on HCN1, HCN2, and HCN4 protein expression determined by immunocytochemistry in enzymatically isolated left ventricular myocytes of SED and TRN dogs.
(A) Relative density of HCN4 protein immunolabeling obtained from enzymatically isolated left ventricular myocytes of SED (n=30 cells/6 dogs) and TRN (n=30 cells/6 dogs) groups. (B and C) Chronic training had no effect on the relative density of HCN1 and HCN2 proteins immunolabeling obtained from left ventricular myocytes of SED (n=30 cells/6 dogs) and TRN (n=30 cells/6 dogs) groups. (A, B, and C) on the right are representative original immunofluorescence images. The ‘n’ numbers refer to the number of cells followed by the number of dogs from which the cells were obtained. Data are expressed as mean ± SEM. Blue dots represent individual data. *p<0.05 ‘TRN’ vs. ‘SED’ group at 16th week by unpaired Student's t-test.
-
Figure 7—source data 1
Effect of chronic training on HCN4 protein expression determined by immunocytochemistry in sedentary and trained dogs.
- https://cdn.elifesciences.org/articles/80710/elife-80710-fig7-data1-v2.zip
-
Figure 7—source data 2
Effect of chronic training on HCN1 protein expression determined by immunocytochemistry in sedentary and trained dogs.
- https://cdn.elifesciences.org/articles/80710/elife-80710-fig7-data2-v2.zip
-
Figure 7—source data 3
Effect of chronic training on HCN2 protein expression determined by immunocytochemistry in sedentary and trained dogs.
- https://cdn.elifesciences.org/articles/80710/elife-80710-fig7-data3-v2.zip
Figure 8
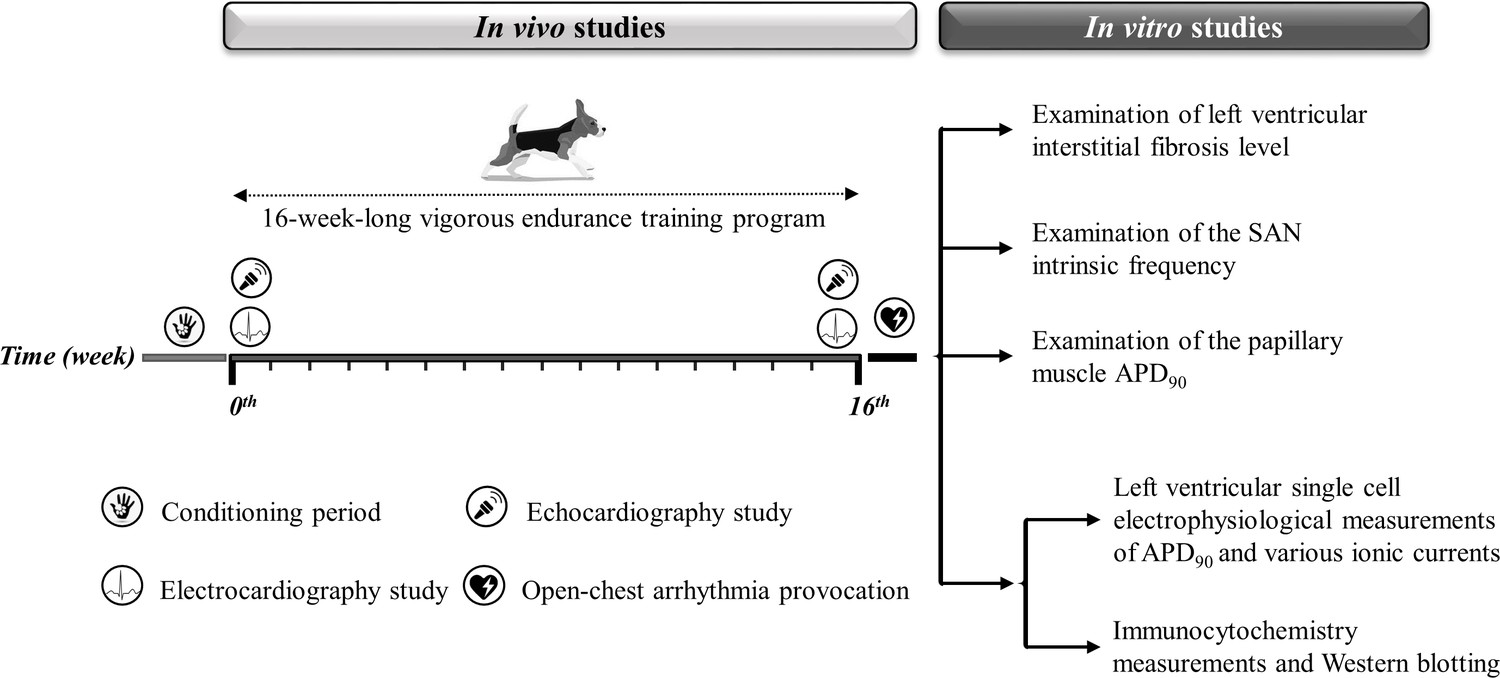
Experimental timeline.
The experimental timeline of the conditioning and training period and the in vivo and in vitro experiments performed. The symbols illustrate the in vivo studies during the 16-week-long vigorous training. On the right, the in vitro experiments are listed. SAN, sinoatrial node; APD90, action potential duration measured at 90% repolarization.
Tables
Table 1
Echocardiographic parameters before and after 16-week-long vigorous training in canine hearts and autopsy outcomes after heart removal.
| Echocardiographic parameters before and after long-term vigorous training | ||||||||
|---|---|---|---|---|---|---|---|---|
| Before the training protocol (at 0th week) | After the training protocol (at 16th week) | |||||||
| ‘SED’ group | ‘TRN’ group | ‘SED’ group | ‘TRN’ group | |||||
| IVS, mm | 7.1±0.3 | 6.8±0.2 | 7.4±0.2 | 8.13±0.2*† | ||||
| IVS/BW, mm/kg | 0.6±0.03 | 0.5±0.03 | 0.6±0.03 | 0.74±0.03*† | ||||
| LVPW, mm | 7.1±0.2 | 6.95±0.2 | 7.4±0.3 | 7.64±0.3 | ||||
| LVPW/BW, mm/kg | 0.6±0.03 | 0.6±0.03 | 0.6±0.03 | 0.70±0.04*† | ||||
| LVESD, mm | 14.2±0.3 | 17.6±0.7 | 18.7±0.5 | 18.4±0.1 | ||||
| LVESD/BSA, mm/m2 | 25.8±1.1 | 32±1.03 | 34.2±1.5 | 36.5±2.1† | ||||
| LVEDD, mm | 28.7±0.7 | 29±0.96 | 30.4±0.7 | 32.0±0.7† | ||||
| LVEDD/BSA, mm/m2 | 51.7±1.4 | 52.7±1 | 55.3±1.9 | 63.5±1.3*† | ||||
| LVM, g | 46.7±3.4 | 45.1±2.1 | 54.1±3.9 | 63.6±2.8† | ||||
| LVMi, g/m2 | 83.6±5.6 | 81.2±2.8 | 97.7±6.4 | 125.8±4.3*† | ||||
| EDV, ml | 32.3±2 | 32.6±2.5 | 37.9±2.2 | 40.6±1.7† | ||||
| EDV/BSA, ml/m2 | 57.5±2.5 | 58.4±2.9 | 68.4±3.4 | 80.3±2.3*† | ||||
| ESV, ml | 6.1±0.6 | 9.5±1.03 | 11.4±0.8 | 10.2±1.3 | ||||
| ESV/BSA, ml/m2 | 10.9±0.9 | 17±1.5 | 20.7±1.3 | 20.1±2.5 | ||||
| EF, % | 80.4±1.7 | 70.9±2.3 | 69.7±1.3 | 75.1±2.7 | ||||
| LAV, ml | 9±0.9 | 8.9±0.6 | 10.4±0.9 | 11.4±1.4† | ||||
| LAVi, ml/m2 | 16±1.4 | 16±0.8 | 18.7±1.3 | 22.4±2.3† | ||||
| Autopsy findings after the long-term vigorous training | ||||||||
| IVS, mm | IVS/BW, mm/kg | LVPW, mm | LVPW/BW, mm/kg | LVM, g | LVMi, g/m2 | |||
| ‘SED’ group | 3.62±0.6 | 0.028±0.04 | 2.54±0.4 | 0.02±0.03 | 79.3±4.4 | 144.1±4.1 | ||
| ‘TRN’ group | 4.25±0.3 | 0.039±0.03* | 3.42±0.3* | 0.031±0.02* | 83.3±4.8 | 167.2±5.7* | ||
-
*
p<0.05 ‘TRN’ vs. ‘SED’ group at 16th week by unpaired Student's t-test.
-
†
p<0.05 ‘TRN group at 16th week’ vs. ‘TRN group at 0th week’ by paired Student's t-test.
-
Table 1—source data 1
The effect of chronic endurance training on echocardiographic cardiac parameters and autopsy outcomes.
- https://cdn.elifesciences.org/articles/80710/elife-80710-table1-data1-v2.zip
Table 2
Electrocardiographic parameters before and after 16-week-long vigorous training in conscious, sedentary, and trained dogs.
| Electrocardiographic parameters before and after long-term vigorous training | ||||
|---|---|---|---|---|
| Before the training protocol (at 0th week) | After the training protocol (at 16th week) | |||
| ‘SED’ group (n=12) | ‘TRN’ group (n=12) | ‘SED’ group (n=12) | ‘TRN’ group (n=12) | |
| RR, ms | 588.4±32.1 | 579.3±33.2 | 644.2±58.6 | 841.8±62.8*† |
| PQ, ms | 103.2±2.0 | 98.3±2.9 | 102.8±3.2 | 110.7±3.6† |
| QRS, ms | 59.6±1.7 | 60.5±2.4 | 56.3±2.6 | 70.8±1.6*† |
| QT, ms | 218.7±5.7 | 215.9±2.9 | 223.0±6.4 | 251.3±3.2*† |
| QTc, ms | 216±4.7 | 213.6±2.8 | 217.7±4.5 | 237.1±3.4*† |
| STV-QT, ms | 2.6±0.2 | 2.5±0.2 | 2.6±0.2 | 3.6±0.4*† |
| TpTe, ms | 27.3±2.3 | 27.9±2.5 | 30.9±2.4 | 36.5±1.7† |
-
*
p<0.05 ‘TRN’ vs. ‘SED’ group at 16th week by unpaired Student's t-test.
-
†
p<0.05 ‘TRN group at 16th week’ vs. ‘TRN group at 0th week’ by paired Student's t-test.
-
Table 2—source data 1
Effect of chronic endurance training on ECG parameters in conscious dogs at rest.
- https://cdn.elifesciences.org/articles/80710/elife-80710-table2-data1-v2.zip
Table 3
The detailed training protocol.
| Training typeTraining durationTraining speedTraining distance | Long-distance running2×90 min12–18 km/hr gradually increasing speed(km/day) | Interval running2×50 min4 and 22 km/hr fixed speed(km/day) | Incline(%)a.m./p.m. | Daily distance(km/day) | |
|---|---|---|---|---|---|
| Weeks of training | 1 | 9 | - | - | 9 |
| 2 | 15 | - | - | 15 | |
| 3 | 22 | - | 4/- | 22 | |
| 4 | 31 | - | 6/- | 31 | |
| 5 | 31 | 7 | 8/4 | 38 | |
| 6 | 33 | 7 | 8/4 | 40 | |
| 7 | 37 | 7 | 10/6 | 45 | |
| 8 | 37 | 7 | 12/8 | 45 | |
| 9 | 39 | 11 | 12/10 | 50 | |
| 10 | 39 | 20 | 12/10 | 59 | |
| 11 | 43 | 20 | 12/10 | 63 | |
| 12 | 46 | 24 | 12/10 | 69 | |
| 13 | 46 | 24 | 12/10 | 69 | |
| 14 | 46 | 25 | 14/12 | 70 | |
| 15 | 46 | 25 | 14/14 | 70 | |
| 16 | 58 | 25 | 14/14 | 82 | |
Additional files
Download links
A two-part list of links to download the article, or parts of the article, in various formats.
Downloads (link to download the article as PDF)
Open citations (links to open the citations from this article in various online reference manager services)
Cite this article (links to download the citations from this article in formats compatible with various reference manager tools)
Cardiac electrophysiological remodeling associated with enhanced arrhythmia susceptibility in a canine model of elite exercise
eLife 12:e80710.
https://doi.org/10.7554/eLife.80710


