Arginase 1 is a key driver of immune suppression in pancreatic cancer
- Cellular and Molecular Biology Program, University of Michigan-Ann Arbor, United States
- Department of Molecular and Integrative Physiology, University of Michigan-Ann Arbor, United States
- Department of Surgery, University of Michigan-Ann Arbor, United States
- Cancer Biology Program, University of Michigan-Ann Arbor, United States
- Department of Immunology, University of Michigan-Ann Arbor, United States
- Department of Cell and Developmental Biology, University of Michigan-Ann Arbor, United States
- Henry Ford Pancreatic Cancer Center, United States
- Rogel Cancer Center, United States
- Department of Internal Medicine, Division of Gastroenterolog, University of Michigan-Ann Arbor, United States
- Department of Molecular Biology and Biochemistry, University of California, Irvine, United States
- Chao Family Comprehensive Cancer Center, University of California, Irvine, United States
Figures
Figure 1 with 1 supplement
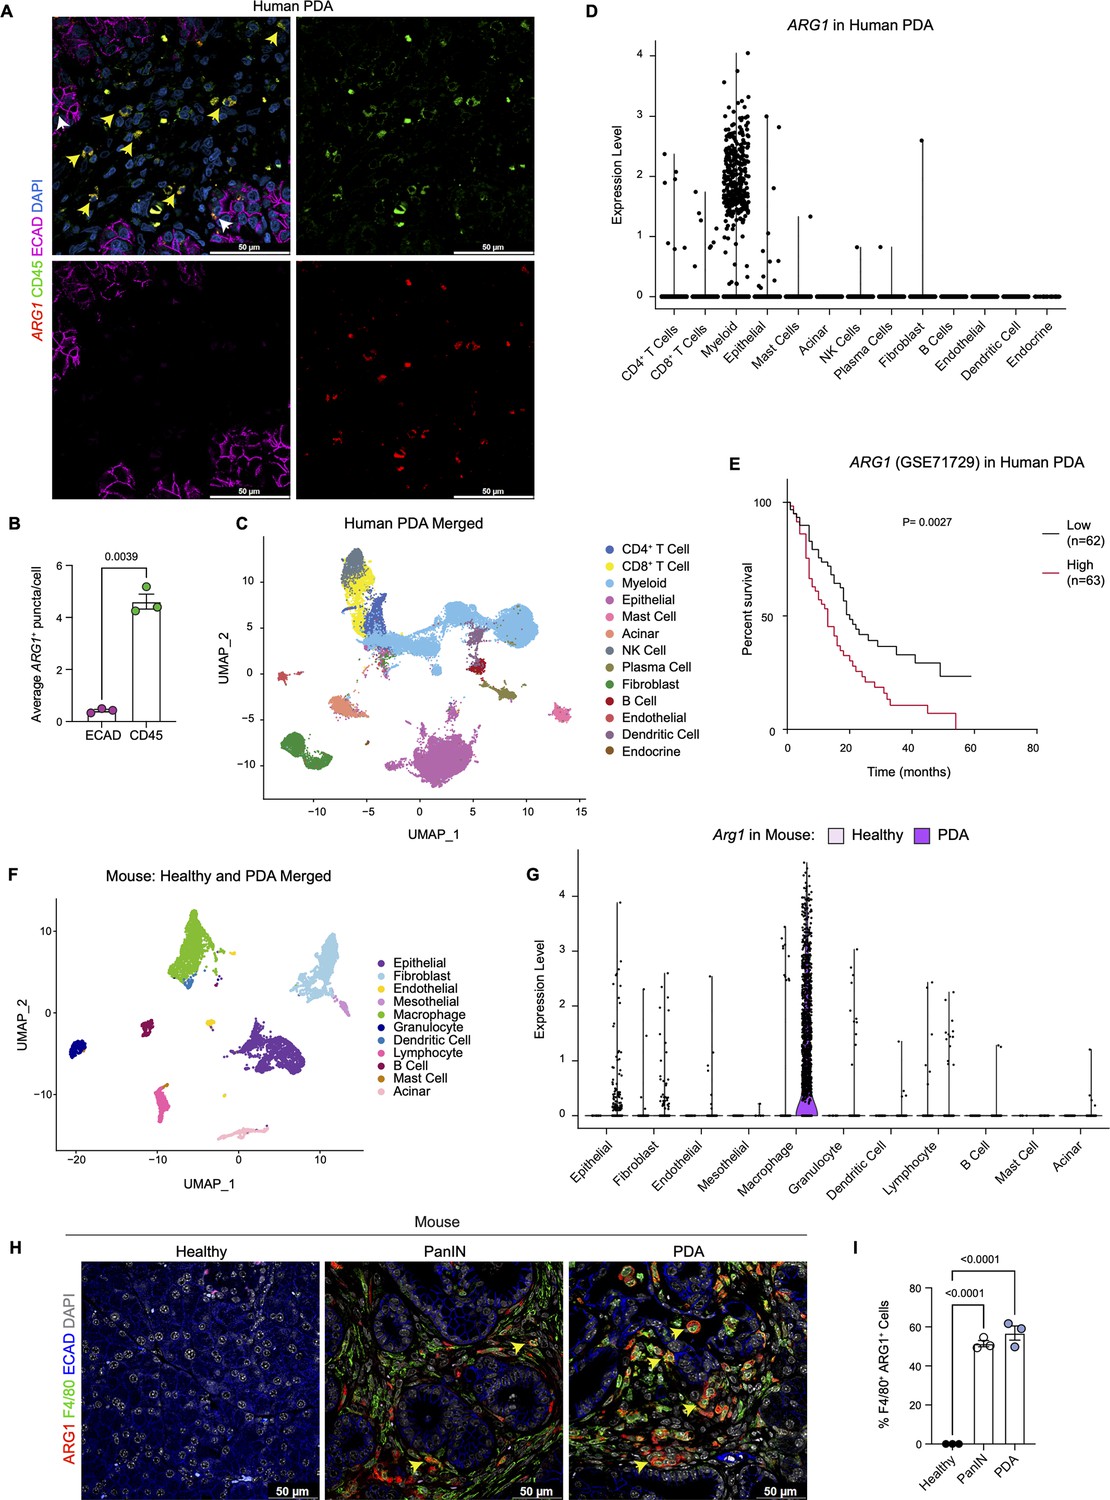
Arginase 1 (Arg1) is highly expressed in human and mouse myeloid cells.
(A) Representative image of RNA in situ hybridization (ISH) of ARG1 (red) and co-immunofluorescence staining of immune (CD45, green) and epithelial (E-cadherin [ECAD], magenta) cells in human pancreatic ductal adenocarcinoma (PDA). Counterstain, DAPI (blue). White arrows point to ARG1-ISH in ECAD+ cells, and yellow arrows point to ARG1-ISH in CD45+ cells. Scale bar, 50 μm. (B) Quantification of average ARG1+ puncta in CK19 and CD45 cells. Unpaired t test with Welch’s correction was used to determine statistical significance. (C) Uniform manifold approximation and projection (UMAP) visualization of 13 identified cell populations from single-cell RNA sequencing (sc-RNA-seq) of 16 human PDA tumors. Data from Steele et al., 2020. (D) Violin plot of normalized gene expression of ARG1 in the identified cell populations from the human PDA sc-RNA-seq. (E) Survival analysis of a human PDA microarray data set (GSE71729) with low (n=62) and high (n=63) ARG1 expression. Statistical significance was determined using the Kaplan Meier overall survival Logrank test. (F) UMAP visualization of 11 identified populations from healthy and PDA merged mouse sc-RNA-seq. (G) Violin plot of normalized gene expression of Arg1 in the identified cell populations from mouse sc-RNA-seq. (H) Representative co-immunofluorescence staining for ARG1 (red), macrophages (F4/80, green), and epithelial (ECAD, blue) cells in mouse tissue at different stages of disease. Counterstain, DAPI (gray). Scale bar, 50 μm. Yellow arrows indicate ARG1 expression in F4/80+ cells. (I) Quantification of F4/80+ ARG1+ cells in healthy, PanIN, and PDA mouse tissue. Statistical significance was determined using an ordinary one-way ANOVA with multiple comparisons. p Value was considered statistically significant when p<0.05.
Figure 1—figure supplement 1
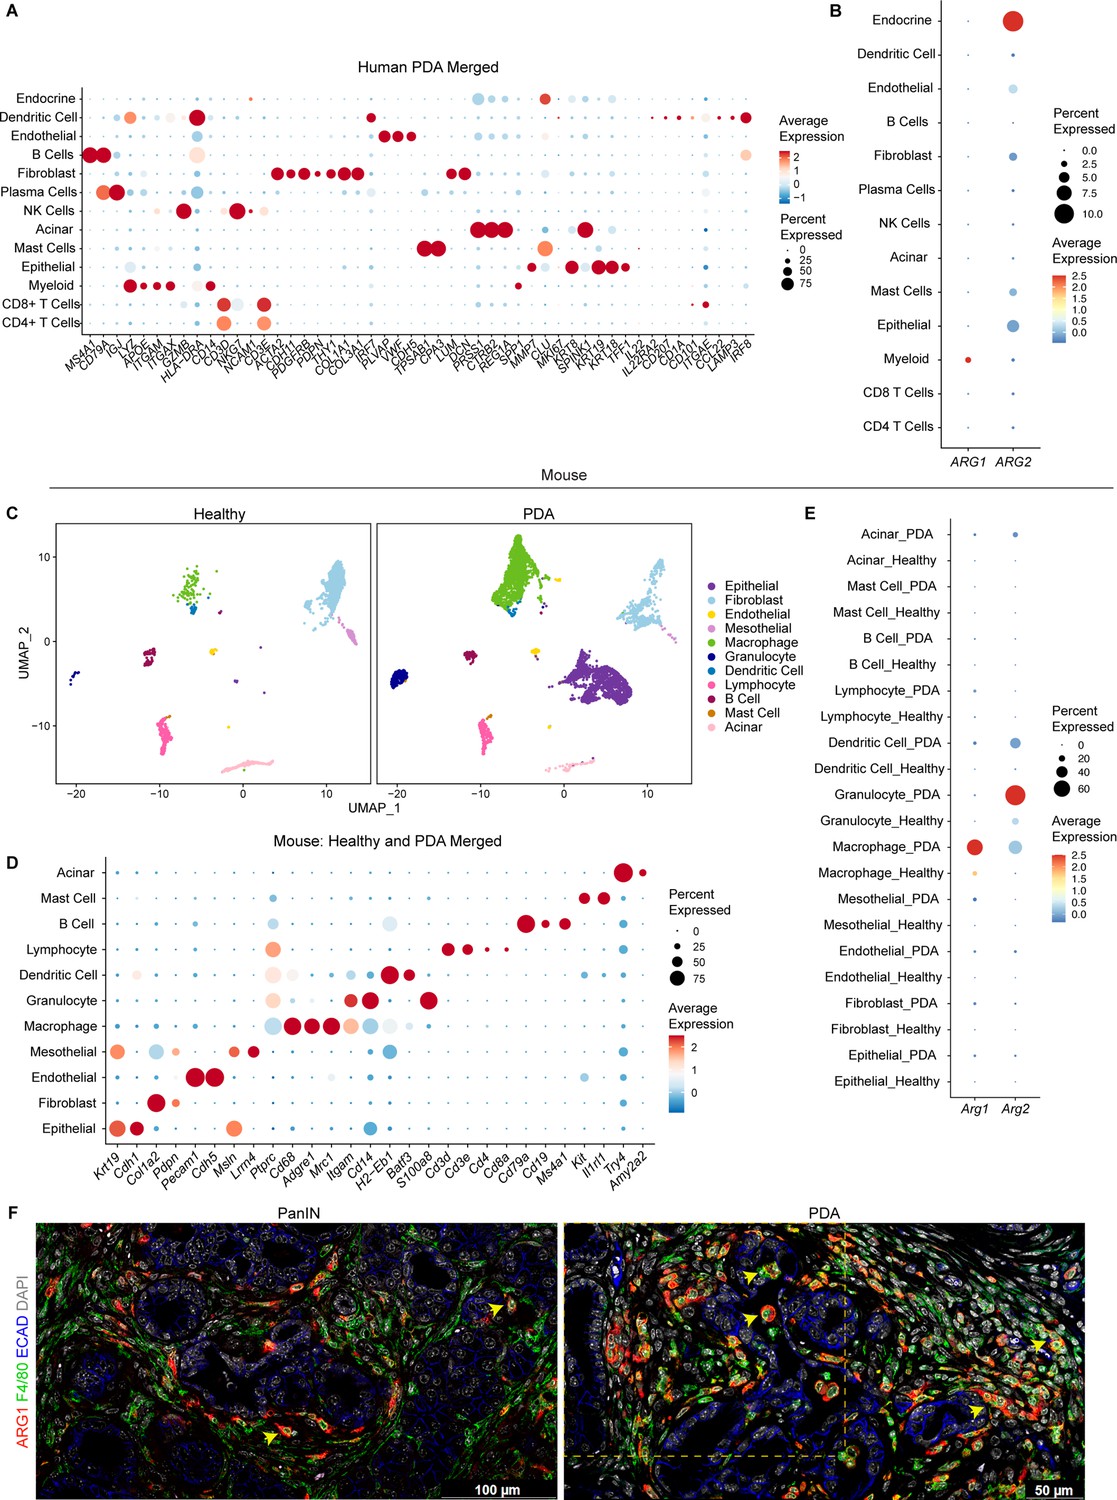
Arginase 1 (Arg1) expression in human and mouse myeloid cells.
(A) Dot plot showing the lineage markers used to identify the different cell populations in the human single-cell RNA sequencing (sc-RNA-seq). Dot color indicates average expression and dot size indicates expression frequency. (B) Dot plot showing normalized gene expression levels of ARG1 and ARG2 in the human sc-RNA-seq. (C) Uniform manifold approximation and projection (UMAP) visualizations comparing defined cell populations in healthy and pancreatic ductal adenocarcinoma (PDA) mouse sc-RNA-seq. (D) Dot plot showing the lineage markers used to identify the distinct cell populations in healthy and PDA mouse sc-RNA-seq. (E) Dot plot showing normalized gene expression levels of Arg1 and Arg2 in healthy and PDA mouse sc-RNA-seq. (F) Representative co-immunofluorescence staining for ARG1 (red), macrophages (F4/80, green), and epithelial (E-cadherin [ECAD], blue) cells in mouse tissue during PanIN and PDA stages of disease. Quantification of F4/80+ ARG1+ cells is shown in Figure 1I. Yellow dotted box marks the area shown in main Figure 1H. Scale bar for PanIN image is 100 μm; for PDA is 50 μm.
Figure 2 with 3 supplements
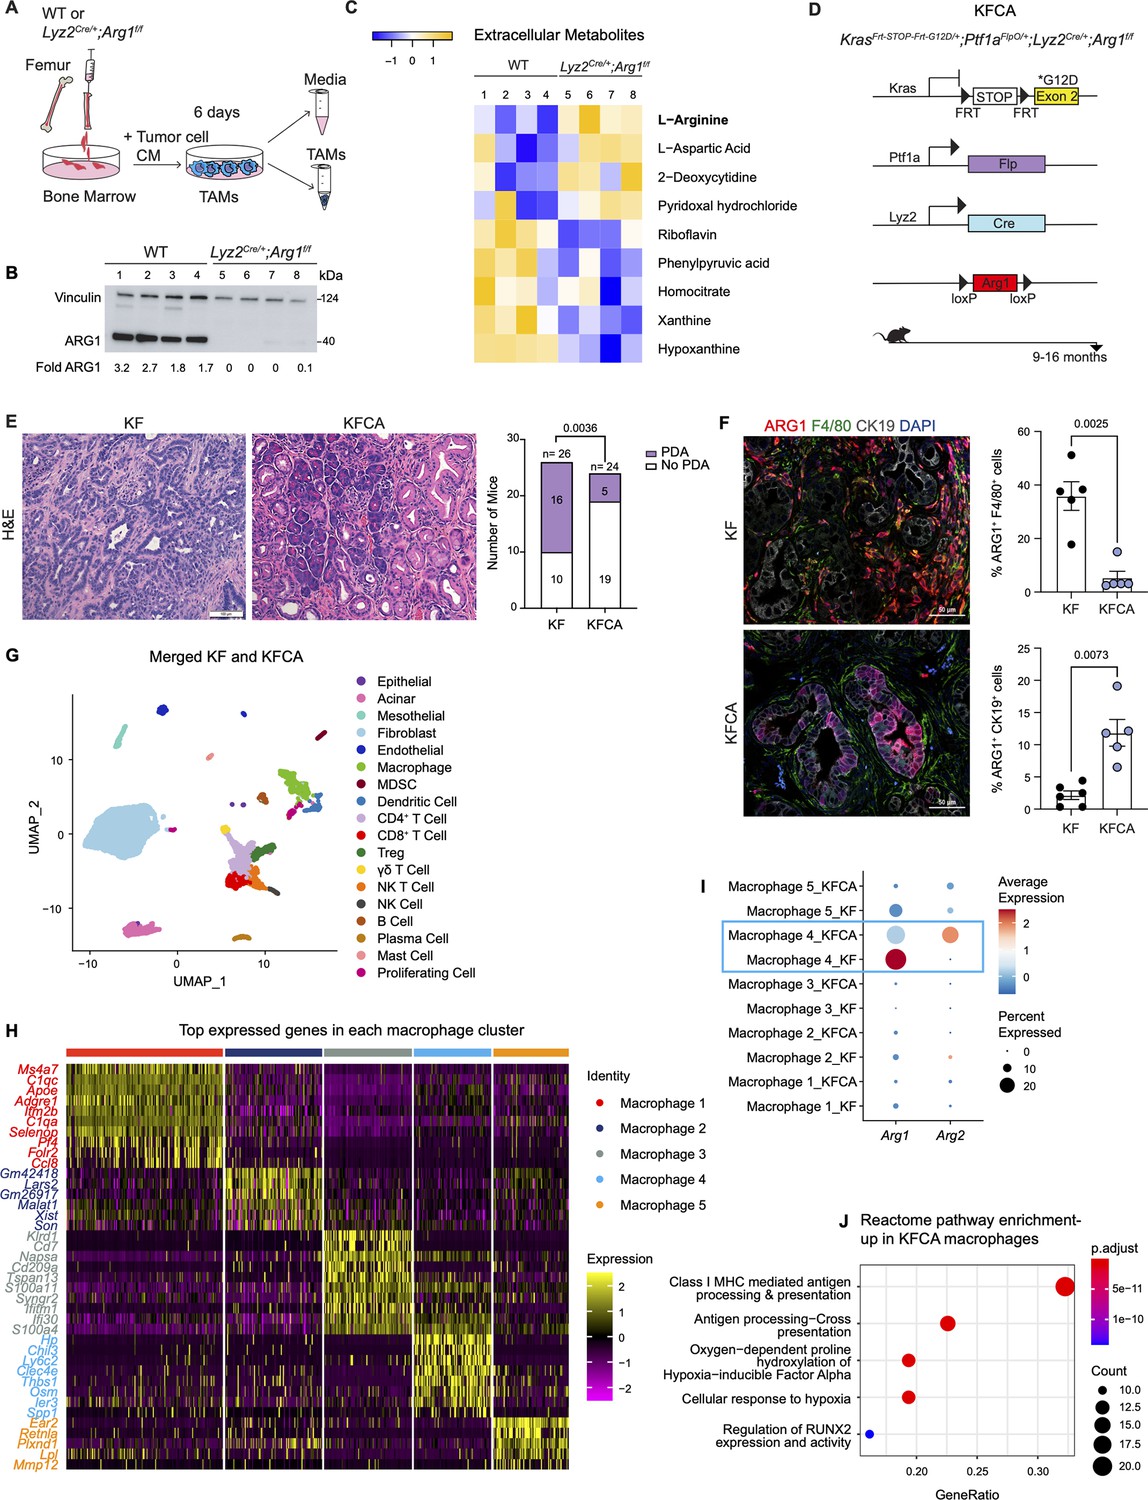
Arginase 1 (Arg1) deletion in myeloid cells reduces tumor progression and induces macrophage repolarization in a spontaneous pancreatic ductal adenocarcinoma (PDA) mouse model.
(A) Schematic illustration for the generation of tumor-associated macrophages (TAMs) from wild-type (WT) and Lyz2Cre/+;Arg1f/f mice. (B) Representative image of western blot for ARG1 levels in WT and Lyz2Cre/+;Arg1f/f TAMs. Vinculin, loading control. (C) Heatmap of statistically significantly different extracellular metabolites from WT (lanes 1–4) and Lyz2Cre/+;Arg1f/f (lanes 5–8) TAM media. (D) Genetic makeup of the KrasFrt-STOP-Frt-G12D/+;Ptf1aFlpO/+;Lyz2Cre/+;Arg1f/f (KFCA) mouse model for the deletion of Arg1 in myeloid cells during PDA tumorigenesis. Data shown here from mice aged 9–16 mo, n=24–26/group. (E) Representative hematoxylin and eosin (H&E) staining from age matching KF and KFCA mice. Scale bar, 100 μm. Histopathology evaluation shown on the right (n=26 KF and 24 KFCA, age matched, 9–16 mo old). Statistical significance was determined using chi-square test. Statistically significant when P<0.05. (F) Representative image of co-immunofluorescence staining for ARG1 (red), macrophages (F4/80, green), epithelial (CK19, gray), and DAPI (blue) in KF and KFCA tissue. Scale bar, 50 μm. Quantification on the right, n=5–6/group. Significance was determined using unpaired t test with Welch’s correction. Statistically significant when p<0.05. (G) Uniform manifold approximation and projection (UMAP) visualization for the identified cell populations in merged KF and KFCA single-cell RNA sequencing. (H) Heatmap of top differentially expressed genes in the macrophage subclusters identified from KF and KFCA pancreata. (I) Dot plot visualization of Arg1 and Arg2 expression in KF and KFCA macrophage clusters. Average expression is shown by color intensity and expression frequency by dot size. (J) Reactome pathway enrichment analysis showing significantly upregulated pathways in KFCA macrophages.
-
Figure 2—source data 1
Full membrane scan for the western blot in Figure 2B.
Vinculin is the loading control, 124 kDa. ARG1 is 40 kDa.
- https://cdn.elifesciences.org/articles/80721/elife-80721-fig2-data1-v2.zip
Figure 2—figure supplement 1
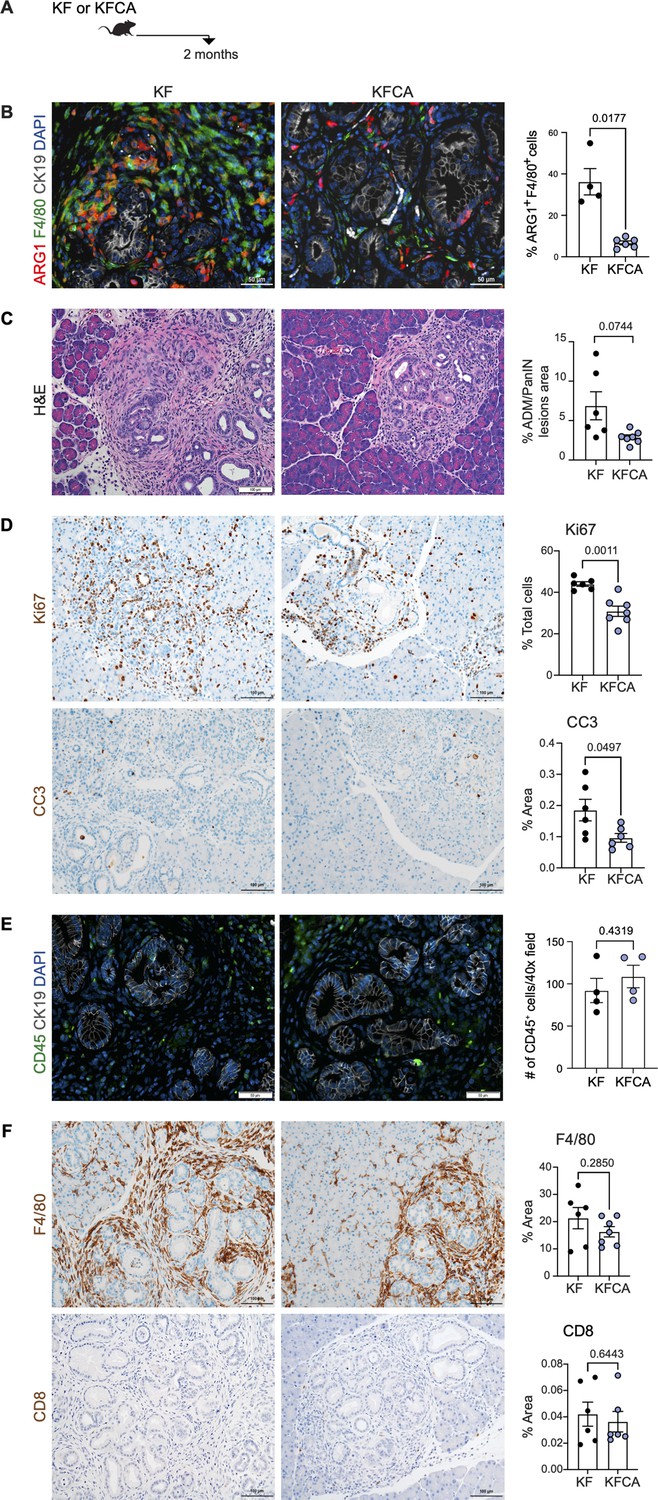
Deletion of Arginase 1 (Arg1) in myeloid cells decreases cell proliferation and cell death during early stages of pancreatic ductal adenocarcinoma.
(A) Experimental design for KF and KFCA mice aged to 2 mo. (B) Representative images of co-immunofluorescence staining for ARG1 (red), macrophages (F4/80, green), epithelial (CK19, gray), and DAPI (blue) in KF and KFCA pancreata at 2 mo. Yellow staining shows co-localization of ARG1 and F4/80. Scale bar, 50 μm. Quantification on the right, n=4–6/group (C) Representative hematoxylin and eosin (H&E) images for KF and KFCA mice at 2 mo, n=6–7/group. Scale bar, 100 μm. On the right, percentage of ADM/PanIN lesions area in KF and KFCA tissue at 2 mo, n=6–7/group. (D) Representative immunohistochemistry staining for total cell proliferation (Ki67) and total cell death (cleaved caspase-3 [CC3]). Scale bar, 100 μm. Quantification on the right, n=6–7/group. (E) Representative immunofluorescence staining for immune cells (CD45, green) and epithelial cells (CK19, gray). Scale bar, 50 μm. Quantification on the right, n=4/group. (F) Representative immunohistochemistry staining for macrophages (F4/80) and CD8+ T cells (CD8) in KF and KFCA tissue at 2 mo. Scale bar, 100 μm. Positive staining quantification is shown on the right. Student’s t test was used to determine significance. Statistically significant when p<0.005.
Figure 2—figure supplement 2
Deletion of Arginase 1 (Arg1) in myeloid cells alters the immune cell infiltration in a spontaneous pancreatic ductal adenocarcinoma mouse model during late stages of disease.
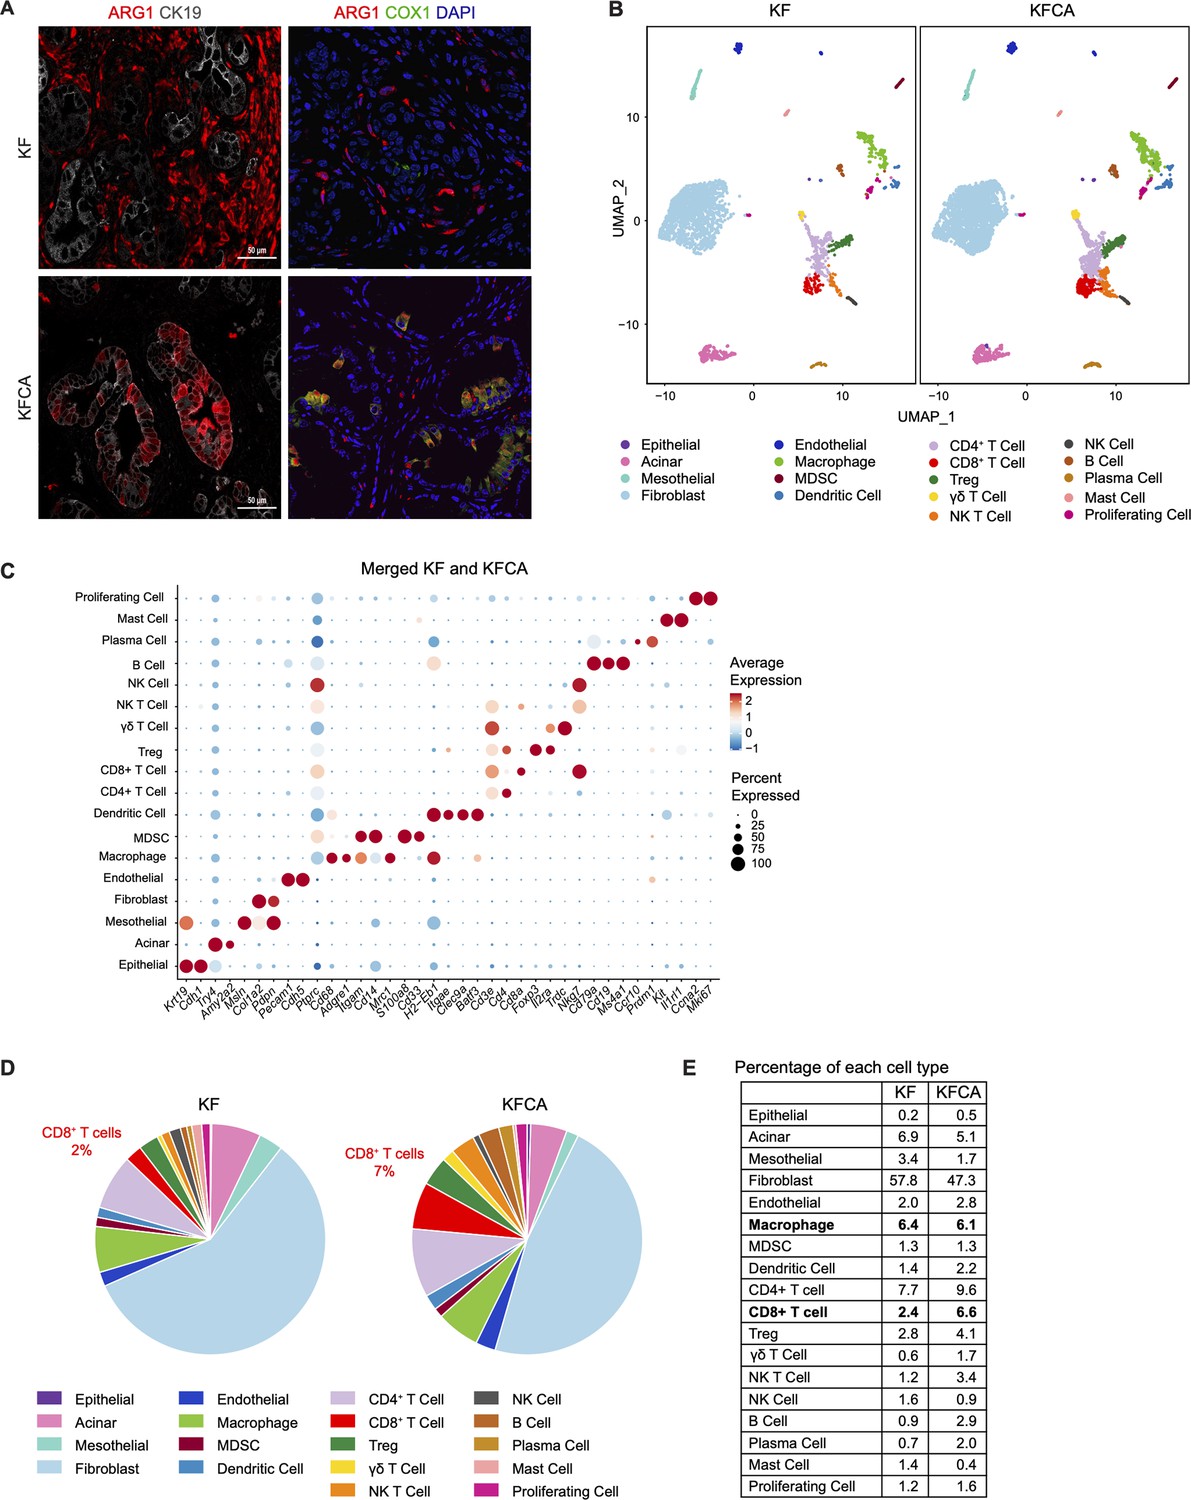
(A) Left panel: co-immunofluorescence staining from Figure 2F showing ARG1 (red) and CK19 (gray) staining without DAPI; right panel: co-immunofluorescence staining for ARG1 (red), COX1 (green), and DAPI (blue) in KF and KFCA tissue. Scale bar, 50 μm. (B) Uniform manifold approximation and projection (UMAP) visualizations of single-cell RNA sequencing (sc-RNA-seq) comparing the identified cell populations in KF and KFCA. (C) Dot plot showing the lineage markers used to identify the distinct cell populations. Dot color indicates average expression, and dot size indicates expression frequency. (D) Pie charts comparing the proportion of the identified sc-RNA-seq populations between KF and KFCA. (E) Table showing the percentage of each identified population from total cells in KF and KFCA.
-
Figure 2—figure supplement 2—source data 1
Single cell population levels used to calculate the percentage of each cell type in KF and KFCA.
- https://cdn.elifesciences.org/articles/80721/elife-80721-fig2-figsupp2-data1-v2.xlsx
Figure 2—figure supplement 3
Deletion of Arginase 1 in myeloid cells decreases immune suppression in a spontaneous pancreatic ductal adenocarcinoma mouse model during late stages of the disease.
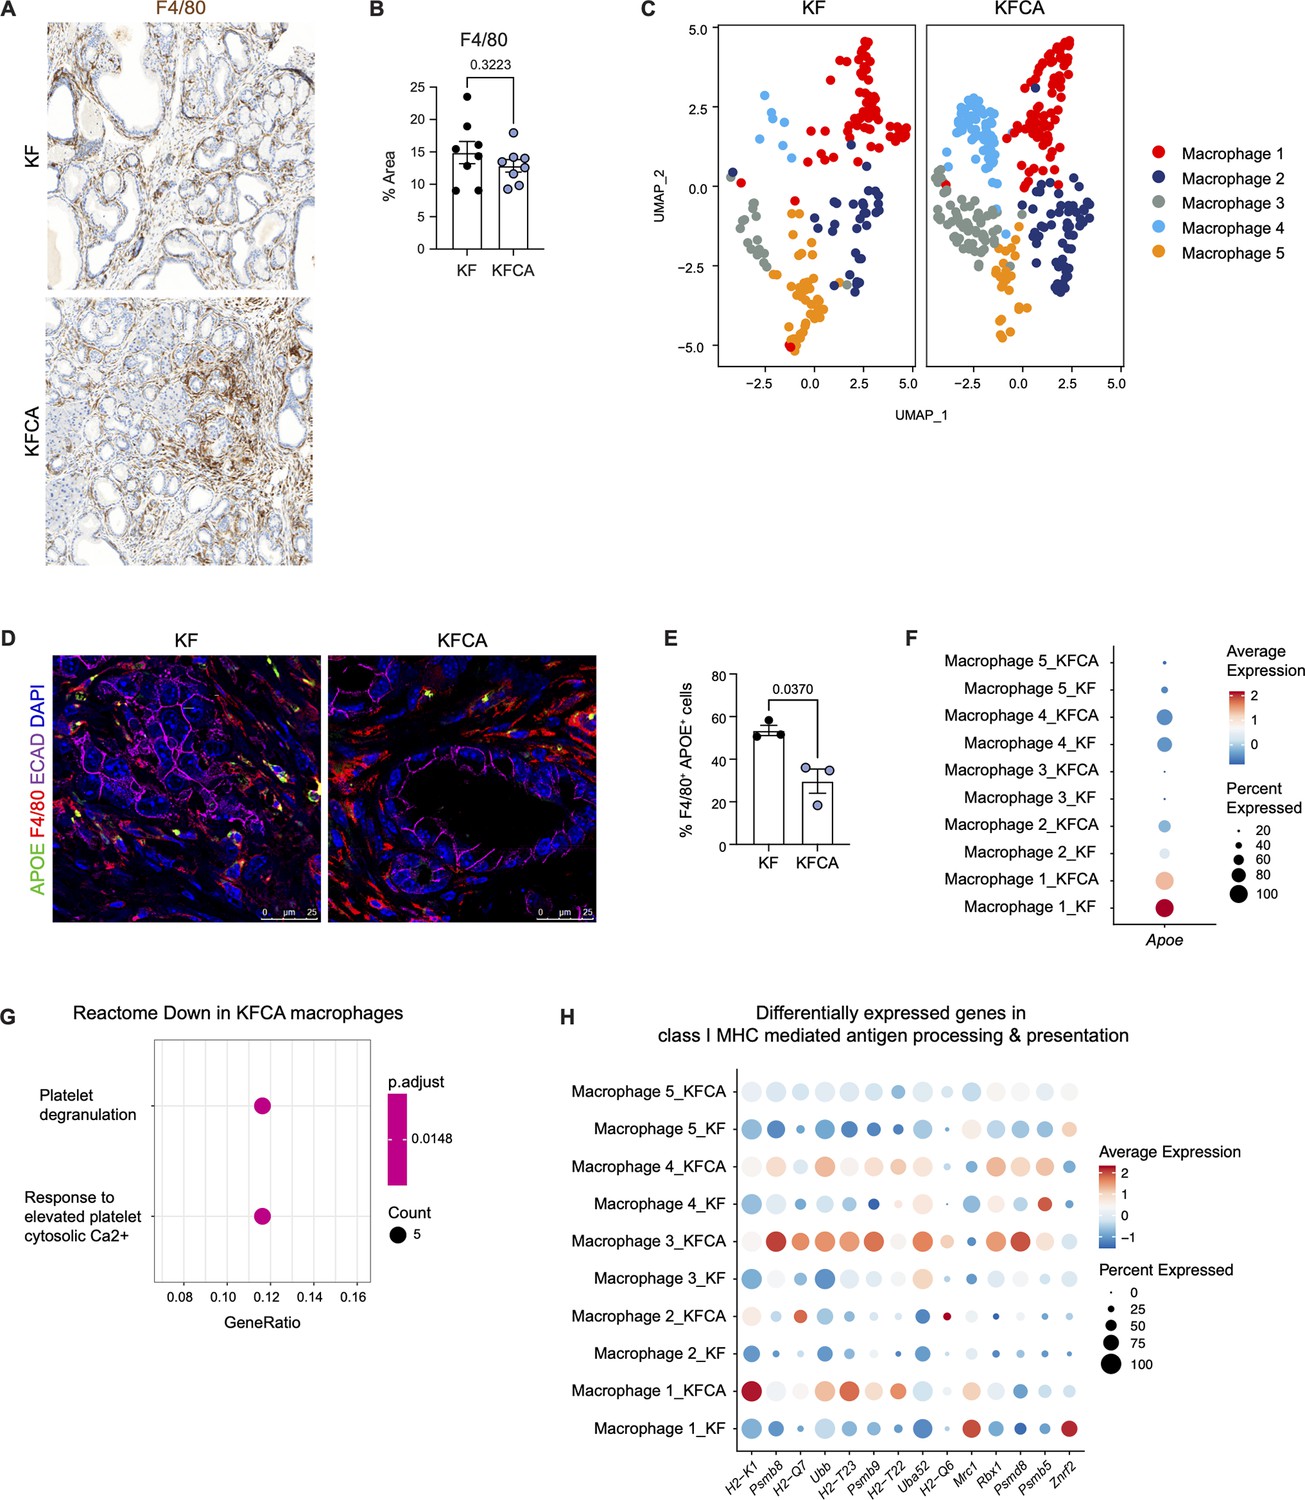
(A) Representative immunohistochemistry staining for macrophages (F4/80) in KF and KFCA tissue during late stage of disease at 20× magnification. (B) Quantification for F4/80+ staining, n=8/group. Student’s t test was used to determine significance. (C) Uniform manifold approximation and projection (UMAP) visualizations showing the distribution of the five identified macrophage subpopulations in KF and KFCA. (D) Representative immunofluorescence staining for APOE (green), F4/80 (red), E-cadherin (ECAD; purple), and DAPI (blue) in KF and KFCA pancreas tissue during late stages of the disease. Scale bar, 25 μm. (E) Quantification of F4/80+ APOE+ cells, n=3/group. Student’s t test was used to determine significance. (F) Dot plot visualization of Apoe expression in KF and KFCA macrophage clusters. Average expression is shown by color intensity, and percent expressed by dot size. (G) Reactome pathway enrichment analysis showing significantly downregulated pathways in KFCA macrophages. (H) Dot plot showing differentially expressed genes involved in MHC I-mediated antigen processing and presentation in macrophages.
Figure 3
Arginase 1 deletion in myeloid cells increases CD8+ T cell infiltration and activation in a spontaneous pancreatic ductal adenocarcinoma mouse model.
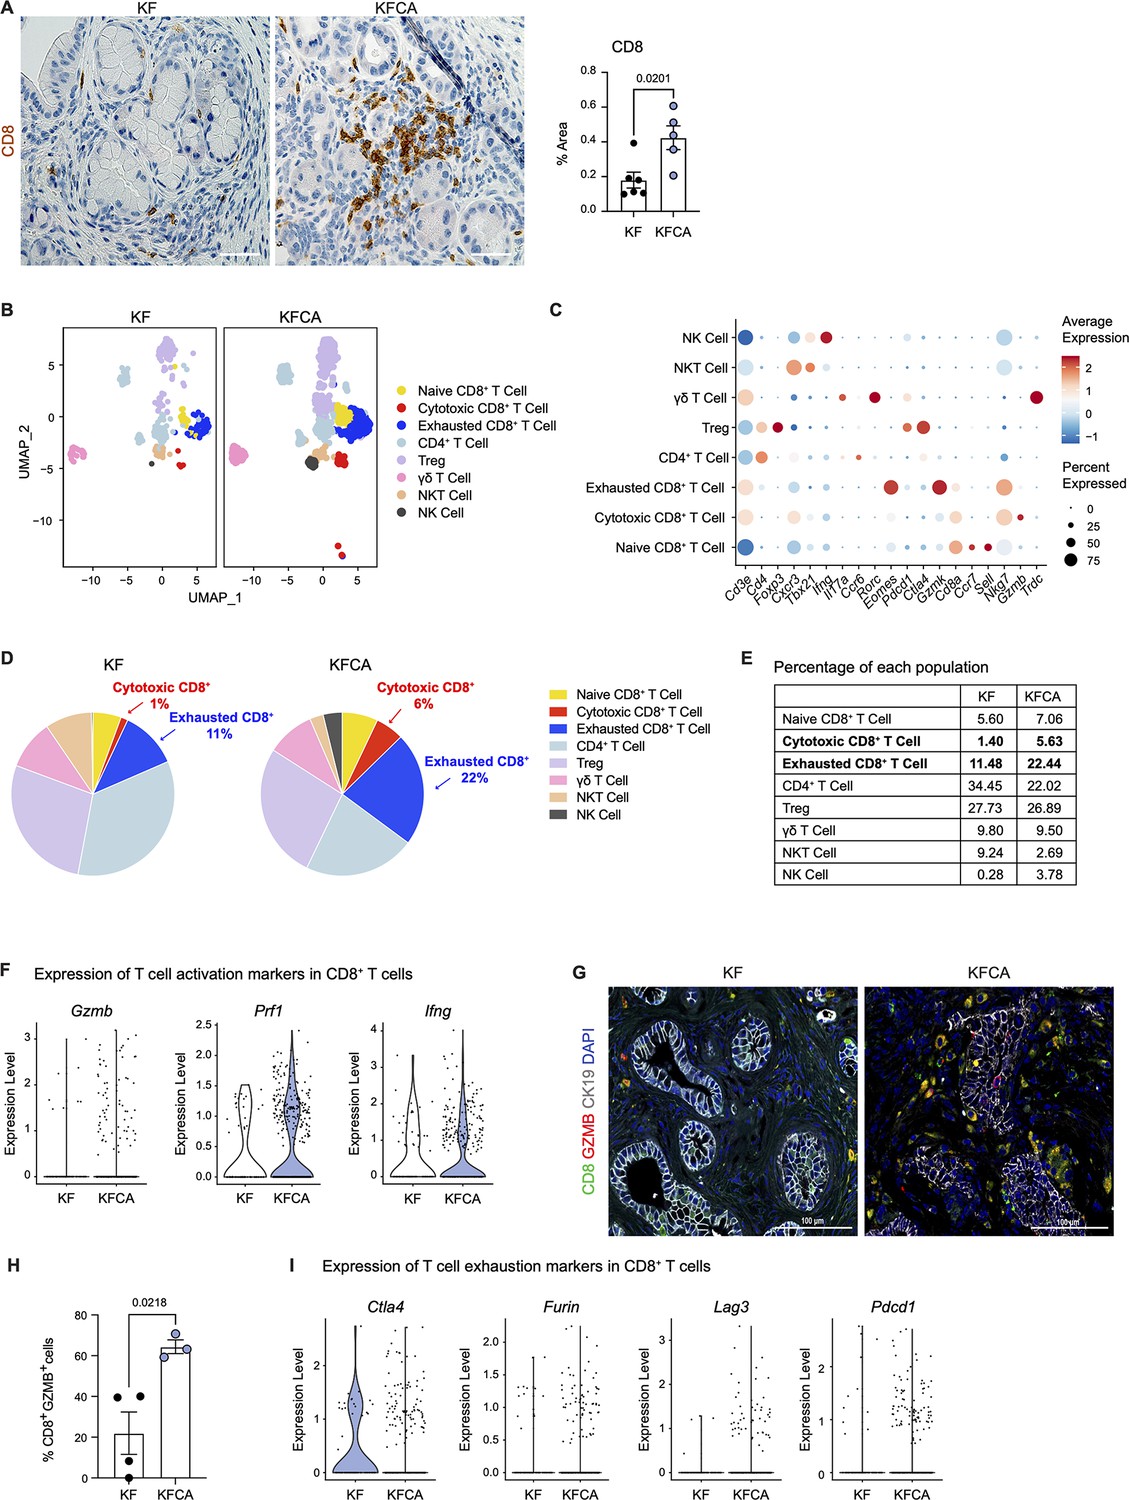
(A) Representative images of CD8 immunohistochemistry staining (brown) in KF and KFCA tissue. Scale bar, 50 μm. Quantification of positive area on the right, n=5–6/group. Student’s t test was used to determine statistical significance. (B) Uniform manifold approximation and projection (UMAP) visualization of defined T and natural killer (NK) cell clusters comparing single-cell RNA sequencing (sc-RNA-seq) data from KF and KFCA. (C) Dot plot of lineage markers used to identify the different types of lymphocytes. Dot size shows expression frequency, dot color shows average expression. (D) Pie charts showing the proportion of the identified lymphocyte populations in KF and KFCA sc-RNA-seq, percentage values are provided for populations that differ dramatically between KF and KFCA. (E) Table showing the percentage of each identified lymphocyte population in KF and KFCA sc-RNA-seq. (F) Violin plots showing normalized expression levels of T cell activation markers in all CD8+ T cell populations identified in KF and KFCA sc-RNA-seq data. (G) Representative images of co-immunofluorescence staining for CD8 (green), GZMB (red), CK19 (gray), and DAPI (blue). Scale bar, 100 μm. (H) Quantification of CD8+ GZMB+ cells, n=3/group. Student’s t test was used to determine significance. (I) Violin plots showing normalized expression levels of T cell exhaustion markers in all CD8+ T cell populations identified in KF and KFCA.
-
Figure 3—source data 1
Single cell population levels used to calculate the percentage of lymphocytes in KF and KFCA.
- https://cdn.elifesciences.org/articles/80721/elife-80721-fig3-data1-v2.xlsx
Figure 4 with 2 supplements
Systemic inhibition of arginase by CB-1158 in combination with anti-PD1 reduces tumor growth in an orthotopic pancreatic ductal adenocarcinoma mouse model.
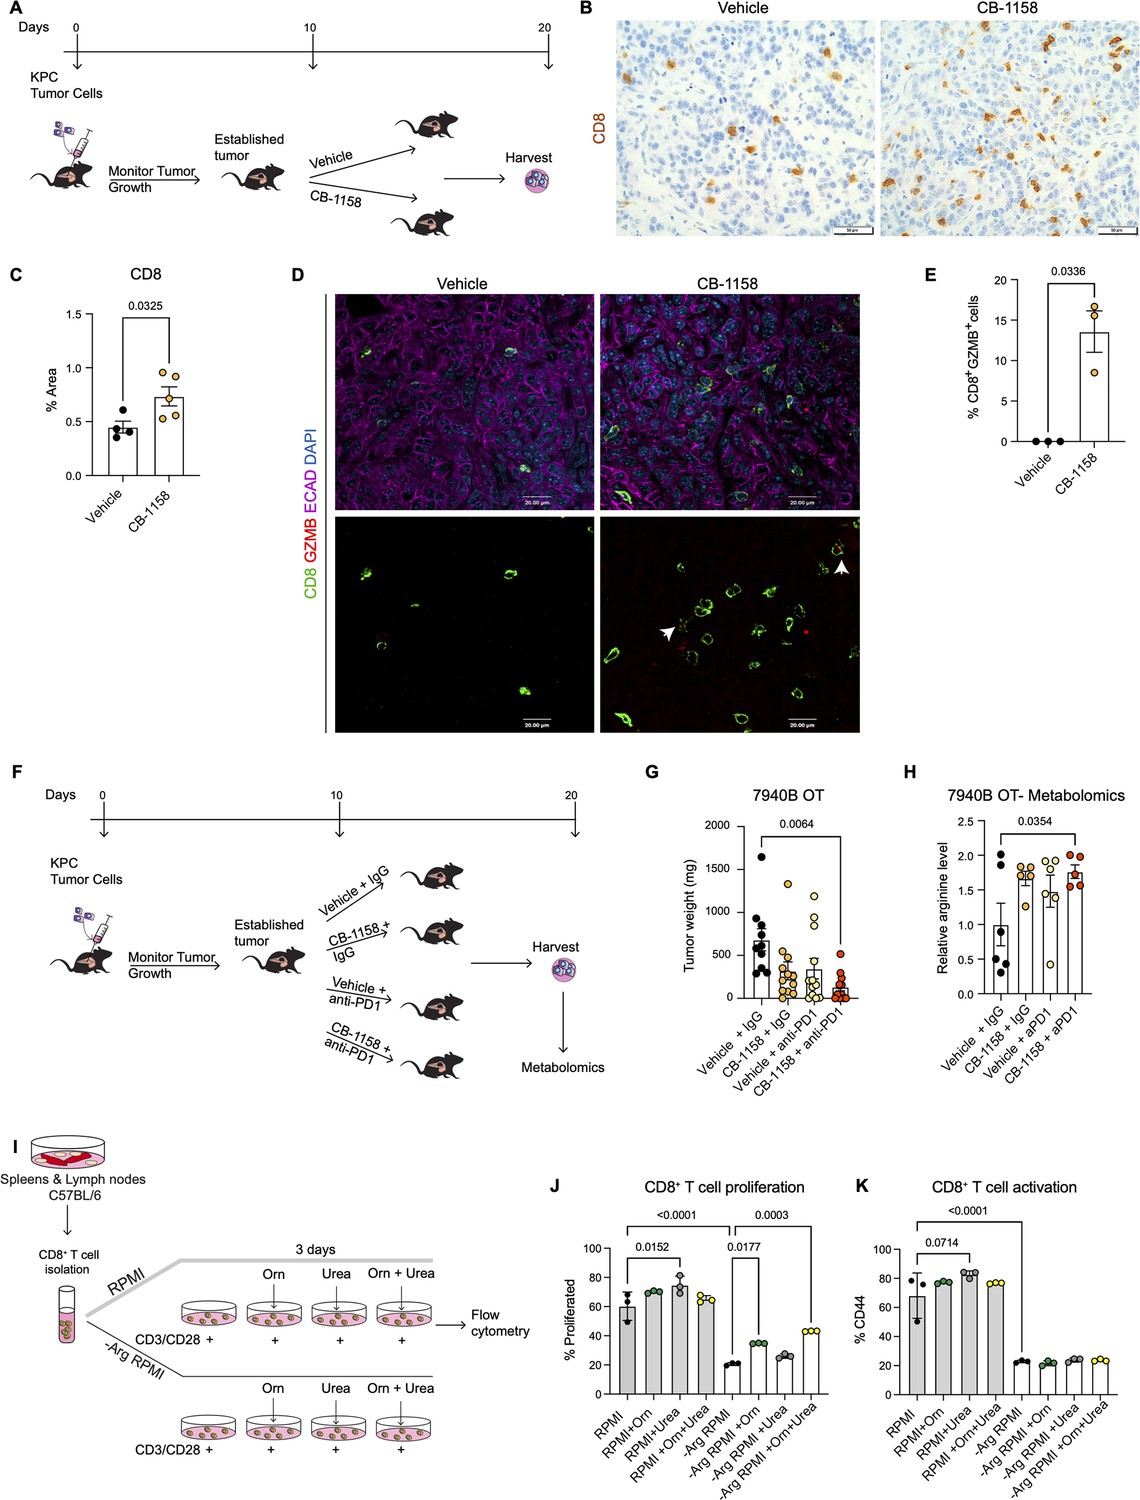
(A) Experimental timeline and design for orthotopic transplantation of 7940B KPC cells in syngeneic mice. (B) Representative images of immunohistochemistry staining for CD8 (brown). Scale bar, 50 μm. (C) Quantification of positive area of CD8 staining from B. Statistical significance was determined using unpaired t-test with Welch’s correction. (D) Representative images of co-immunofluorescence staining for CD8 (green), GZMB (red), ECAD (purple), and DAPI (blue) in the vehicle and CB-1158 treated group. Scale bar, 20 μm. White arrows point to co-localization of CD8 (green) with GZMB (red). (E) Percentage of CD8+ and GZMB+ cells. Statistical significance was determined using unpaired t-test with Welch’s correction. (F) Experimental timeline and design for orthotopic transplantation of 7940B KPC cells in syngeneic mice and different treatment groups. (G) Final tumor weight (mg) from the different treatment groups, n=10–12/group. Statistical significance was determined using two-way ANOVA with Tukey’s multiple comparisons correction test. (H) Metabolomic analysis showing relative arginine levels in the tumors of the different treatment groups. Two-way ANOVA was used to determine statistical significance, n=5–6/group. (I) Experimental scheme for CD8+ T cell isolation and growth in different media conditions. −Arg RPMI = RPMI lacking arginine, Orn = ornithine. (J) Percent of proliferated CD8+ T cells from flow cytometry analysis. (K) Percent of activated CD8+ T cells (CD44) from flow cytometry analysis. Two-way ANOVA with Tukey’s multiple comparisons correction test was used to determine significance. n=3/condition.
Figure 4—figure supplement 1
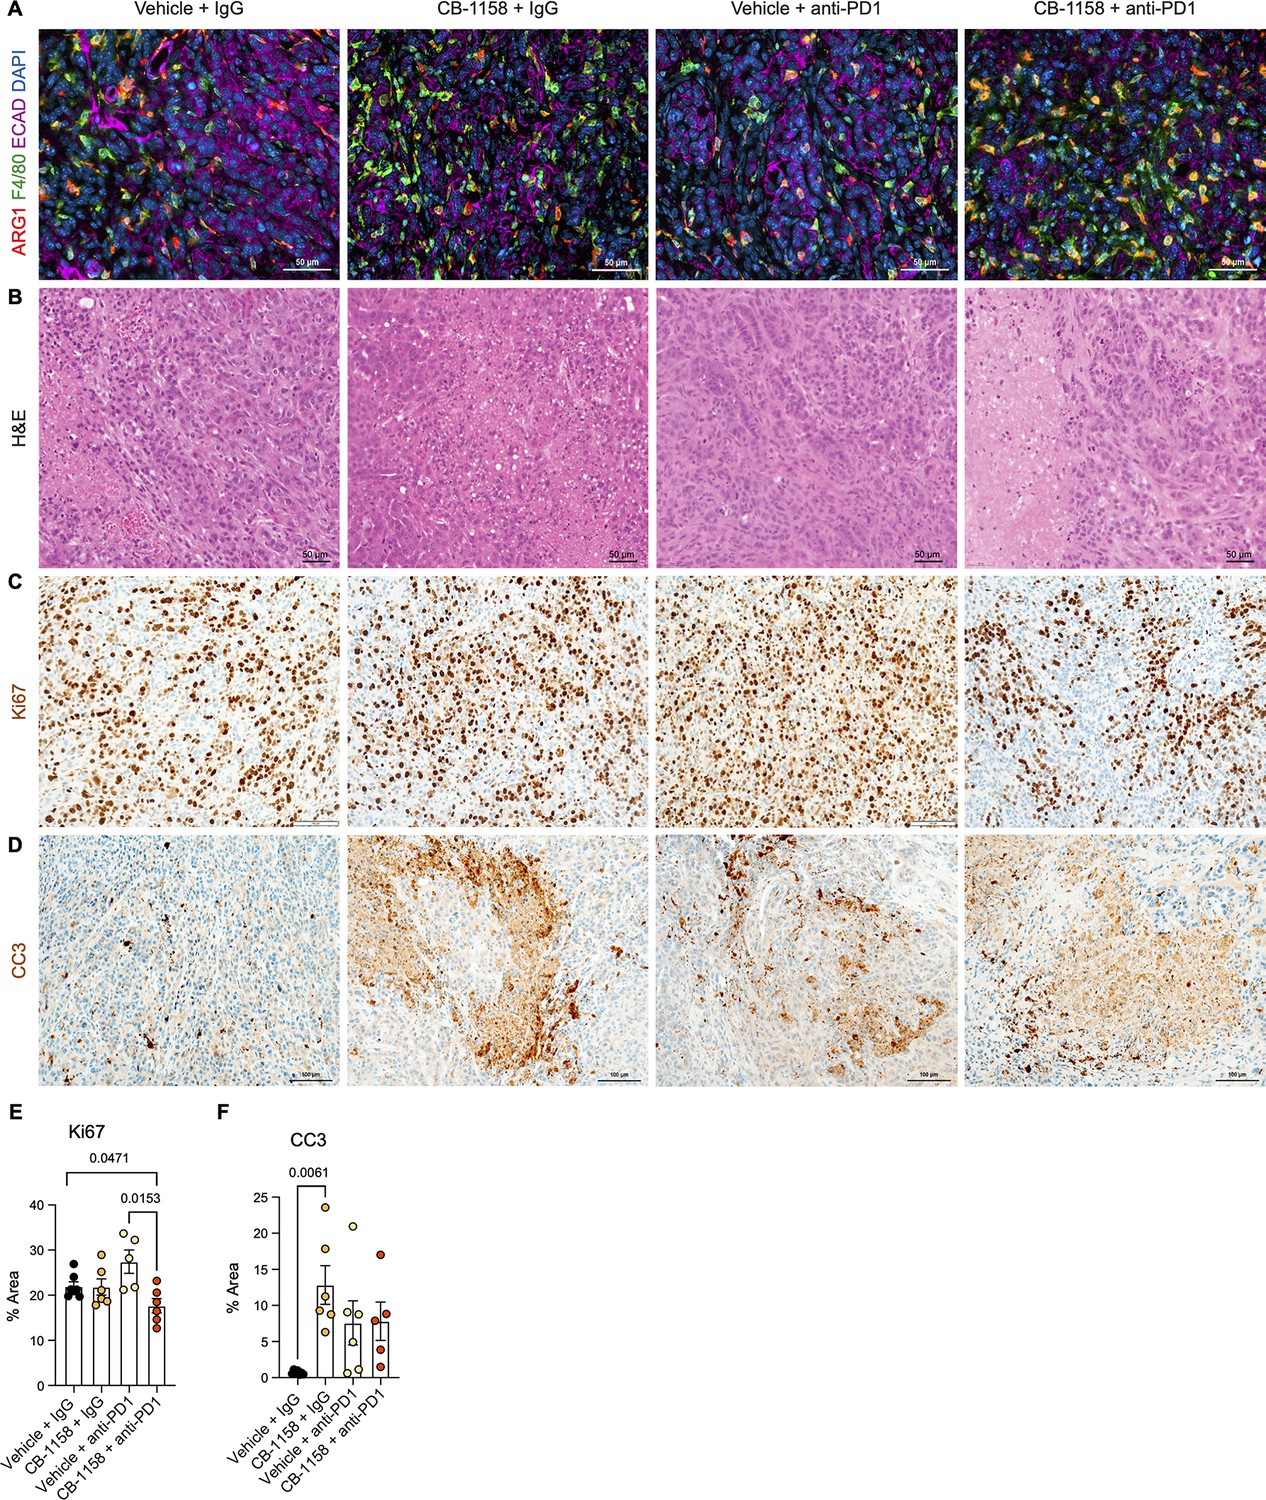
Histological analysis of the multiple treatment groups in the orthotopic mouse model.
(A) Representative images of co-immunofluorescence staining for ARG1 (red), F4/80 (green), ECAD (purple), and DAPI (blue). Yellow shows co-localization of ARG1 with F4/80 macrophages. Scale bar, 50 μm. (B) Hematoxylin and eosin (H&E) staining for the indicated treatment groups. Scale bar, 50 μm. (C) Immunohistochemistry staining for cell proliferation (Ki67). Positive staining is shown in brown. Scale bar, 100 μm. (D) Immunohistochemistry staining for cell death (cleaved caspase-3 [CC3]). Positive staining is shown in brown. Scale bar, 100 μm. (E and F) Quantification of the positive staining area for Ki67 and CC3 from C and D. Significance was determined using unpaired t test with Welch’s correction.
Figure 4—figure supplement 2

Flow cytometry gating strategy for CD8+ T cell proliferation and activation.
(A) Representative gating strategy for cells cultured in RPMI control media. (B) Representative grating strategy for cells cultured in RPMI media lacking arginine (−Arg RPMI). (C) Proliferating lymphocytes. (D) Activated lymphocytes (CD44+).
Figure 5
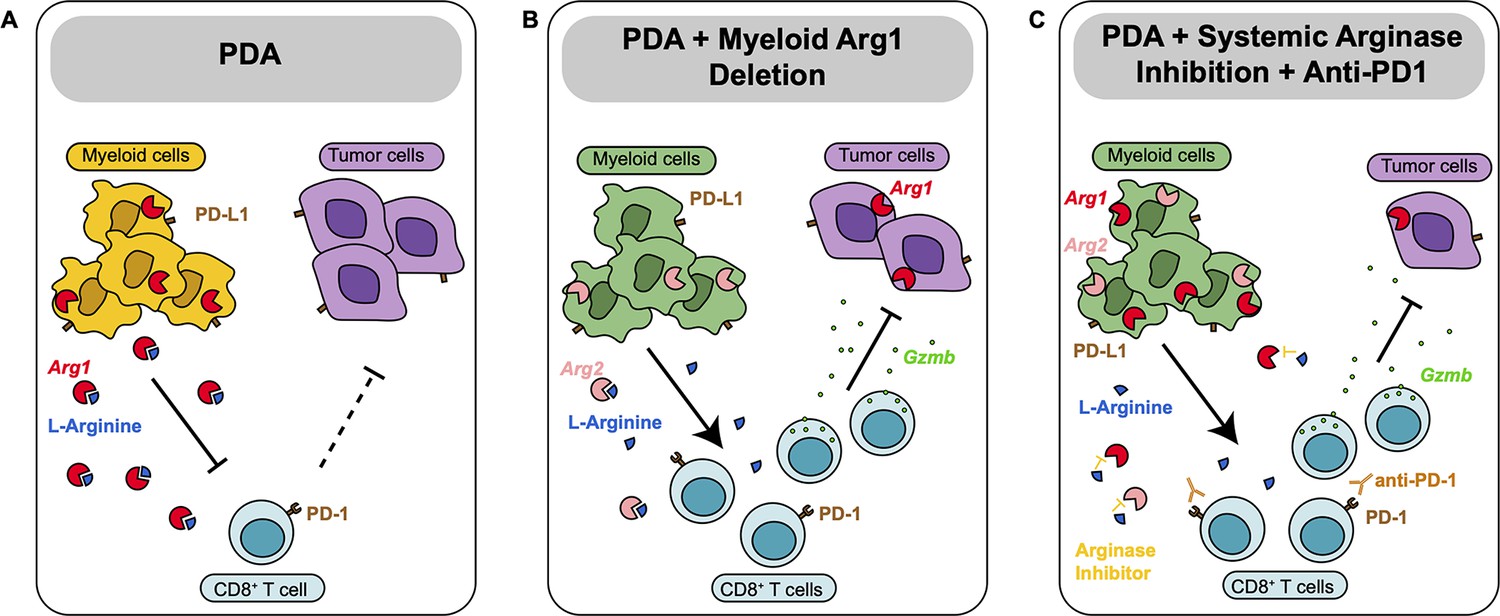
Diagram depicting our working model.
(A) In pancreatic ductal adenocarcinoma (PDA), expression of Arg1 in myeloid cells is immune suppressive. (B) Deletion of Arg1 in myeloid cells in a spontaneous PDA mouse model induces macrophage repolarization and decreases tumor formation. (C) Systemic Arginase inhibition in combination with anti-PD1 immune checkpoint blockade further decreases tumor growth.
Tables
Key resources table
| Reagent type (species) or resource | Designation | Source or reference | Identifiers | Additional information |
|---|---|---|---|---|
| Strain, strain background (Mus musculus) | C57BL/6 J | Jackson Laboratory | Stock #: 000664 | |
| Strain, strain background (M. musculus) | Arg1f/f | Jackson Laboratory | Stock #: 008817 | |
| Strain, strain background (M. musculus) | KF | Wen et al., 2019 | ||
| Strain, strain background (M. musculus) | KFCA | This paper | Pasca di Magliano Lab, University of Michigan | |
| Cell line (M. musculus) | 7940B | Long et al., 2016 | KPC cell line | |
| Antibody | ARG1 (Rabbit, monoclonal) | Cell Signaling, Danvers, MA | Cat #: 93668 S | IF: 1:75 WB: 1:1000 |
| Antibody | CD45 (Mouse, monoclonal) | R&D Systems, Minneapolis, MN | Cat #: MAB14302 | IF: 1:400 |
| Antibody | ECAD (Mouse, monoclonal) | Cell Signaling, Danvers, MA | Cat #: 14472 S | IF: 1:50 |
| Antibody | F4/80 (Rabbit, monoclonal) | Cell Signaling, Danvers, MA | Cat #: 70076 S | IF: 1:250 IHC: 1:250 |
| Antibody | CK19, Troma III (Rat, monoclonal) | Developmental Studies Hybridoma Bank, Iowa City, IA | IF: 1:50 | |
| Antibody | Ki67 (Rabbit, polyclonal) | Abcam, Cambridge, UK | Cat #: ab15580 | IHC: 1:1000 |
| Antibody | CC3 (Rabbit, polyclonal) | Cell Signaling, Danvers, MA | Cat #: 9661 L | IHC: 1:300 |
| Antibody | CD8 (Rabbit, monoclonal) | Cell Signaling, Danvers, MA | Cat #: 98941 S | IHC: 1:300 IF: 1:400 |
| Antibody | APOE (Rabbit, monoclonal) | Abcam | Cat #: ab183597 | IF: 1:500 |
| Antibody | COX1 (Goat, polyclonal) | Santa Cruz | Cat #: Sc-1754 | IF: 1:200 |
| Antibody | GZMB (Rabbit, monoclonal) | Cell signaling | Cat #: D2H2F | IF: 1:800 |
| Antibody | Vinculin (Rabbit, monoclonal) | Cell signaling | Cat #: 13901 S | WB: 1:1000 |
| Commercial assay, kit | Alexa fluor 488 Tyramide SuperBoost kit | Invitrogen | Cat #: B40922 | |
| Commercial assay, kit | RNA Scope Multiplex Fluorescent v2 Detection Kit | Advanced Cell Diagnostics | Cat #: 323110 | |
| Commercial assay, kit | RNAscope Probe-Hs-ARG1 | Advanced Cell Diagnostics | Cat #: 401581 | |
| Chemical compound, drug | CB-1158 | Calithera Biosciences, Inc, South San Francisco, CA | 100 mg/kg, Oral gavage, twice a day | |
| Chemical compound, drug | Anti-PD1 | BioXcell | Cat #: BE0033-2, clone J43 | 200 μg/i.p. Every 3 d |
| Software, algorithm | R Studio | Rstudio.com | Version: 4.1.1 -- "Kick Things" | |
| Software, algorithm | ImageJ | Imagej.nih.gov | Version: 2.0.0-rc-69/1.52 p | |
| Software, algorithm | Adobe Illustrator | Adobe.com | 2022 | |
| Software, algorithm | Halo software | Indica Labs | ||
| Software, algorithm | Prism 9 for macOS | Graphpad.com | Version: 9.4.1 (458), July 18, 2022 |
Additional files
Download links
A two-part list of links to download the article, or parts of the article, in various formats.
Downloads (link to download the article as PDF)
Open citations (links to open the citations from this article in various online reference manager services)
Cite this article (links to download the citations from this article in formats compatible with various reference manager tools)
Arginase 1 is a key driver of immune suppression in pancreatic cancer
eLife 12:e80721.
https://doi.org/10.7554/eLife.80721


