Modular, cascade-like transcriptional program of regeneration in Stentor
- Department of Biochemistry & Biophysics, University of California, San Francisco, United States
- Department of Mechanical Engineering, Stanford University, United States
Figures
Figure 1
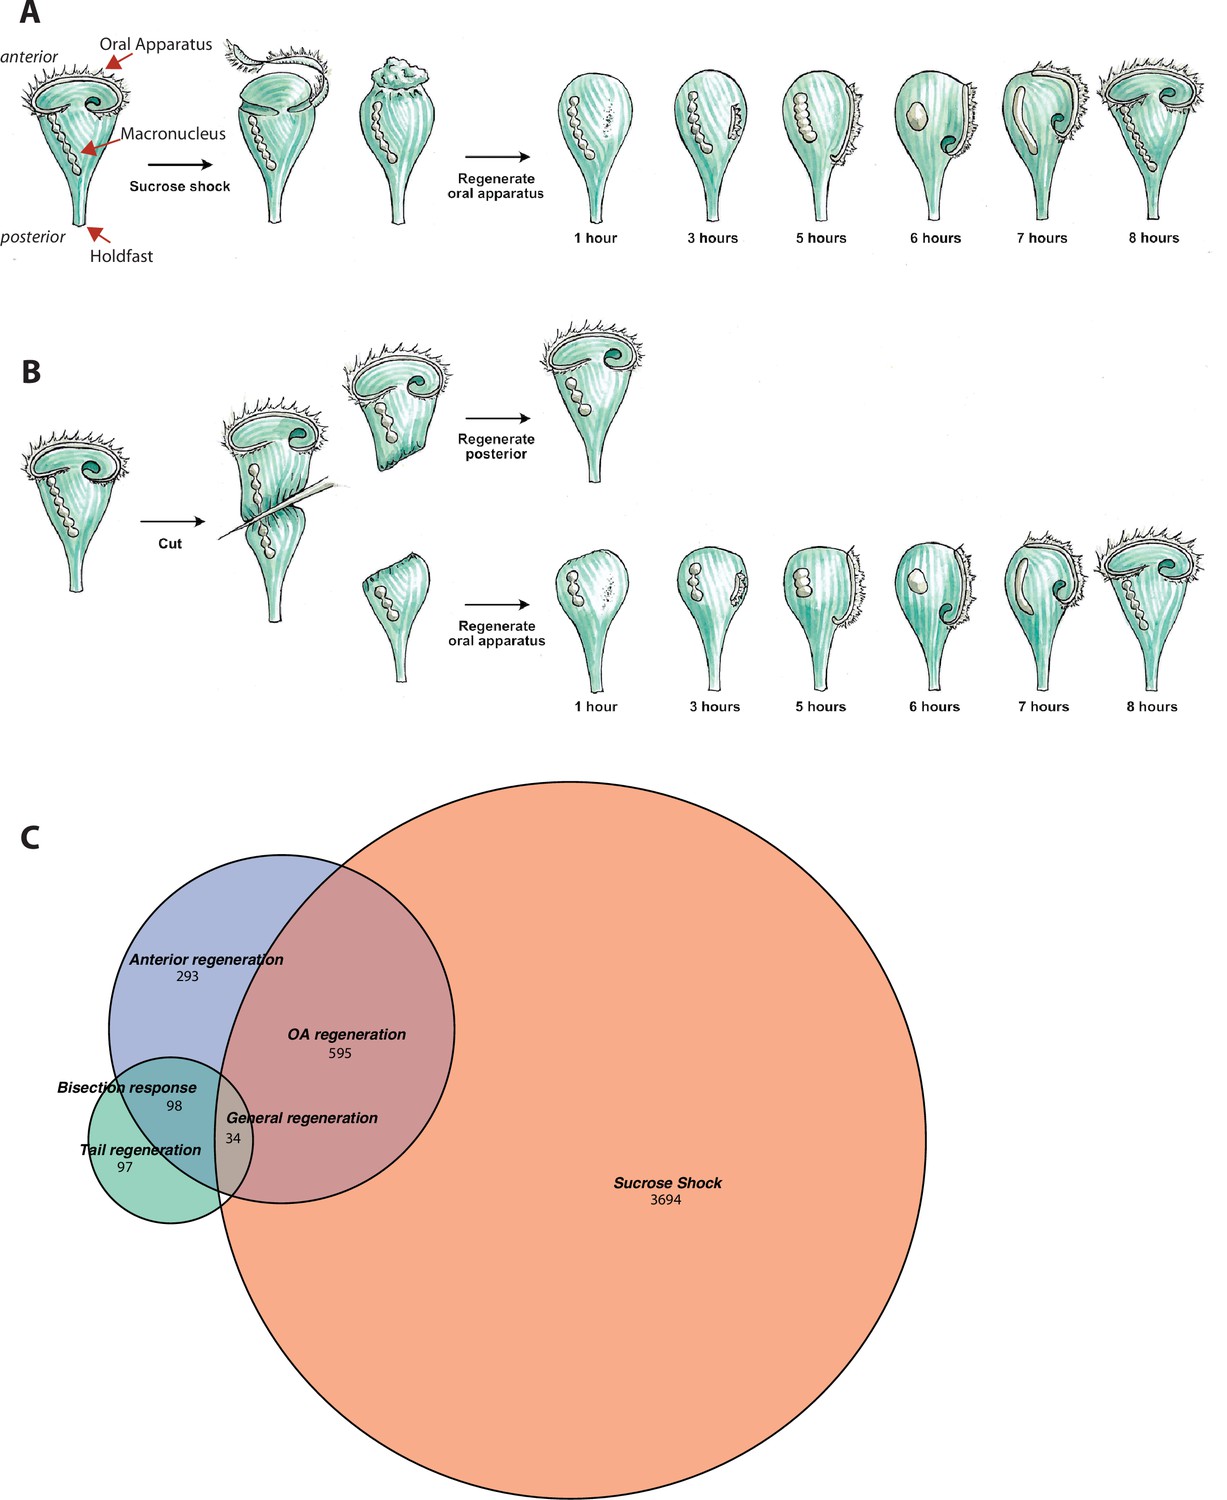
Transcriptional profiling of Stentor regeneration.
(A) Morphological events in Stentor regeneration. At t=0,the membranellar band is shed during sucrose shock. The body cilia remain on the cell. After sucrose shock the frontal field protrudes, resulting in the anterior end of Stentor becoming rounded rather than cone-shaped. One hour after the start of regeneration, basal bodies begin to form at the locus of stripe contrast. After 3 hr, the first cilia of the new membranellar band are visible. These cilia show uncoordinated beating. After 5 hr, the new membranellar band elongates and extends along the anterior-posterior axis. A site for the new mouthparts is cleared at the posterior end of the membranellar band. During this stage, the cilia become oriented with respect to each other and their beating begins to become coordinated, forming multiple short metachronal waves. The nodes of the macronucleus begin to condense. By 6 hr, the mouthparts are completely formed and the macronucleus is fully condensed. At 7 hr the membranellar band and mouth migrate to the anterior end of the cell. The macronucleus extends into a sausage-like shape. By 8 hr after sucrose shock the Stentor is fully regenerated. The membranellar band completely wraps around the anterior of the cell, all of the oral cilia coordinate to form a single metachronal wave, the macronucleus is re-nodulated, and the cell resumes normal feeding activity. (B) Surgical bisection of Stentor. When a Stentor cell is cut in half perpendicular to the long axis, two cell fragments are produced, an anterior half-cell and a posterior half-cell. Immediately after cutting, both half-cells heal their wounded edges. The anterior half-cell then regenerates a new posterior body including the hold-fast, and the posterior half-cell regenerates a new anterior body including the oral apparatus (OA). Oral regeneration in the posterior half-cell has the same general morphological events and timing as oral regeneration in the sucrose-shocked cells. Both fragments are able to regenerate because the elongated macronucleus that is divided into both halves during surgery is highly polyploid, ensuring that each half-cell retains many copies of the genome. (C) Comparative transcriptional profiling. We performed RNA sequencing (RNAseq) on sucrose-shocked cells regenerating as in panel A, as well as on both the anterior and posterior half-cells regenerating after bisection as in panel B. These three datasets are represented by the three circles of the Venn diagram, with blue representing genes expressed during regeneration in bottom half-cells after bisection, green representing genes expressed during regeneration in top half-cells after bisection, and coral representing genes expressed during regeneration in cells following sucrose shock. Genes were grouped into modules according to correlated expression patterns shared between two or more fragments. For example, the ‘general regeneration’ module was defined based on genes showing differential expression in all three cases of regeneration (OA, anterior half, and posterior half).
Figure 2
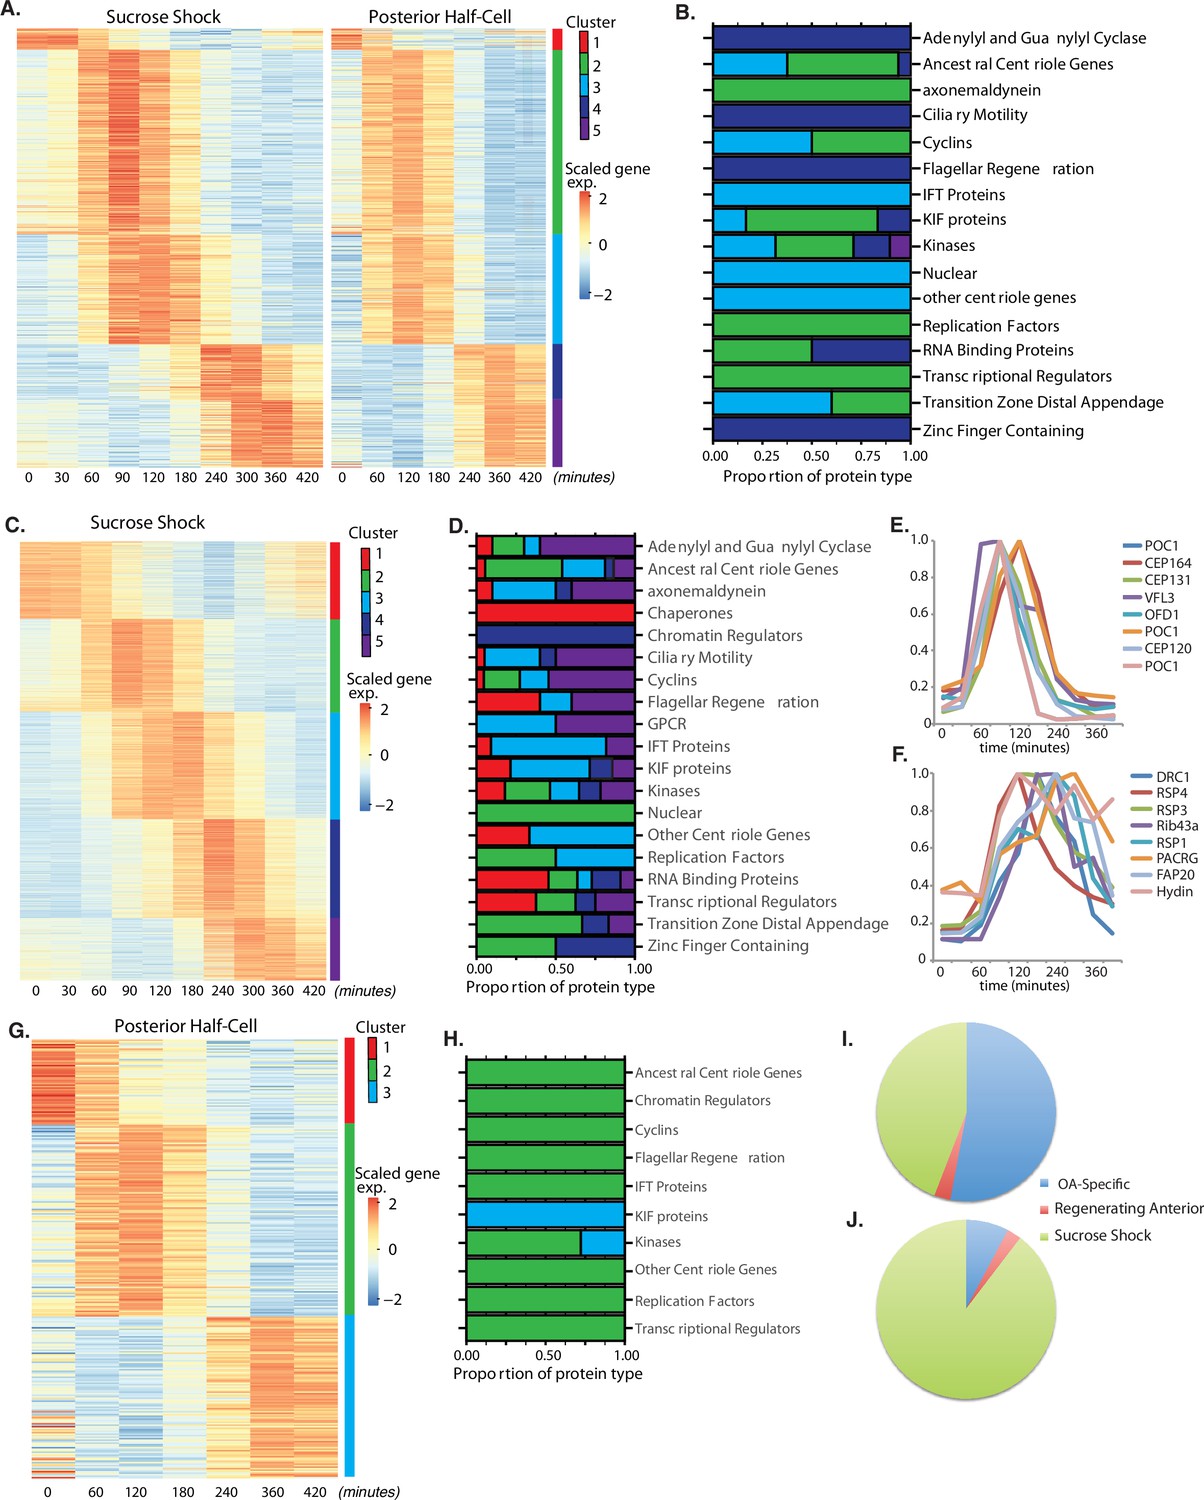
Oral apparatus (OA) regeneration program.
(A) OA-specific gene expression profile determined using combined sucrose shock and bisection samples. Genes are clustered into five groups using ‘clara’ clustering (as indicated by the colored bar on the y axis). Time since sucrose shock or bisection (in minutes) is on the x-axis. Group 1 contains all genes whose expression decreases during regeneration compared to initial levels. The peak expression of each cluster of genes corresponds with major developmental features identified morphologically (as described in Figure 1A). Z-score is calculated per row and color coded with shades of red representing expression higher than the row average and blue lower than the row average. (B) Proportion of gene types in each cluster for a set of reference gene classes. (C) Expression heatmap of genes expressed in sucrose-shocked cells that are not included in the OA-specific set of panel A. (D) Proportion of gene types in each cluster for sucrose shock-specific genes. (E) Expression time course of a selected set of canonical centriole-related genes, showing their coordinate expression at a time in regeneration when numerous centriole/basal bodies are forming at the start of OA biogenesis. (F) Expression time course of a set of highly conserved genes expressing proteins known to be involved in ciliary structure and motility. Comparison with panel E illustrates that cilia-related gene expression occurs later than centriole-related gene expression. (G) Expression heatmap of gene expressed in regenerating posterior half-cells that are regenerating new anterior portions, showing genes specific to the regenerating posterior and not included in the OA-specific set of panel A. (H) Proportion of gene types in each cluster for regenerating posterior half-cells. (I,J) Pie charts showing fraction of all centriole (I) and cilia (J) genes showing upregulation in the two paradigms (sucrose shock and posterior halves), illustrating that most upregulated cilia-related genes are specific to sucrose shock.
Figure 3

Expression modules distinct from oral apparatus (OA) regeneration.
(A) Expression in anterior half-cells that are regenerating posterior tails including holdfast. (B) Genes showing correlated differential expression in both halves of bisected cells. (C) Genes showing differential expression in all three types of regenerating cell fragments, sucrose shocked, anterior half-cell, and posterior half-cell.
Figure 4
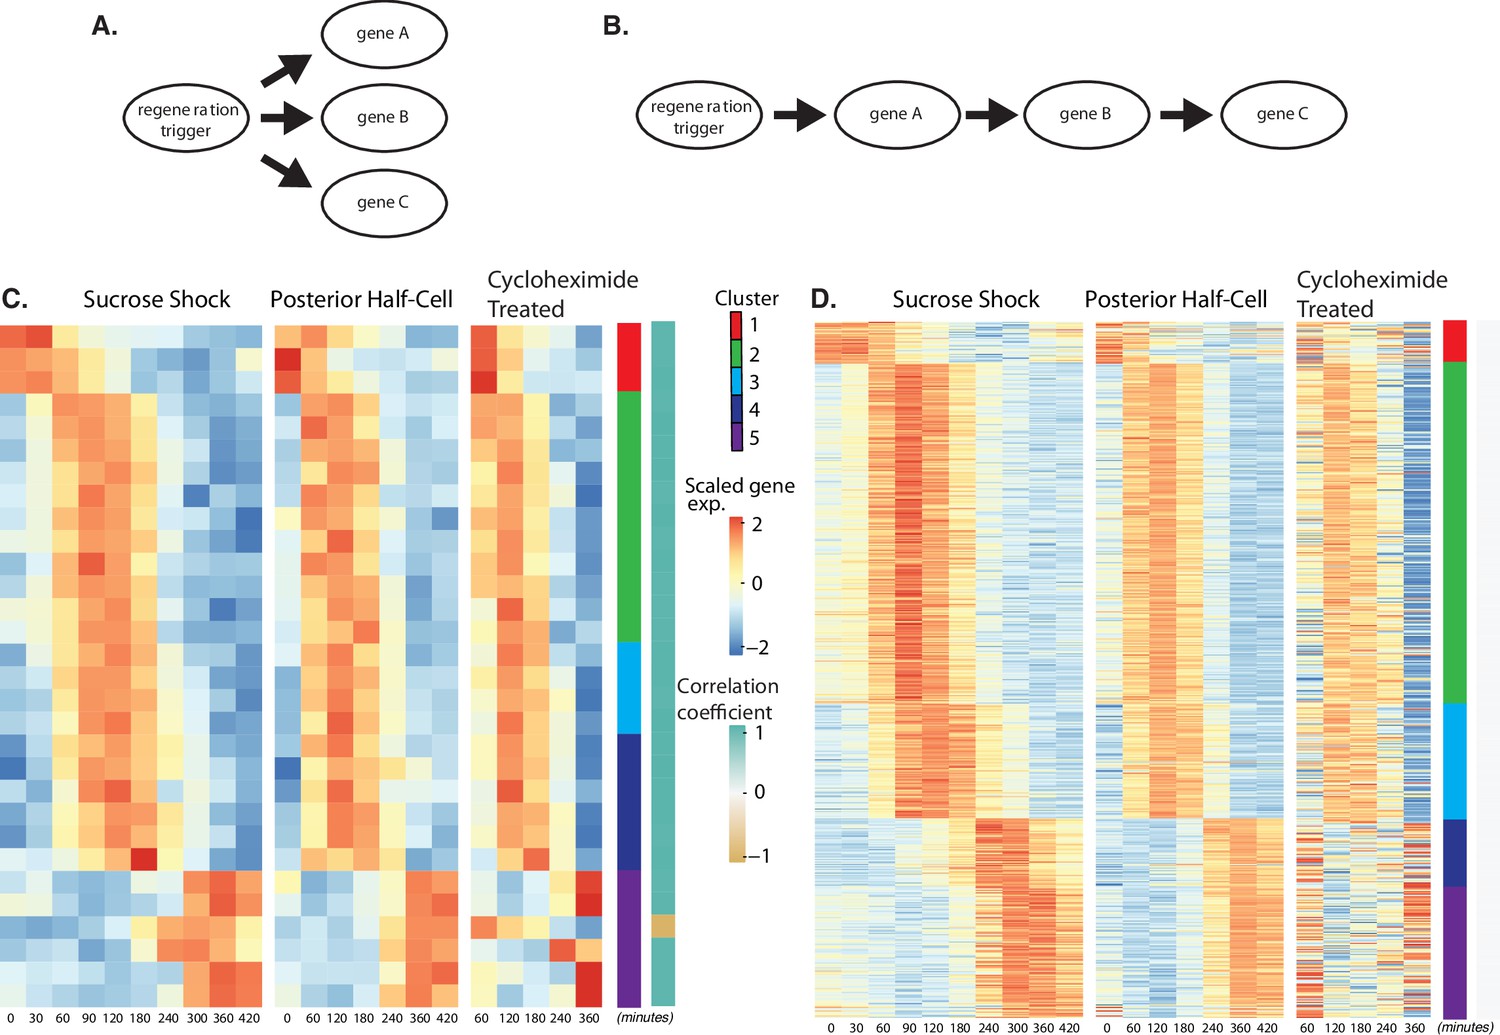
Regeneration in the absence of protein synthesis.
(A) Direct model of coordination, in which the regeneration-triggering stimulus directly triggers each gene. (B) Cascade model, in which regeneration-triggering stimulus drives one gene, whose product then drives another gene, with potentially multiple steps being required to ultimately trigger all genes in the cascade. (C) Heatmap showing OA-specific genes whose expression pattern in cycloheximide cells is highly correlated with the expression pattern in untreated cells. (D) Heatmap showing OA-specific genes whose expression pattern in cycloheximide cells is uncorrelated with the expression pattern in untreated cells.
Figure 5 with 1 supplement
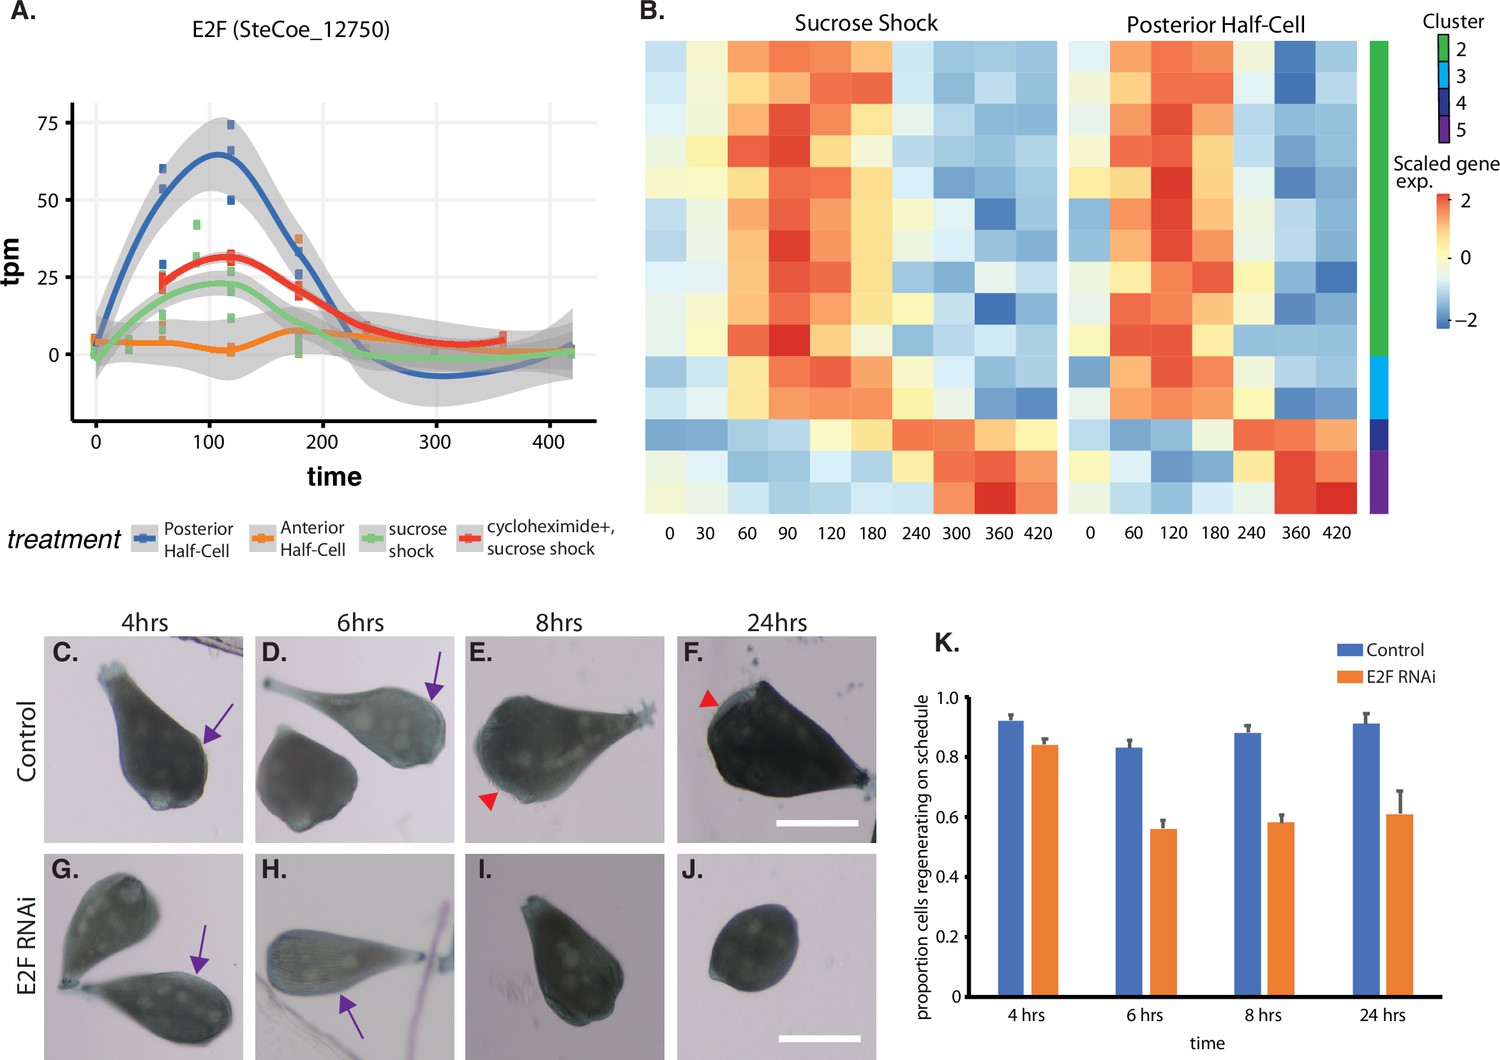
Expression of E2F and its targets during oral apparatus (OA) regeneration.
(A) E2F is an early-expressed gene. Plot shows expression of E2F homolog SteCoe_12750 as a function of time including in cycloheximide-treated cells. OA (blue curve) indicates expression in sucrose-shocked cells. The purple curve shows that E2F is still upregulated in cells in which protein synthesis is inhibited. (B) Expression heatmap of predicted E2F targets in the OA-specific expression module. Clusters refer to clusters in the original clustering of OA-specific genes (Figure 2A). Cluster 1 is not included in the plot because there were no predicted E2F targets among the cluster 1 genes. (C–F) Examples of control cells at 4, 6, 8, and 24 hr after regeneration. Purple arrows mark the location of oral primordium. Red arrow head marks the location of a fully formed OA. (G–J) Examples of E2F RNAi cells at 4, 6, 8, and 24 hr, illustrating the proper formation of the oral primordium by 4 hr, but lack of visible primordium or OA at later stages. All scale bars 200 μm. (K) Fraction of cells regenerating properly at each time point. For the 4, 6, and 8 hr time points, on-schedule regeneration is defined as cells having a visible oral primordium (4 hr), a full length primordium extended along the side of the cell (6 hr), and an oral apparatus located at the anterior end of the cell whose diameter is at least 50% of the diameter of the cell (8 and 24 hr). Total number of cells analyzed from five separate biological experiments was n=206 for control and 310 for RNAi. Error bars represent standard error for the proportions expected based on a Bernoulli distribution. For all four time points, the proportion of RNAi cells regenerating on schedule (defined according to a set of milestone events as described in Materials and methods) was significantly less than for controls, with p values of (p=0.007, p<0.0001, p<0.0001, and p=0.0005) respectively based on Fisher’s exact test.
Figure 5—figure supplement 1
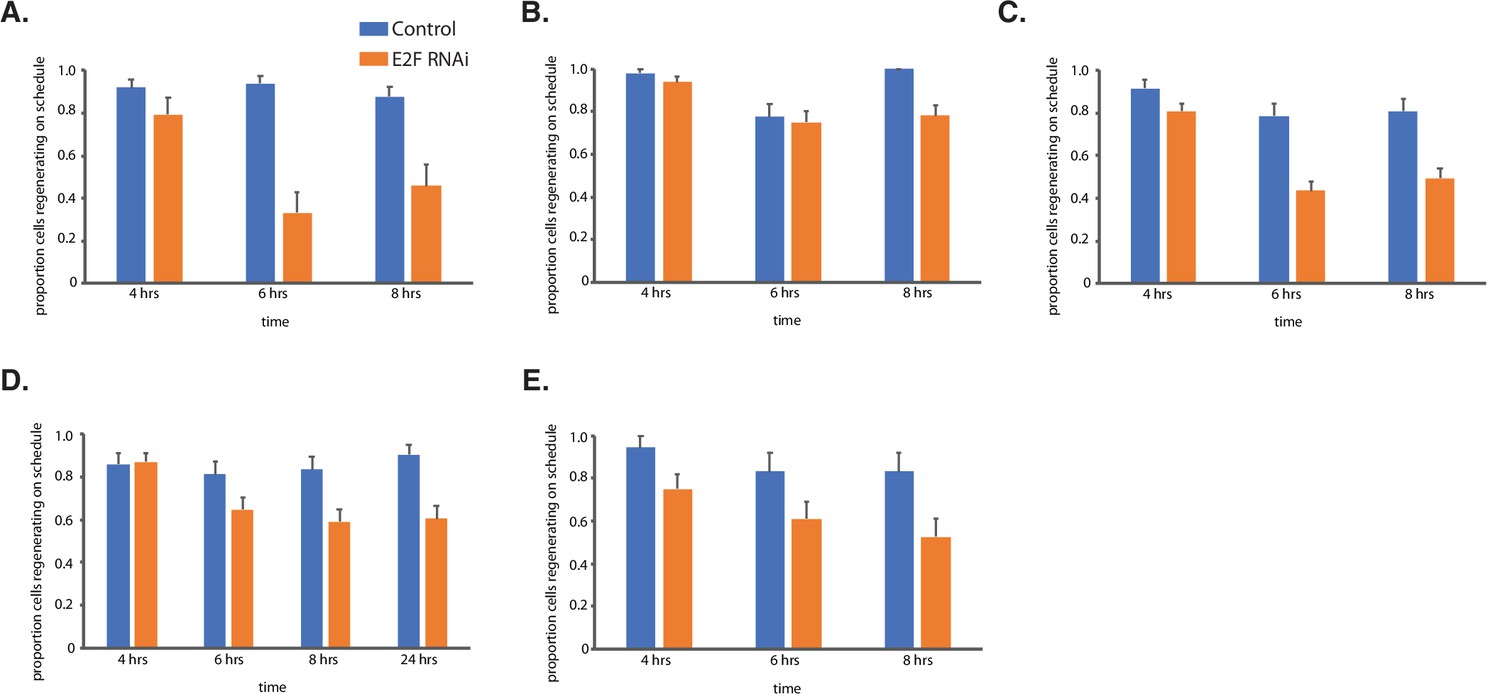
Additional information for Figure 5.
Outcomes of regeneration assays for E2F RNAi experiments shown for five separate experiments done on different days with different batches of cells prepared separately. Numbers of cells analyzed in each experiment are as follows. (A) Control n=49 RNAi n=24. (B) Control n=49 RNAi n=64. (C) Control n=47 RNAi n=115. (D) Control n=43 RNAi n=71. (E) Control n=18 RNAi n=36. Data from these experiments were combined to produce the overall histogram in Figure 5K. Error bars represent standard error.
Figure 6 with 1 supplement
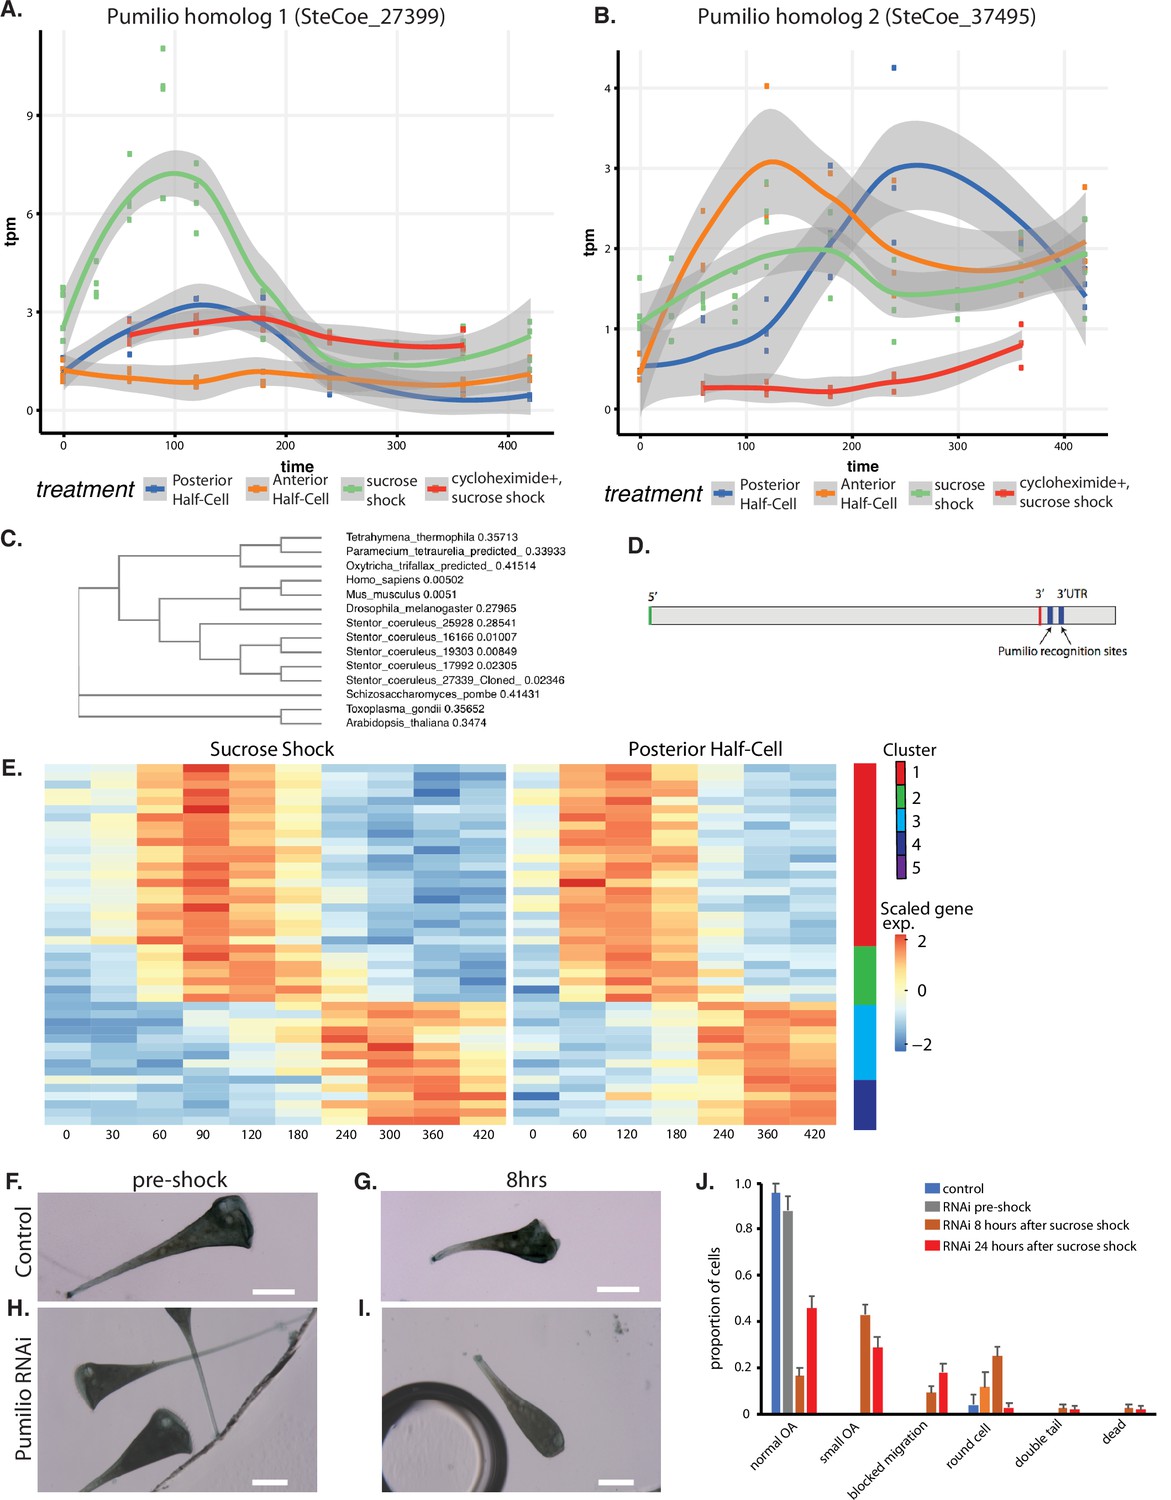
Pumilio is an early-expressed gene in oral apparatus (OA) regeneration.
(A) Expression versus time plot of Pumilio ortholog SteCoe_27339 upregulated in both cases of OA regeneration: sucrose shock (blue curve) and regeneration of the anterior half of a posterior half-cell (red curve). Expression is still seen in cycloheximide-treated cells, indicating that this Pumilio ortholog is an ‘early’ gene in the cascade. SteCoe_27339 is not expressed in anterior half-cells which are not regenerating an OA. (B) Expression versus time of Pumilio ortholog SteCoe_37495 which is upregulated in all three regeneration cases, but with different timing as indicated by the blue, green, and red curves. Unlike SteCoe_27339, this Pumilio ortholog is not expressed in cells treated with cycloheximide, indicating it is a ‘late’ gene whose expression depends on earlier gene products of the cascade. (C) Phylogenetic tree of stentor Pumilio orthologs. (D) Example of predicted Pumilio recognition sequences in a target gene (SteCoe_10652) encoding a CAMK family kinase showing OA-specific expression. (E) Expression heatmap of predicted Pumilio targets in the OA-specific module. (F–J) RNAi analysis of Pumilio function during regeneration of OA following sucrose shock in Stentor. (F) Pre-shock control cells. (G) Control cells 8 hr after sucrose shock. (H) Pre-shock Pumilio RNAi cells showing normal cell shape and OA size. (I) Pumilio RNAi cell imaged 8 hr after sucrose shock, illustrating abnormally small OA. Scale bars 200 μm. (J) Distribution of phenotypes in RNAi of Pumilio (from three separate biological experiments, n=107). Error bars represent standard error. For images illustrating these phenotypic categories, see Figure 6—figure supplement 1 panels A–D.
Figure 6—figure supplement 1
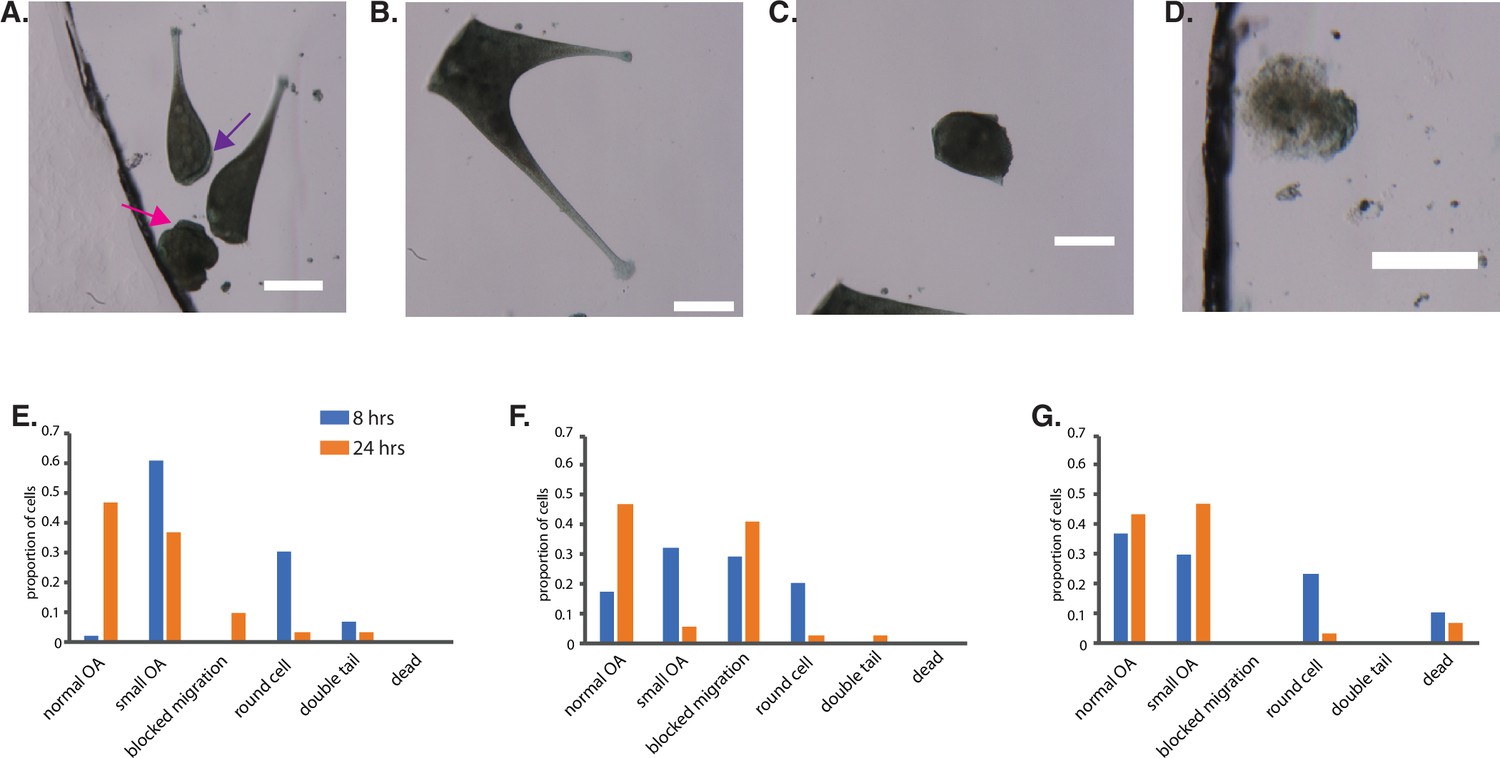
Additional information for Figure 6.
Additional examples of abnormal morphology in Pumilio RNAi cells regenerating after sucrose shock. All scale bars 200 μm. (A) Example showing a rounded cell that has lost the normal elongated cell shape (pink arrow), a cell blocked in regeneration that has a membranellar band along the side of the cell rather than in its normal fully anterior position (purple arrow), and a cell that has regenerated normally (no arrow). (B) Example of a Pumilio RNAi cell that formed two tails. (C) Example of rounded cell lacking normal cell shape. (D) Example of a cell classified as dead based on texture and color together with lack of motility. (E–G) Histograms of phenotypes observed at 8 and 24 hr after regeneration in Pumilio RNAi cells in three separate experiments that were combined to make the aggregate histogram in Figure 6J.
Tables
Table 1
List of centriole/basal body genes in the oral apparatus (OA)-specific module (Figure 2A).
| Cluster of peak expression | |||||
|---|---|---|---|---|---|
| 1 | 2 | 3 | 4 | 5 | |
| SAS6 | + | ||||
| STIL | + | ||||
| POC5 | + | ||||
| POC11/CCD77 | + | ||||
| POC18/WDR67/Tbc31 | + | ||||
| VFL3 | + | ||||
| GCP2 | + | ||||
| GCP4 | + | ||||
| Jouberin | + | ||||
| MKS1 | + | ||||
| MKS6 | + | ||||
| XRP2/TBCC | + | ||||
| RTTN | + | ||||
| CCD61 | + | ||||
| Bld10/CEP135 | + | + | |||
| CEP350 | + | + | |||
| POC16 | + | + | |||
| Centrin 2 | + | + | |||
| CEP44 | + | ||||
| POC12 | + | ||||
| Centrin 3 | + | ||||
| MKS3 | + | ||||
| LRRC45 | + | ||||
Additional files
-
Supplementary file 1
Genes showing differential expression during oral apparatus regeneration in both sucrose-shocked and bisected cells.
- https://cdn.elifesciences.org/articles/80778/elife-80778-supp1-v2.xlsx
-
Supplementary file 2
Genes showing differential expression during oral apparatus regeneration in sucrose-shocked, but not bisected, cells.
- https://cdn.elifesciences.org/articles/80778/elife-80778-supp2-v2.xlsx
-
Supplementary file 3
Genes showing differential expression during regeneration in posterior half-cells.
- https://cdn.elifesciences.org/articles/80778/elife-80778-supp3-v2.xlsx
-
Supplementary file 4
Genes showing differential expression during regeneration in anterior half-cells.
- https://cdn.elifesciences.org/articles/80778/elife-80778-supp4-v2.xlsx
-
Supplementary file 5
Genes showing differential expression during regeneration in both posterior and anterior half-cells, but not in sucrose shock.
- https://cdn.elifesciences.org/articles/80778/elife-80778-supp5-v2.xlsx
-
Supplementary file 6
Genes showing differential expression during regeneration in all three samples analyzed: sucrose shock, anterior half-cells, and posterior half-cells.
- https://cdn.elifesciences.org/articles/80778/elife-80778-supp6-v2.xlsx
-
Supplementary file 7
Comparison of differential gene expression during regeneration in Stentor coeruleus and Stentor polymorphous.
- https://cdn.elifesciences.org/articles/80778/elife-80778-supp7-v2.xlsx
-
Supplementary file 8
Comparison of differential gene expression during regeneration in Stentor coeruleus and planarian flatworms.
- https://cdn.elifesciences.org/articles/80778/elife-80778-supp8-v2.xlsx
-
Supplementary file 9
Comparison of differential gene expression during regeneration in Stentor coeruleus and zebrafish optic nerve.
- https://cdn.elifesciences.org/articles/80778/elife-80778-supp9-v2.xlsx
-
Supplementary file 10
Comparison of differential gene expression during regeneration in Stentor coeruleus and differential gene expression in the mammalian cell cycle.
- https://cdn.elifesciences.org/articles/80778/elife-80778-supp10-v2.xlsx
-
MDAR checklist
- https://cdn.elifesciences.org/articles/80778/elife-80778-mdarchecklist1-v2.pdf
Download links
A two-part list of links to download the article, or parts of the article, in various formats.
Downloads (link to download the article as PDF)
Open citations (links to open the citations from this article in various online reference manager services)
Cite this article (links to download the citations from this article in formats compatible with various reference manager tools)
Modular, cascade-like transcriptional program of regeneration in Stentor
eLife 11:e80778.
https://doi.org/10.7554/eLife.80778


