eDNA-stimulated cell dispersion from Caulobacter crescentus biofilms upon oxygen limitation is dependent on a toxin–antitoxin system
- Département de microbiologie, infectiologie et immunologie, Université de Montréal, Canada
Figures
Figure 1 with 2 supplements
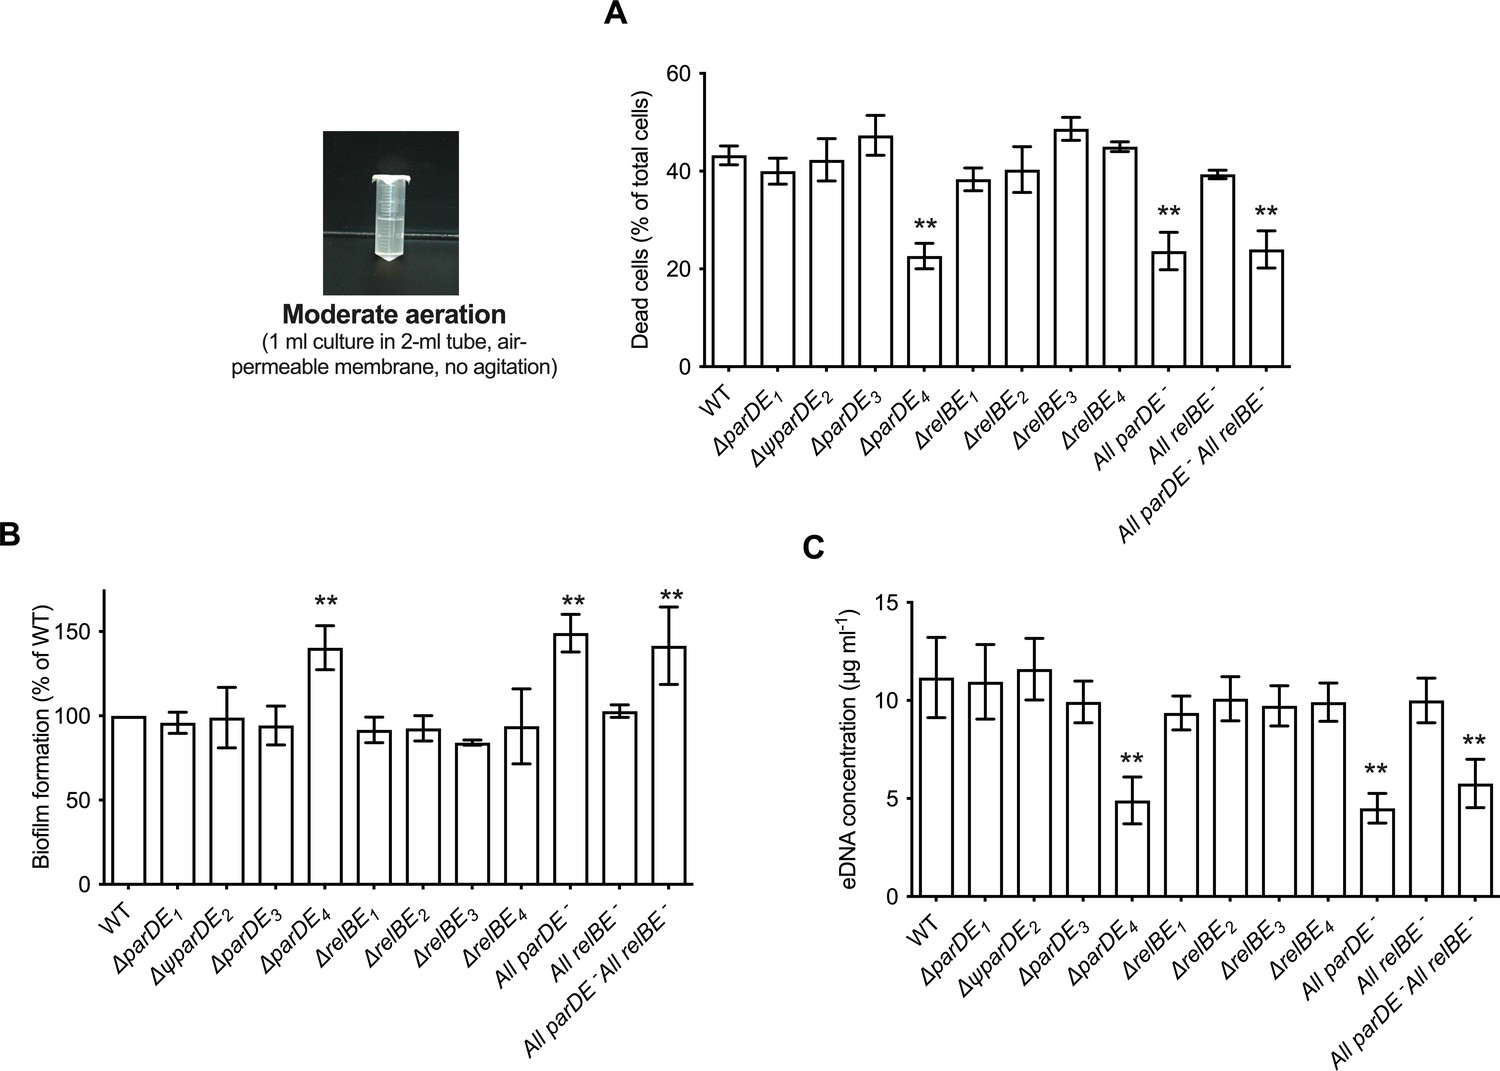
Role of the eight toxin–antitoxin systems (TAS) in cell death, extracellular DNA (eDNA) release, and biofilm formation.
C. crescentus WT and the different TAS in-frame deletion mutants were grown for 48 hr under moderate aeration conditions at 30°C in M2G medium, as depicted on the left. (A) Percentage of dead cells in the planktonic phase; results are expressed as a percentage of the total cells (live + dead) in the sample, quantified using the BacLight Live/Dead kit. (B) Biofilm formation, quantified by crystal violet staining; results are expressed as a percentage of biofilm formed compared to WT. (C) Quantification of eDNA released in the planktonic phase, using PicoGreen. Results are given as the average of four independent experiments, each run in duplicate, and the error bars represent the standard error of the mean (SEM). Statistical comparisons are calculated using Student’s unpaired t-tests; only samples statistically different from WT are shown. **p < 0.01.
Figure 1—figure supplement 1
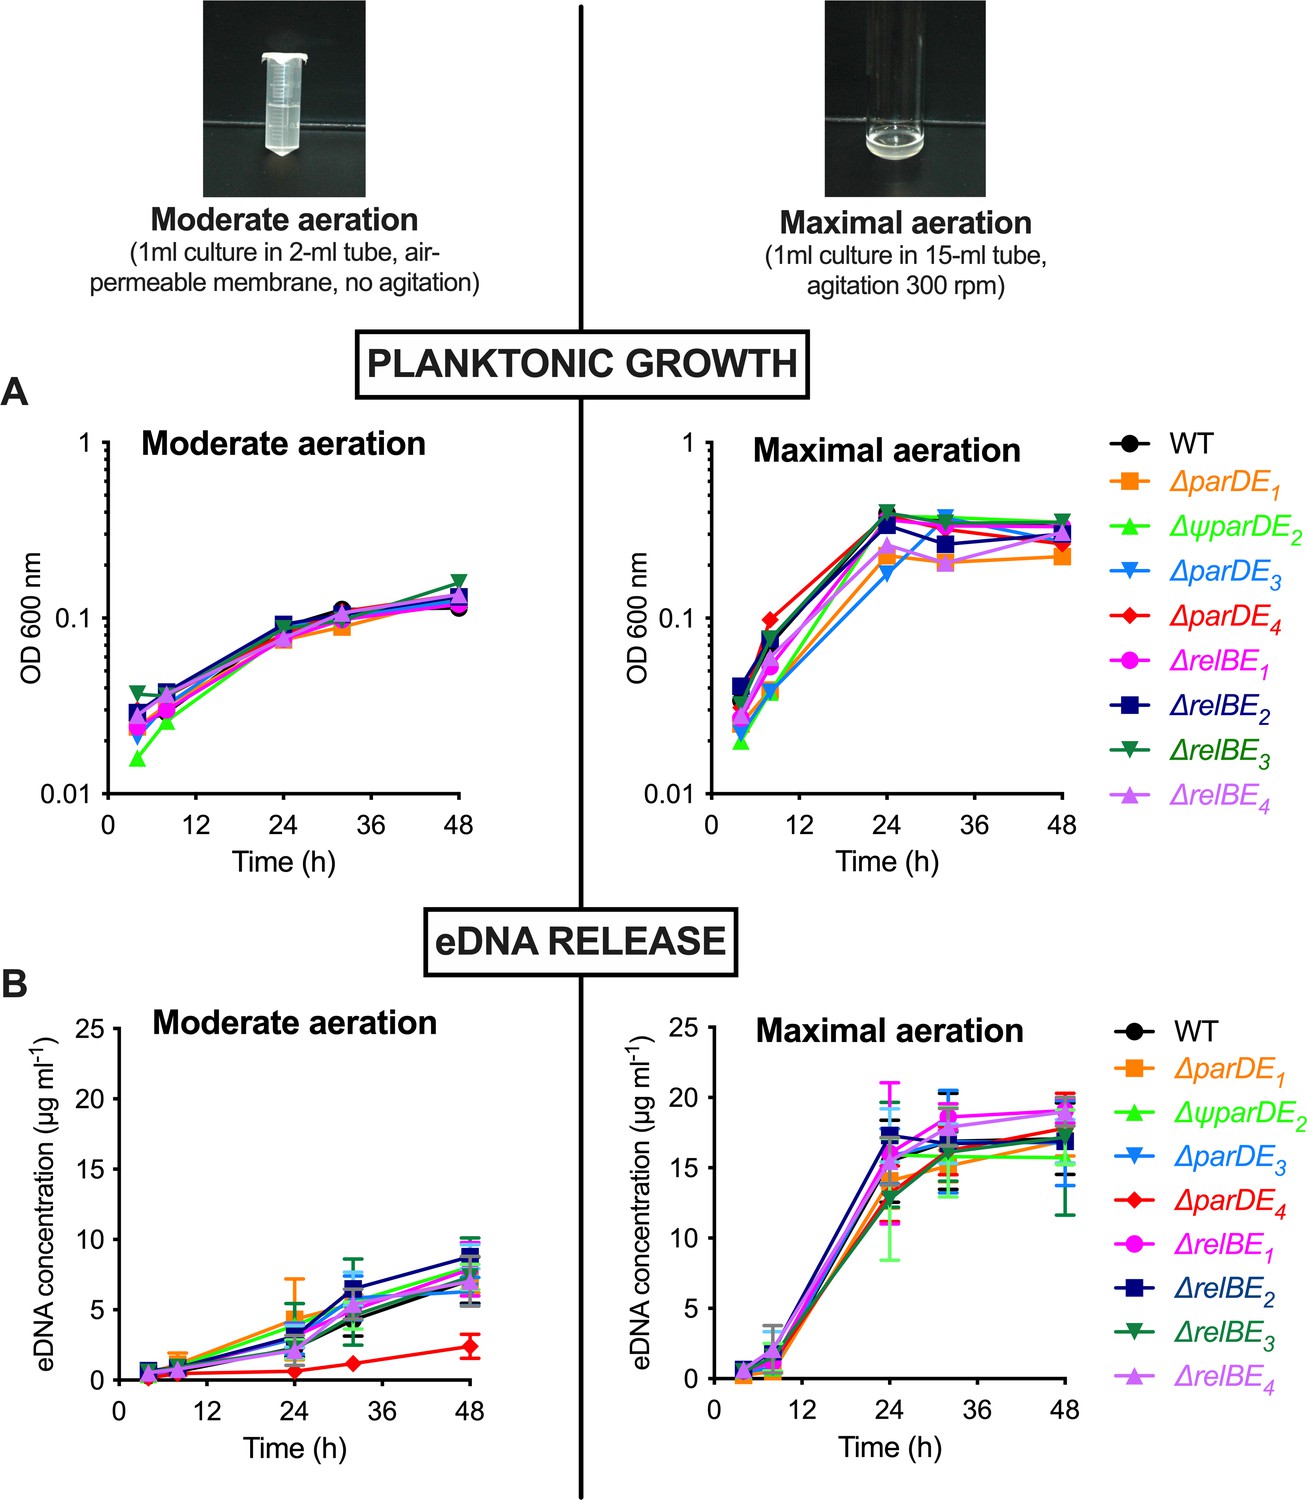
ParDE4 is involved in extracellular DNA (eDNA) release under moderate aeration conditions.
(A) Representative growth curves of cultures grown in M2G medium at 30°C, followed by OD600 over time. Cultures were grown under moderate aeration (no shaking, 1 ml culture in a 2-ml microtube sealed with AeraSeal breathable film), and under maximal aeration conditions (300 rpm shaking, 1 ml culture in a 15-ml culture tube). (B) Quantification of eDNA released in the planktonic phase in the same cultures, using PicoGreen. Results are given as the average of at least three independent experiments and the error bars represent the standard error of the mean (SEM).
Figure 1—figure supplement 2
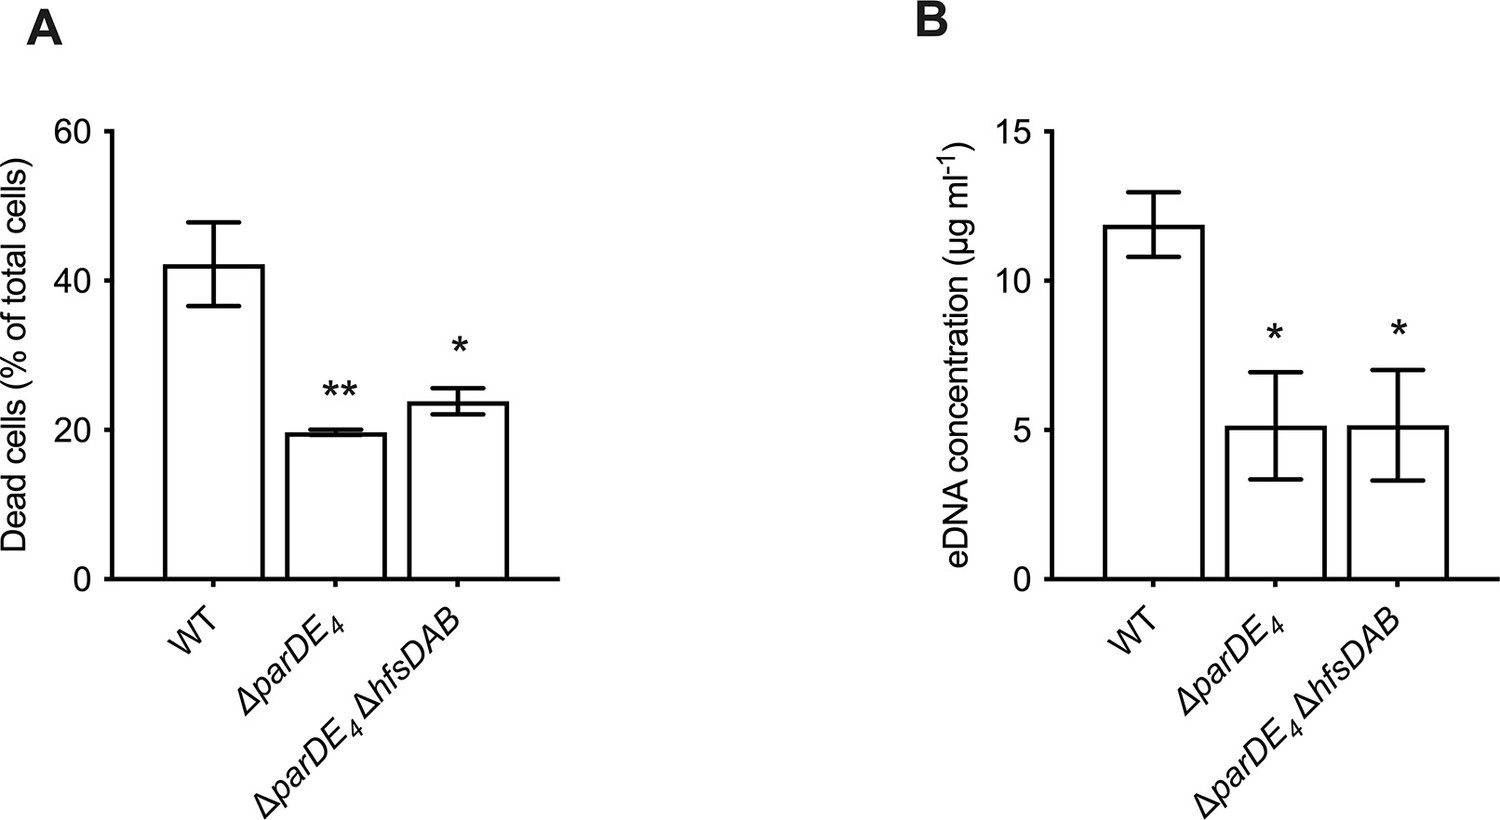
Biofilm formation is dispensable for ParDE4-mediated cell death and extracellular DNA (eDNA) release.
C. crescentus WT, ∆parDE4, and ∆parDE4 ∆hfsDAB were grown for 48 hr under moderate aeration conditions at 30°C in M2G medium. (A) Percentage of dead cells in the planktonic phase; results are expressed as a percentage of the total cells (live + dead) in the sample, quantified using the BacLight Live/Dead kit. (B) Quantification of eDNA released in the planktonic phase, using PicoGreen. Results are given as the average of three independent experiments and the error bars represent the standard error of the mean (SEM). Statistical comparisons are calculated using Student’s unpaired t-tests; * p < 0.05, **p < 0.01.
Figure 2 with 1 supplement
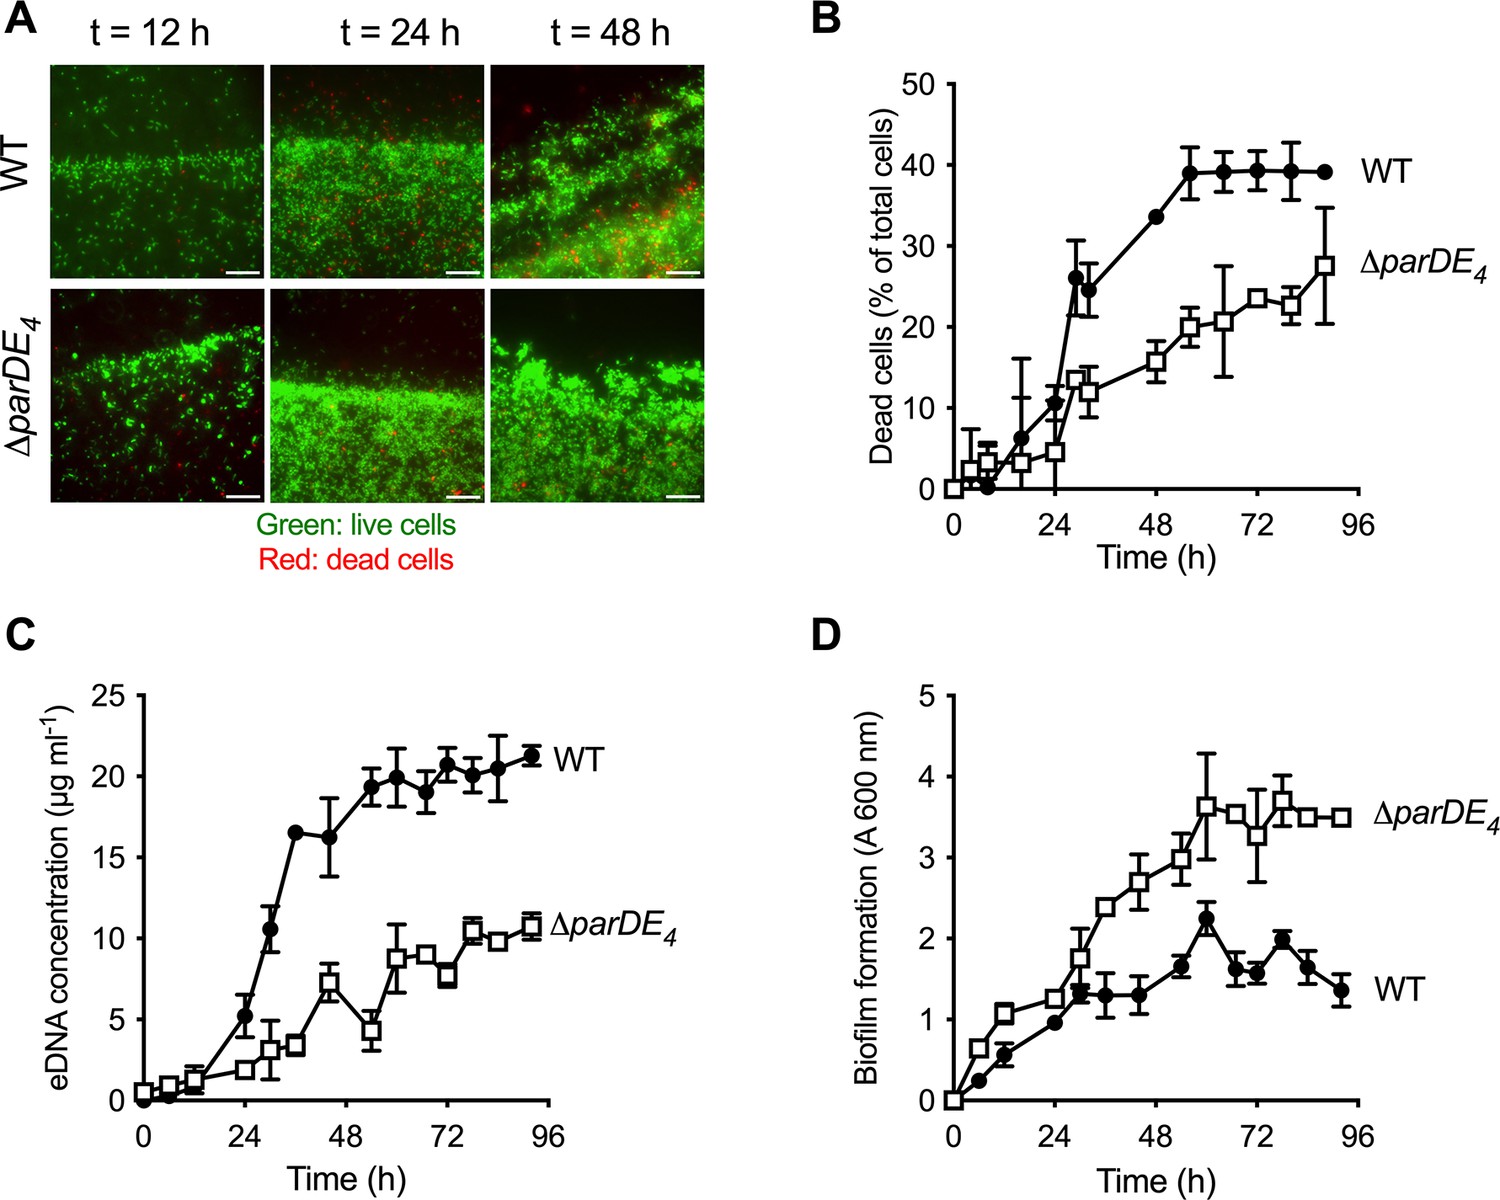
Involvement of the ParDE4 TAS in cell death, extracellular DNA (eDNA) release, and biofilm regulation.
(A) Biofilm formed on polyvinyl chloride (PVC) strips stained with the BacLight Live/Dead reagent at different incubation times. Images represent overlays of the green (live cells) and red (dead cells) signals collected by epifluorescence microscopy. Scale bars = 10 µm. (B) Percentage of dead cells over time in the biofilm, calculated from BacLight Live/Dead stained cells using microscopy images. (C) eDNA release in the planktonic phase over time, quantified using PicoGreen staining. (D) Biofilm formation over time, quantified by staining the attached biomass with crystal violet. C. crescentus WT and ∆parDE4 are represented by solid circles and open squares symbols, respectively. Cultures were grown in M2G medium. The results are given as the average of two independent experiments, each run in triplicate, and the error bars represent the standard error of the mean (SEM).
Figure 2—figure supplement 1
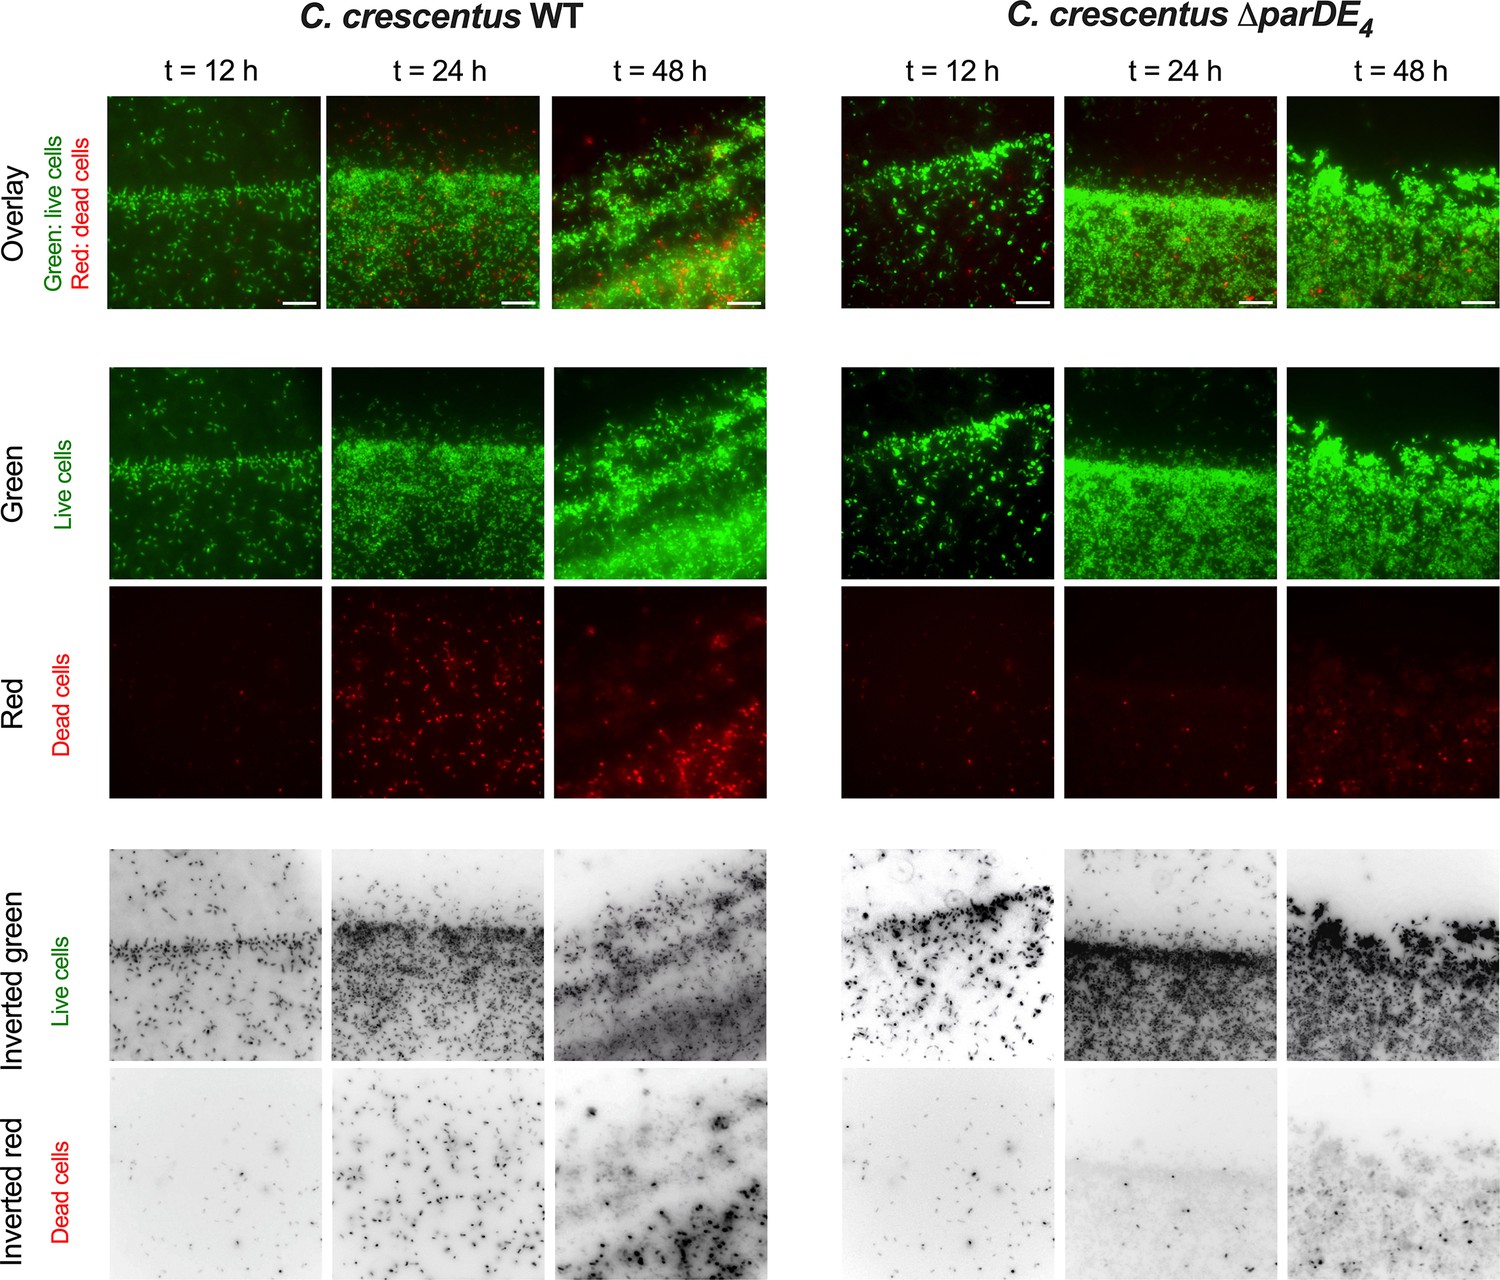
Involvement of the ParDE4 TAS in cell death, extracellular DNA (eDNA) release, and biofilm regulation.
Biofilms formed on polyvinyl chloride (PVC) strips stained with the BacLight Live/Dead reagent at different incubation times for WT (left) and ∆parDE4 (right). Top images represent overlays of the green (live cells) and red (dead cells) signals collected by epifluorescence microscopy. Middle panels represent split images of green (live cells) and red (dead cells) channels. Bottom panels represent inverted black and white rendering of the green and red channels (middle panels). Scale bars = 10 µm.
Figure 3 with 1 supplement
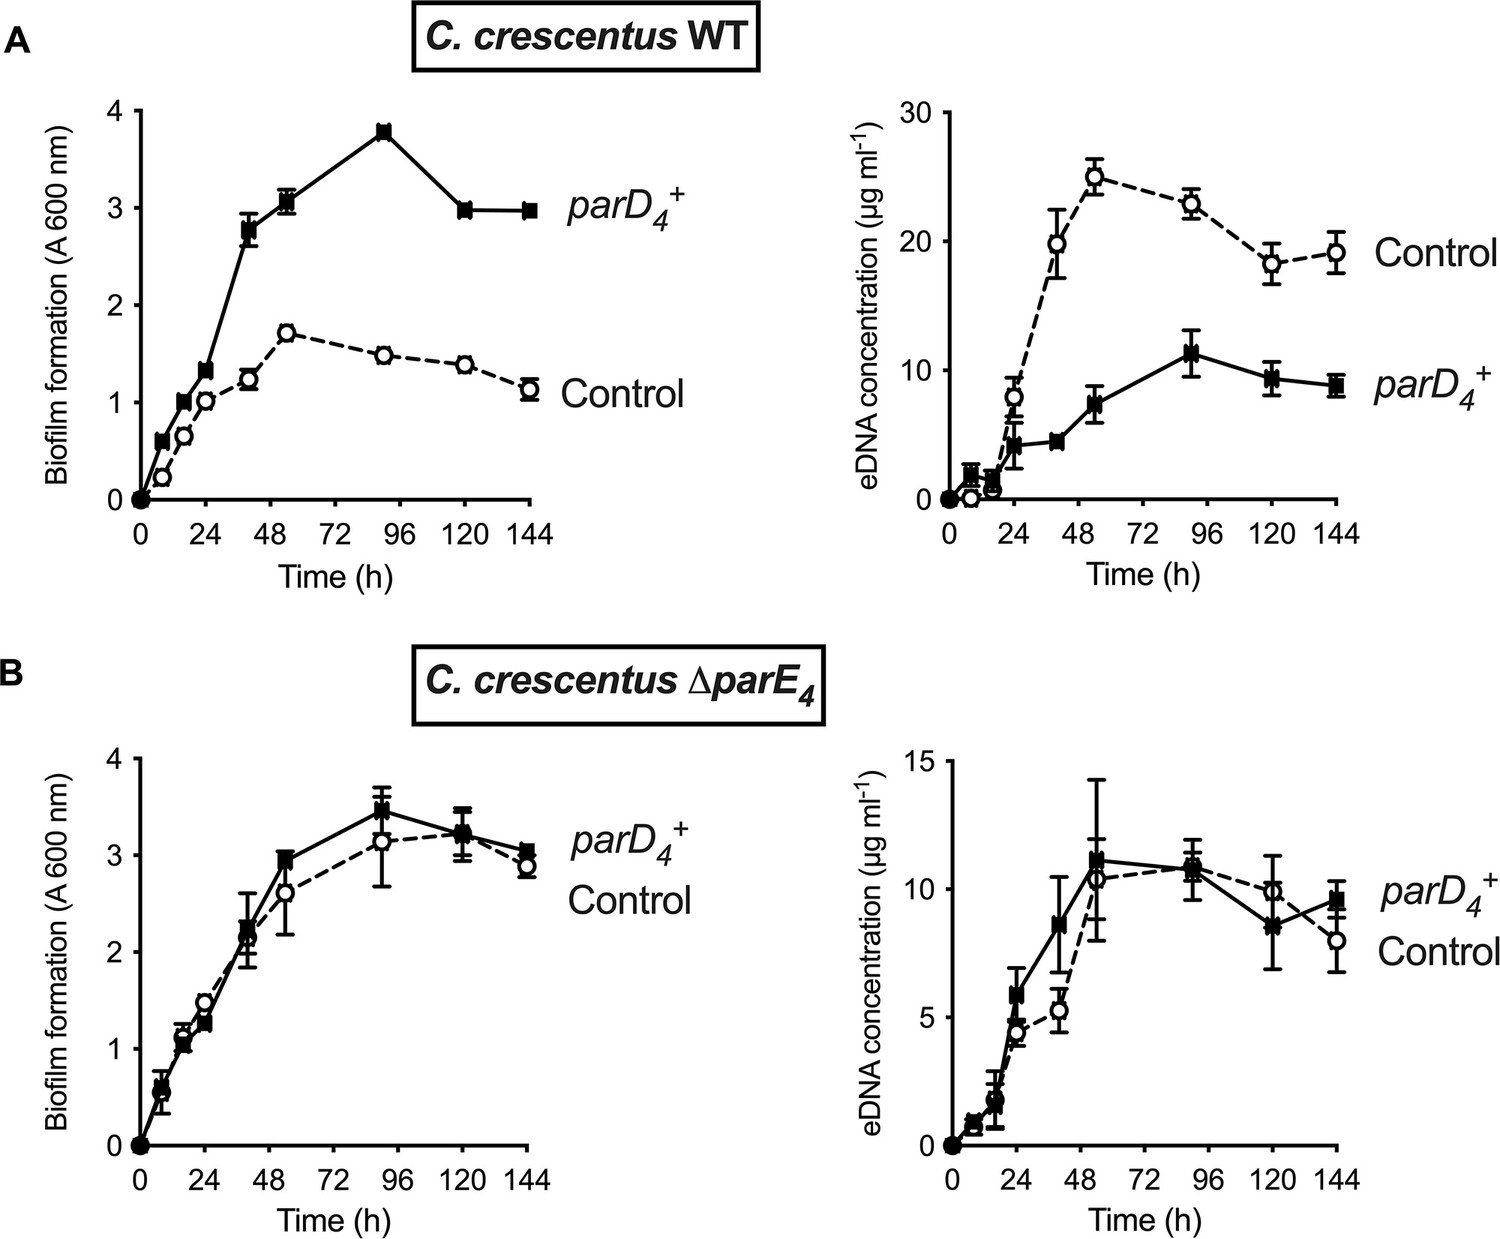
Effect of parD4 antitoxin gene-induced constitutive expression on biofilm formation and extracellular DNA (eDNA) release.
The parD4 was cloned into the low copy replicating pMT686 plasmid and expressed using the Pxyl promoter. Biofilm formation (left panels) and eDNA release (right panels) for strains expressing the parD4 antitoxin gene (solid square symbols) or bearing the empty pMT686 plasmid (open circle symbols) in WT (A) and ∆parE4 (B). Cultures were grown in M2G medium + Cm 1 µg ml-1. The results are given as the average of three independent experiments and the error bars represent the standard error of the mean (SEM).
Figure 3—figure supplement 1
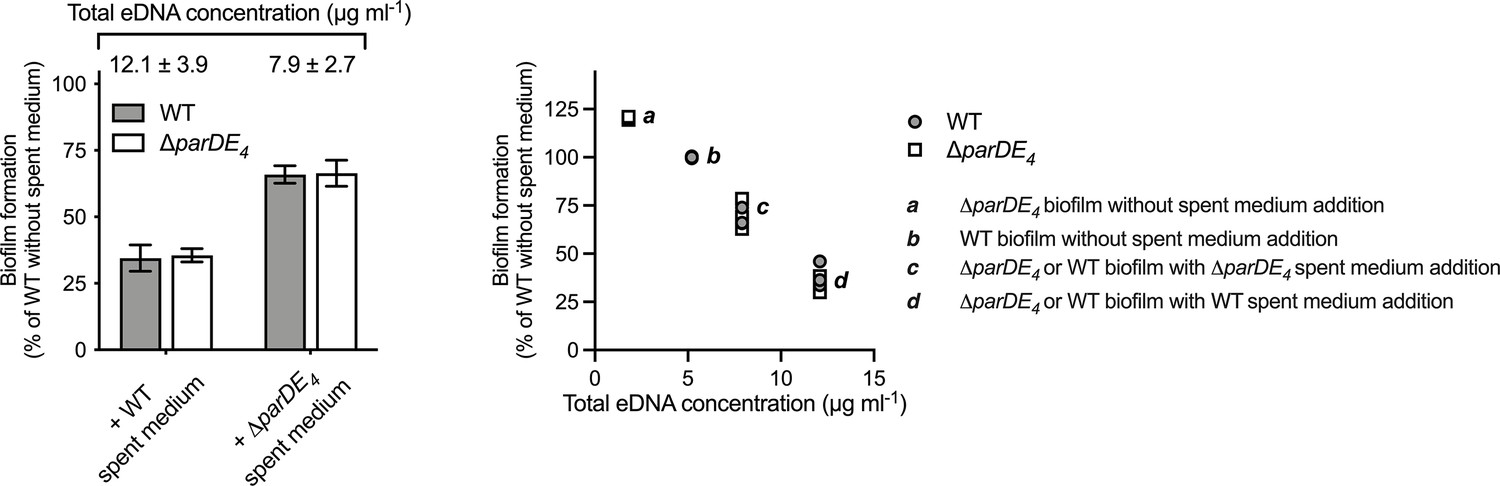
Biofilm inhibition in WT and ∆parDE4 by extracellular DNA (eDNA) from different spent media.
Biofilm formation in M2G medium of WT (gray circles) and ∆parDE4 (white squares) at different total eDNA concentrations. Because ∆parDE4 produces less eDNA than WT, we first determined the amount of eDNA present in each culture and added an appropriate amount of spend medium to obtain the same final concentration of eDNA. Results are given as a percentage of WT without exogenous addition of eDNA, of three independent experiments, each run in duplicate.
Figure 4
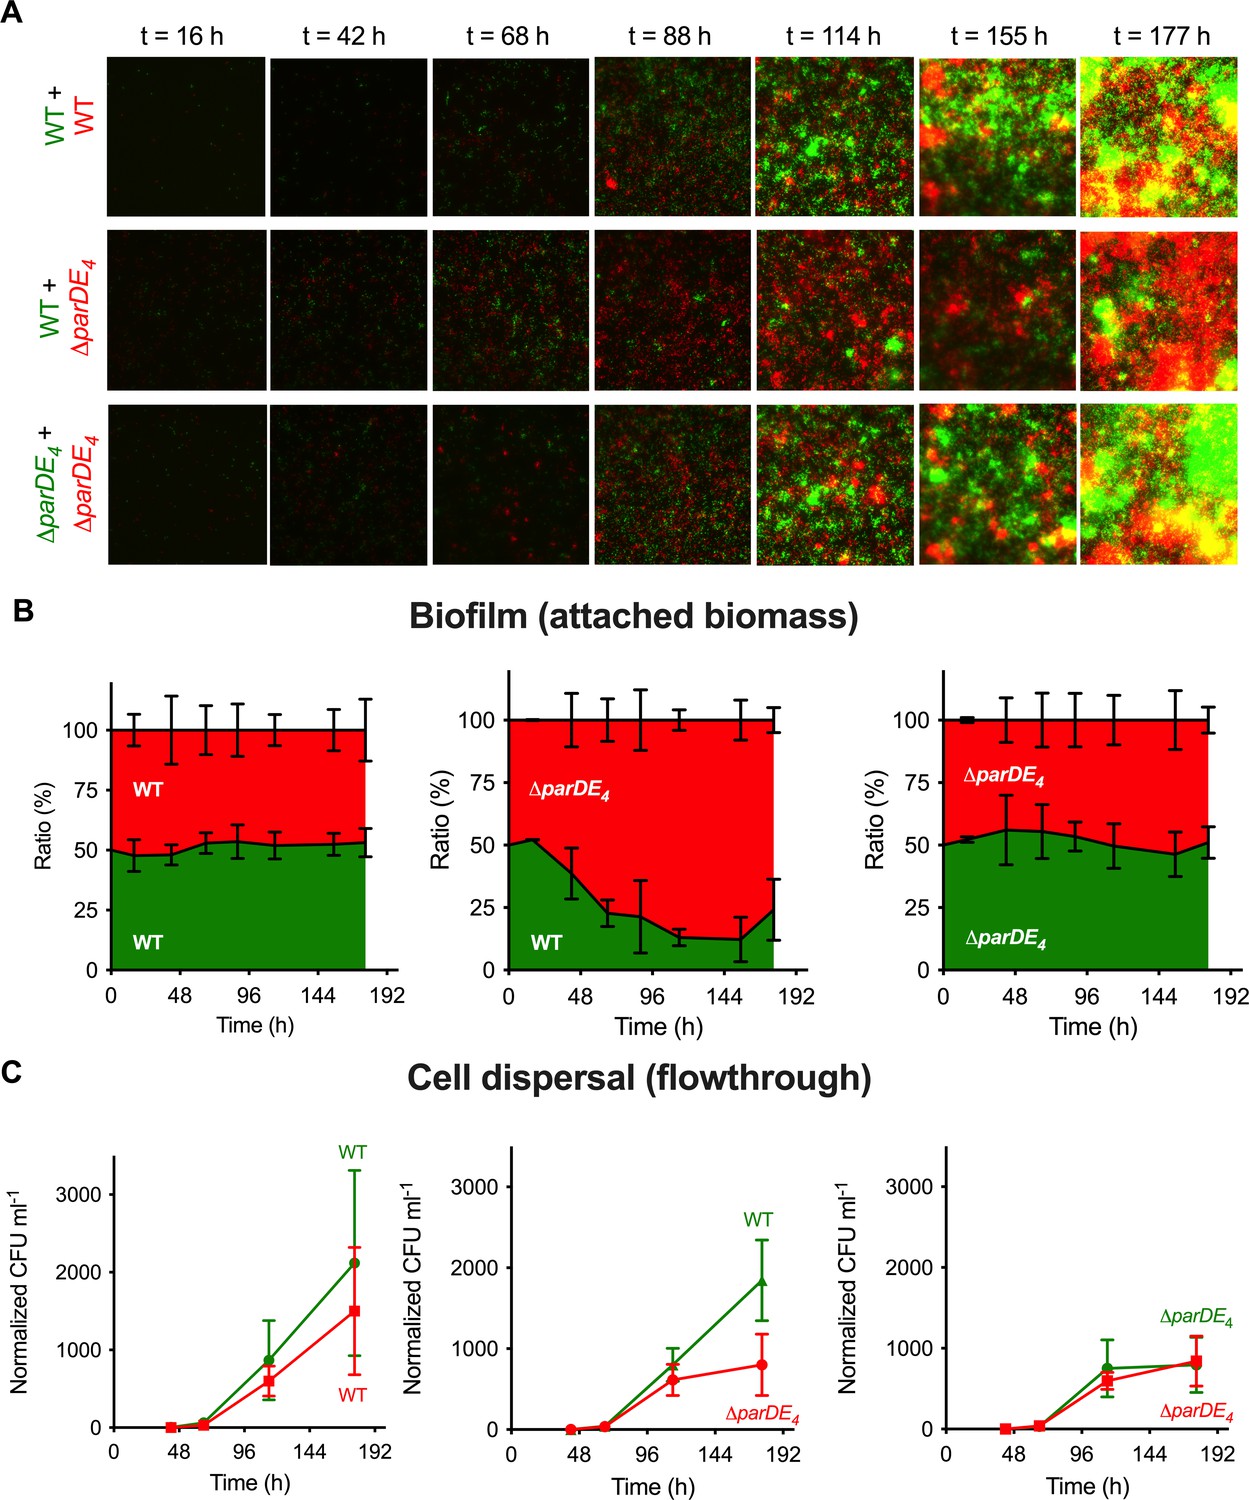
Biofilm formation and dispersion in mixed cultures.
Differentially fluorescently tagged populations of WT and ∆parDE4 were mixed to a 1:1 ratio and grown in flow cells over time. (A) Representative fluorescence microscopy images of mixed culture biofilms grown in flow cells. One population is represented in green and the other one in red. (B) Ratio of each population over time. Results are given as a percentage of total fluorescent area (green + red) representing both populations, calculated from microscopy images (average of 5 fields of view per time point, during triplicate independent experiments where fluorescent markers were swapped). (C) Cell dispersal measured as colony-forming units (CFU ml−1) released in the flowthrough downstream of the flow cells. Results are normalized to the number of colonies measured for WT at t = 42 hr (beginning of the experiment). Experiments were performed using M2G medium. Results are expressed as an average of 2–4 serial dilution counts of 3 samples per time point. Flow cells were run in triplicate independent experiments where fluorescent markers were swapped. Errors bars represent the standard error of the mean (SEM).
Figure 5
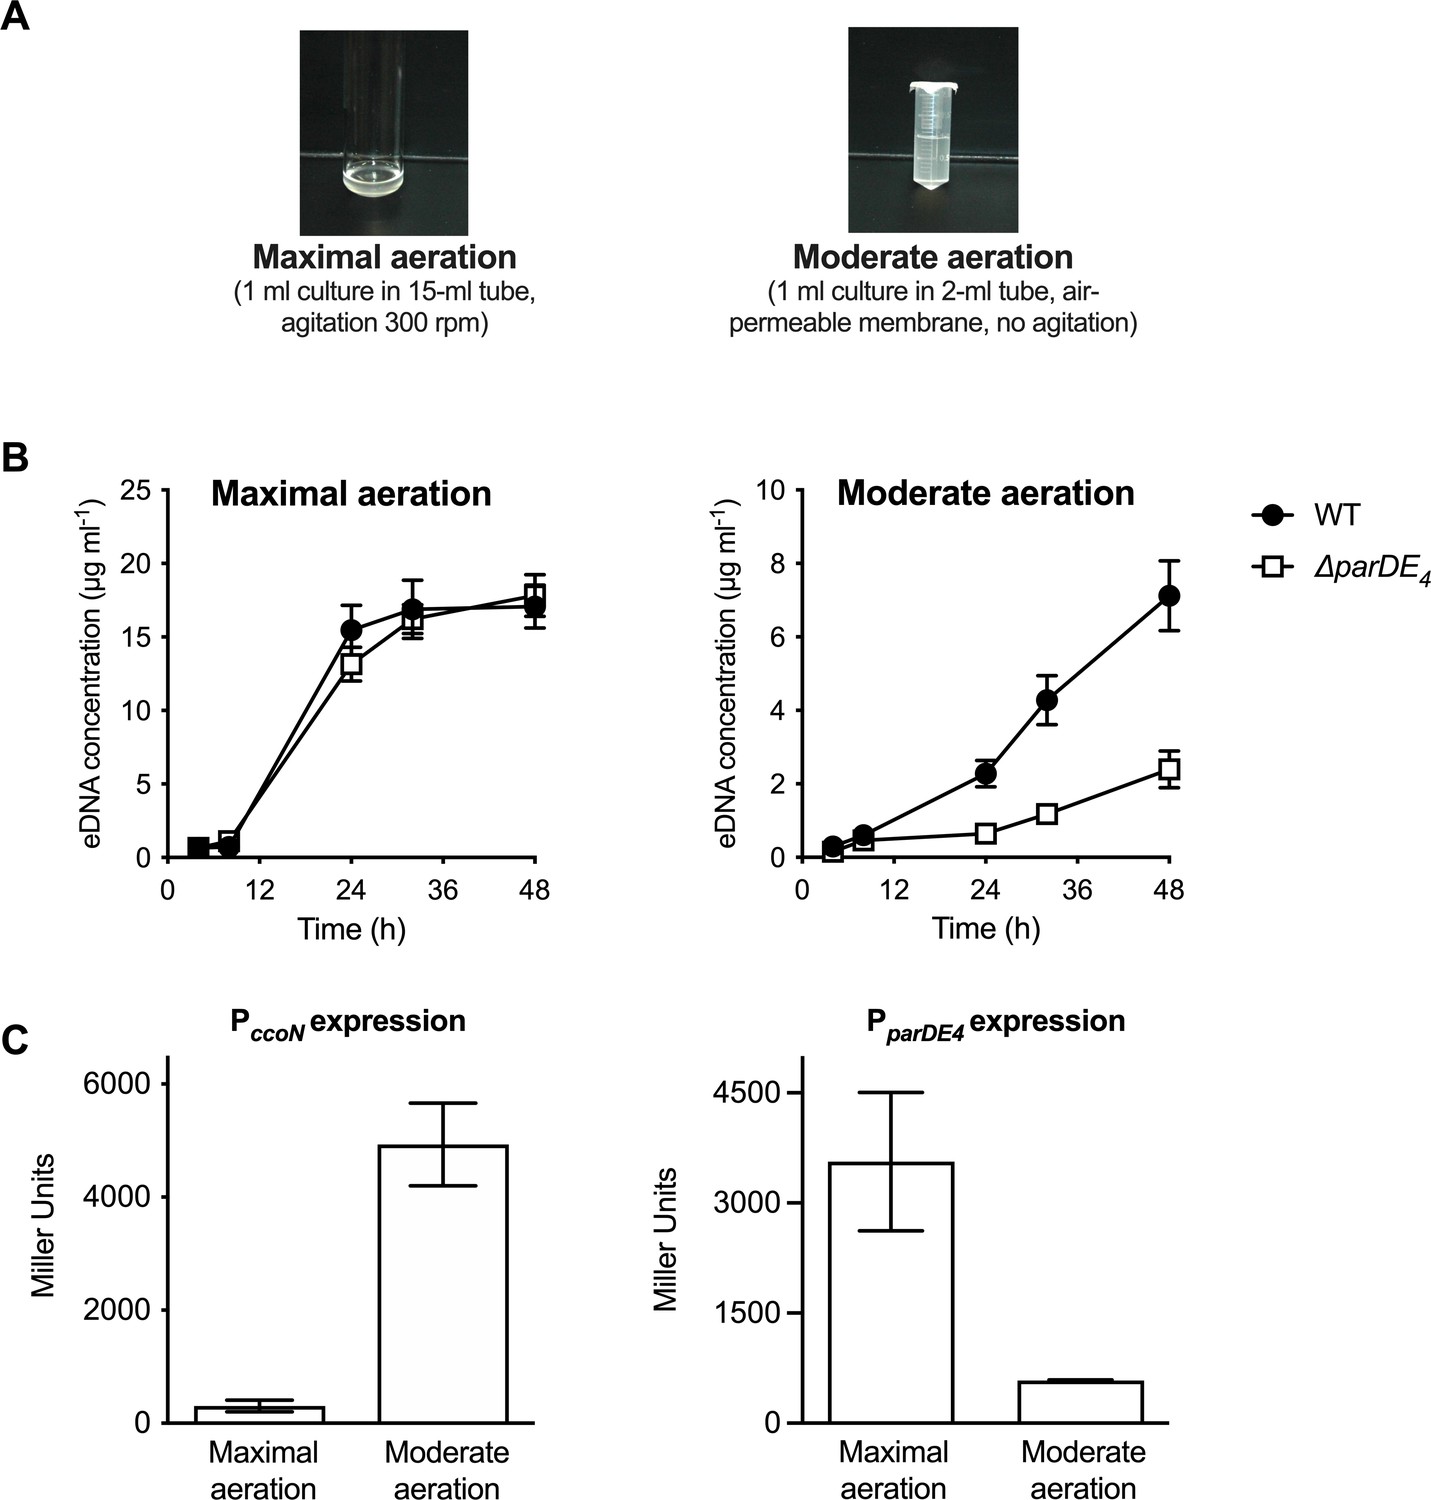
PparDE4 expression is induced under maximal aeration growth conditions.
(A) Images of cultures grown in M2G under conditions providing different amounts of O2, termed maximal and moderate aeration, respectively. (B) Quantification of extracellular DNA (eDNA) released in the planktonic phase of WT (solid circles) and ∆parDE4 (open squares), quantified using PicoGreen staining. Results are given as the average of five independent experiments and the error bars represent the standard error of the mean (SEM). (C) β-Galactosidase activity of PparDE4-lacZ (right) and PccoN-lacZ transcriptional (left) fusions in WT grown under maximal and moderate aeration conditions (as illustrated in panel A). The results represent the average of six independent cultures (assayed on three different days) and the error bars represent the SEM.
Figure 6
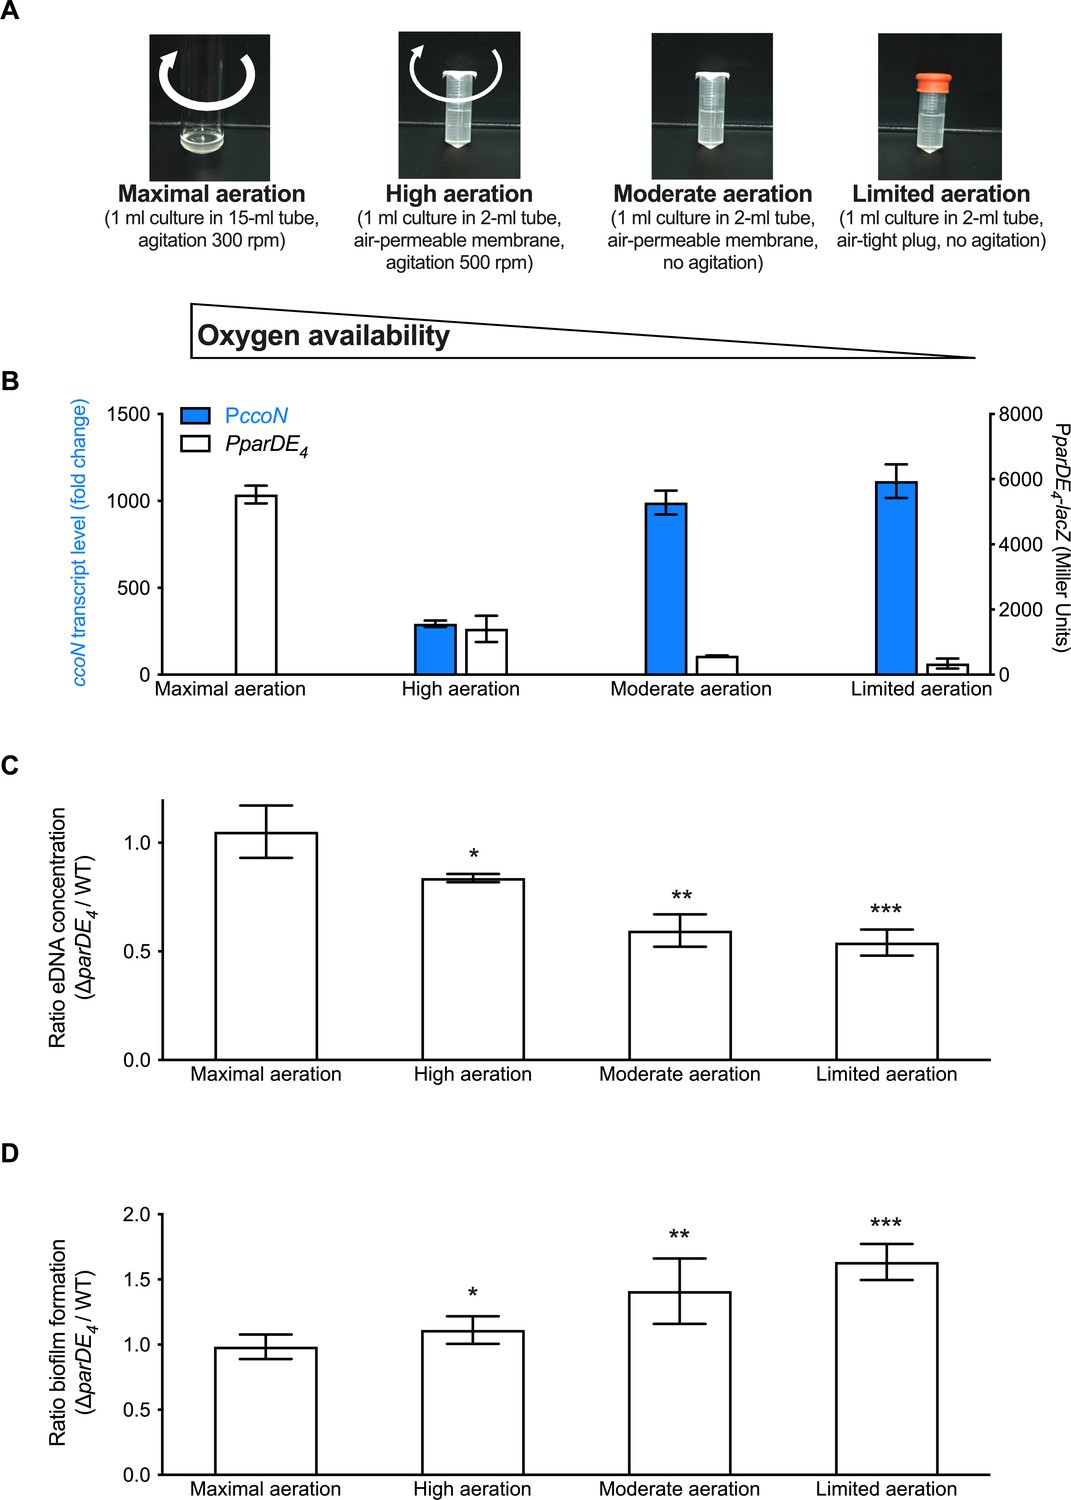
Extracellular DNA (eDNA) release and biofilm formation under variable O2 availability.
(A) Images of M2G-grown cultures providing different amounts of O2, termed maximal, high, moderate, and limited aeration, respectively. (B) Assessment of PparDE4 and PccoN expression (white and blue bars, respectively) by measuring β-galactosidase activity of the PparDE4-lacZ transcriptional fusions in WT, and transcription of ccoN relative to rpoD as a function of various aeration conditions by RT-qPCR in the same cultures. qPCR results (calculated as described in the Material and method section) were normalized to the results in ‘Maximal aeration’ conditions set to 1. (C) Ratio of the eDNA release concentration measured in ∆parDE4 planktonic phase over WT, in cultures grown under the different aeration conditions. Results are given as the calculated ratio of the eDNA concentration measured in six independent replicates, each run in duplicate, and error bars represent the standard error of the mean (SEM). Statistical comparisons to ‘maximal aeration’ conditions are calculated using Student’s unpaired t-tests; *p < 0.5, **p < 0.05, ***p < 0.005. (D) Biofilm formation after 24 hr when cells are grown under the different aeration conditions. Results are given as the calculated ratio of the amount of biofilm formed in three to five independent replicates, each run in triplicate, and error bars represent the SEM. Statistical comparisons to ‘maximal aeration’ conditions are calculated using Student’s unpaired t-tests; *p < 0.05, **p < 0.01, ***p < 0.005.
Figure 7 with 2 supplements
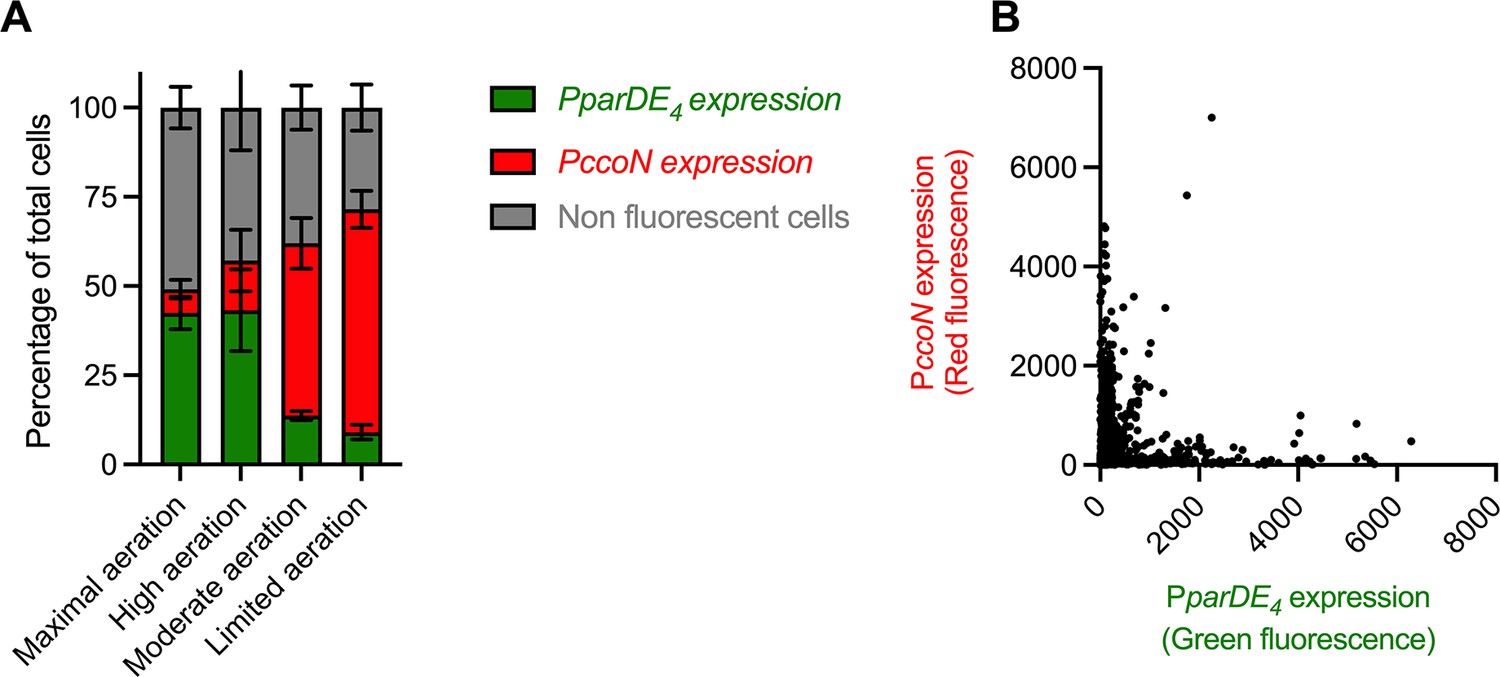
Expression of the parDE4 operon is anticorrelated with a hypoxia reporter.
(A) Number of cells expressing GFP (PparDE4 expression) and mCherry (PccoN expression) in the whole population when cells were grown in M2G under maximal, high, moderate, and limited aeration, providing different amounts of O2. A cell was considered expressing GFP and/or mCherry if the fluorescence signal was at least 1.2 times the background. The error bars represent the standard error of the mean (SEM). (B) Red and green fluorescence intensity of single cells grown under maximal, high, moderate, and limited aeration (all conditions combined). WT cells carrying both pMR20-PparDE4-gfp and pMR10-PccoN-mcherry plasmids were grown to OD600 = 0.4–0.6 under maximal, high, moderate, and limited aeration (Figure 6A) and imaged by epifluorescence microscopy. More than 3000 cells from at least three independent replicates were quantified for the number of cells with a green or red fluorescent signal (A) and the intensity of these fluorescent signals (B).
Figure 7—figure supplement 1
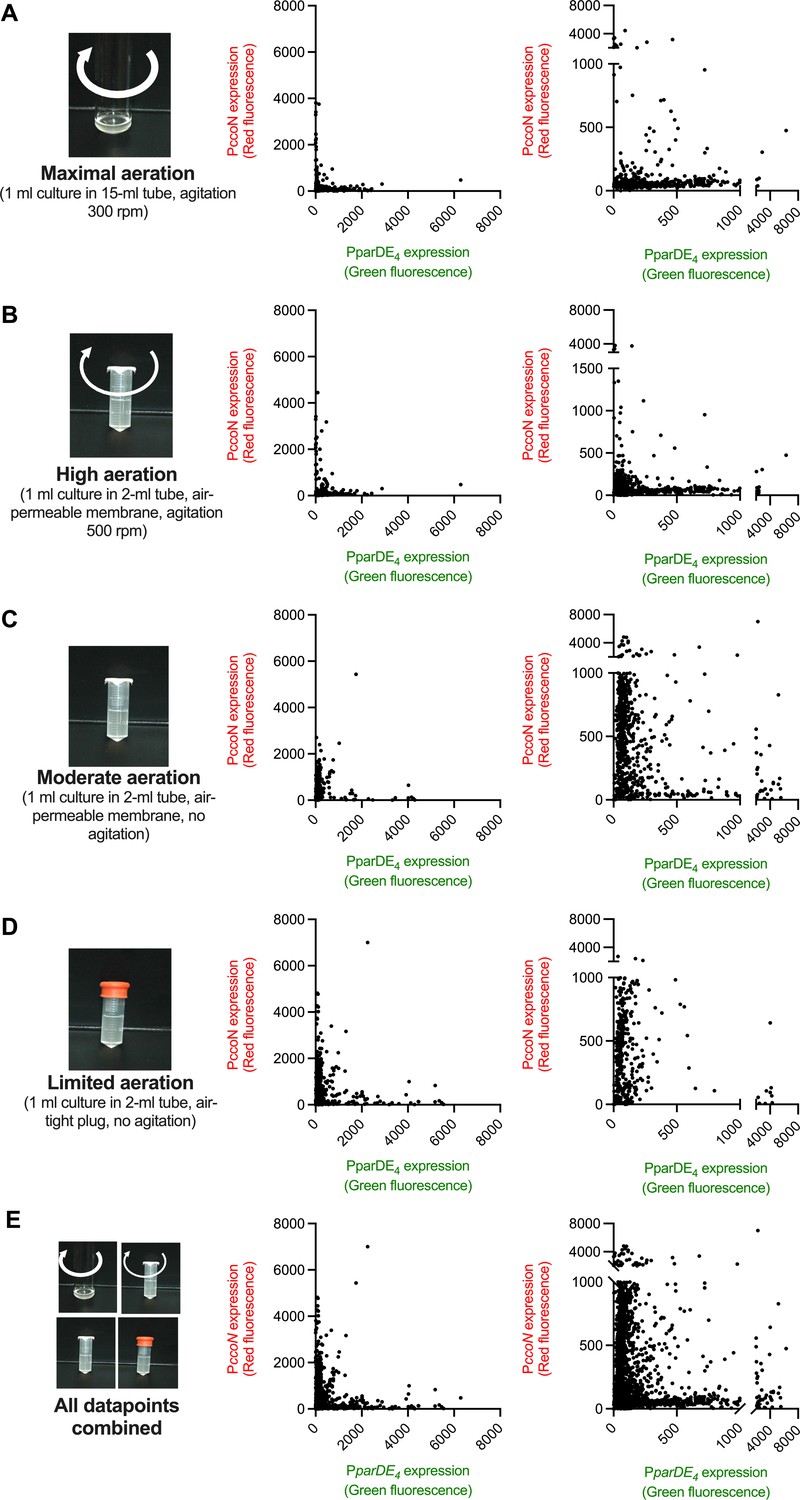
Expressions of the parDE4 operon is reduced when a hypoxia reporter expression is increased.
Red and green fluorescence intensity of single cells grown under maximal (A), high (B), moderate (C), limited (D) aeration, and all condition combined (as presented in Figure 7) (E). WT cells carrying both pMR20-PparDE4-gfp and pMR10-PccoN-mcherry plasmids were grown to an OD600 of 0.4–0.6 and imaged by epifluorescence microscopy. Fluorescence intensity was calculated from more than 3,000 cells from at least three independent replicates. Graphs on the right side show the same data, but using two-segment axes, for a better visualization of lower intensity datapoints.
Figure 7—figure supplement 2
Cell morphology is not impacted by hypoxia.
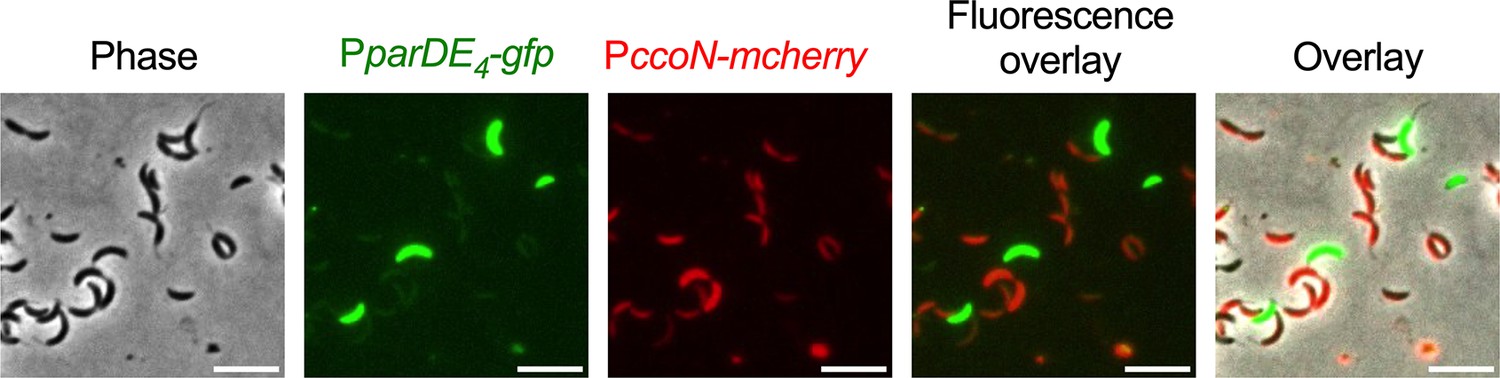
WT cells carrying both pMR20-PparDE4-gfp and pMR10-PccoN-mcherry plasmids were grown to OD600 = 0.4–0.6 under moderate aeration (as described in the text) and imaged by epifluorescence microscopy. Cells with high expression of parDE4 (high GFP signal) and low/no parDE4 expression (no GFP signal) and cells experiencing hypoxia (high mCherry signal) have the same morphology. Scale bar = 5 µm.
Figure 8
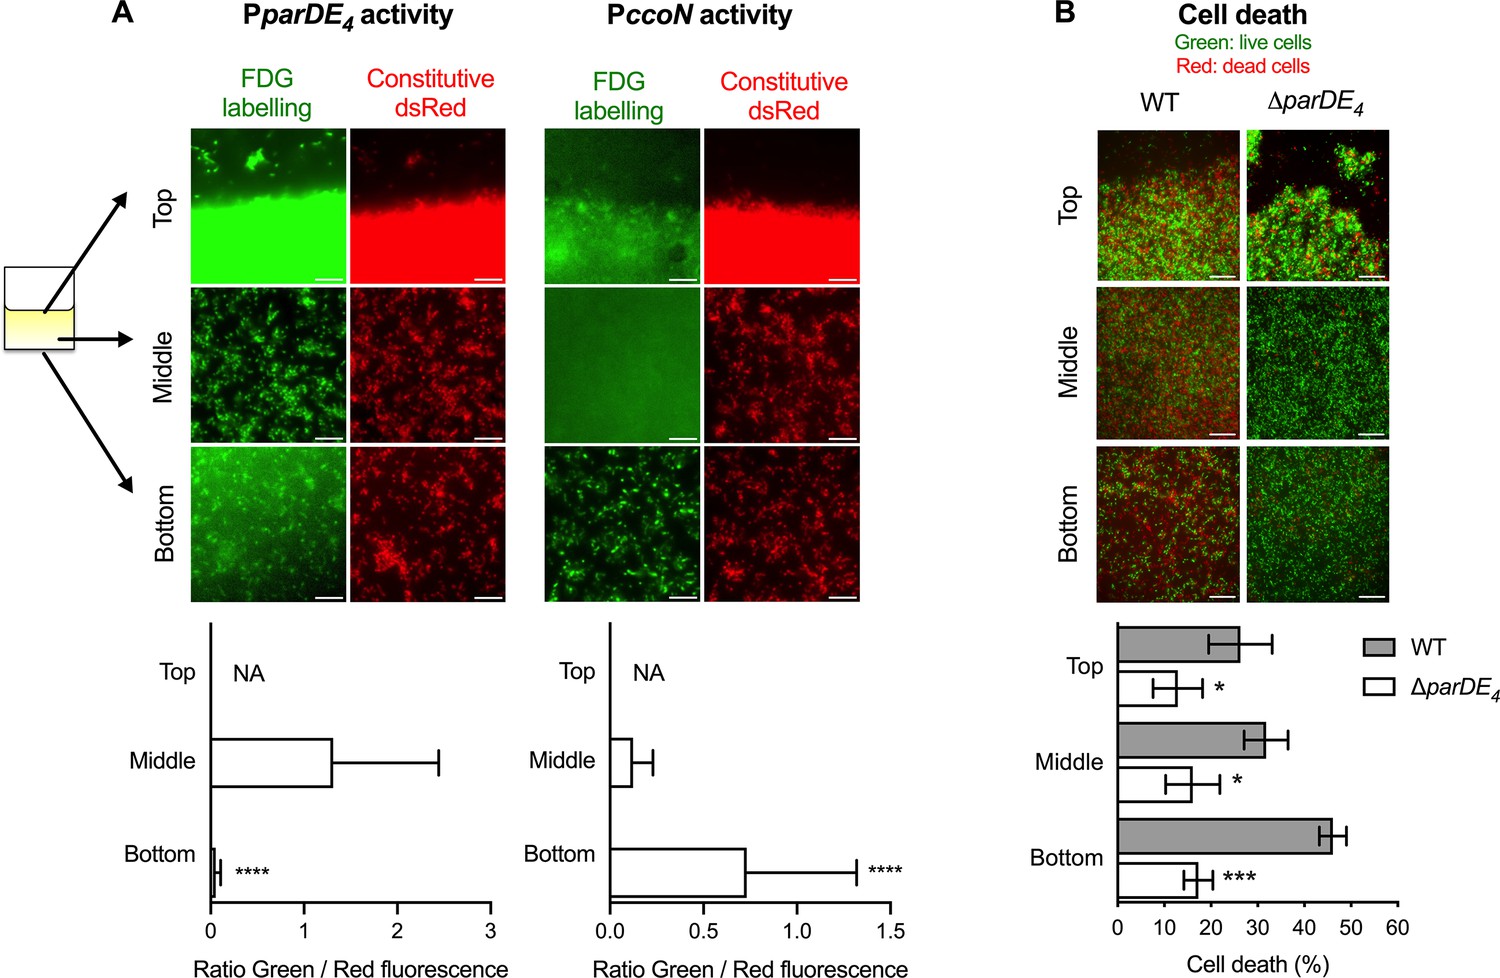
Spatial regulation of parDE4 expression and ParDE4-mediated cell death in the biofilm.
Biofilms were grown on polyvinyl chloride (PVC) strips in M2G medium. Three locations were monitored: the air–liquid interface (Top), the middle of the strip (Middle), and the bottom of the strip (Bottom). (A) PparDE4 and PccoN activities in cells attached at the three different locations. Red fluorescent WT cells (WT::miniTn7-dsred) carrying either the PparDE4-lacZ or the PccoN-lacZ plasmids were grown for 36 hr, and promoter activities were measured by the amount of fluorescein cleaved by the β-galactosidase from the fluorogenic FDG substrate. While representative fluorescence images are shown using the same set brightness/contrast for the red channel, brightness/contrast are set automatically in ImageJ for each green fluorescence image. Scale bars = 10 µm. Green (FDG labeling, promoter activity) and red (Constitutive Dsred signal, cell density) fluorescence intensities were quantified using microscopy images of 10 fields of views of three independent replicates (more than 10,000 events). Results are expressed as a ratio of green/red fluorescence signals and are shown as averages with standard deviation (SD). Statistical comparisons of the ratio calculated at the bottom of the coverslips to the middle are calculated using paired t-tests, ***p < 0.0001. We could not determine (not available, NA) the amount of FDG hydrolyzation at the air–liquid interface, as the biofilm was too dense to accurately quantify fluorescence signals due to saturation. (B) Cell death quantification of biofilms of WT and ∆parDE4 after 36 hr. Percentage of dead cells over time in the biofilm, calculated from BacLight Live/Dead stained cells using microscopy images. Results are given as the average of percentage of dead cells (red) in 10 fields of views of three independent replicates and are shown in gray and white bars for WT and ∆parDE4, respectively. Error bars represent standard error of the mean (SEM). Statistical comparisons to WT in the same condition are calculated using Student’s unpaired t-tests; *p < 0.05, ***p < 0.005, ****p < 0.0005.
Figure 9
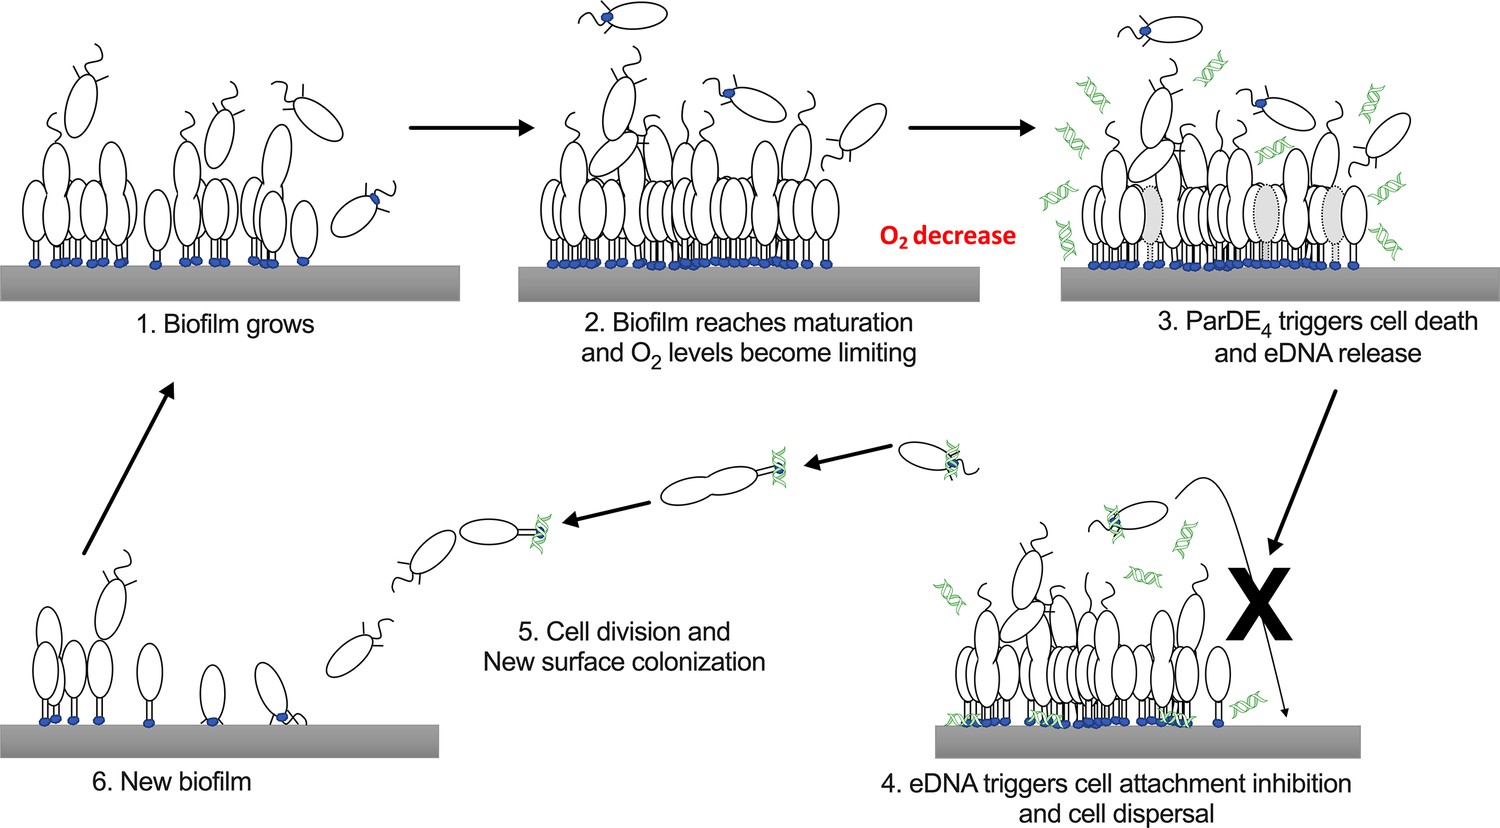
Schematic representation of the hypothetical mechanism of ParDE4-dependent regulation of cell death and dispersal upon O2 limitation.
Once the biofilm reaches maturation, O2 availability becomes limiting. ParDE4-mediated programmed cell death (PCD) is initiated upon O2 deprivation and targeted cells release extracellular DNA (eDNA) via cell lysis. eDNA specifically binds to holdfasts, preventing new cells from attaching, but does not influence already attached cells. Unable to join the biofilm, swarmer cells disperse, divide, and their offspring eventually find a new surface to colonize.
Author response image 1
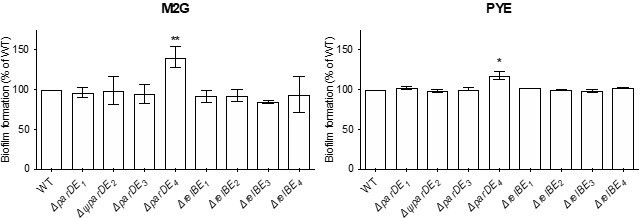
Biofilm formation, quantified by crystal violet staining; results are expressed as a percentage of biofilm formed compared to WT.
Results are given as the average of two-four independent experiments, each run in duplicate, and the error bars represent the Standard Error of the Mean (SEM). Statistical comparisons are calculated using Student’s unpaired t-tests; only samples statistically different from WT are shown. * P < 0.05; ** P < 0.01.
Author response image 2
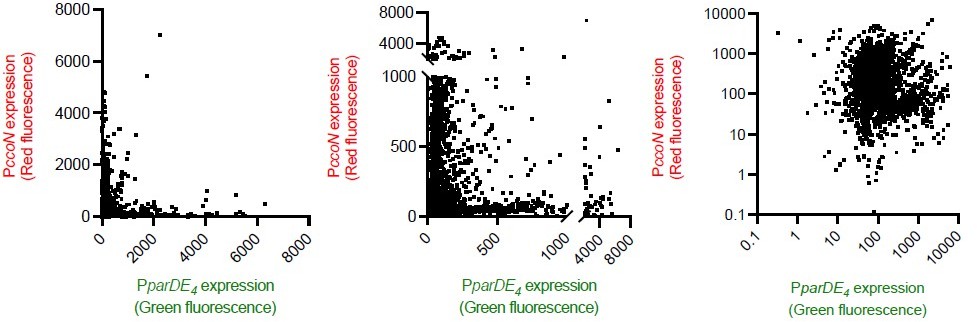
Red and green fluorescence intensity of single cells grown under maximal, high, moderate, and limited aeration (all conditions combined).
The same data are represented three different ways. data reported using single linear axes (Figure 7 and Figure 7—figure supplement 1). data reported using two-segment linear axes (Figure 7—figure supplement 1). Data represented using log10 axes.
Additional files
-
Supplementary file 1
Table of strains used in this study.
- https://cdn.elifesciences.org/articles/80808/elife-80808-supp1-v2.docx
-
Supplementary file 2
Table of primers used in this study.
- https://cdn.elifesciences.org/articles/80808/elife-80808-supp2-v2.docx
-
MDAR checklist
- https://cdn.elifesciences.org/articles/80808/elife-80808-mdarchecklist1-v2.docx
Download links
A two-part list of links to download the article, or parts of the article, in various formats.
Downloads (link to download the article as PDF)
Open citations (links to open the citations from this article in various online reference manager services)
Cite this article (links to download the citations from this article in formats compatible with various reference manager tools)
eDNA-stimulated cell dispersion from Caulobacter crescentus biofilms upon oxygen limitation is dependent on a toxin–antitoxin system
eLife 12:e80808.
https://doi.org/10.7554/eLife.80808


