Genetic and chemical validation of Plasmodium falciparum aminopeptidase PfA-M17 as a drug target in the hemoglobin digestion pathway
- School of Medicine, Deakin University, Australia
- The Institute for Mental and Physical Health and Clinical Translation, Deakin University, Australia
- Drug Delivery, Disposition and Dynamics, Monash Institute of Pharmaceutical Sciences, Monash University, Australia
- Biomedicine Discovery Institute and Department of Microbiology, Monash University, Australia
- Centre to Impact AMR, Monash University, Australia
- Medicinal Chemistry, Monash Institute of Pharmaceutical Sciences, Monash University, Australia
- CSIRO Australian Centre for Disease Preparedness, Australia
Figures
Figure 1 with 1 supplement
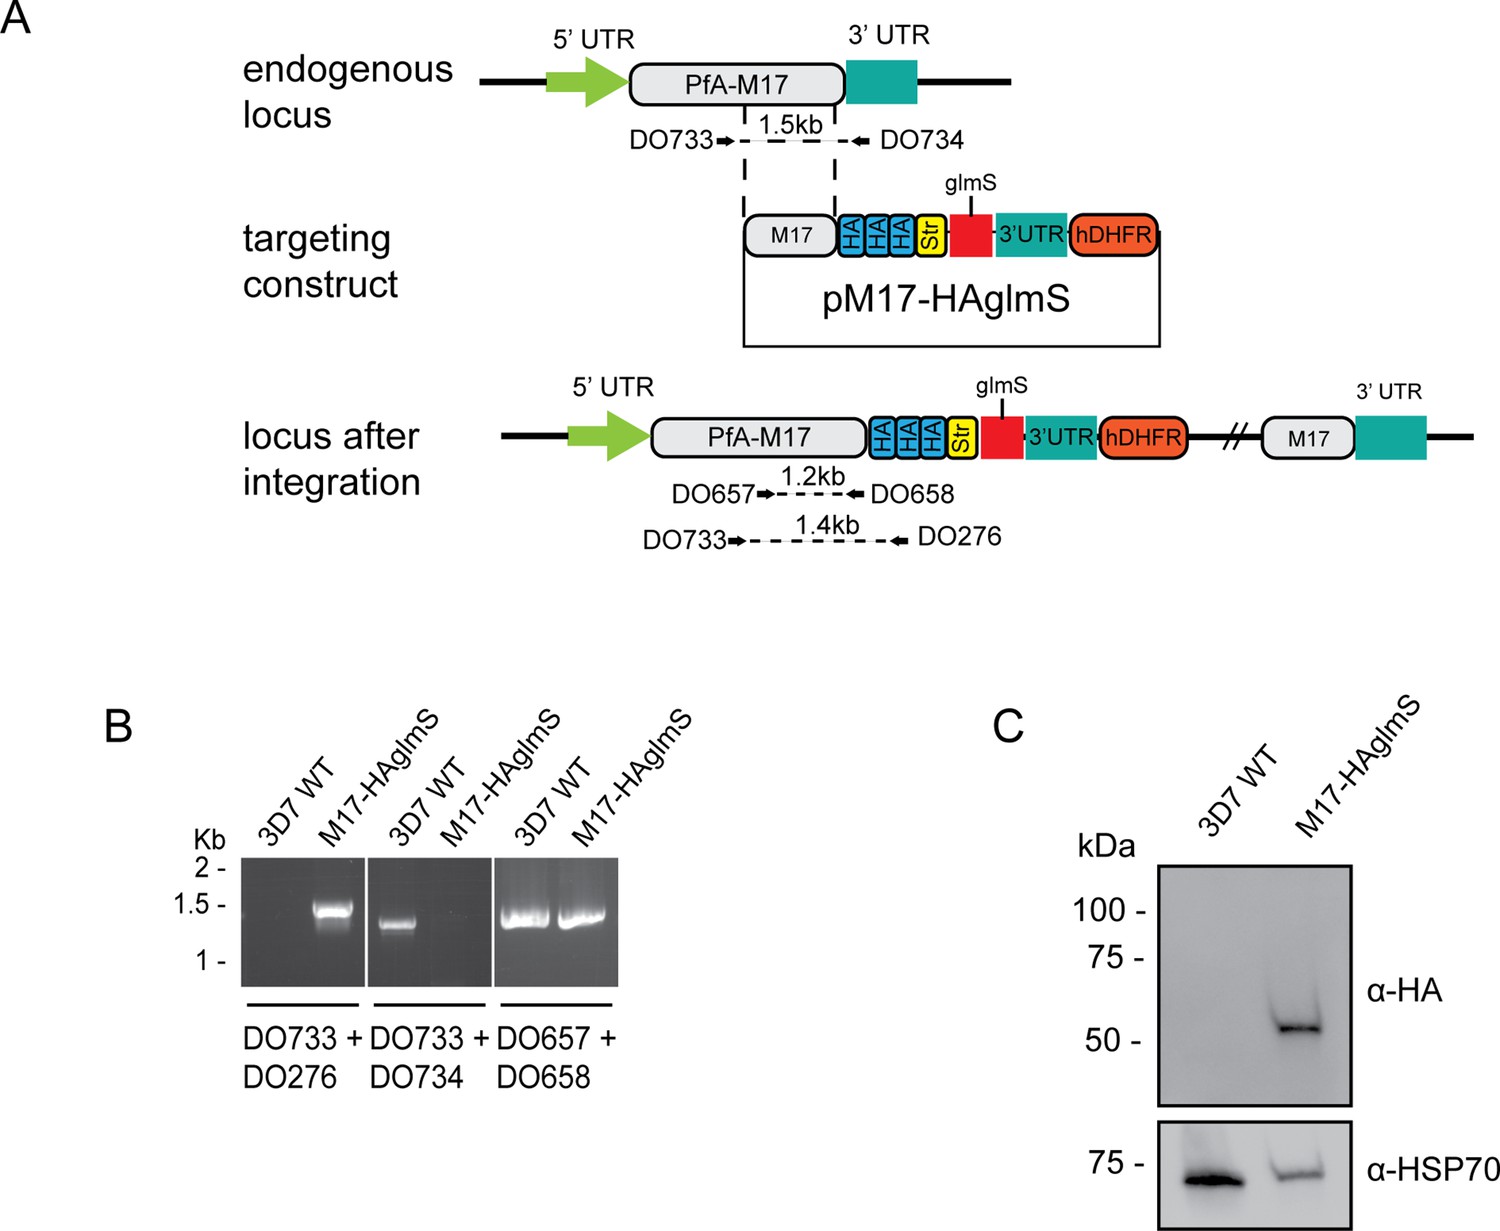
Generation of HA-tagged PfA-M17-HAglmS transgenic parasites.
(A) Schematic of the Pfa-m17 locus, and locus after single crossover recombination with pM17-HAglmS. The pM17-HAglmS plasmid contained the last kilobase of the coding sequence excluding the stop codon fused in frame to 3 x haemagglutinin (HA) and a single strep II (Str) tag. The plasmid also includes a glmS ribozyme with a synthetic untranslated region (UTR) and the selectable marker human dihydrofolate reductase (hDHFR). Arrows indicate oligonucleotides used in diagnostic PCRs as well as their expected sizes. (B) Diagnostic PCR showing integration of pM17-HAglmS at the endogenous locus. PCR was performed using the oligonucleotide pairs outlined in (A) on DNA extracted from parasites before (Pf3D7) or after (PfA-M17-HAglmS) transfection with the targeting construct. Oligonucleotides DO657 and DO658, which recognize the endogenous locus, serves as a positive control. (C) Western blot analysis of parasite lysates confirming HA expression. The predicted molecular mass of PfA-M17-HA is 72 kDa, and HSP70 serves as a loading control.
-
Figure 1—source data 1
Original gel electrophoresis presented in Figure 1B (panels 1 and 2).
- https://cdn.elifesciences.org/articles/80813/elife-80813-fig1-data1-v1.pdf
-
Figure 1—source data 2
Marked up original gel electrophoresis presented in Figure 1B (panels 1 and 2).
- https://cdn.elifesciences.org/articles/80813/elife-80813-fig1-data2-v1.pdf
-
Figure 1—source data 3
Original gel electrophoresis presented in Figure 1B (panel 3).
- https://cdn.elifesciences.org/articles/80813/elife-80813-fig1-data3-v1.pdf
-
Figure 1—source data 4
Marked up original gel electrophoresis presented in Figure 1B.
- https://cdn.elifesciences.org/articles/80813/elife-80813-fig1-data4-v1.pdf
-
Figure 1—source data 5
Original immunoblot presented in Figure 1C.
- https://cdn.elifesciences.org/articles/80813/elife-80813-fig1-data5-v1.pdf
-
Figure 1—source data 6
Marked up original immunoblot presented in Figure 1C.
- https://cdn.elifesciences.org/articles/80813/elife-80813-fig1-data6-v1.pdf
Figure 1—figure supplement 1

Western blot of lysates prepared from mixed stage Pf3D7 wild type (WT) and PfA-M17-HAglmS parasites probed with either pre-bleed rabbit serum or rabbit serum after multiple rounds of inoculation with PfA-M17 recombinant protein (final bleed).
The expected molecular mass of PfA-M17 is 68 kDa. Source data is provided in figure.
-
Figure 1—figure supplement 1—source data 1
Original immunoblot presented in Figure 1—figure supplement 1.
- https://cdn.elifesciences.org/articles/80813/elife-80813-fig1-figsupp1-data1-v1.pdf
-
Figure 1—figure supplement 1—source data 2
Marked up original immunoblot presented in Figure 1—figure supplement 1.
- https://cdn.elifesciences.org/articles/80813/elife-80813-fig1-figsupp1-data2-v1.pdf
Figure 2

Analysis of PfA-M17 localization and expression over the lifecycle.
(A) Immunofluorescent analysis of PfA-M17-HAglmS parasites in the three distinct lifecycle stages fixed with 90:10 acetone:methanol and probed with anti-HA and DAPI. (B) Saponin-lysed mixed stage PfA-M17-HAglmS parasites were sequentially lysed in the buffers indicated from left to right and analyzed by Western blotting. Insoluble material represents the remaining pellet after lysis in 1% Triton X-100. GAPDH, HSP101, and EXP2 serve as controls for cytoplasmic, membrane-associated, and integral membrane proteins respectively. Blot is representative of three biological replicates. (C) Western blot analysis of endogenous PfA-M17 expression in Pf3D7 wildtype parasites over the erythrocytic cycle probed with anti-M17 antibodies. HSP101 serves as a loading control.
-
Figure 2—source data 1
Original immunoblot presented in Figure 2B (anti-HSP101 blot).
- https://cdn.elifesciences.org/articles/80813/elife-80813-fig2-data1-v1.pdf
-
Figure 2—source data 2
Marked up original immunoblot presented in Figure 2B (anti-HSP101 blot).
- https://cdn.elifesciences.org/articles/80813/elife-80813-fig2-data2-v1.pdf
-
Figure 2—source data 3
Original immunoblot presented in Figure 2B (anti-GAPDH blot).
- https://cdn.elifesciences.org/articles/80813/elife-80813-fig2-data3-v1.pdf
-
Figure 2—source data 4
Marked up original immunoblot presented in Figure 2B (anti-GAPDH blot).
- https://cdn.elifesciences.org/articles/80813/elife-80813-fig2-data4-v1.pdf
-
Figure 2—source data 5
Original immunoblot presented in Figure 2B (anti-HA blot).
- https://cdn.elifesciences.org/articles/80813/elife-80813-fig2-data5-v1.pdf
-
Figure 2—source data 6
Marked up original immunoblot presented in Figure 2B (anti-HA blot).
- https://cdn.elifesciences.org/articles/80813/elife-80813-fig2-data6-v1.pdf
-
Figure 2—source data 7
Original immunoblot presented in Figure 2B (anti-EXP2 blot).
- https://cdn.elifesciences.org/articles/80813/elife-80813-fig2-data7-v1.pdf
-
Figure 2—source data 8
Marked up original immunoblot presented in Figure 2B (anti-EXP2 blot).
- https://cdn.elifesciences.org/articles/80813/elife-80813-fig2-data8-v1.pdf
-
Figure 2—source data 9
Original immunoblot presented in Figure 2C.
- https://cdn.elifesciences.org/articles/80813/elife-80813-fig2-data9-v1.pdf
-
Figure 2—source data 10
Marked up original immunoblot presented in Figure 2C.
- https://cdn.elifesciences.org/articles/80813/elife-80813-fig2-data10-v1.pdf
Figure 3 with 2 supplements

Depletion of PfA-M17 expression leads to perturbed parasite growth in vitro.
(A) Knockdown of PfA-M17 expression. Left panel: Representative Western blot of PfA-M17-HAglmS protein lysates prepared from parasites treated with either 2.5 mM GlcN (+) or left untreated (-) at trophozoite stage in cycle 1 (C1) or cycle 2 (C2). EXP2 serves as a loading control. Blot is representative of three biological replicates. Right panel: Densitometry of bands observed in western blots was performed using ImageJ to calculate the ratio of PfA-M17 protein expression in GlcN-treated parasites relative to EXP2 compared to that of untreated parasites. Shown is the mean ± standard deviation (n=3). Statistical significance was determined using an unpaired t-test. (B) Representative Giemsa-stained parasite smears of PfA-M17-HAglmS cultures treated with 0 mM or 2.5 mM GlcN shows depletion of PfA-M17 protein results in a growth delay following reinvasion into cycle 2 (C2). (C) Percentage of PfA-M17-HAglmS parasites at each stage of development ±GlcN over three cycles shows depletion of PfA-M17 leads to delayed parasite development within cycle 2 (n=3 biological replicates) (D) Parasitemias of PfA-M17-HAglmS parasites cultured ±GlcN over three cycles. Invasion into cycle 2 is not significantly affected but the growth delay of GlcN-treated parasites observed in this cycle affects parasitemia thereafter, with a significant difference in parasitemia by the time untreated PfA-M17-HAglms have entered cycle 3. Grey dotted lines are representative of the time when untreated parasites have completed a cycle. Plotted is the mean ± standard deviation (n=3), with statistical significance determined using an unpaired t-test (**p≤0.01, ***p≤0.001). (E) Ratio of parasite survival of PfA-M17-HAglmS after treatment with GlcN for 10 days compared to untreated parasites as determined by Sybr Green 1 assay. Shown is the mean ± standard deviation (n=3). Statistical significance was determined using an unpaired t-test.
-
Figure 3—source data 1
Original immunoblot presented in Figure 3A.
- https://cdn.elifesciences.org/articles/80813/elife-80813-fig3-data1-v1.pdf
-
Figure 3—source data 2
Marked up original immunoblot presented in Figure 3A.
- https://cdn.elifesciences.org/articles/80813/elife-80813-fig3-data2-v1.pdf
Figure 3—figure supplement 1
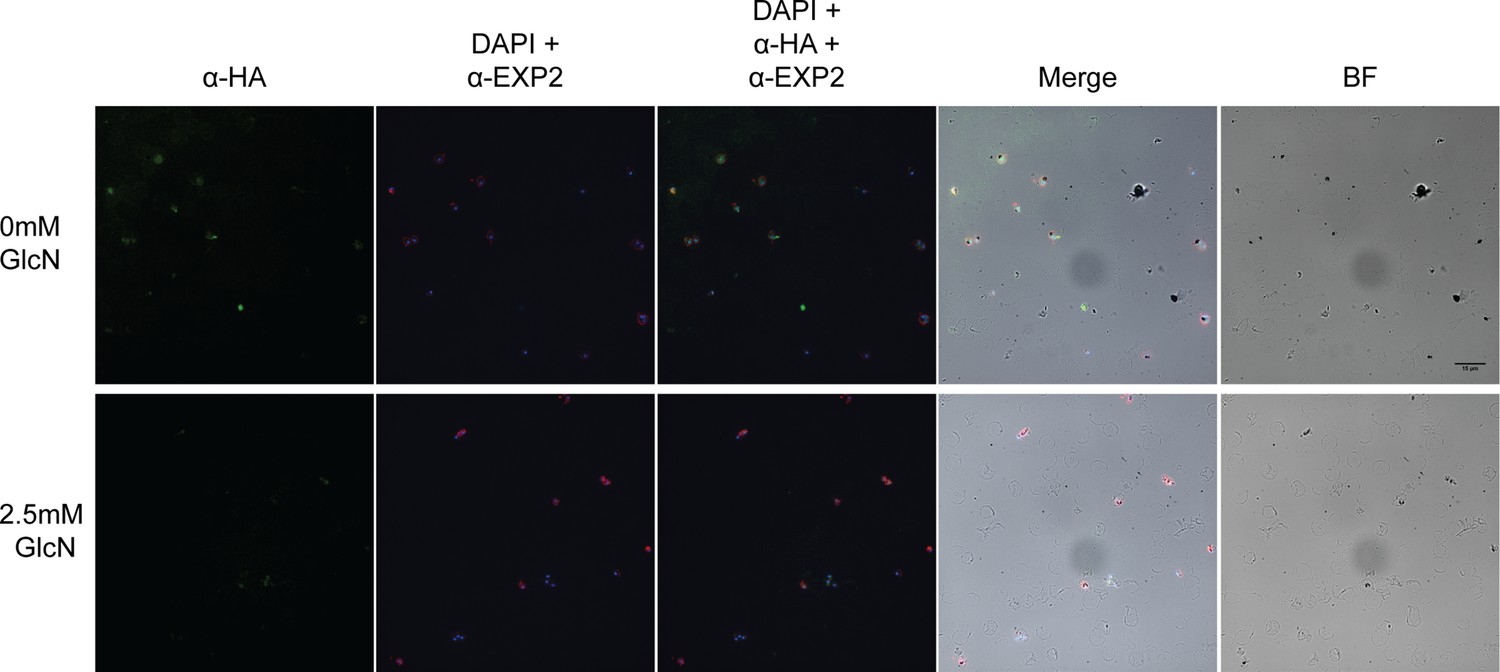
Immunofluorescent analysis of PfA-M17-HAglmS parasites the cycle following the addition of glucosamine (GlcN; C2) fixed with 90:10 acetone:methanol and probed with anti-HA, anti-EXP2 and DAPI.
BF, brightfield. Scale bar = 15 µm.
Figure 3—figure supplement 2
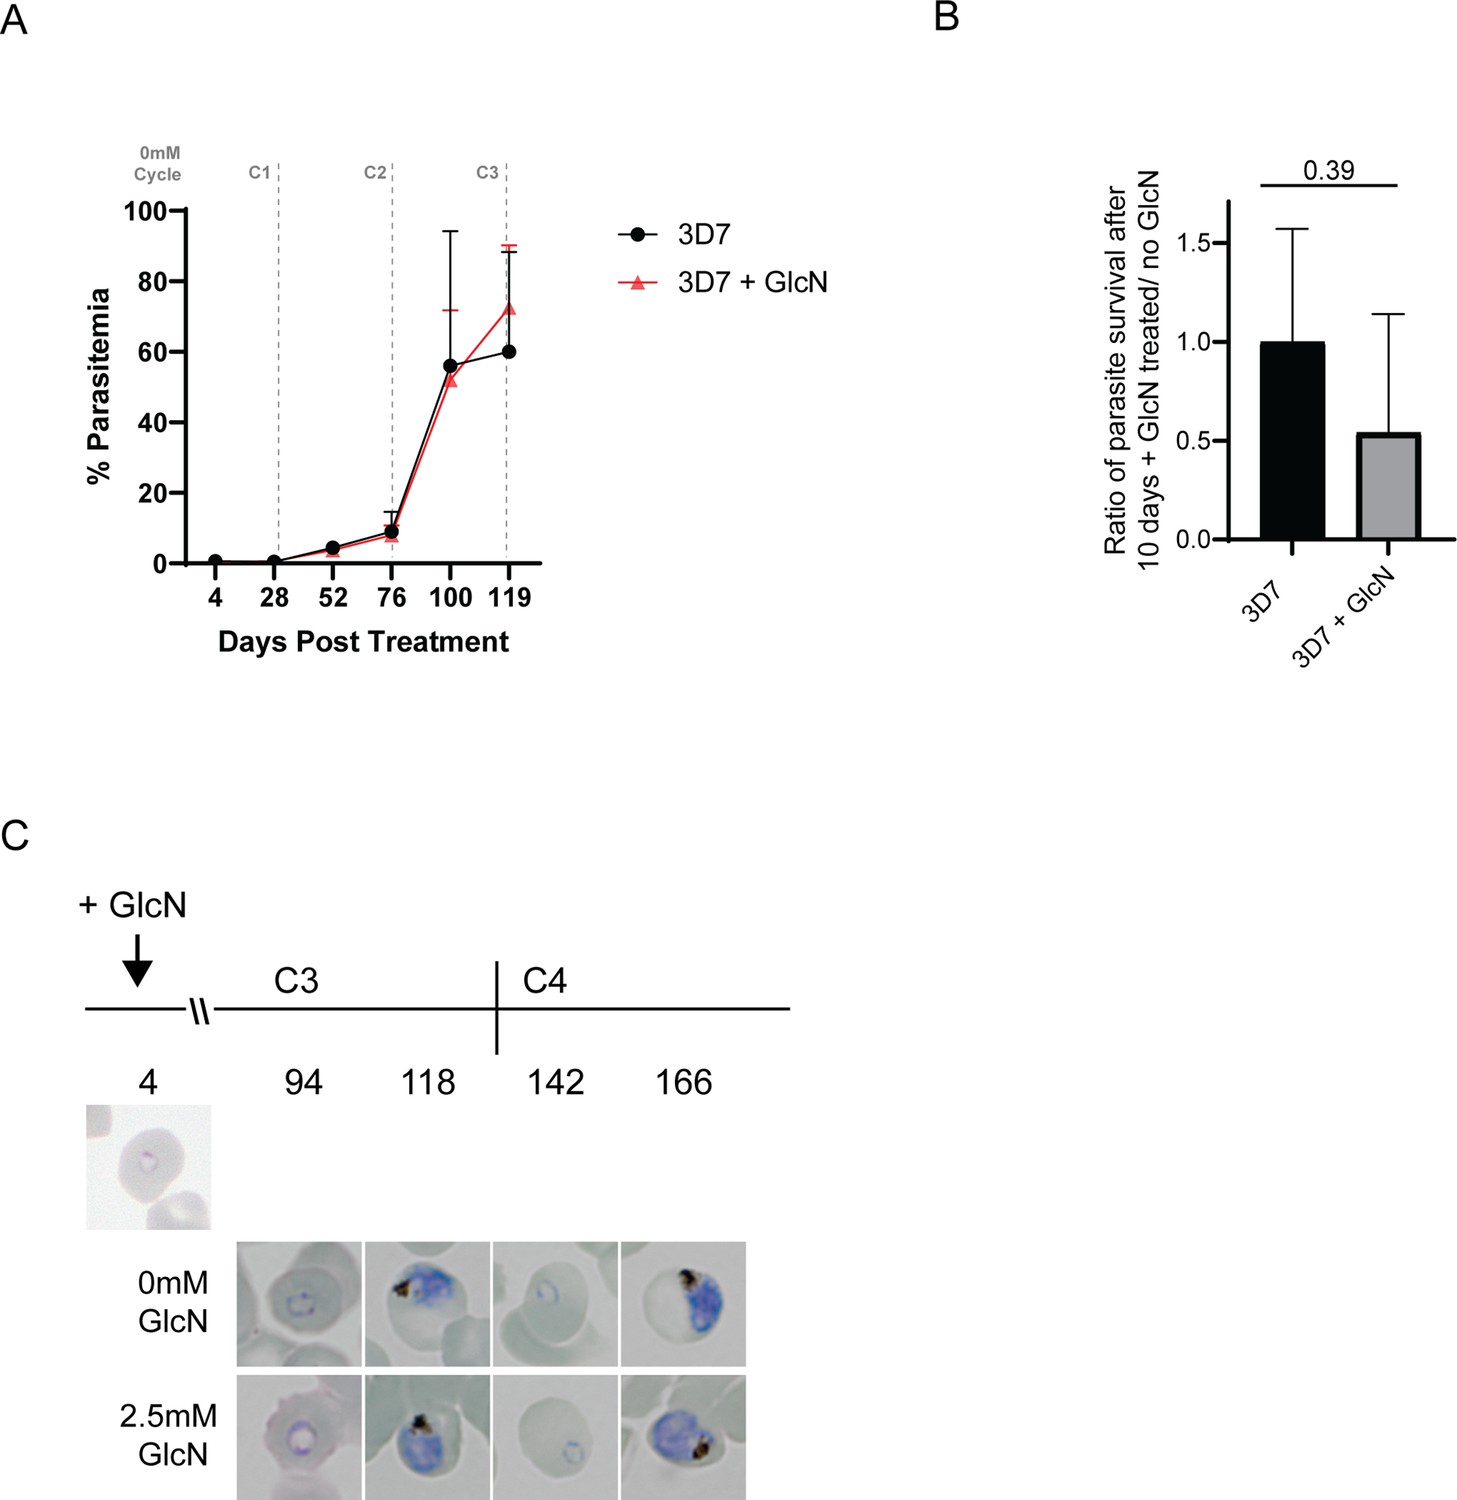
Addition of Glucosamine does not significantly affect growth of Pf3D7 parasites.
(A) Parasitemias of Pf3D7 parasites cultured ±2.5 mM GlcN over three cycles shows that parasite growth is not significantly affected between treatment groups. Shown is the mean ± standard deviation (n=2). (B) Ratio of parasite survival of Pf3D7 after treatment with 2.5 mM GlcN for 10 days compared to untreated parasites as determined by Sybr Green 1 assay. Shown is the mean ± standard deviation (n=2). Statistical significance was determined using an unpaired t-test. (C) Representative Giemsa-stained parasite smears of Pf3D7 cultures treated with 0 mM or 2.5 mM GlcN.
Figure 4 with 1 supplement
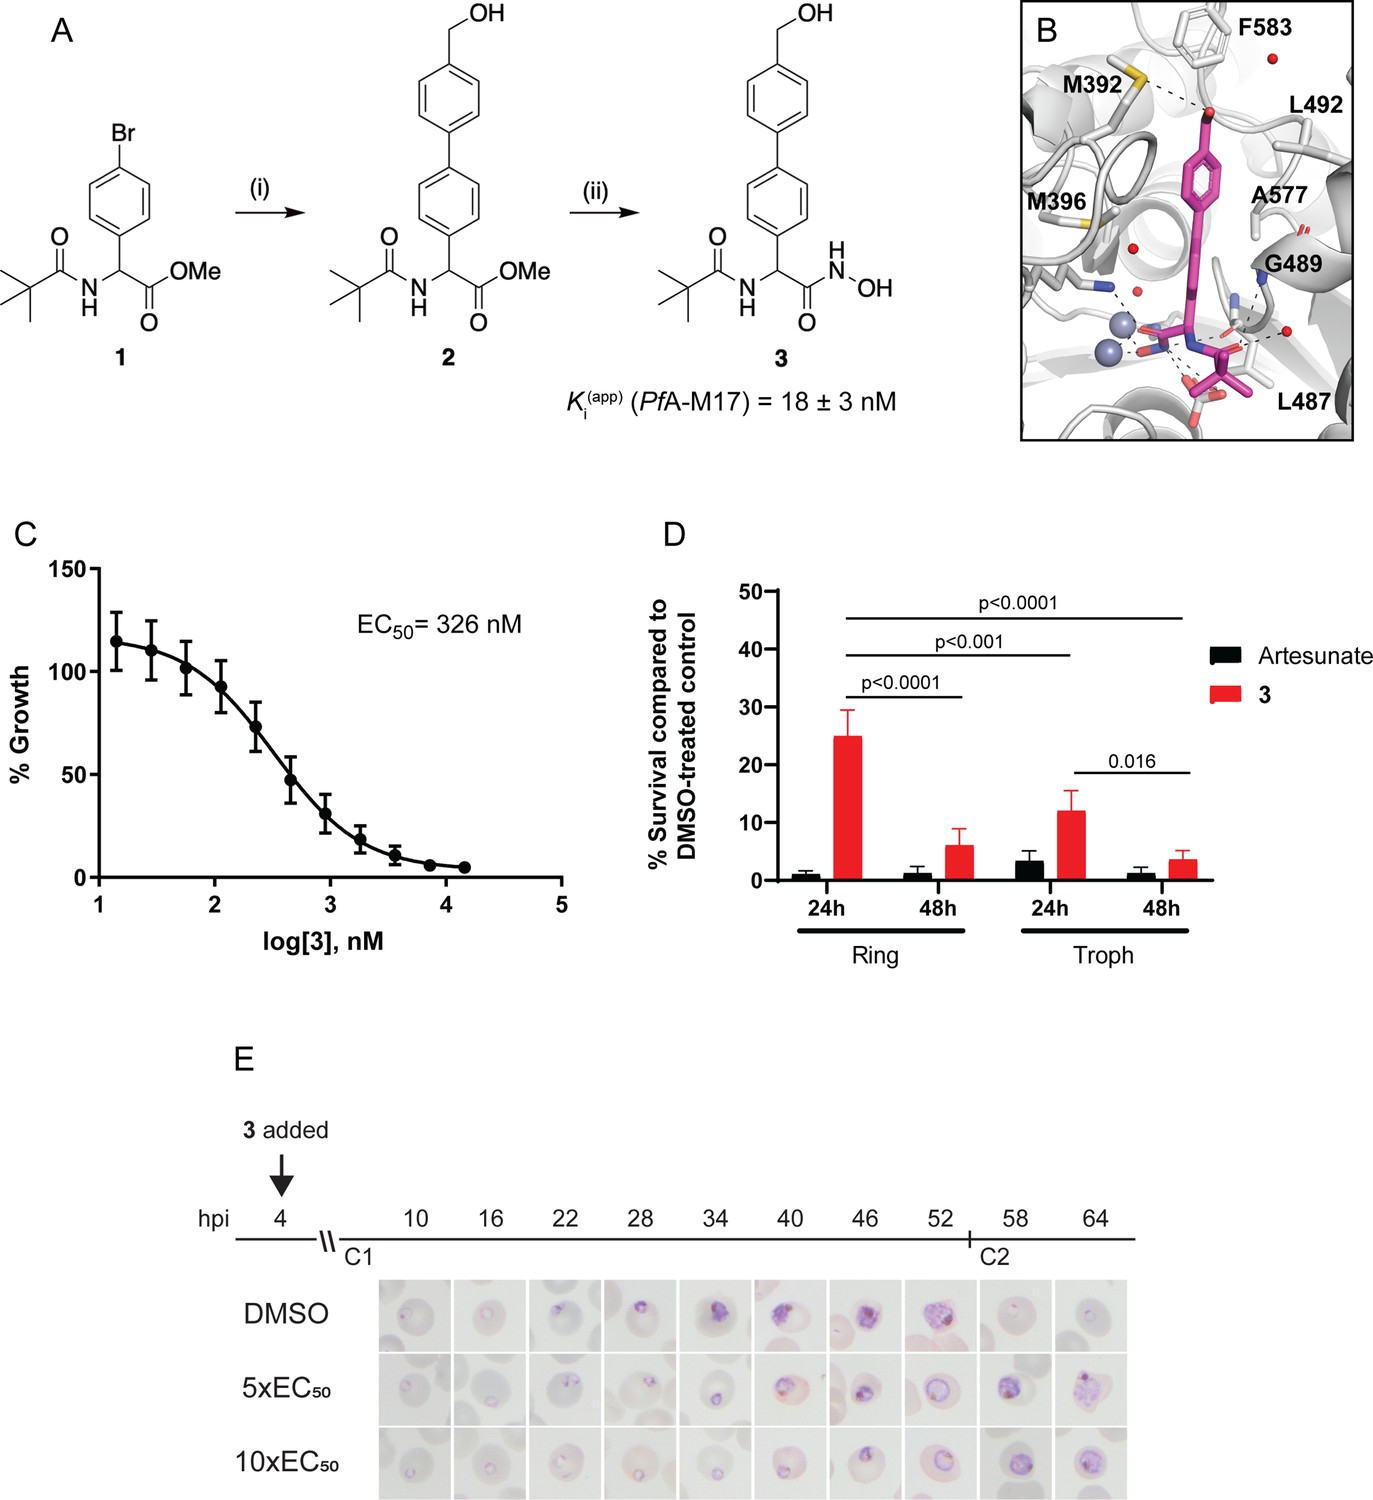
Synthesis and activity of 3, a specific PfA-M17 inhibitor.
(A) Scheme 1. Synthesis of 3: (i) Boronic acid, Pd(PPh3)2Cl2, Na2CO3, THF, 100 °C, 2 hr, (ii) NH2OH.HCl, KOH, RT, 16 hr. Inhibition constant for 3 toward recombinant, purified PfA-M17 is shown. (B) Binding mode of 3 bound to PfA-M17. Solvent-accessible surface of PfA-M17 (grey) with active site ions shown in grey spheres. Stick representation (magenta) shows the binding positions of 3. Molecular interactions between 3 and PfA-M17 are indicated by dashed lines; water molecules are represented by red spheres. (C) Killing action of 3 over 72 hr as determined by SYBR Green I assay. The EC50 value was calculated from four biological replicates performed in triplicate and data plotted as the mean ± standard error of the mean. (D) Parasite killing rate was determined by incubating Pf3D7 parasites in 10 x EC50 as previously determined for either 24 or 48 hr before the drug was washed off and parasites allowed to grow for a further 48 hr. Survival was determined via Sybr Green I assay and compared to vehicle (DMSO)-treated controls. Shown is the mean ± standard deviation (n=4). Statistical significance was determined using a one-way ANOVA. (E) Synchronized parasites at 4 hr post-invasion (hpi) were treated over two cycles (C1, cycle 1; C2, cycle 2) with either 5 x or 10 x EC50 or DMSO at the concentration present in the 10 x EC50 treatment. Representative Giemsa-stained smears from two biological replicates show delay in parasite maturation to schizogony (5 x EC50) or trophozoite stage (10 x EC50).
Figure 4—figure supplement 1
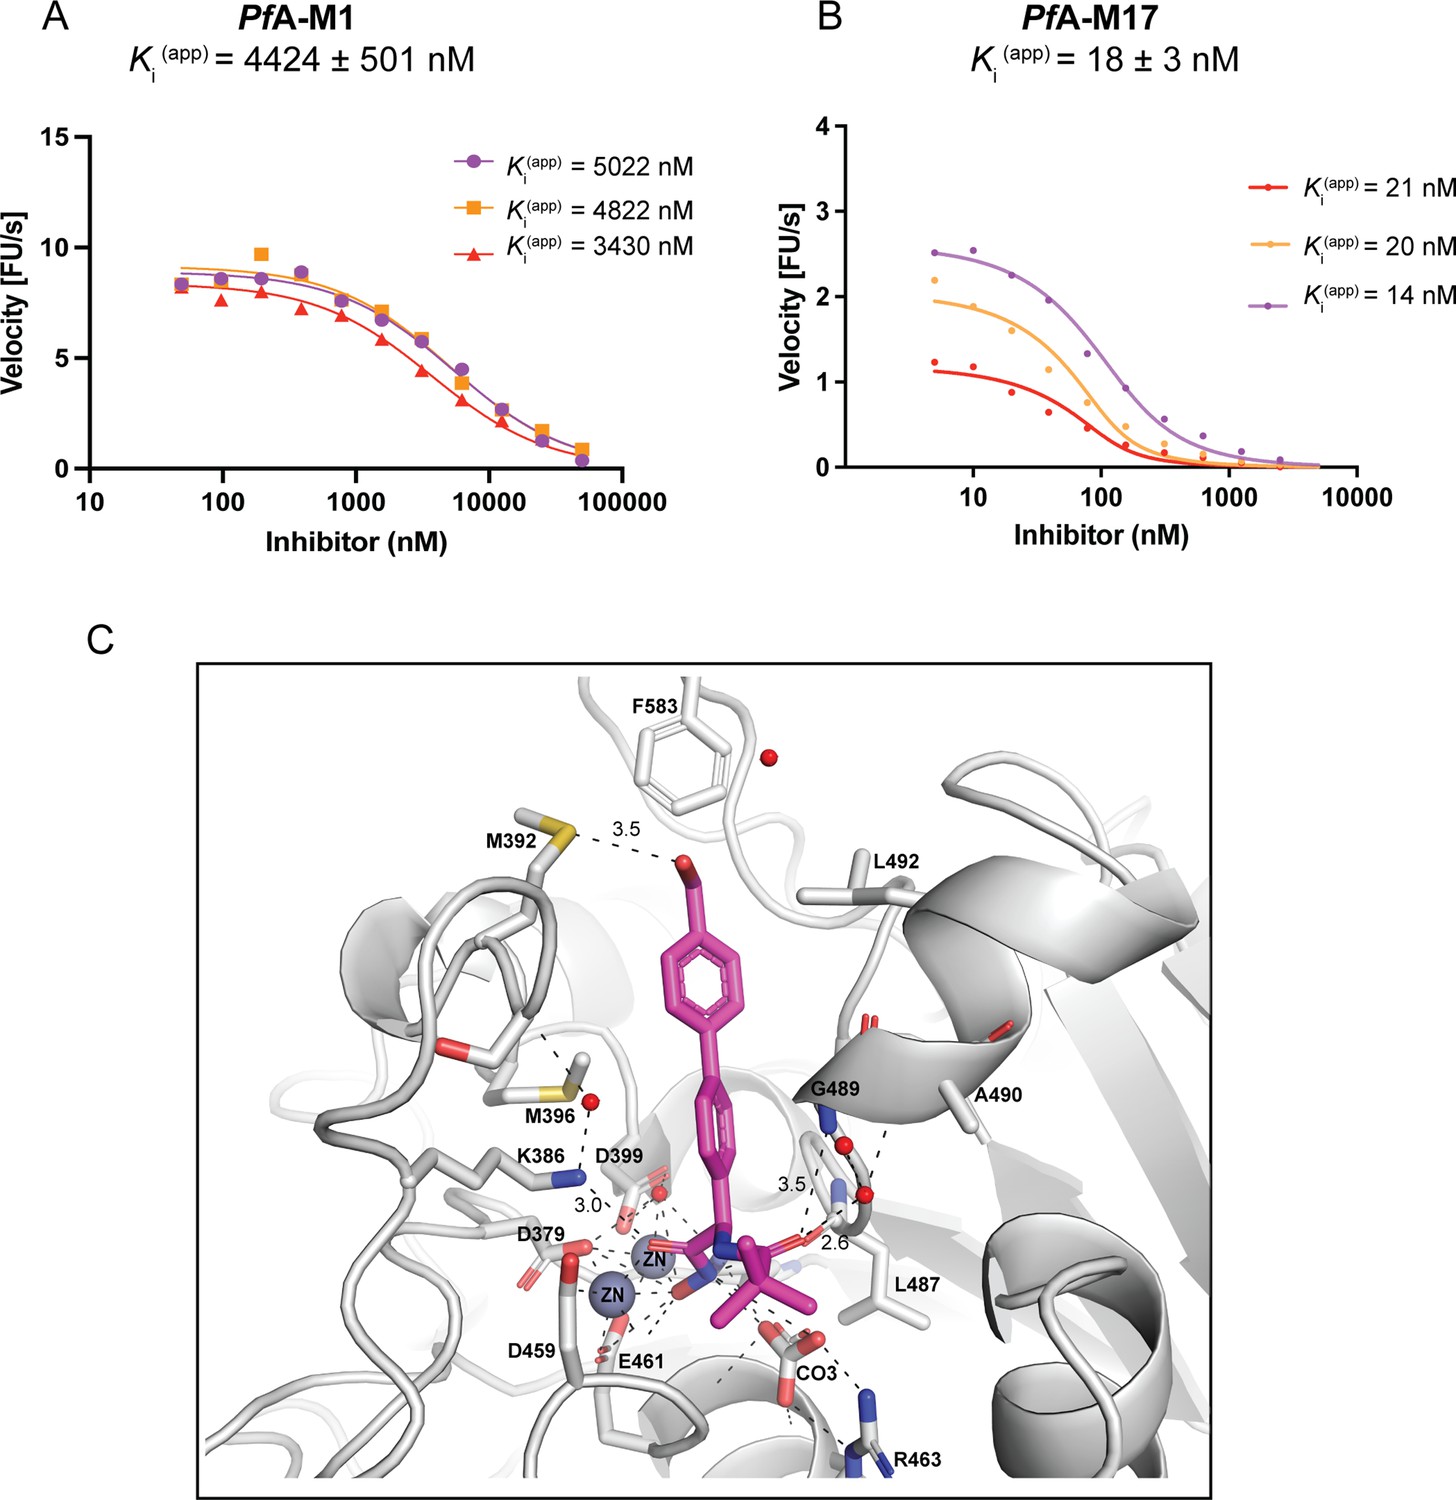
Compound 3 is a potent and selective PfA-M17 inhibitor.
Dose response curves showing aminopeptidase activity (fluorescence units per sec, FU/s) in the presence of increasing concentration (shown as log nM) of 3 for PfA-M1 (A) and PfA-M17 (B). Three separate dose-response curves prepared from three separate protein purifications are shown, with the final Ki (Bwire et al., 2020) value is the mean ± SEM of the three independent values (n=3). (C) Binding of 3 (magenta sticks) to PfA-M17 (grey cartoon). Interactions between 3 and PfA-M17 are shown by black dash lines and distances (Å) of key interactions (excluding zinc coordination) are indicated above dashed lines. Residues involved in hydrogen bonding and hydrophobic packing interactions are shown in grey sticks and residues numbers are indicated.
Figure 5
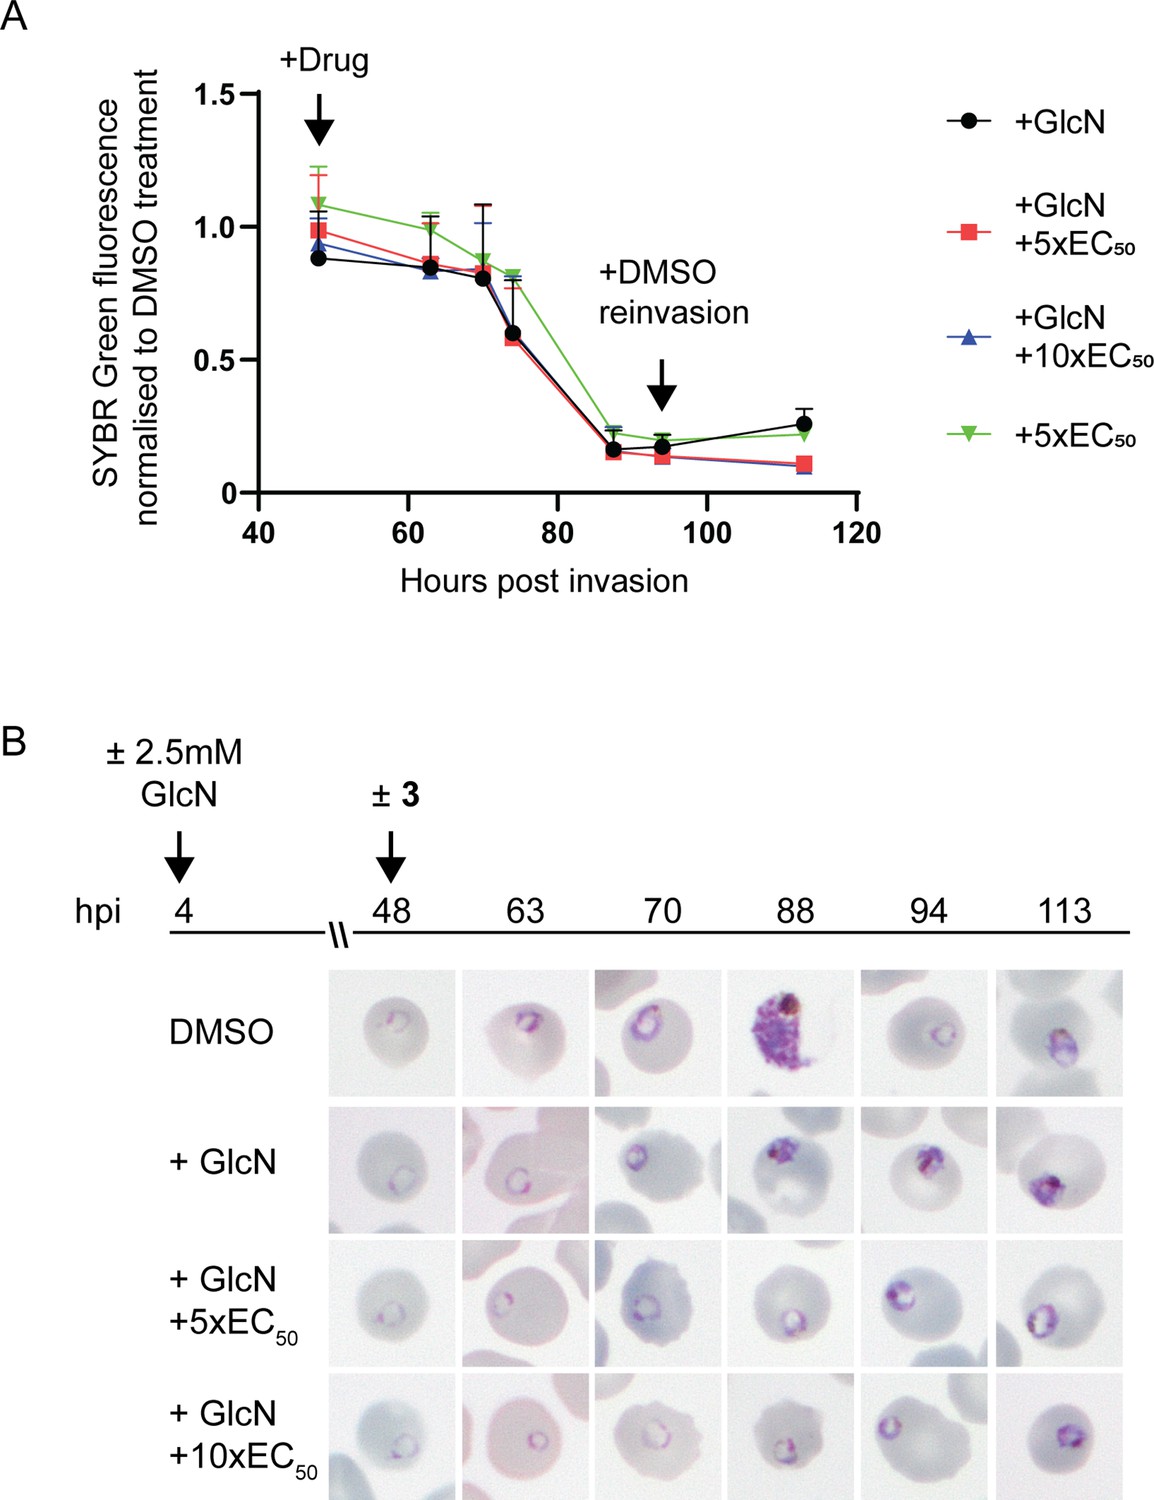
Effect of 3 treatment in parasites depleted of PfA-M17.
(A) SYBR I Green fluorescence normalized to DMSO treated parasites indicates there is no significant difference on growth between treatments. Plotted is the mean ± standard deviation (n≥2). (B) Upper panel: overview of experiment. Heparin synchronized PfA-M17-HAglmS parasites were treated with 2.5 mM GlcN and allowed to invade into cycle 2 before being treated with 3 or DMSO. Lower panel: representative Giemsa-stained parasite smears of PfA-M17-HAglmS parasites treated with ±GlcN and ± 5 x or 10 x EC50 of compound 3 shows parasites developing at a slower rate than the DMSO-treated control but in a similar manner between the treatment groups, n=2 biological replicates.
Figure 6
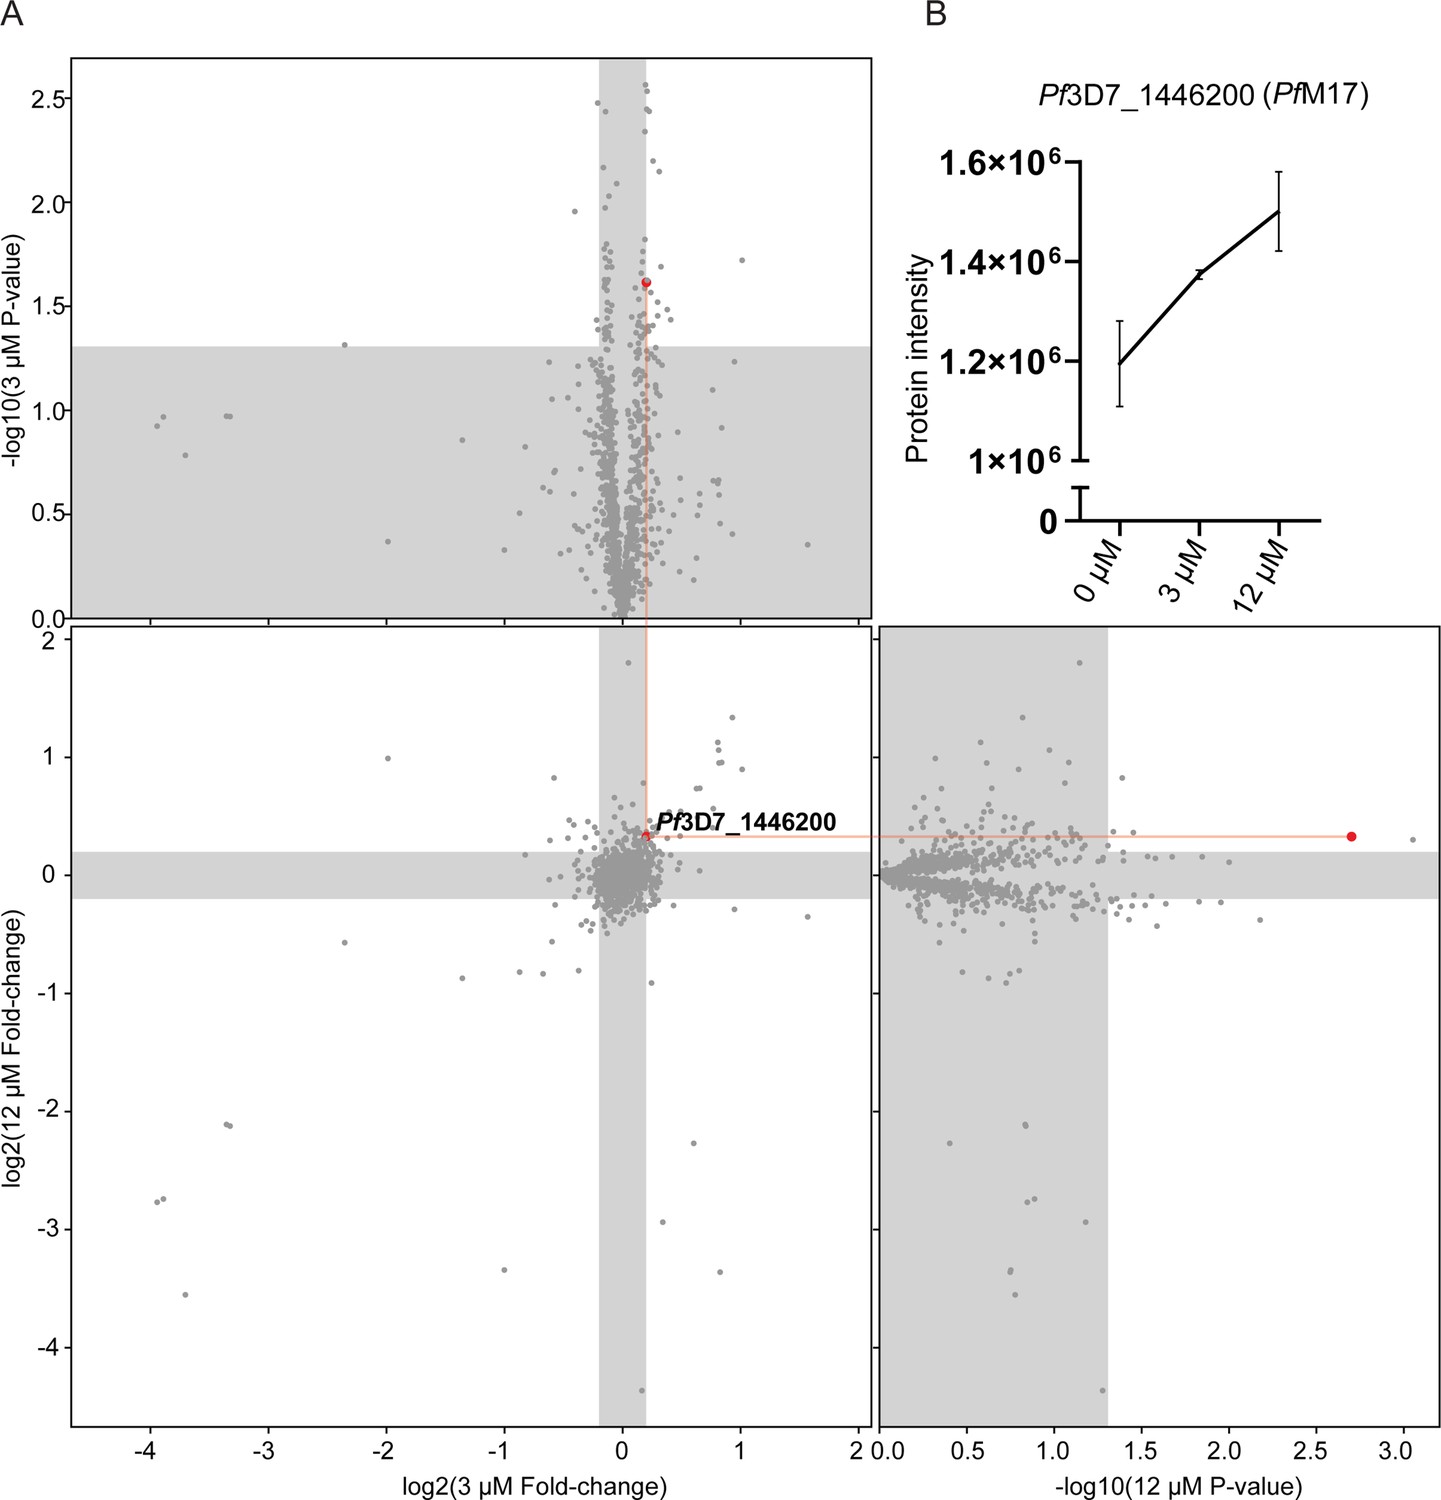
Thermal proteome profiling identified PfA-M17 to be the target of compound 3.
(A) Paired volcano plot of all proteins detected. The outside panels show the log2 fold change vs –log10 p-value of proteins following treatment with 3 µM or 12 µM of compound 3, relative to the 0 µM negative control, following a 60 °C thermal challenge. Proteins significantly (p-value > -log10 (0.05) Welch’s t test) stabilized (fold change >log2 (1.15)) or destabilized (fold change <log2 (0.87)) appear in the unshaded regions. The thermal stability of a single protein (Pf3D7_1446200) was altered at both concentrations with a p- value <0.05, with increasing stability in increasing concentrations of compound 3. This is indicated via red lines and dots. (B) Protein intensity of Pf3D7_1446200 (PfA-M17) in increasing concentration of compound 3 and following 60 °C thermal challenge. Value represents the mean of four technical replicates ± standard deviation.
Figure 7
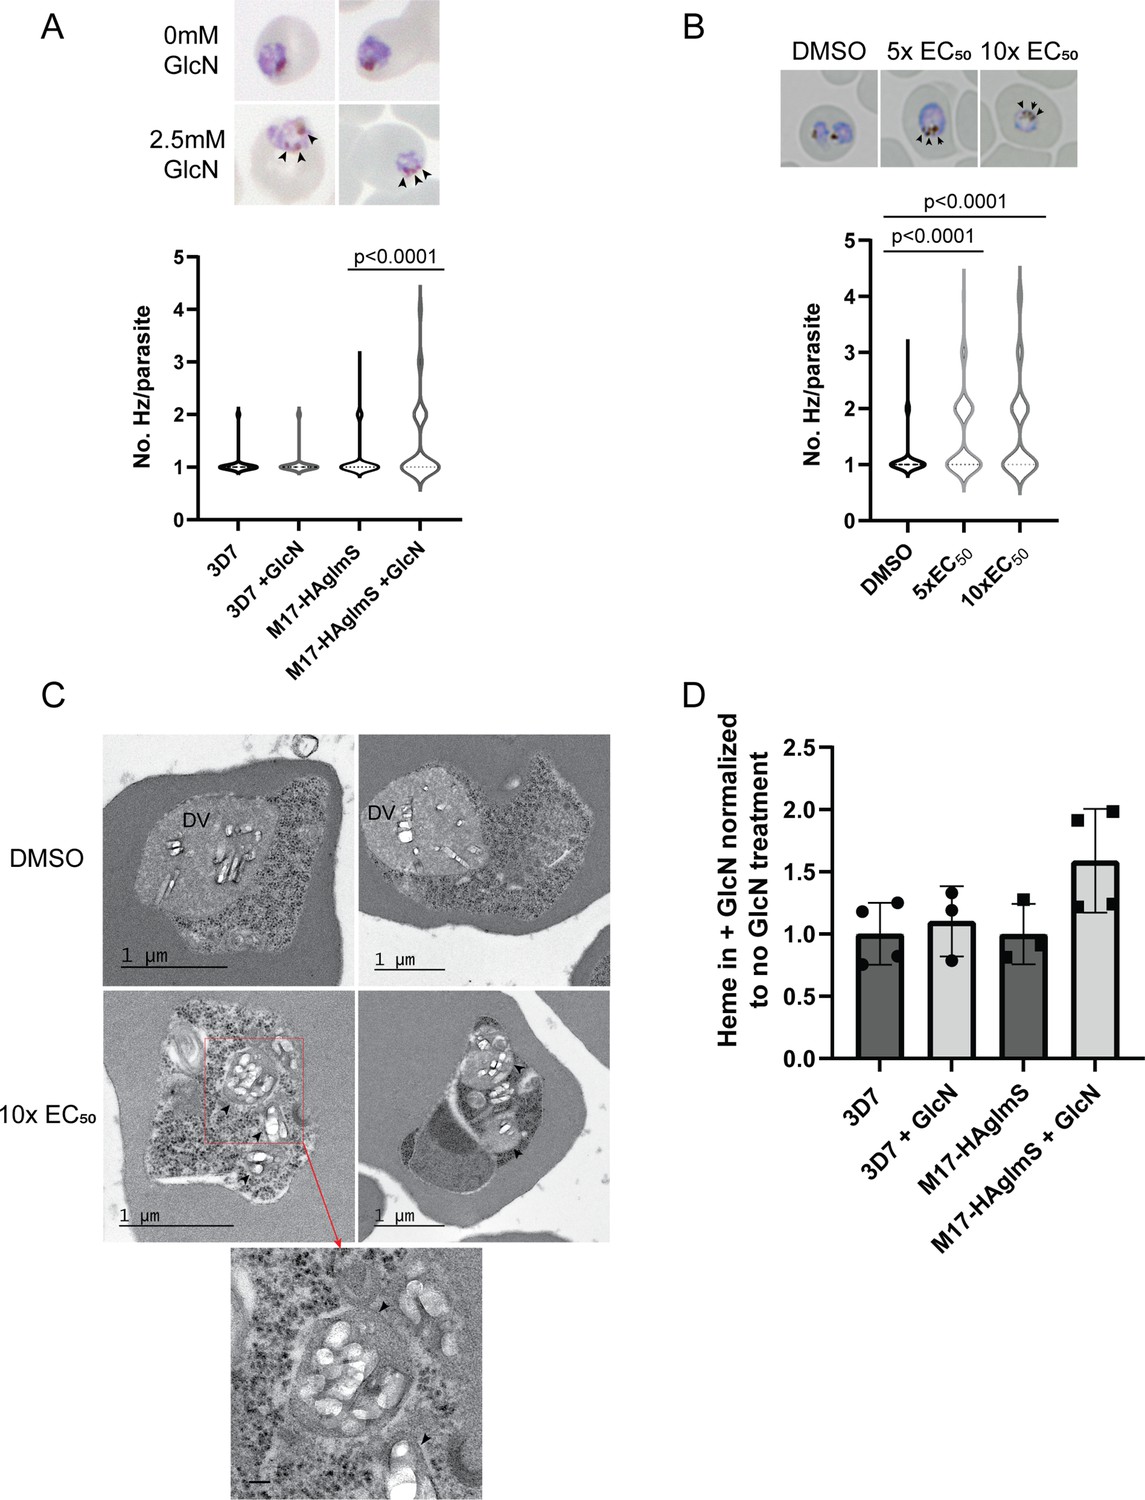
Parasites depleted of PfA-M17 develop significantly more digestive vacuoles.
(A) Upper panel: Representative Giemsa-stained smears of PfA-M17-HAglmS ± GlcN; black arrowheads indicate multiple digestive vacuoles. Lower panel: Number of digestive vacuoles per Pf3D7 and PfA-M17-HAglmS the cycle following addition of glucosamine (GlcN) as determined under Giemsa-staining. Shown is the median with range combined from four biological replicates (n≥100). Statistical significance was determined by a one-way ANOVA followed by Dunn’s Multiple Comparison test (a nonparametric post hoc). (B) Upper panel: Representative Giemsa-stained smears of Pf3D7+ DMSO, 5 x or 10 x the EC50 of 3; black arrows indicate multiple digestive vacuoles. Lower panel: Number of digestive vacuoles per Pf3D7 following the addition of 3 at 4 hr post invasion (hpi) as determined under Giemsa-staining. Shown is the median with range combined from two biological replicates (n≥100). Statistical significance was determined by a one-way ANOVA followed by Dunn’s Multiple Comparison test (a nonparametric post hoc). (C) Representative transmission electron micrographs of two Pf3D7 parasites treated with 10 x EC50 of 3 (lower panels) and two with DMSO vehicle control (upper panels). Images show hemozoin crystals (white block shapes) bound within digestive vacuoles (DVs). DVs in treated parasites are indicated by black arrowheads. In the higher magnification micrograph of the lower left panel (corresponding area indicated by red dashed box), the arrowheads indicate the membrane surrounding each of the DV profiles. Scale bar in the high magnification represents 100 nm. (D) Free heme representative of hemozoin in Pf3D7 and PfA-M17-HAglmS GlcN-treated parasites relative to untreated parasites. Shown is the mean ± standard deviation (n≥3). No significance difference between groups was found using an unpaired t-test.
Figure 8 with 3 supplements
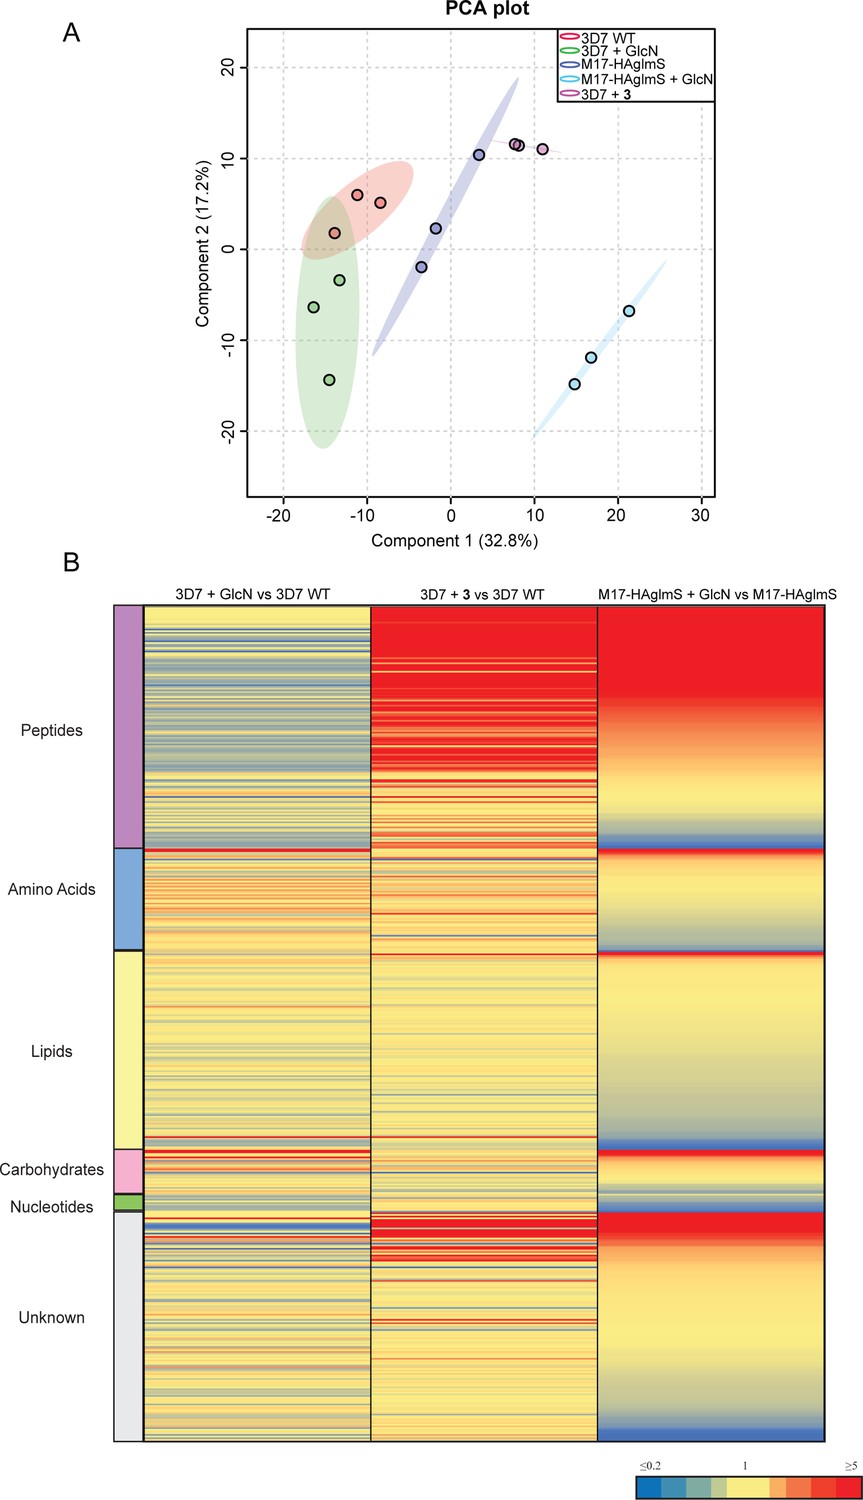
Untargeted metabolomics analysis of PfA-M17-HAglmS and Pf3D7 parasites treated with ± GlcN and of Pf3D7 parasites treated with 3 from experiment 1.
(A) Principal component analysis (PCA) of parasites (PfA-M17-HAglmS and Pf3D7) treated with ± GlcN and 3 or DMSO control. Scores plot show principal components one and two, data points indicate individual sample replicates within each condition and the shaded area denotes 95% confidence interval. (B) Heatmap showing the average fold change for all putative metabolites for the three treatment conditions of Pf3D7+ GlcN versus WT, Pf3D7 +compound 3 versus WT, and PfA-M17HAglmS + GlcN versus PfA-M17HAglmS. For PfA-M17HAglmS + GlcN versus PfA-M17HAglmS, the fold change values have been ordered from highest to lowest. Values represent the average of three technical replicates, red, blue, and yellow indicates increase, decrease and no change, respectively, in the fold change of putative metabolites identified.
Figure 8—figure supplement 1
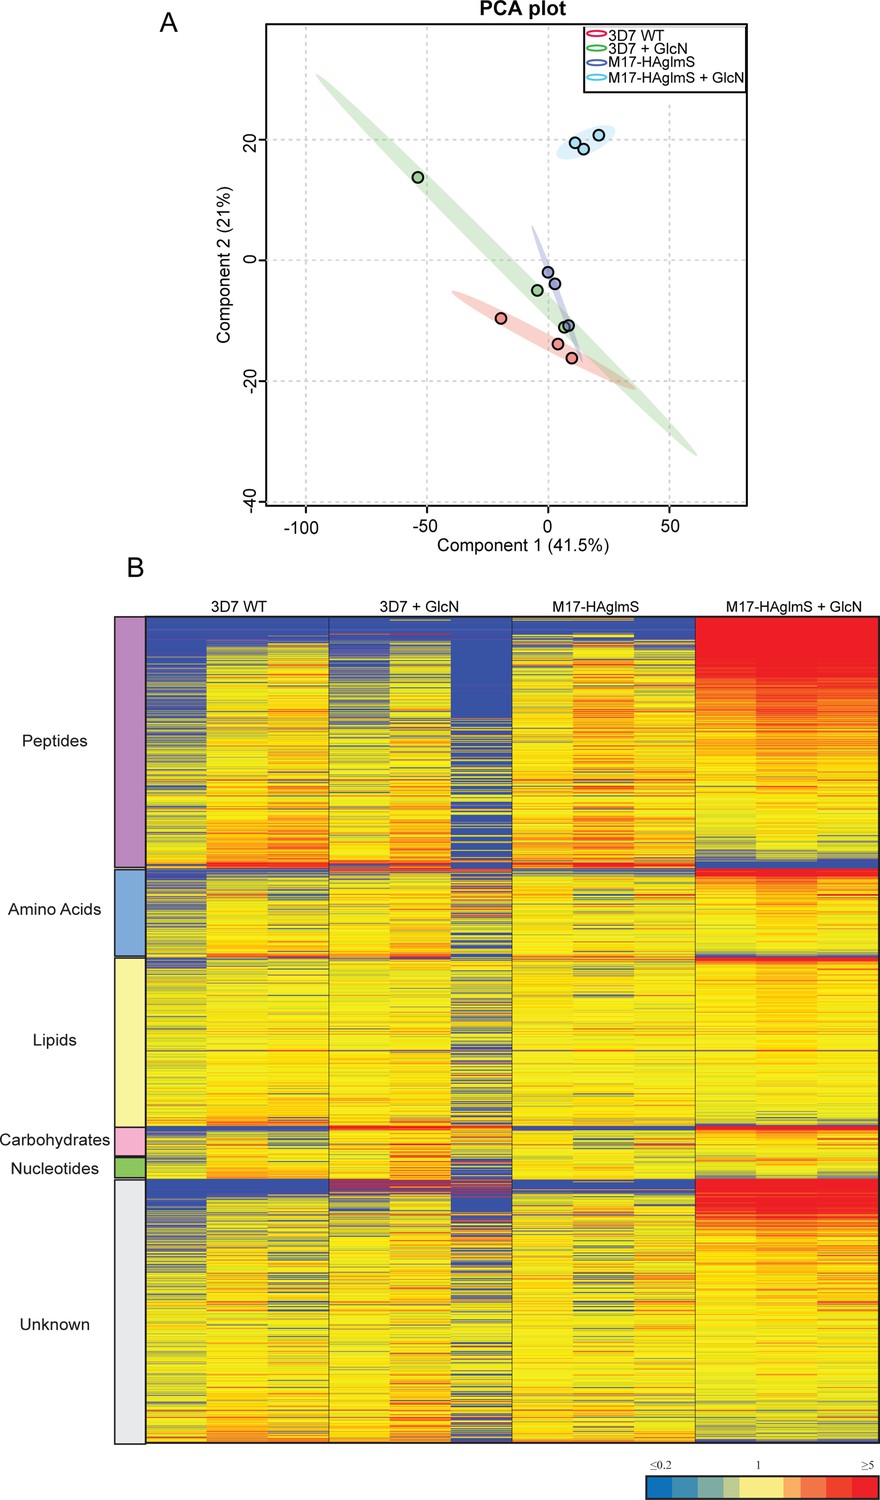
Untargeted metabolomics analysis of PfA-M17-HAglmS and Pf3D7 parasites treated with ±GlcN from experiment 2.
(A) Principal component analysis (PCA) of parasites (PfA-M17-HAglmS and Pf3D7) treated with ± GlcN. Scores plot show principal components one and two, data points indicate individual sample replicates within each condition and the shaded area denotes 95% confidence interval. (B) Heatmap analysis of peak intensities of all putative metabolites for each condition. Data is shown from three technical replicates, red, blue and yellow indicates increase, decrease and no change respectively in the relative abundance of putative metabolites identified.
Figure 8—figure supplement 2
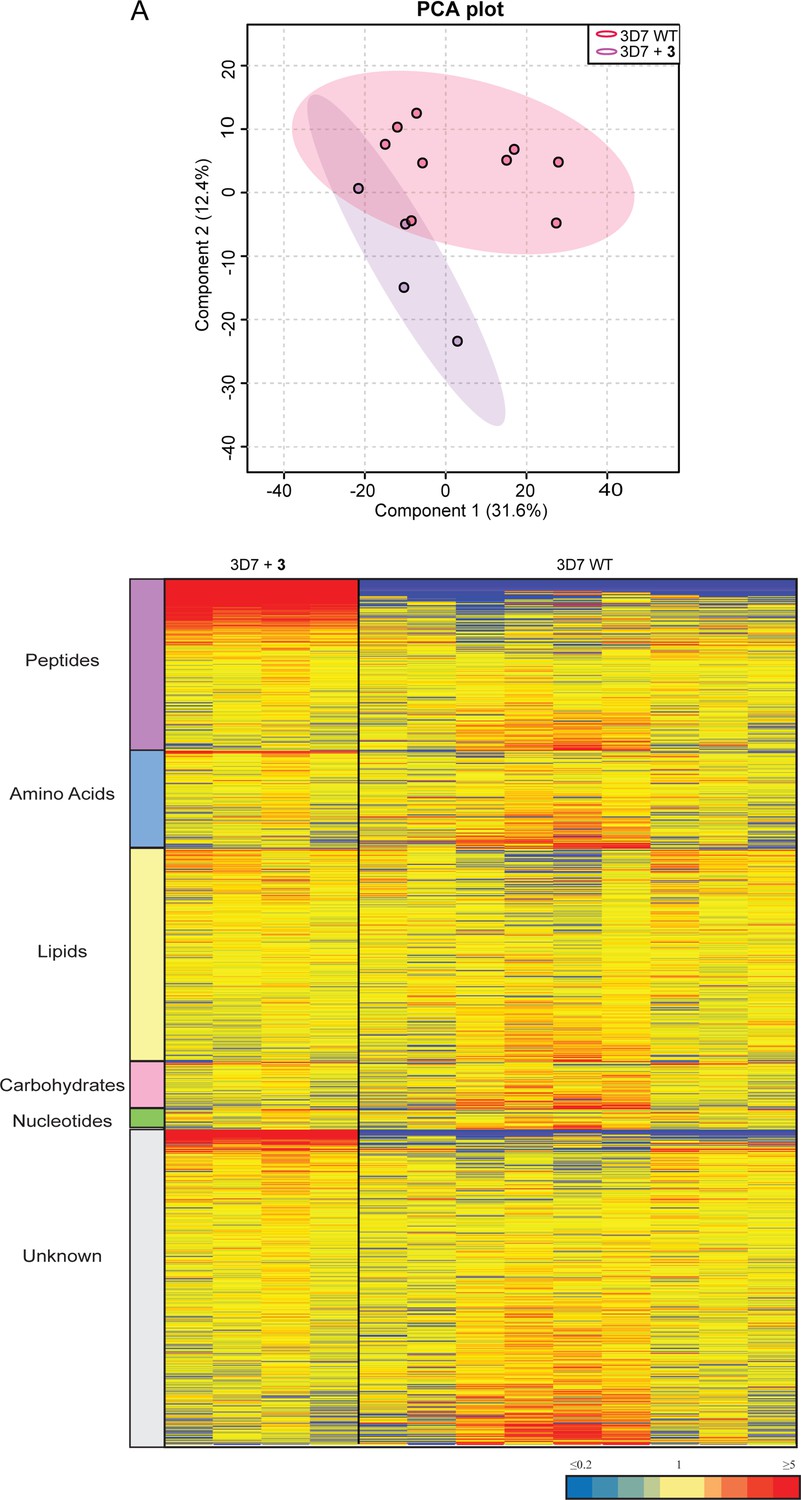
Untargeted metabolomics analysis of Pf3D7 parasites treated with 3 and DMSO control from experiment 3.
(A) Principal component analysis (PCA) of parasites Pf3D7 treated with 3 and DMSO control. Scores plot show principal components one and two, data points indicate individual sample replicates within each condition and the shaded area denotes 95% confidence interval. (B) Heatmap analysis of peak intensities of all putative metabolites for each condition. Data is shown from four to nine biological replicates, red, blue, and yellow indicates increase, decrease and no change respectively in the relative abundance of putative metabolites identified.
Figure 8—figure supplement 3
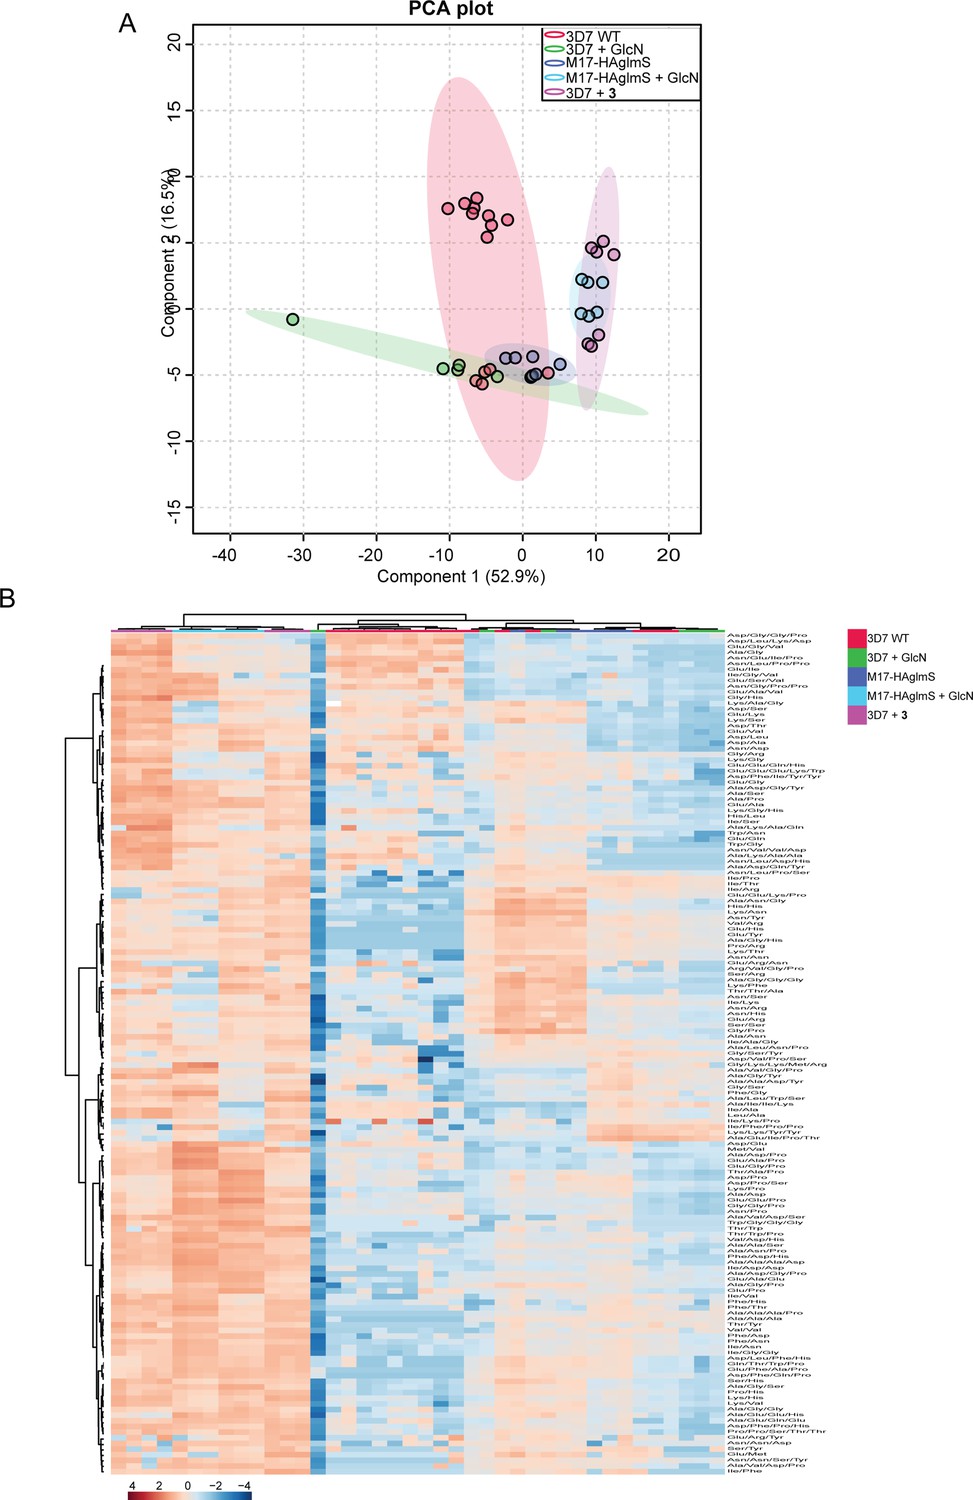
Targeted analysis of all common peptides identified from experiment 1, 2 and 3.
(A) Principal component analysis (PCA) of common peptides identified across three experiments for parasites (PfA-M17-HAglmS and Pf3D7) treated with +/-GlcN and 3 or DMSO control. Scores plot show principal components one and two, data points indicate individual sample replicates within each condition and the shaded area denotes 95% confidence interval. (B) Hierarchical clustering of the common peptides identified across the three independent experiments. Vertical clustering displays similarities between sample groups, while horizontal clusters reveal the relative abundances (median normalized) of common identified peptides (149). The color scale bar represents log2 (mean-centred and divided by the standard deviation of each variable) intensity values.
Figure 9
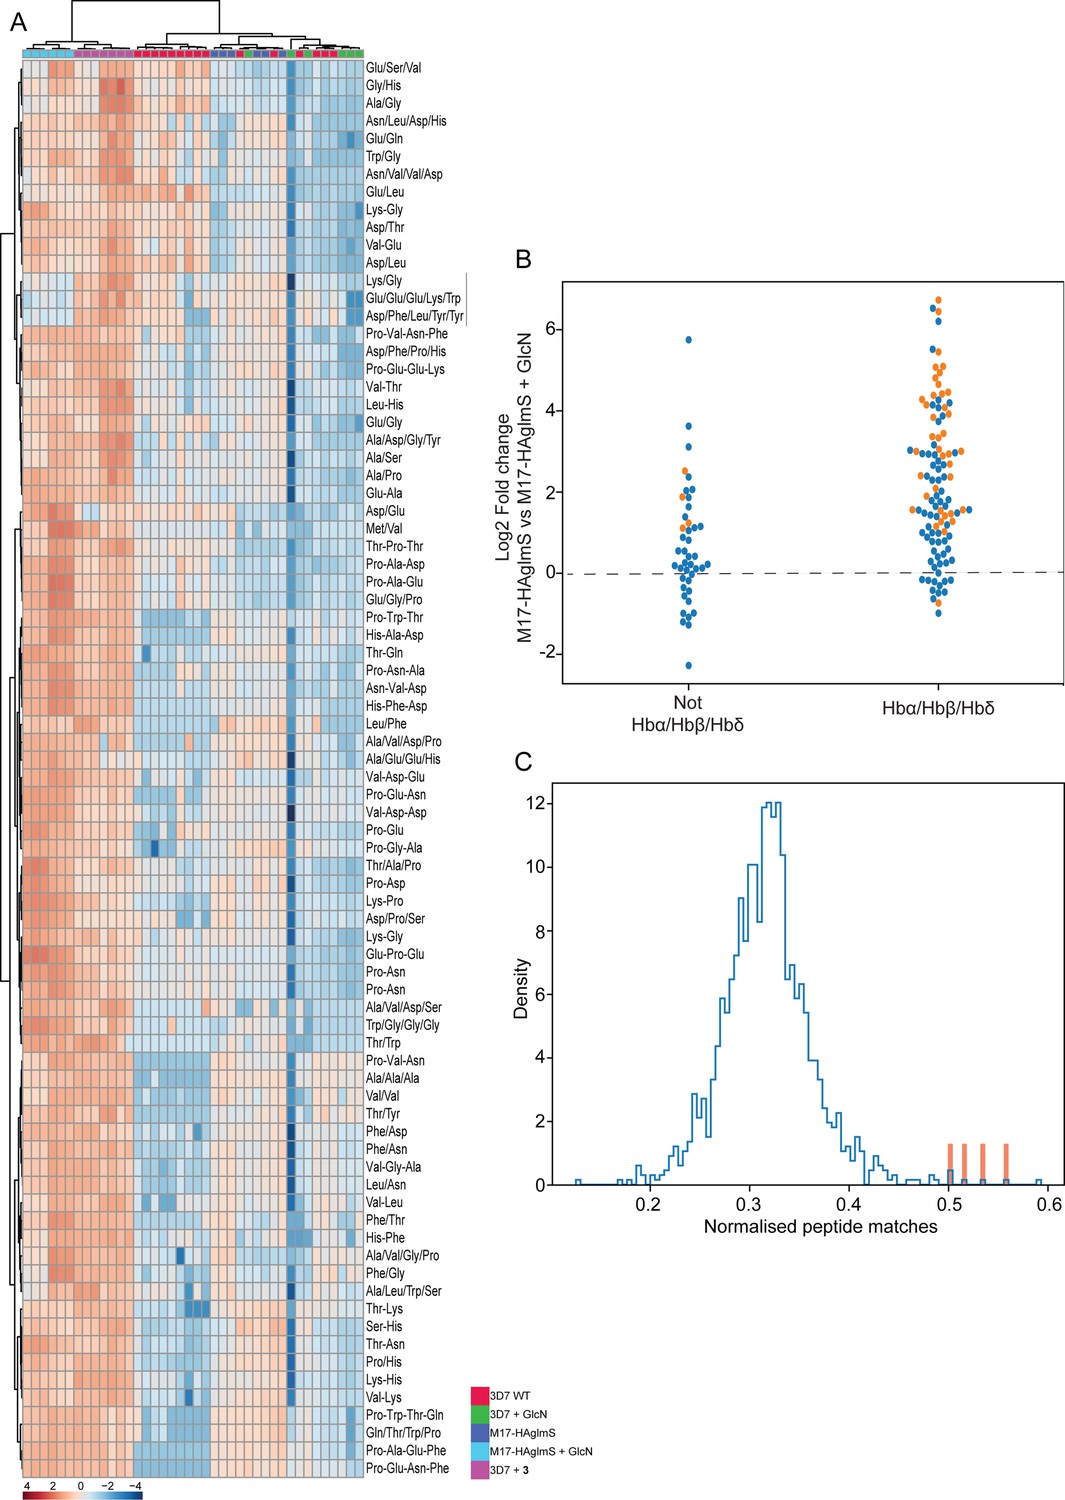
Targeted analysis of common significantly perturbed peptides (P-value <0.05) following addition of GlcN or treatment with 3 identified from experiment 1, 2 and 3.
(A) Hierarchical clustering of the 80 significantly perturbed common peptides (fold change >1.5 and p-value <0.05) identified across the three independent experiments. Vertical clustering displays similarities between samples, while horizontal clusters reveal the relative abundances (median normalized) of the 80 peptides. The color scale bar represents log2 (mean-centered and divided by the standard deviation of each variable) intensity values. Black bar indicates peptides increased in 3 treatment only. Peptides with hyphen (-) notations indicate confirmed sequence by MS/MS. Peptides with slash (/) notation indicate putative amino acid composition (accurate mass), without confirmed sequence order. (B) Differential enrichment of the 80 common significantly perturbed peptides that could or could not (blue dots) be derived from hemoglobin α, β, and δ. Orange dots are peptides that have MS/MS spectrum and their sequence have been confirmed. (C) Histogram of the sequence similarity of ~4700 proteins present in P. falciparum-infected erythrocytes to the peptides significantly dysregulated by PfA-M17 disruption or inhibition. Here, sequence similarity is quantified as the number of times a significantly perturbed peptide matches a given protein, normalized by protein length. The Hb chains α, α2, β, and δ are highlighted in red.
Figure 10

Removal of exogenous amino acids except for isoleucine sensitizes parasites to 3.
Killing action of 3 or artemisinin in either normal medium containing all amino acids (blue) or amino acid (AA) free medium, containing isoleucine (red) was measured over 72 hr and determined by SYBR Green I assay. The EC50 values were calculated from three biological replicates performed in triplicate and data plotted as the mean ± standard error of the mean, with the inlay bar graphs showing the mean EC50 values of these replicates with statistical significance determined using an unpaired t-test.
Additional files
-
Supplementary file 1
Crystallography and refinement statistics for PfA-M17 bound to 3.
- https://cdn.elifesciences.org/articles/80813/elife-80813-supp1-v1.docx
-
Supplementary file 2
Oligonucleotide sequences used in this study.
- https://cdn.elifesciences.org/articles/80813/elife-80813-supp2-v1.docx
-
Transparent reporting form
- https://cdn.elifesciences.org/articles/80813/elife-80813-transrepform1-v1.pdf
-
Source data 1
- https://cdn.elifesciences.org/articles/80813/elife-80813-data1-v1.xlsx
-
Source data 2
Source data of metabolite abundance for Figures 8 and 9 and associated figure supplements.
- https://cdn.elifesciences.org/articles/80813/elife-80813-data2-v1.xlsx
Download links
A two-part list of links to download the article, or parts of the article, in various formats.
Downloads (link to download the article as PDF)
Open citations (links to open the citations from this article in various online reference manager services)
Cite this article (links to download the citations from this article in formats compatible with various reference manager tools)
Genetic and chemical validation of Plasmodium falciparum aminopeptidase PfA-M17 as a drug target in the hemoglobin digestion pathway
eLife 11:e80813.
https://doi.org/10.7554/eLife.80813


