Mcm2 promotes stem cell differentiation via its ability to bind H3-H4
- Institute for Cancer Genetics, Columbia University Medical Center, United States
- Herbert Irving Comprehensive Cancer Center, Columbia University Medical Center, United States
- Department of Pediatrics, Columbia University Medical Center, United States
- Department of Genetics and Development, Columbia University Medical Center, United States
- Department of Chemistry, University of Colorado Denver, United States
Figures
Figure 1 with 1 supplement
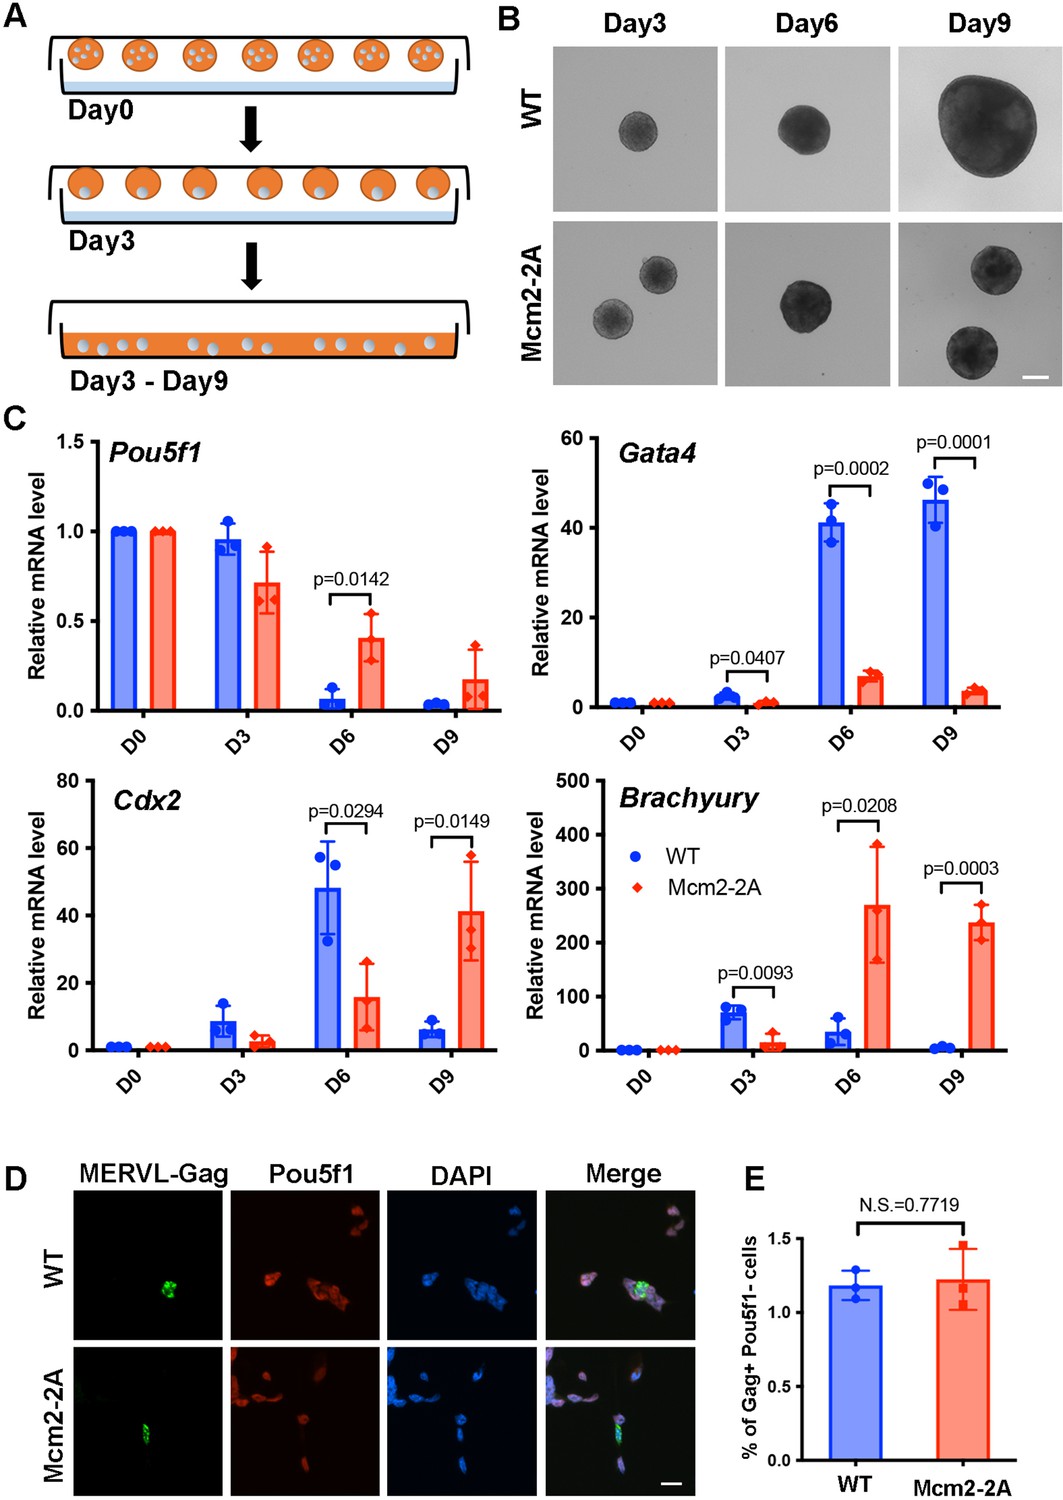
Mcm2-2A mutation in mouse embryonic stem cells (ESCs) impairs differentiation.
See also Figure 1—source data 1. (A) A diagram showing the embryoid body (EB) formation assay. (B) Representative images of wild type (WT) and Mcm2-2A cells during the process of EB formation. Scale bar: 20 µm. (C) RT-PCR analysis of the expression of Pou5f1 (a gene involved in pluripotency) and three lineage-specific genes in WT and Mcm2-2A cells during EB formation. GAPDH was used for normalization. Data are presented as means ± SD from three independent experiments. (D) Representative immunofluorescence images for detection of Pou5f1 and MERVL-Gag proteins in WT and Mcm2-2A mouse ESCs. Scale bar: 20 µm. (E) Quantification of Gag+ Pou5f1- cells in (D). At least n=1500 cells were counted for each cell line. Data are presented as means ± SD from three independent experiments. Statistical analysis in C and E was performed by two-tailed unpaired Student’s t test with p values marked on the graphs (N.S., no significant difference).
-
Figure 1—source data 1
Relative mRNA level of pluripotency and lineage-specific genes during embryoid body (EB) formation in wild type (WT) and Mcm2-2A cells, and 2-cell (2C)-like ratio in WT and Mcm2-2A embryonic stem cells (ESCs).
- https://cdn.elifesciences.org/articles/80917/elife-80917-fig1-data1-v2.xlsx
Figure 1—figure supplement 1
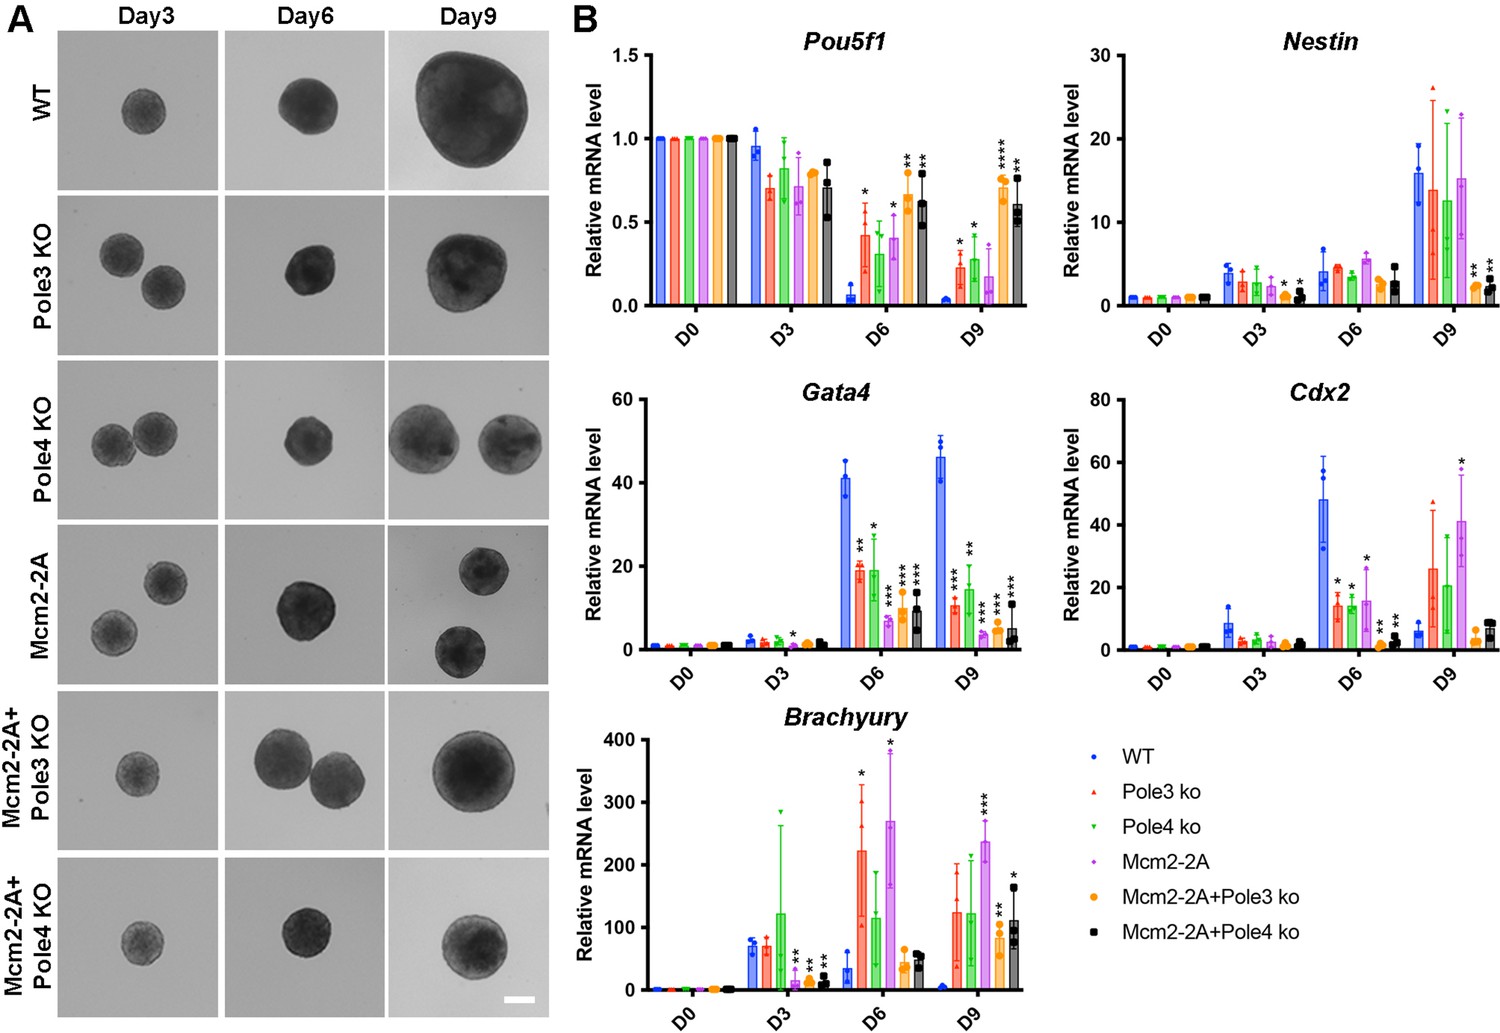
Mcm2-2A, Pole3 KO, and Pole4 KO mutations affect embryonic stem (ES) cell differentiation based on in vitro embryonic body (EB) formation assays.
See also Figure 1—figure supplement 1—source data 1. (A) Representative images of wild type (WT), Pole3 KO, Pole4 KO, Mcm2-2A, Mcm2-2A + Pole3 KO, and Mcm2-2A + Pole4 KO cells during the process of EB formation. Scale bar: 20 µm. (B) RT-PCR analysis of expression of Pou5f1 (a gene involved in pluripotency) and four lineage-specific genes (Nestin, Gata4, Cdx2, and Brachyury) in WT, Pole3 KO, Pole4 KO, Mcm2-2A, Mcm2-2A + Pole3 KO, and Mcm2-2A+ Pole4 KO cells during EB formation. The relative expression of each gene against house-keeping gene GAPDH is presented as means ± SD from three independent experiments. Statistical analysis was performed by two-tailed unpaired Student’s t test (*p<0.05; **p<0.01; ***p<0.001).
-
Figure 1—figure supplement 1—source data 1
Relative mRNA level of pluripotency and lineage-specific genes during embryoid body (EB) formation in wild type (WT), Pole4 KO, Pole4 KO, Mcm2-2A, Mcm2-2A + Pole3 KO, and Mcm2-2A + Pole4 KO cells.
- https://cdn.elifesciences.org/articles/80917/elife-80917-fig1-figsupp1-data1-v2.xlsx
Figure 2 with 2 supplements
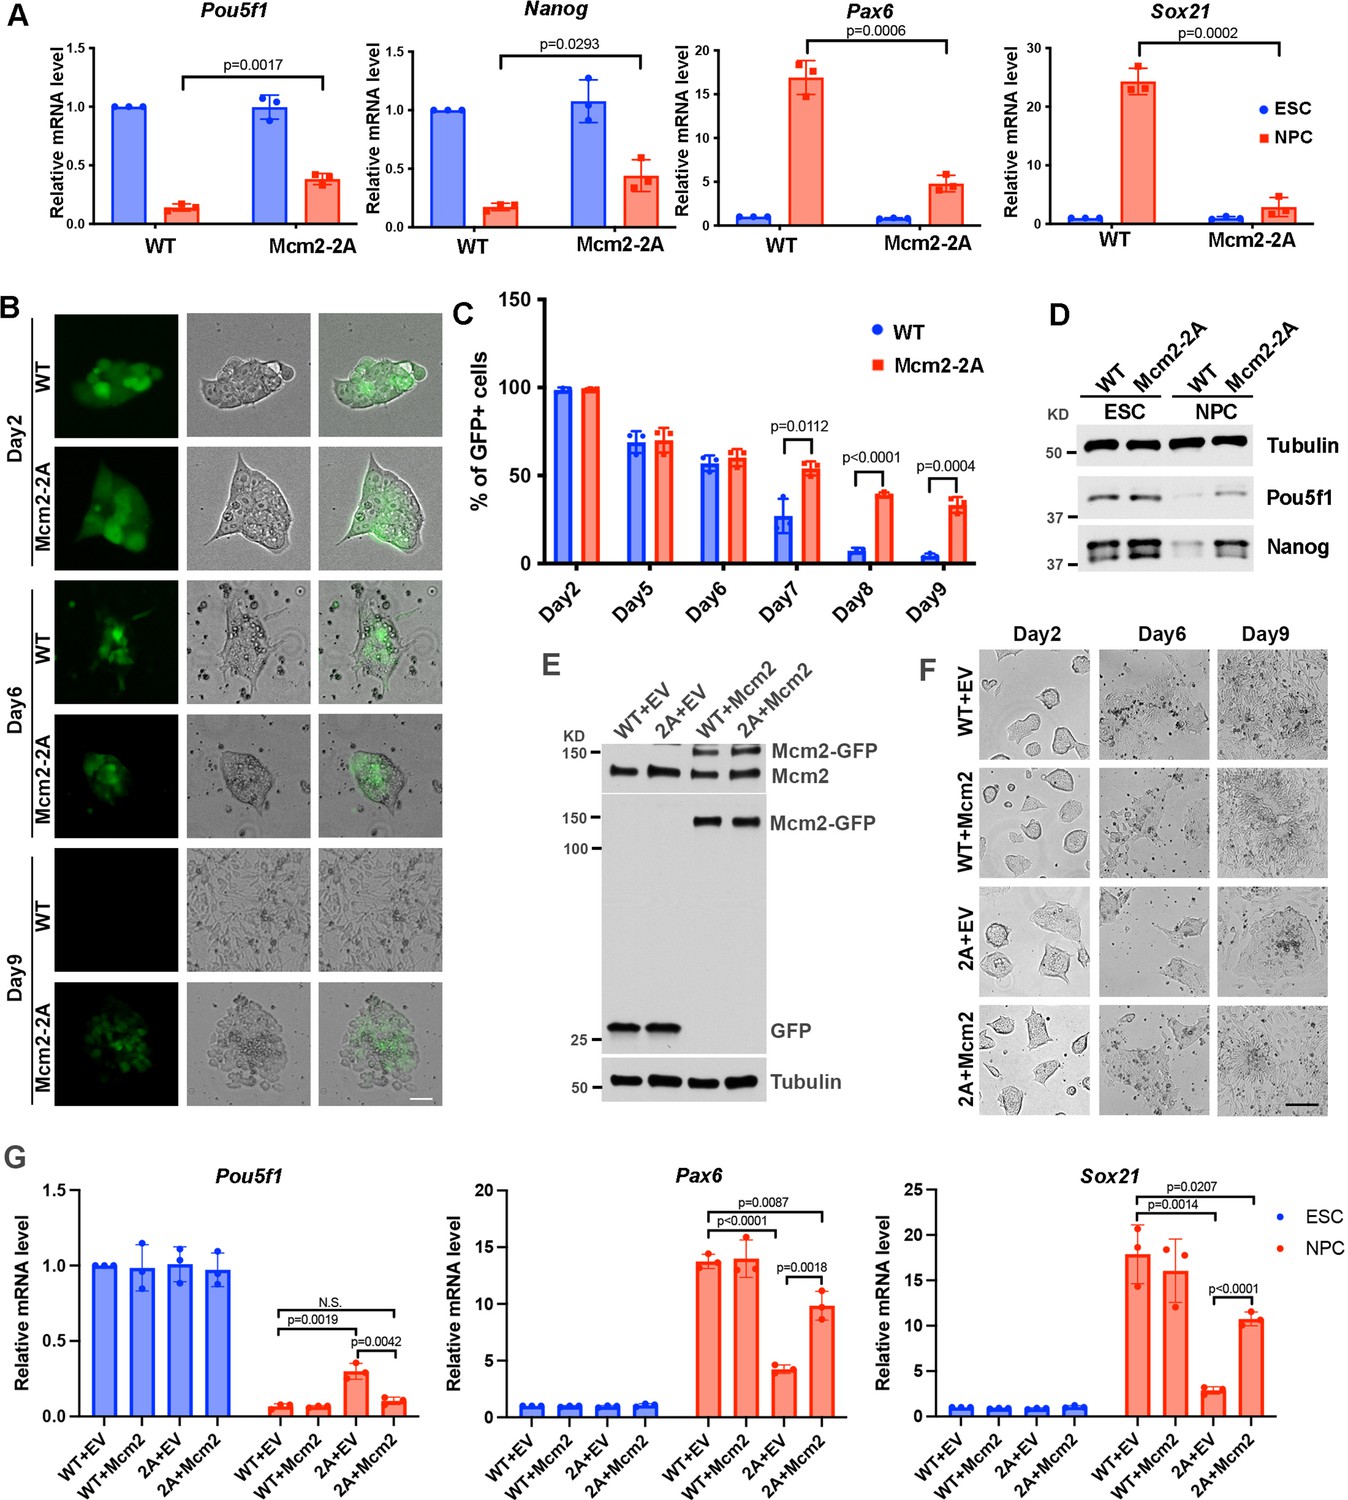
Mcm2 is required for neural differentiation of mouse embryonic stem cells (ESCs).
See also Figure 2—source data 1, Figure 2—source data 2, Figure 2—source data 3 and Figure 2—source data 4. (A) RT-PCR analysis of expression of two genes involved in pluripotency (Pou5f1, Nanog) and two neural lineage-specific genes (Pax6, Sox21) in wild type (WT) and Mcm2-2A cells during neural differentiation. GAPDH was used for normalization. Data are presented as means ± SD from three independent experiments. (B) Representative images of WT and Mcm2-2A cells during neural differentiation. The expression of EGFP is driven by the Pou5f1 distal enhancer. Scale bar: 20 µm. (C) FACS analysis of the percentage of GFP+ cells in WT and Mcm2-2A cells during neural differentiation. Data are presented as means ± SD from three independent experiments. (D) WB analysis of Pou5f1 and Nanog in WT and Mcm2-2A cells of both ESCs and neural precursor cells (NPCs). Tubulin was used as a loading control. (E) WB analysis of Mcm2-GFP expression in WT and Mcm2-2A ESCs. pWPXL empty vector (EV) was used as the control. Tubulin was used as a loading control. (F) Representative images of EV or Mcm2-GFP expressing WT and Mcm2-2A cells during neural differentiation. Scale bar: 100 µm. (G) RT-PCR analysis of expression of Pou5f1, Pax6, and Sox21 in EV or Mcm2-GFP expressing WT and Mcm2-2A cells during neural differentiation. GAPDH was used for normalization. Data are presented as means ± SD from three independent experiments. Statistical analysis in A, C, and G was performed by two-tailed unpaired Student’s t test with p values marked on the graphs.
-
Figure 2—source data 1
Relative mRNA level of pluripotency and lineage-specific genes, and Pou5f1 enhancer driven EGFP positive cells ratio during neural differentiation in wild type (WT) and Mcm2-2A cells.
- https://cdn.elifesciences.org/articles/80917/elife-80917-fig2-data1-v2.xlsx
-
Figure 2—source data 2
Whole SDS-PAGE images and uncropped blots represented in Figure 2D.
Pou5f1 and Nanog protein levels in wild type (WT) and Mcm2-2A embryonic stem cells (ESCs) and neural precursor cells (NPCs).
- https://cdn.elifesciences.org/articles/80917/elife-80917-fig2-data2-v2.zip
-
Figure 2—source data 3
Whole SDS-PAGE images and uncropped blots represented in Figure 2E.
pWPXL and pWPXL-Mcm2 expression in wild type (WT) and Mcm2-2A embryonic stem (ES) cells.
- https://cdn.elifesciences.org/articles/80917/elife-80917-fig2-data3-v2.zip
-
Figure 2—source data 4
Relative mRNA level of pluripotency and lineage-specific genes in Mcm2 rescued wild type (WT) and Mcm2-2A mutant cells.
- https://cdn.elifesciences.org/articles/80917/elife-80917-fig2-data4-v2.xlsx
Figure 2—figure supplement 1
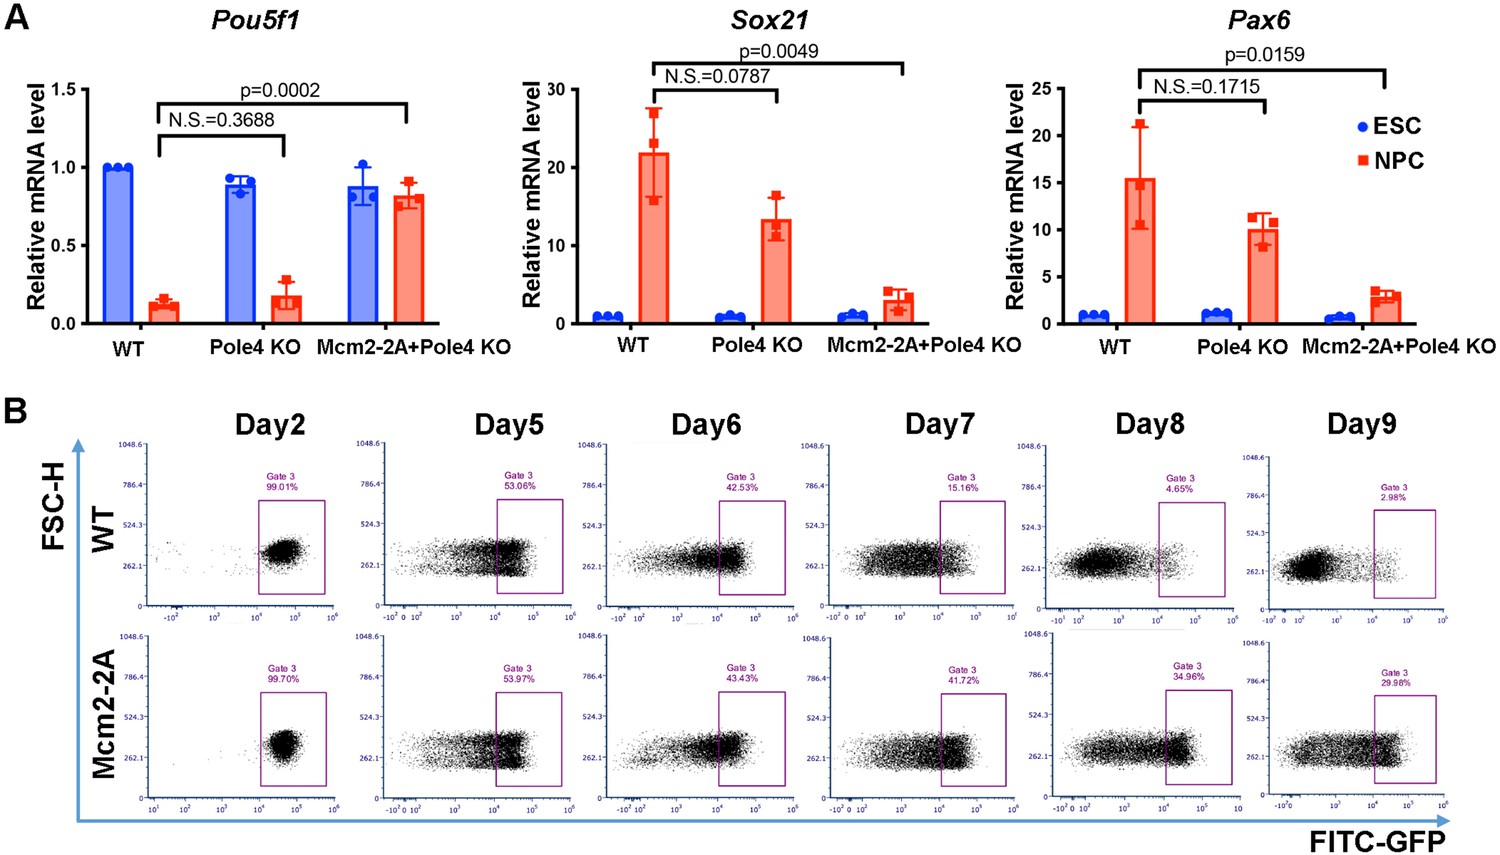
Mcm2-2A mutant prohibits neural differentiation of mouse embryonic stem (ES) cells.
See also Figure 2—figure supplement 1—source data 1. (A) RT-PCR analysis of expression of one pluripotency gene (Pou5f1) and two neural lineage-specific genes (Pax6, Sox21) in wild type (WT), Pole4 KO, and Mcm2-2A + Pole4 KO cells during neural differentiation. GAPDH was used for normalization. Data are presented as means ± SD from three independent experiments. Statistical analysis was performed by two-tailed unpaired Student’s t test with p values marked on the graphs (N.S., not significant). (B) FACS analysis of the percentage of GFP+ cells in WT and Mcm2-2A cells during neural differentiation. The expression of EGFP is driven by the Pou5f1 distal enhancer.
-
Figure 2—figure supplement 1—source data 1
Relative mRNA level of pluripotency and lineage-specific genes during neural differentiation in wild type (WT), Pole4 KO, and Mcm2-2A + Pole4 KO cells.
- https://cdn.elifesciences.org/articles/80917/elife-80917-fig2-figsupp1-data1-v2.xlsx
Figure 2—figure supplement 2
Mcm2’s function in promoting neural differentiation is partially dependent on Asf1a.
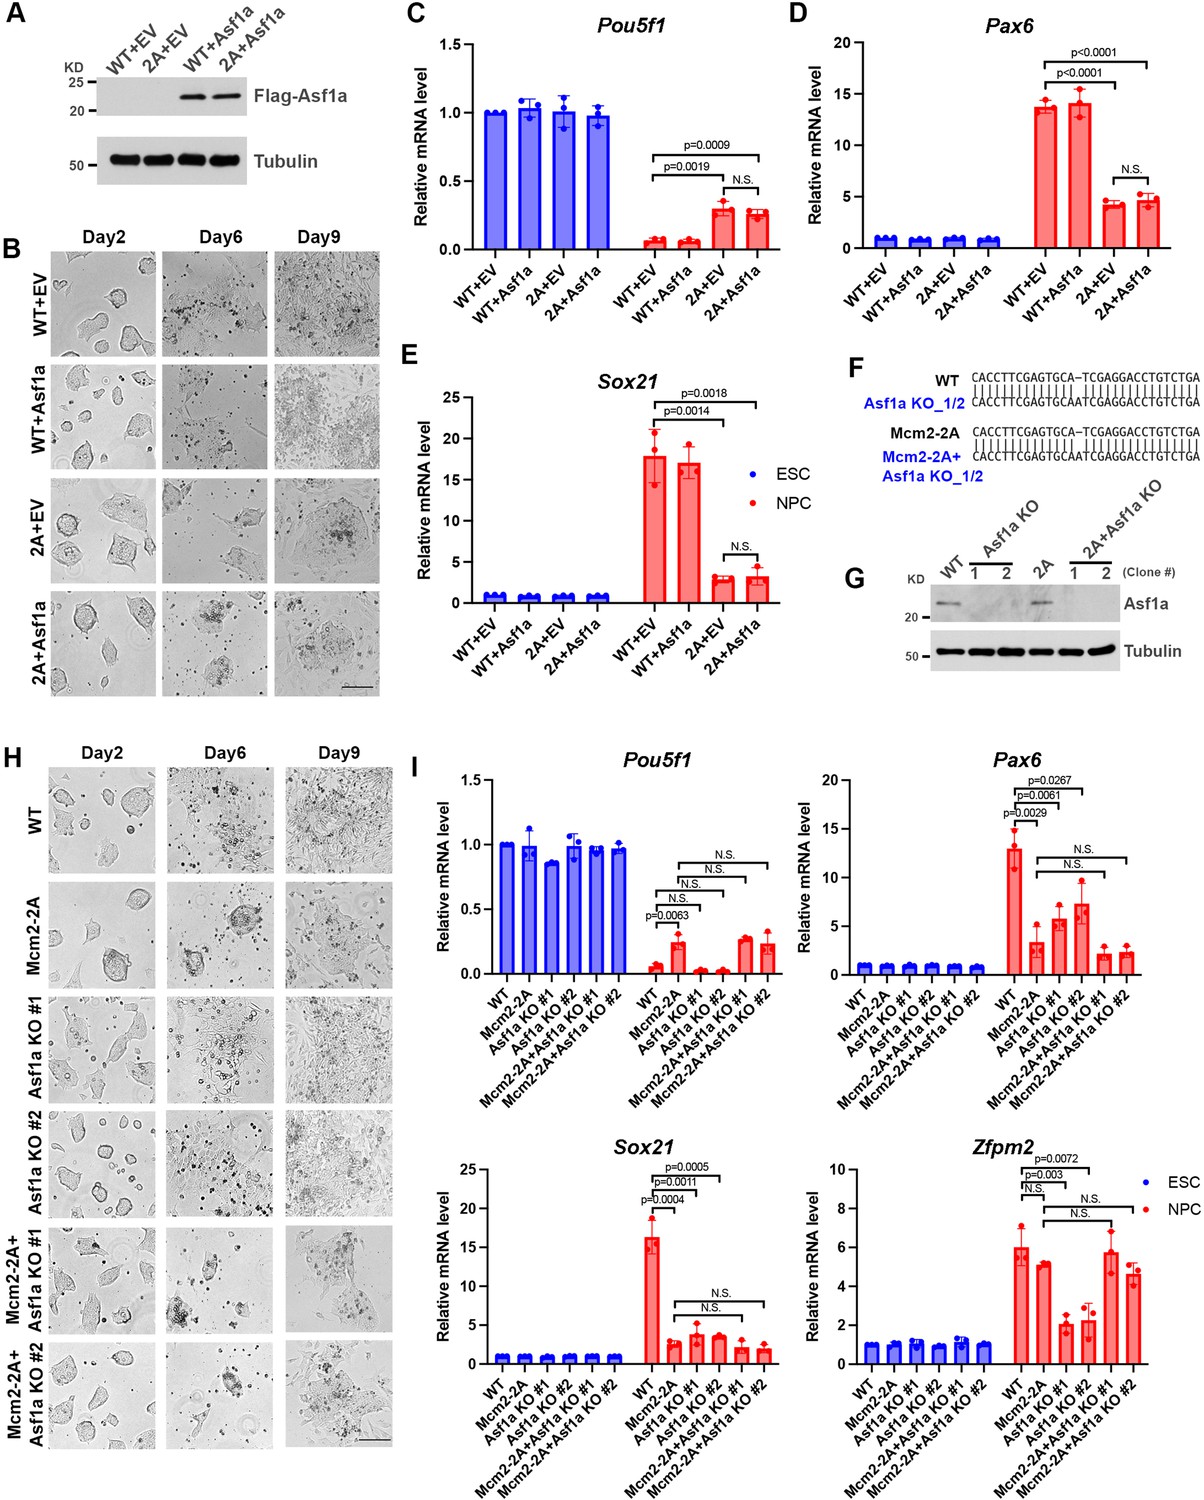
See also Figure 2—figure supplement 2—source data 1 and 2. (A) WB analysis of Flag-Asf1a expression in wild type (WT) and Mcm2-2A embryonic stem cells (ESCs). Tubulin was used as a loading control. pWPXL empty vector (EV) was used as a control. (B) Representative images of pWPXL EV or Asf1a expressing from the pWPXL vector WT and Mcm2-2A cells during neural differentiation. Scale bar: 100 µm. (C–E) RT-PCR analysis of expression of Pou5f1, Pax6, and Sox21 in EV or Asf1a expressing WT and Mcm2-2A cells during neural differentiation. GAPDH was used for normalization. Data are presented as means ± SD from three independent experiments. (F) Sanger sequencing results of two different Asf1a KO or Mcm2-2A Asf1a KO clones showing frame-shift insertion at Asf1a loci. (G) WB analysis of Asf1a expression in two independent Asf1a KO or Mcm2-2A Asf1a KO ES cell clones. Tubulin was used as a loading control. (H) Representative images of WT, Asf1a KO, Mcm2-2A, and Mcm2-2A Asf1a KO cells during neural differentiation. Scale bar: 100 µm. (I) RT-PCR analysis of expression of Pou5f1, Pax6, Sox21, and Zfpm2 in WT, Asf1a KO, Mcm2-2A, and Mcm2-2A Asf1a KO cells during neural differentiation. GAPDH was used for normalization. Data are presented as means ± SD from three independent experiments. Statistical analysis in C–E and I was performed by two-tailed unpaired Student’s t test with p values marked on the graphs.
-
Figure 2—figure supplement 2—source data 1
Whole SDS-PAGE images and uncropped blots represented in Figure 2—figure supplement 2A and G.
pWPXL-Asf1a expression and Asf1a KO detection in wild type (WT) and Mcm2-2A embryonic stem (ES) cells.
- https://cdn.elifesciences.org/articles/80917/elife-80917-fig2-figsupp2-data1-v2.zip
-
Figure 2—figure supplement 2—source data 2
Relative mRNA level of pluripotency and lineage-specific genes during neural differentiation in Asf1a rescued or Asf1a KO cells.
- https://cdn.elifesciences.org/articles/80917/elife-80917-fig2-figsupp2-data2-v2.xlsx
Figure 3 with 1 supplement
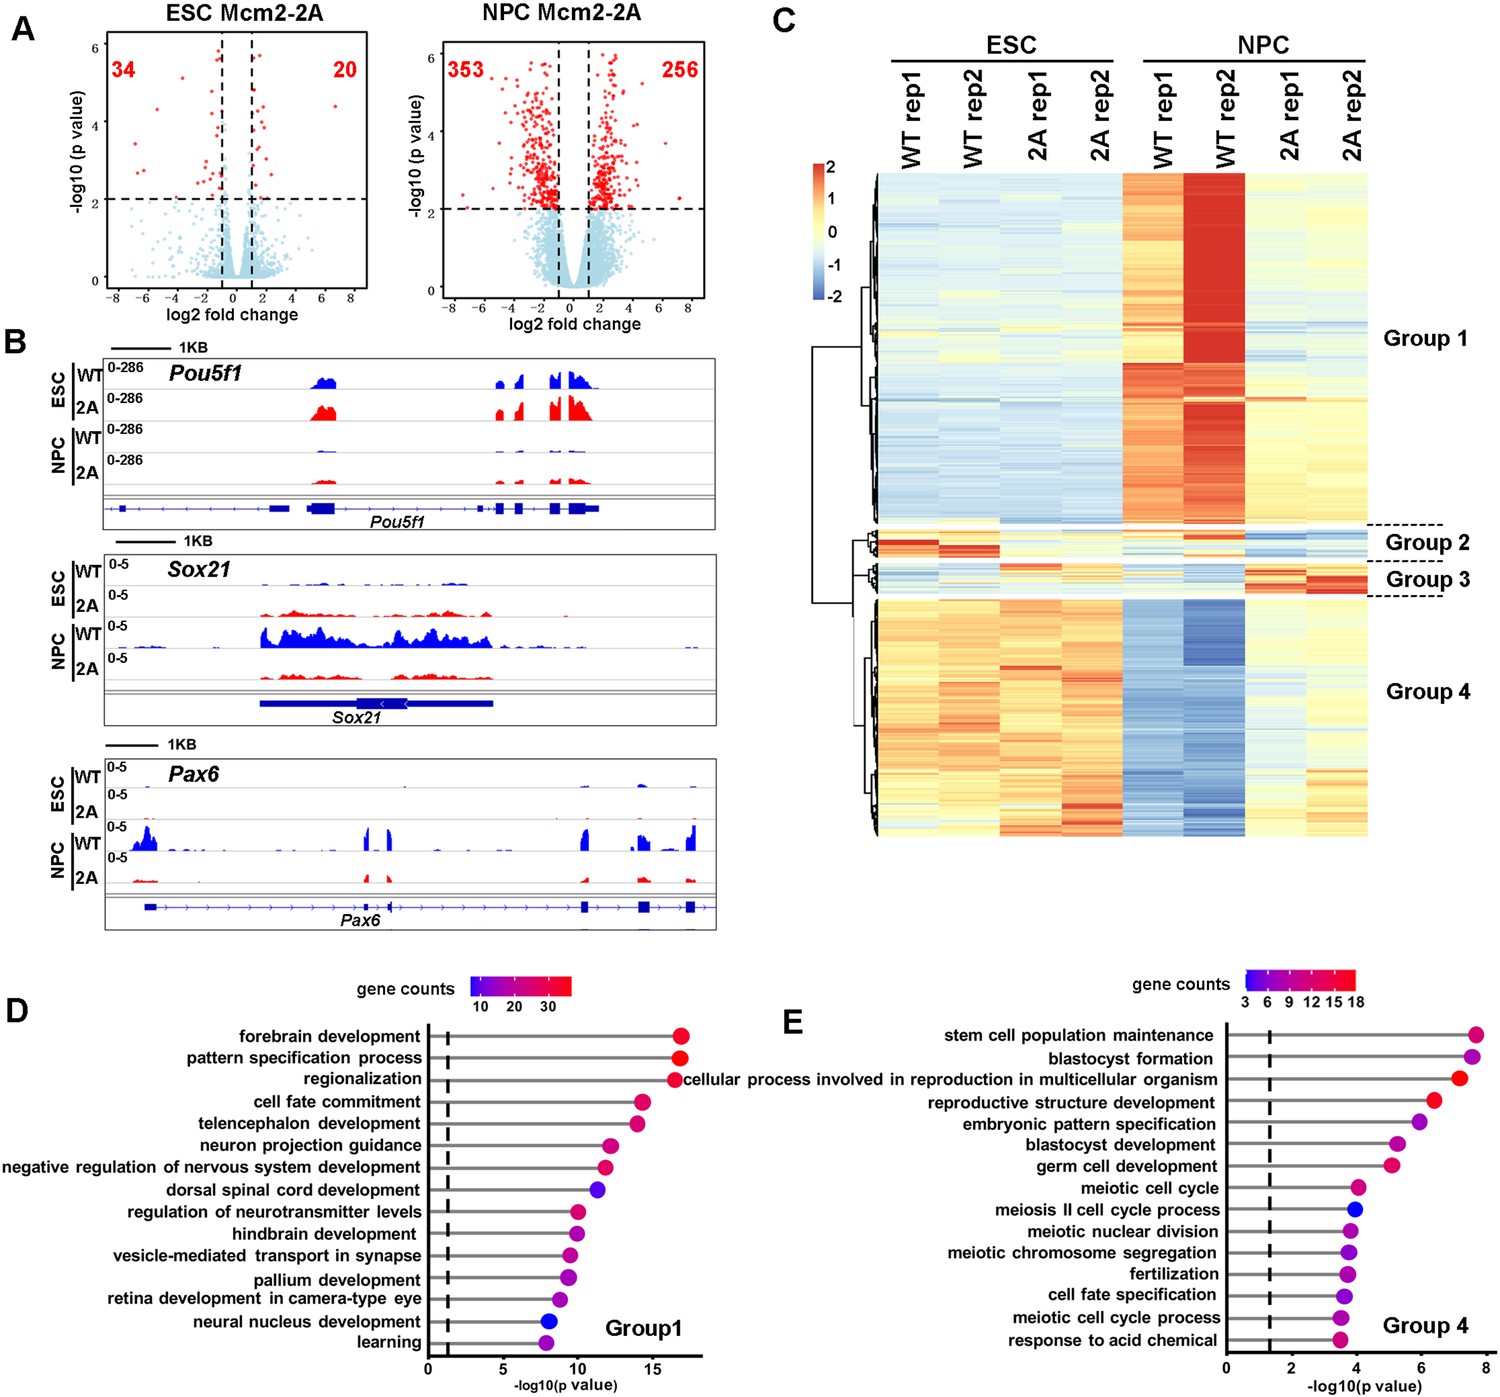
Effects of Mcm2-2A mutation on gene transcription in embryonic stem (ES) cells and in neural precursor cells (NPCs).
(A) Volcano plot of differentially expressed genes (DEGs) between wild type and Mcm2-2A mutant ES cells (left) and NPCs (right) from two independent replicates, with numbers of significantly up-regulated and down-regulated genes (red dots, p<0.01, |log2 fold change|>1) shown. (B) RNA sequencing (RNA-seq) tracks showing the sequence read density at Pou5f1, Sox21, and Pax6 locus in wild type (WT) and Mcm2-2A ES cells and NPCs. (C) The hierarchical clustering analysis of the DEGs between WT and Mcm2-2A cells. RNA expression values (RPKM, reads per kilobase per million reads) are represented by z-score across samples. (D and E) Gene ontology (GO) analysis of the group 1 and group 4 genes in (C) with the top 15 significant GO terms and p value displayed.
Figure 3—figure supplement 1
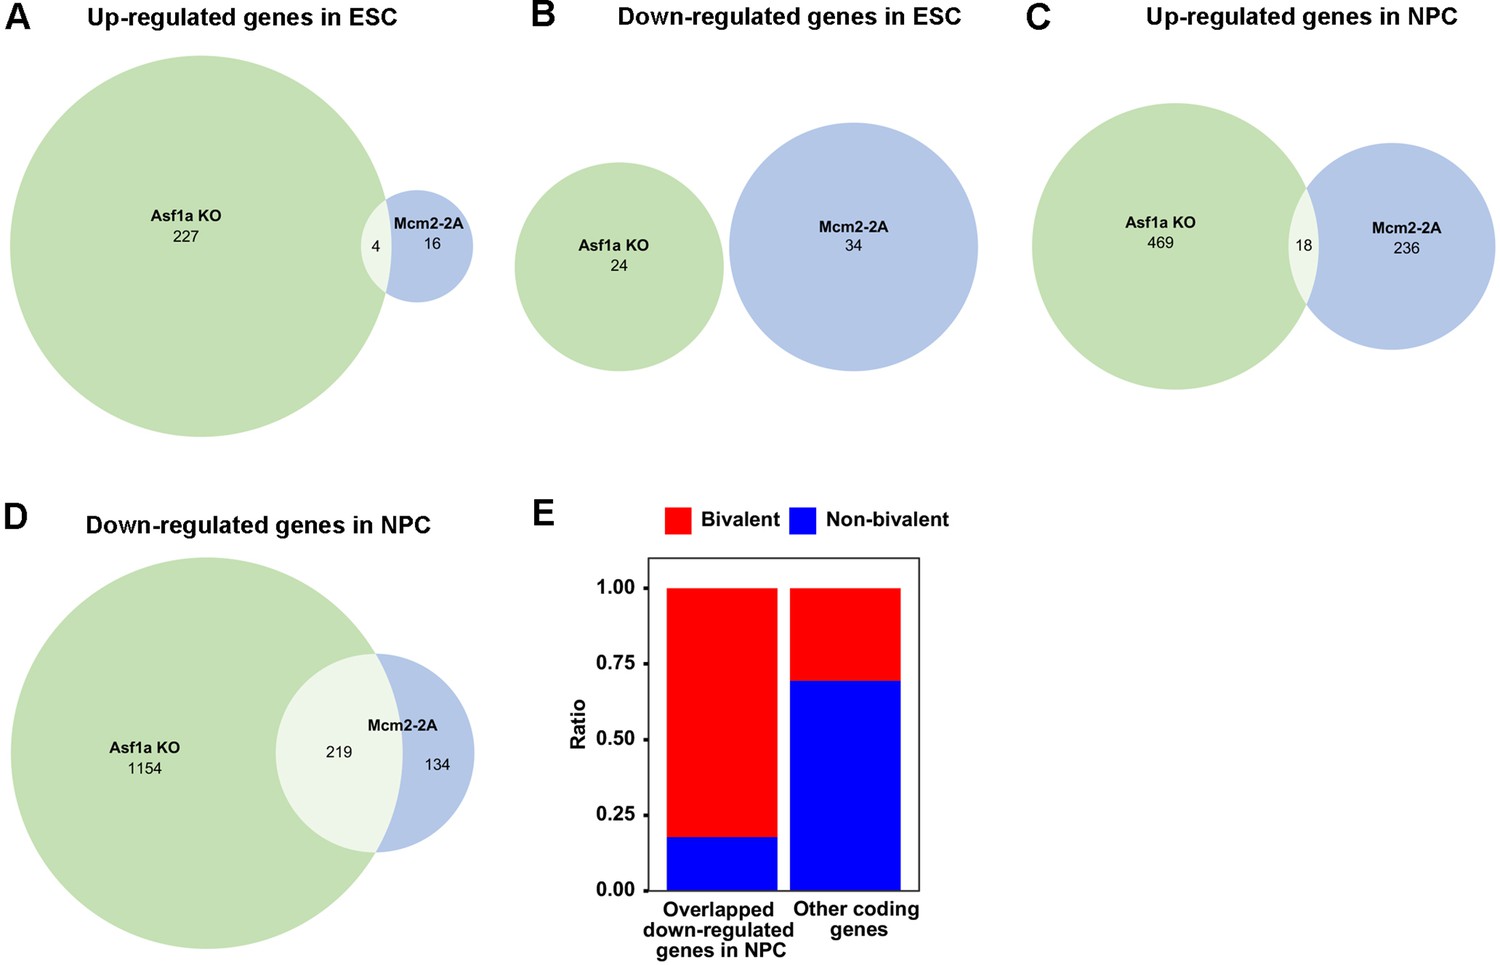
Mcm2 and Asf1a function in the same pathway for the induction of lineage-specific genes.
(A) The overlap of genes up-regulated in Mcm2-2A and Asf1a KO mutant embryonic stem (ES) cells. (B) The overlap of genes down-regulated in Mcm2-2A and Asf1a KO mutant ES cells. (C) The overlap of genes up-regulated in Mcm2-2A and Asf1a KO mutant neural precursor cells (NPCs). (D) The overlap of genes down-regulated in Mcm2-2A NPCs and Asf1a KO mutant NPCs. (E) Ratio-wise distribution of bivalent genes and non-bivalent genes among the group of overlapped down-regulated genes shown in (D) or the group of rest coding genes. Fisher test p<2.2e-16, odds ratio = 10.46256. (A–D) The numbers of significantly up-regulated and down-regulated genes (p<0.01, |log2 fold change|>1) were shown.
Figure 4 with 1 supplement
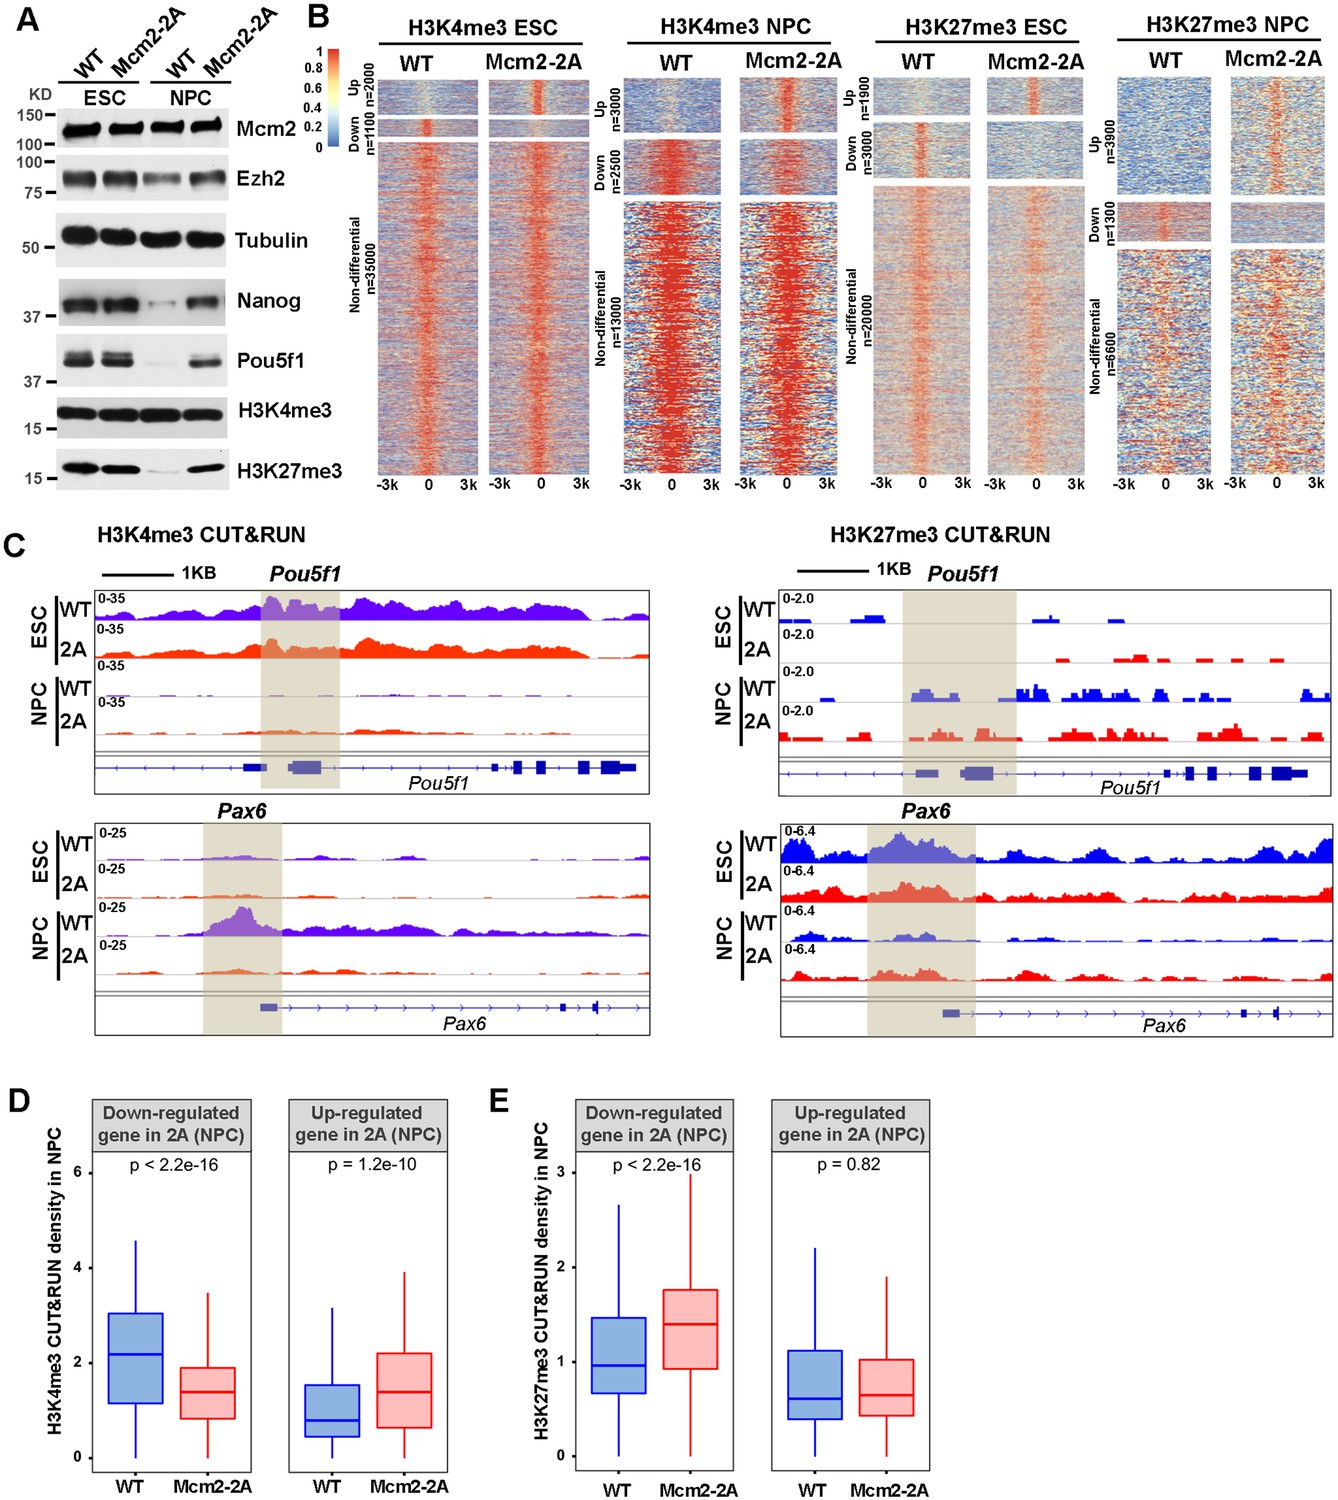
Mcm2 mutant affects dynamic changes in H3K4me3 and H3K27me3 during differentiation.
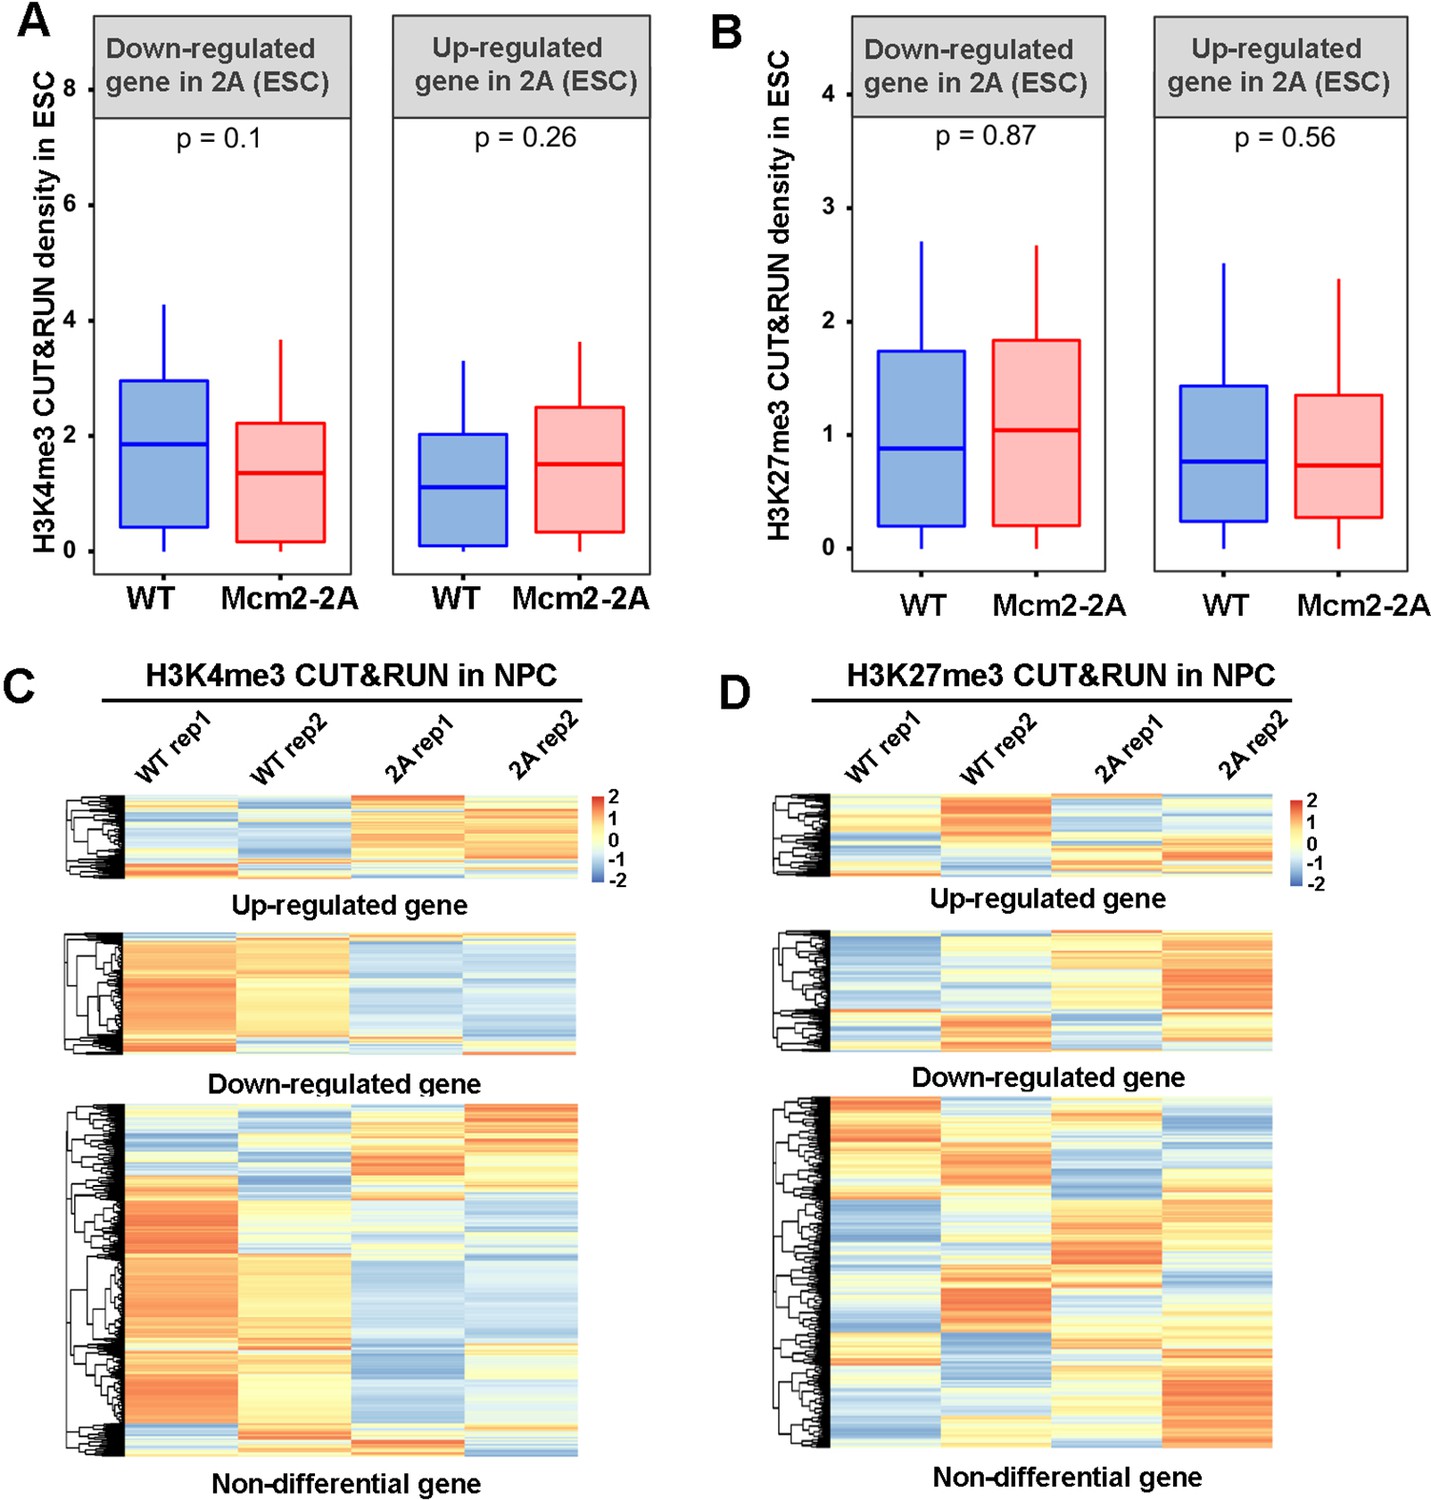
See also Figure 4—source data 1. (A) WB analysis of Mcm2, Ezh2, Nanog, Pou5f1, H3K4me3, and H3K27me3 expression in wild type (WT) and Mcm2-2A cells of both embryonic stem (ES) cells and neural precursor cells (NPCs). Tubulin was used as loading control. (B) Heatmaps surrounding CUT&RUN peaks of H3K4me3 and H3K27me3 [–3k, 3k] in WT and Mcm2-2A ES cells and NPCs. n: peak number. Color scale represents reads per million. (C) H3K4me3 and H3K27me3 CUT&RUN sequencing density surrounding Pou5f1 and Pax6 loci in WT and Mcm2-2A ES cells and NPCs. Shadows indicate CUT&RUN peak signals around the transcription starting site (TSS). (D and E) Average of H3K4me3 (D) and H3K27me3 (E) CUT&RUN density in WT and Mcm2-2A NPCs at the promoters ([–3k, 3k] of TSS) of down-regulated and up-regulated genes in Mcm2-2A NPCs (Figure 3A, right). The Y-axis represents the log2 ratio of CUT&RUN density (reads per kilobase per million reads [RPKM]). The p values were calculated using Wilcoxon signed-rank test. The average of two independent replicates is shown.
-
Figure 4—source data 1
Whole SDS-PAGE images and uncropped blots represented in Figure 4A.
H3K4me3, H3K27me3, Ezh2, Mcm2, Pou5f1, and Nanog protein levels in wild type (WT) and Mcm2-2A embryonic stem cells (ESCs) and neural precursor cells (NPCs).
- https://cdn.elifesciences.org/articles/80917/elife-80917-fig4-data1-v2.zip
Figure 4—figure supplement 1
Effects of Mcm2-2A mutation on H3K4me3 and H3K27me3 distribution during neural differentiation.
(A and B) Average of H3K4me3 (A) and H3K27me3 (B) CUT&RUN density in wild type (WT) and Mcm2-2A embryonic stem (ES) cells at the promoters ([–3k, 3k] around transcription starting site [TSS]) of down-regulated and up-regulated genes in Mcm2-2A ES cells compared to WT ES cells (Figure 3A, left). The Y-axis represents the log2 ratio of CUT&RUN density (reads per kilobase per million reads [RPKM]). The p values were calculated using Wilcoxon signed-rank test from two independent replicates. (C and D) Heatmap of H3K4me3 (C) and H3K27me3 (D) CUT&RUN density at the promoters ([–3k, 3k] around TSS) of up-regulated, down-regulated, and non-differential genes in Mcm2-2A neural precursor cells (NPCs) (Figure 3A, right). Two independent replicates were shown for each cell line. The CUT&RUN density (RPM, reads per million) are z-scored across samples.
Figure 5 with 1 supplement
Mcm2 chromatin localization largely depends on its ability to bind H3-H4.
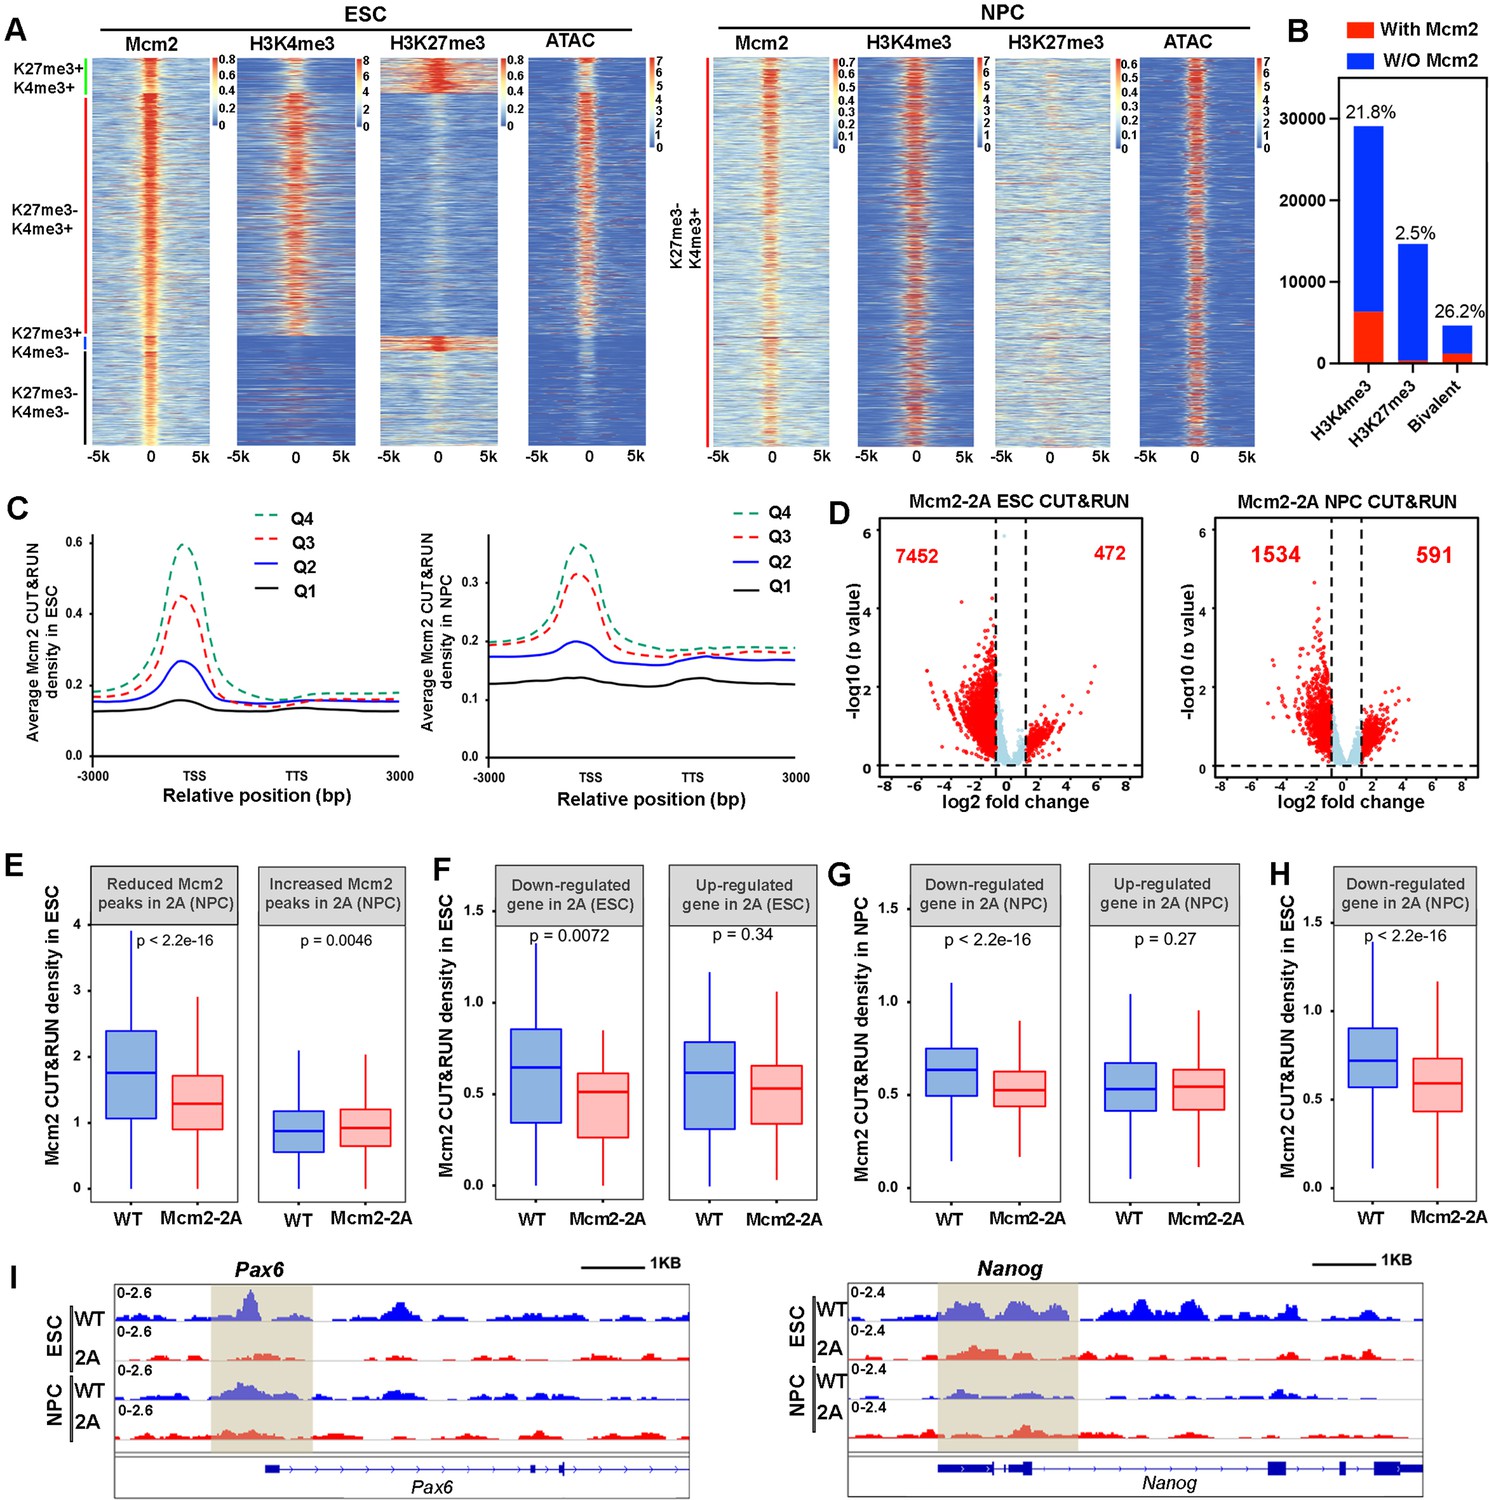
(A) Representative heatmaps of Mcm2, H3K4me3, H3K27me3 CUT&RUN, and ATAC-seq peaks in wild type (WT) embryonic stem (ES) cells (left) and neural precursor cells (NPCs) (right). The density of H3K4me3 and H3K27me3 CUT&RUN and ATAC-seq surrounding Mcm2 CUT&RUN peaks [–5k, 5k] was calculated. Color scales represent reads per million. (B) Peak distribution of H3K4me3, H3K27me3, and bivalent domains based on their co-localization with Mcm2 peaks. The percentile of ‘with Mcm2 peaks’ for each marker were labeled on top. Y-axis represents the peak number. (C) Density profiles of Mcm2 CUT&RUN (RPM, reads per million) surrounding transcription starting sites (TSS) and transcription termination sites (TTS). Genes were separated into four groups based on their expression in mouse ES cells or NPCs (Q1=lowest quartile, Q4=highest quartile). (D) Volcano plot of differential Mcm2 protein CUT&RUN peaks between WT Mcm2 and Mcm2-2A ES cells (left) and NPCs (right) from two independent replicates, with the total number of significantly up-regulated and down-regulated peaks (|log2 fold change|>1) shown. (E) Mcm2 CUT&RUN density in WT and Mcm2-2A ES cells at the reduced and increased Mcm2 CUT&RUN peaks in Mcm2-2A NPCs identified in D. (F) Mcm2 CUT&RUN density in WT and Mcm2-2A ES cells at the promoters ([–3k, 3k] of TSS) of down-regulated and up-regulated genes in Mcm2-2A mutant ESCs (ES cells) identified in Figure 3A, left. (G) Mcm2 CUT&RUN density in WT and Mcm2-2A NPCs at the promoters ([–3k, 3k] of TSS) of down-regulated and up-regulated genes in Mcm2-2A mutant NPCs (Figure 3A, right). (H) Mcm2 CUT&RUN density in WT and Mcm2-2A ES cells at the promoters ([–3k, 3k] of TSS) of down-regulated genes in Mcm2-2A mutant NPCs (Figure 3A, right). (E–H) The Y-axis represents the log2 ratio of CUT&RUN density (reads per kilobase per million reads [RPKM]), with p values calculated using Wilcoxon signed-rank test from two independent replicates. (I) Snapshots displaying Mcm2 CUT&RUN density at Pou5f1 and Pax6 loci of WT and Mcm2-2A ES cells and NPCs. One representative result from two independent replicates is shown. Shadows indicate CUT&RUN signals around the TSS.
Figure 5—figure supplement 1
Mcm2-2A mutation decreases Mcm2 binding at chromatin.
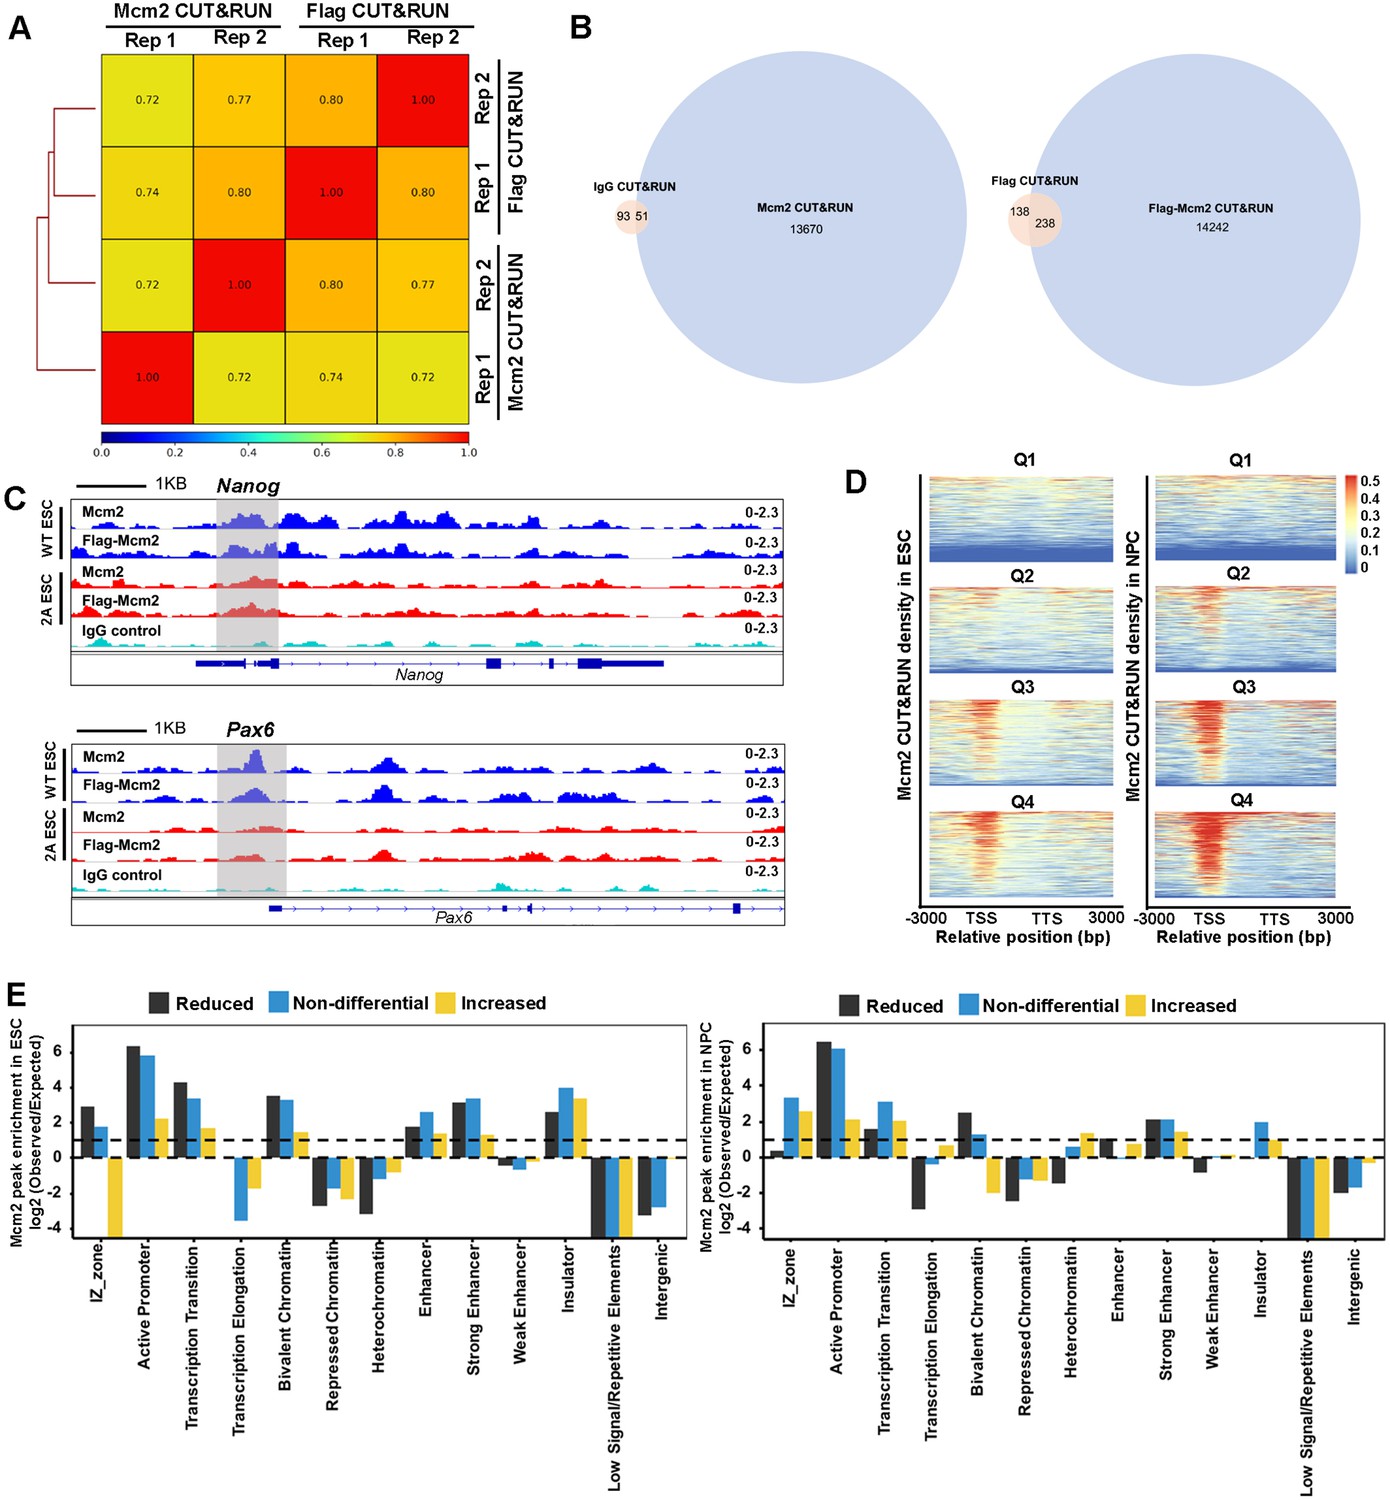
(A) Genome-wide correlations of Mcm2 CUT&RUN datasets generated using antibodies against the Flag epitope fused to Mcm2 or Mcm2-2A or antibodies against Mcm2, each with two independent repeats using a 5 kb sliding window. (B) The overlap of peaks between IgG/Flag CUT&RUN and Mcm2/Flag-Mcm2 CUT&RUN. p=0.0001 was set as cutoff for peak calling. (C) Snapshots displaying IgG CUT&RUN, Flag-Mcm2 CUT&RUN, and Mcm2 CUT&RUN density at Pou5f1 and Pax6 loci of Flag-Mcm2 tagged wild type (WT) and Mcm2-2A embryonic stem (ES) cells. One representative result from two independent replicates was shown. Shadows indicate CUT&RUN signals around the transcription starting site (TSS). (D) Representative heatmaps of Mcm2 CUT&RUN (RPM, reads per million) density surrounding TSS and transcription termination sites (TTS) from highly expressed to lowly expressed genes in WT and Mcm2-2A ES cells (left) and neural precursor cells (NPCs) (right). Genes were separated into four groups based on their expression in mouse ES cells (Q1=lowest quartile, Q4=highest quartile). Color scale represents reads per million. (E) Relative enrichment of increased, reduced and non-differential peaks of Mcm2-2A in ES cells (left) and NPCs (right) at different genomic annotations. The Y-axis represents the log2 ratio of the Mcm2 enrichment after normalized to expected ratio of each genomic annotation. Reduced peaks are enriched at active promoters, strong enhancers, and bivalent chromatin domains.
Figure 6 with 2 supplements
Mcm2 facilitates chromatin accessibility during mouse embryonic stem (ES) cell differentiation.
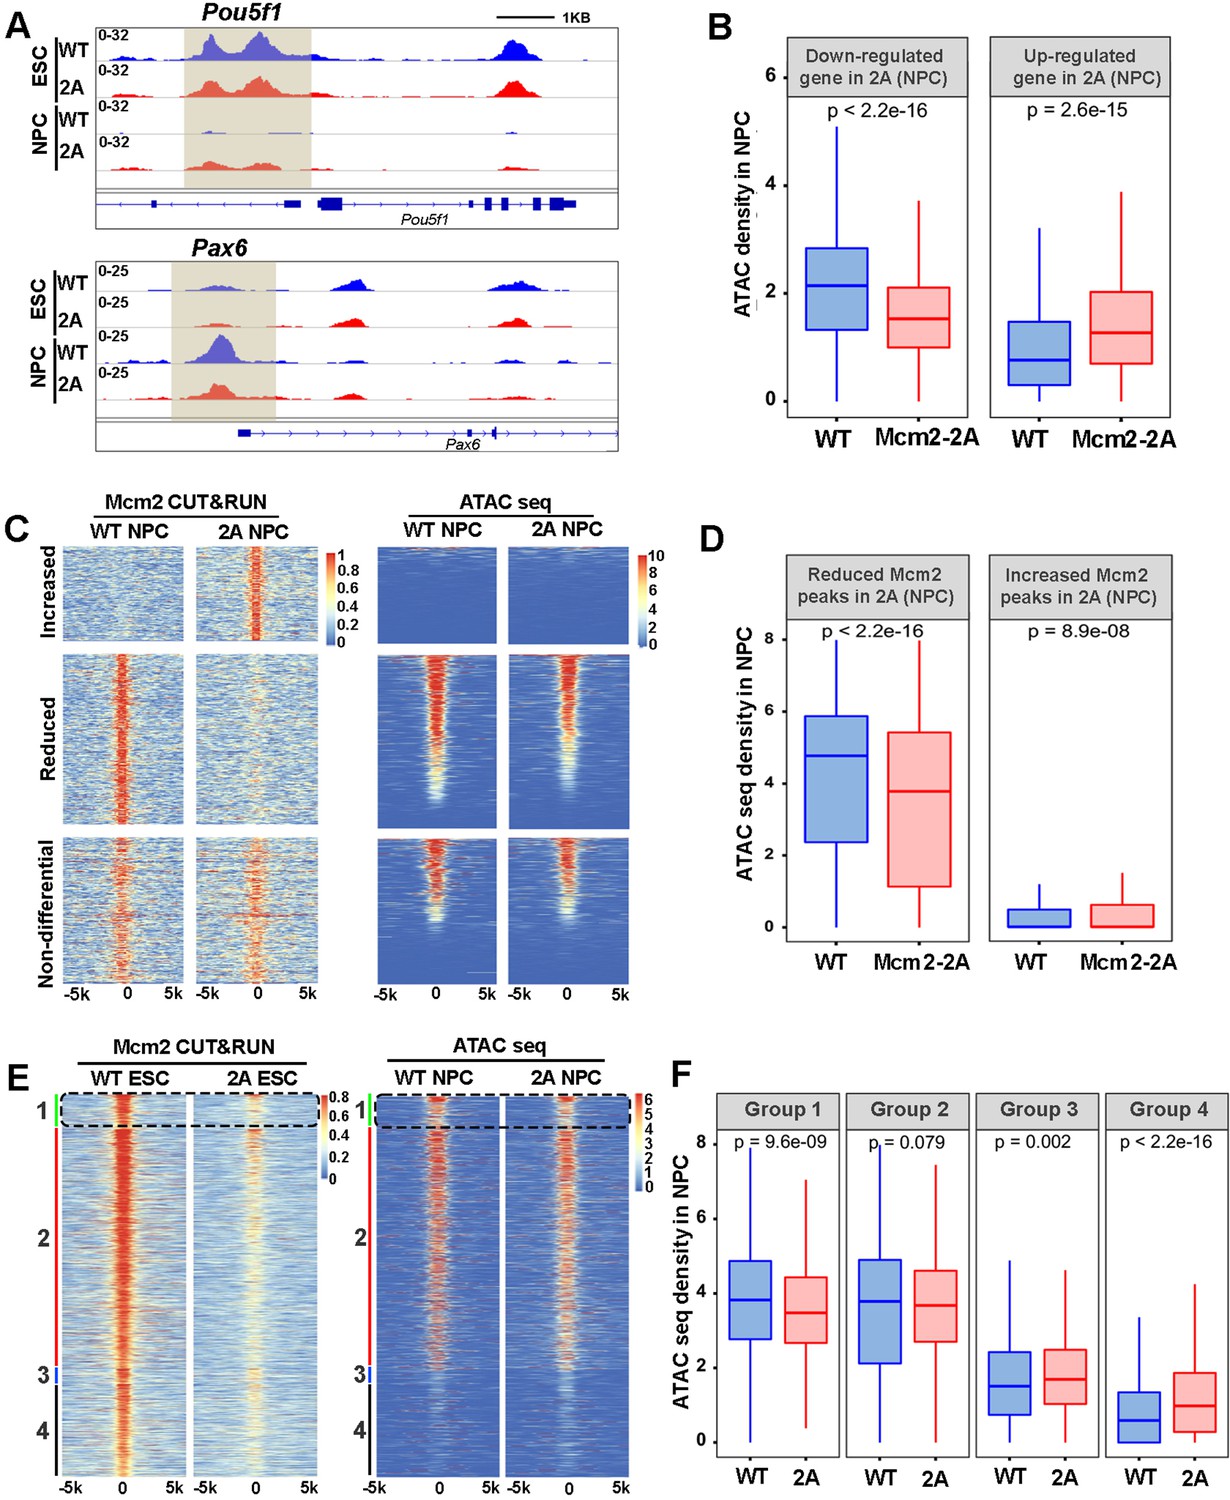
(A) ATAC-seq tracks displaying ATAC-seq density at the Pou5f1 and Pax6 loci in wild type (WT) and Mcm2-2A ES cells and neural precursor cells (NPCs). Shadows indicate CUT&RUN signals around the transcription starting site (TSS). (B) ATAC-seq density in wild type (WT) and Mcm2-2A NPCs at the promoters ([–3k, 3k] of TSS) of down-regulated and up-regulated genes in Mcm2-2A NPCs (Figure 3A, right). (C) Heatmap of ATAC-seq density (right) surrounding Mcm2 CUT&RUN peaks (left, |log2 fold change|>1) in WT and Mcm2-2A NPCs. One representative result from two independent replicates is shown. Color scales represent reads per million. (D) The average of ATAC-seq density in WT and Mcm2-2A NPCs at the reduced and increased Mcm2 CUT&RUN peaks in Mcm2-2A NPCs shown in C. (E) Representative heatmap of ATAC-seq peaks in WT and Mcm2-2A NPCs at four groups of Mcm2 peaks identified in WT ES cells (Figure 5A) based on their co-localization with H3K27me3 and H3K4me3: Group 1: H3K4me3+ and H3K27me3+ (bivalent domain); Group 2: H3K4me3+ and H3K27me3- (active promoters); Group 3: H3K4me3- and H3K27me3+ (repressive promoters); and Group 4: H3K4me3- and H3K27me3-. Color scales represent reads per million. (F) Average ATAC-seq density in WT and Mcm2-2A NPCs at each of the four groups shown in E. (B, D, and F) The Y-axis represents the log2 ratio of ATAC-seq density (reads per kilobase per million reads [RPKM]). The p values were calculated using Wilcoxon signed-rank test. The average of two independent replicates is shown.
Figure 6—figure supplement 1
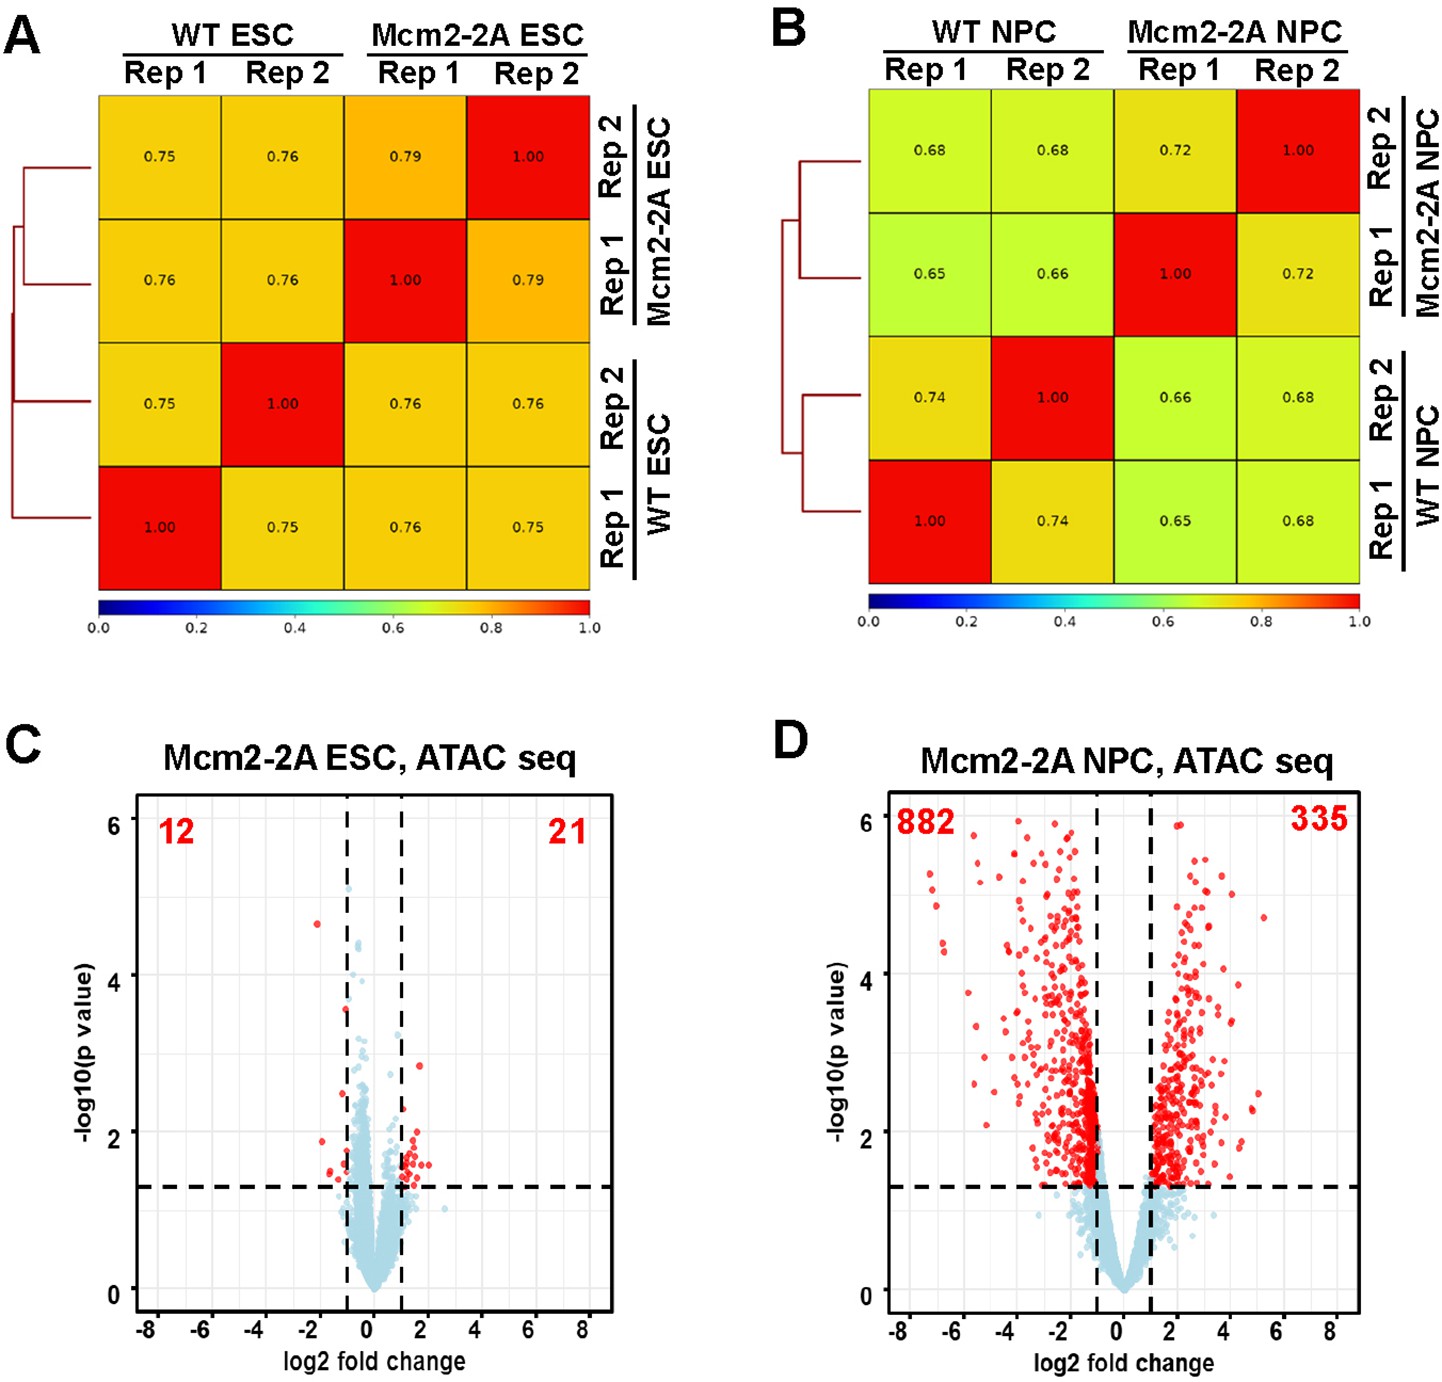
Chromatin accessibility landscape is altered in Mcm2-2A neural precursor cells (NPCs) compared to wild type (WT) NPCs.
(A and B) Genome-wide correlation of ATAC-seq density in WT and Mcm2-2A mutant embryonic stem (ES) cells (A) and NPCs (B) using a 5 kb window. Two independent replicates were shown for each cell line. (C and D) Volcano plot of differential ATAC-seq peaks between WT and Mcm2-2A mutant ES cells (C) and NPCs (D), with the number of significantly up-regulated and down-regulated peaks (p<0.05, |log2 fold change|>1) from two independent replicates shown.
Figure 6—figure supplement 2
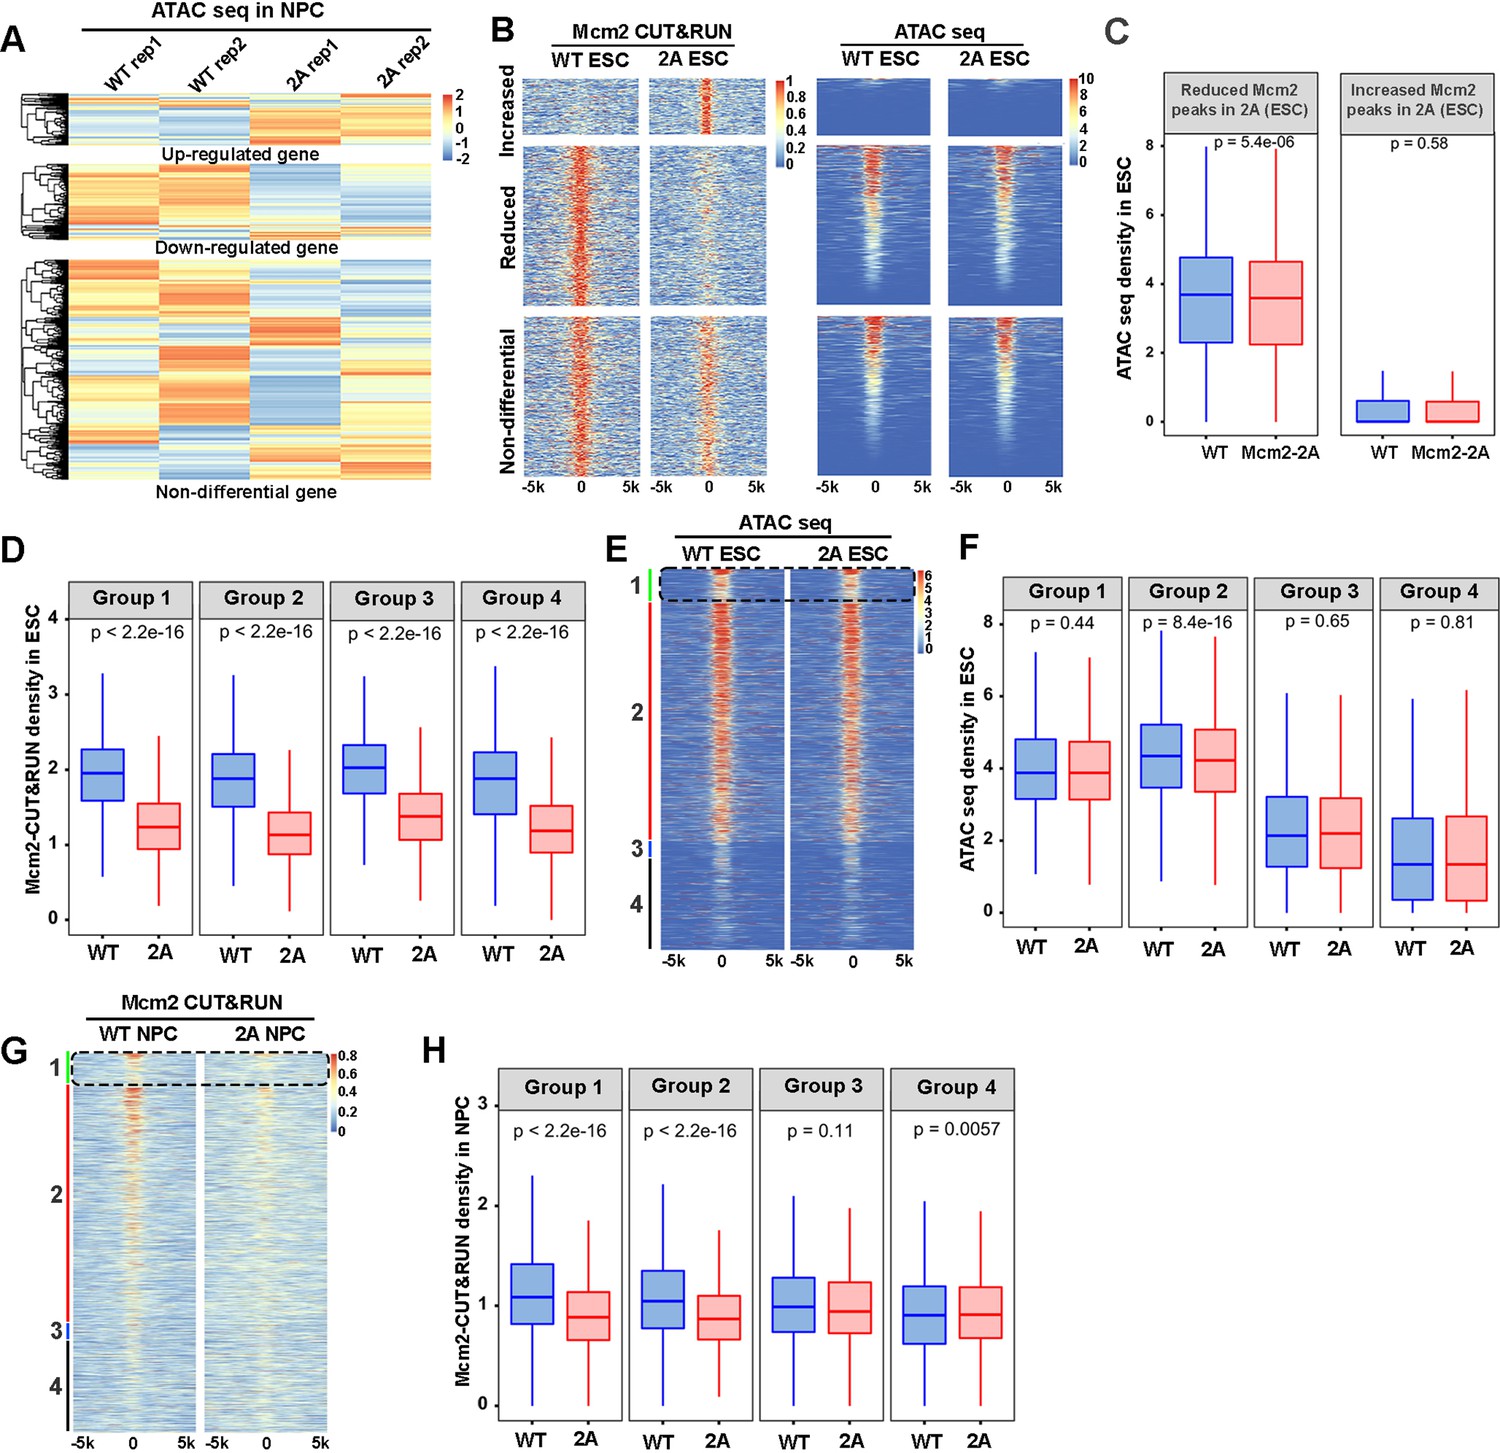
Relationships between the impact of Mcm2-2A mutation on Mcm2 binding and chromatin accessibility.
(A) Heatmap of ATAC-seq density at the promoters ([–3k, 3k] around transcription starting site [TSS]) of up-regulated, down-regulated, and non-differential genes in Mcm2-2A neural precursor cells (NPCs) (Figure 3A, right). Two independent replicates were shown for each cell line. The ATAC-seq density (RPM, reads per million) are z-scored across samples. (B) Representative heatmap of ATAC-seq density (left) surrounding Mcm2 CUT&RUN peaks (right, |log2 fold change|>1) in wild type (WT) and Mcm2-2A embryonic stem (ES) cells. One representative result from two independent replicates was shown. Color scales represent reads per million. (C) Average ATAC-seq density in WT and Mcm2-2A ES cells at the reduced and increased Mcm2 CUT&RUN peaks in Mcm2-2A ES cells shown in B. (D) Average Mcm2 CUT&RUN density in WT and Mcm2-2A ES cells at each of the four groups of Mcm2 peaks classified in ES cells shown in main Figure 5A. (E) Representative heatmap of ATAC-seq peaks in WT and Mcm2-2A ES cells at four groups of Mcm2 peaks classified in Figure 5A. Color scale represents reads per million. (F) Average ATAC-seq density in WT and Mcm2-2A ES cells at each of the four groups of Mcm2 peaks classified in Figure 5A. (G) Representative heatmap of Mcm2 CUT&RUN peaks in WT and Mcm2-2A NPCs at four groups of Mcm2 peaks classified in Figure 5A. Color scale represents reads per million. (H) Average Mcm2 CUT&RUN density in WT and Mcm2-2A NPCs at each of the four groups of Mcm2 peaks classified in Figure 5A. (C, D, F, and H) The Y-axis represents the log2 ratio of ATAC-seq density (C and F, reads per kilobase per million reads [RPKM]) or Mcm2 CUT&RUN density (D and H, RPKM). The p values were calculated using Wilcoxon signed-rank test. The average of two independent replicates is shown.
Author response image 1
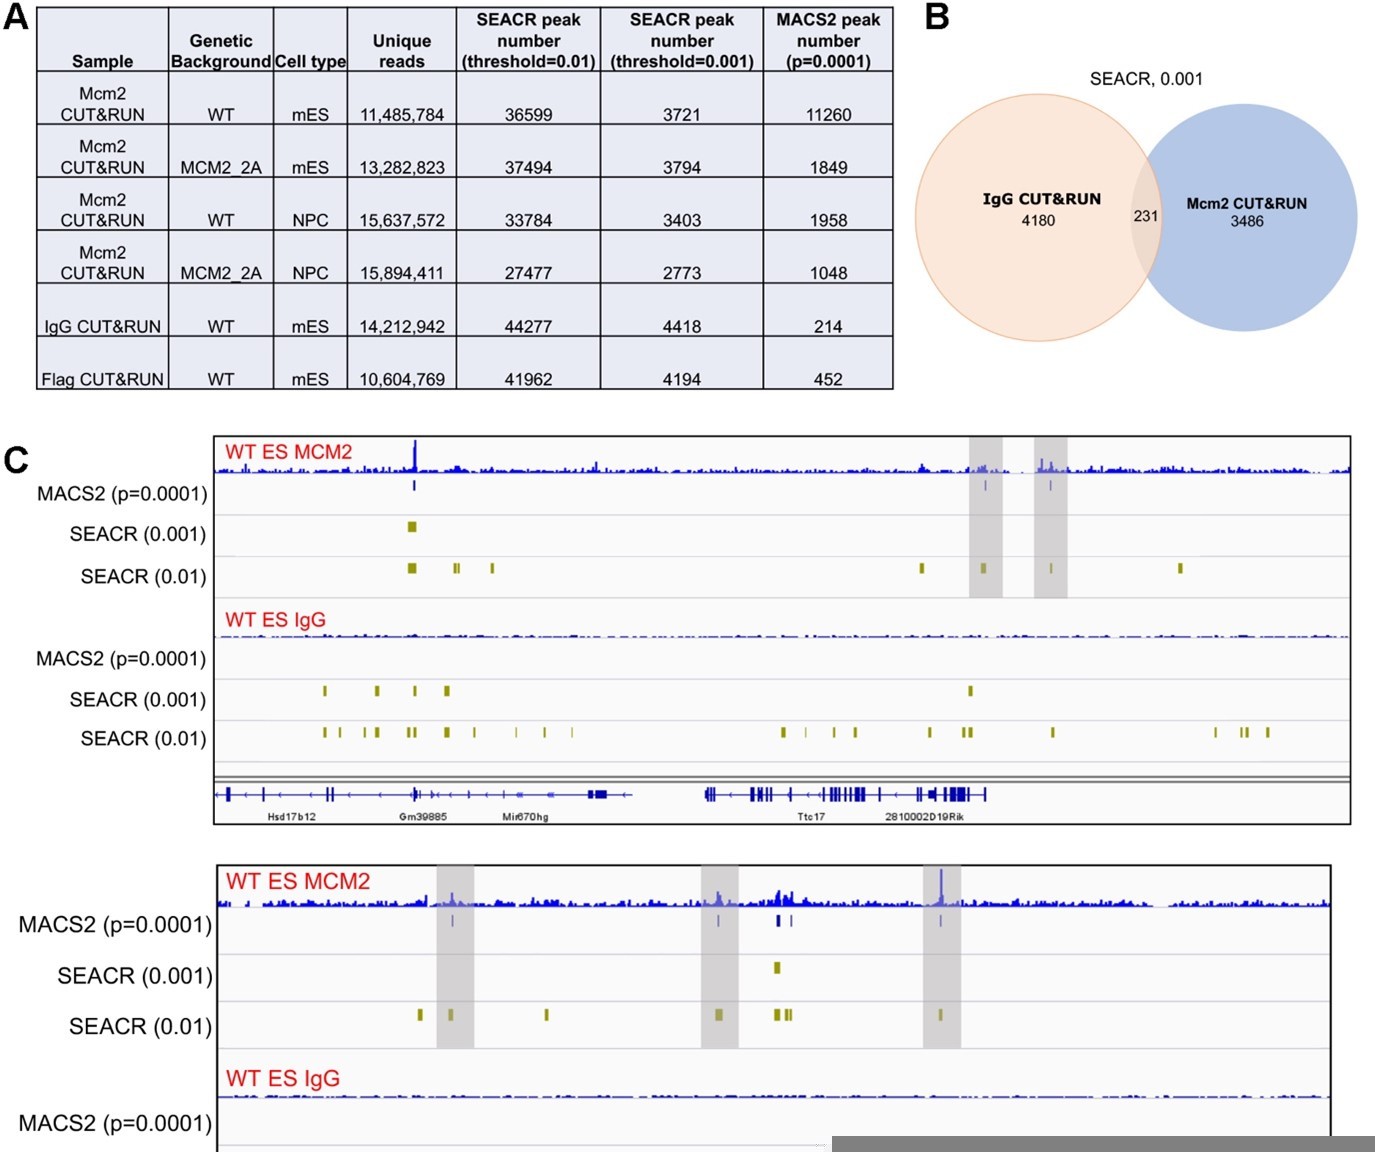
Comparison of peaks identified by two different programs, SEACR and MACS2.
(A) A table displaying CUT&RUN peak numbers using either SEACR or MACS2 peak calling methods with numeric threshold indicated for each method. (B) The overlap of peaks between IgG CUT&RUN and Mcm2 CUT&RUN. SEACR was used for peak calling using a "stringent" mode with numeric threshold of "0.001". (C) Snapshots displaying IgG CUT&RUN and Mcm2 CUT&RUN density at two different loci in WT ES cells. Peaks identified using different methods/parameters were shown below each of the CUT&RUN track. Shadows indicate CUT&RUN peaks identified by SEACR (threshold=0.01) and MACS2 by not by SEACR (threshold=0.001).
Additional files
Download links
A two-part list of links to download the article, or parts of the article, in various formats.
Downloads (link to download the article as PDF)
Open citations (links to open the citations from this article in various online reference manager services)
Cite this article (links to download the citations from this article in formats compatible with various reference manager tools)
Mcm2 promotes stem cell differentiation via its ability to bind H3-H4
eLife 11:e80917.
https://doi.org/10.7554/eLife.80917


