ProteInfer, deep neural networks for protein functional inference
- The Francis Crick Institute, United Kingdom
- Google AI, United States
- University of Cambridge, United Kingdom
Figures
Figure 1
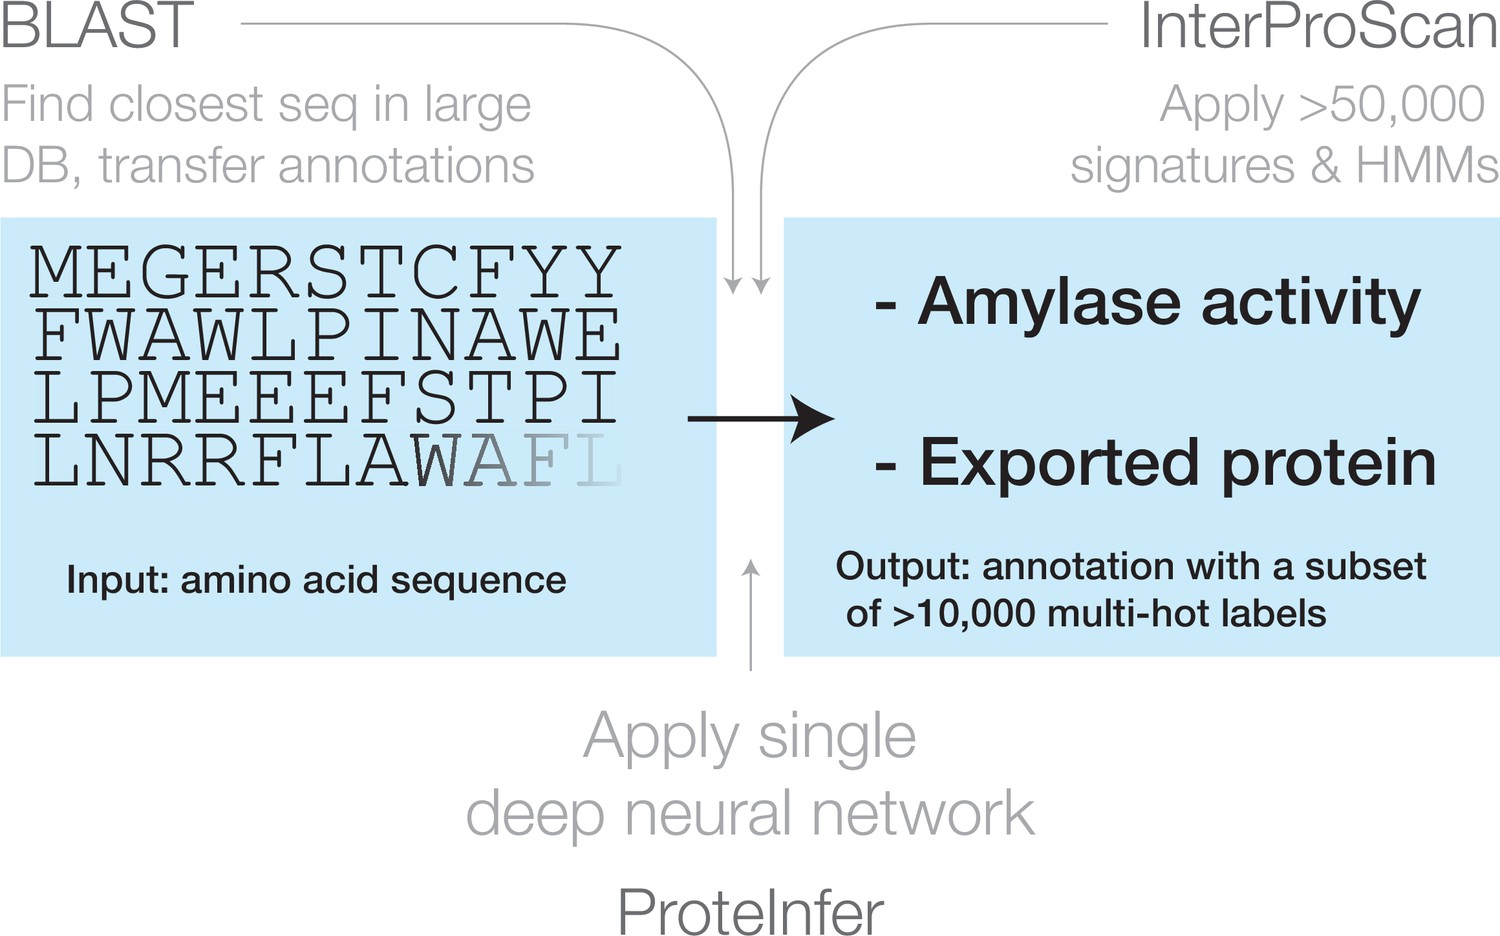
Three approaches for mapping from an amino acid sequence to inferred function: (1) finding similar sequences in a large database of sequences with known annotation (e.g. BLAST), (2) scoring against a large database of statistical models for each family of sequences with known function (e.g. InterProScan), and (3) applying a single deep neural network trained to predict multiple output categories (e.g. this work).
Figure 2
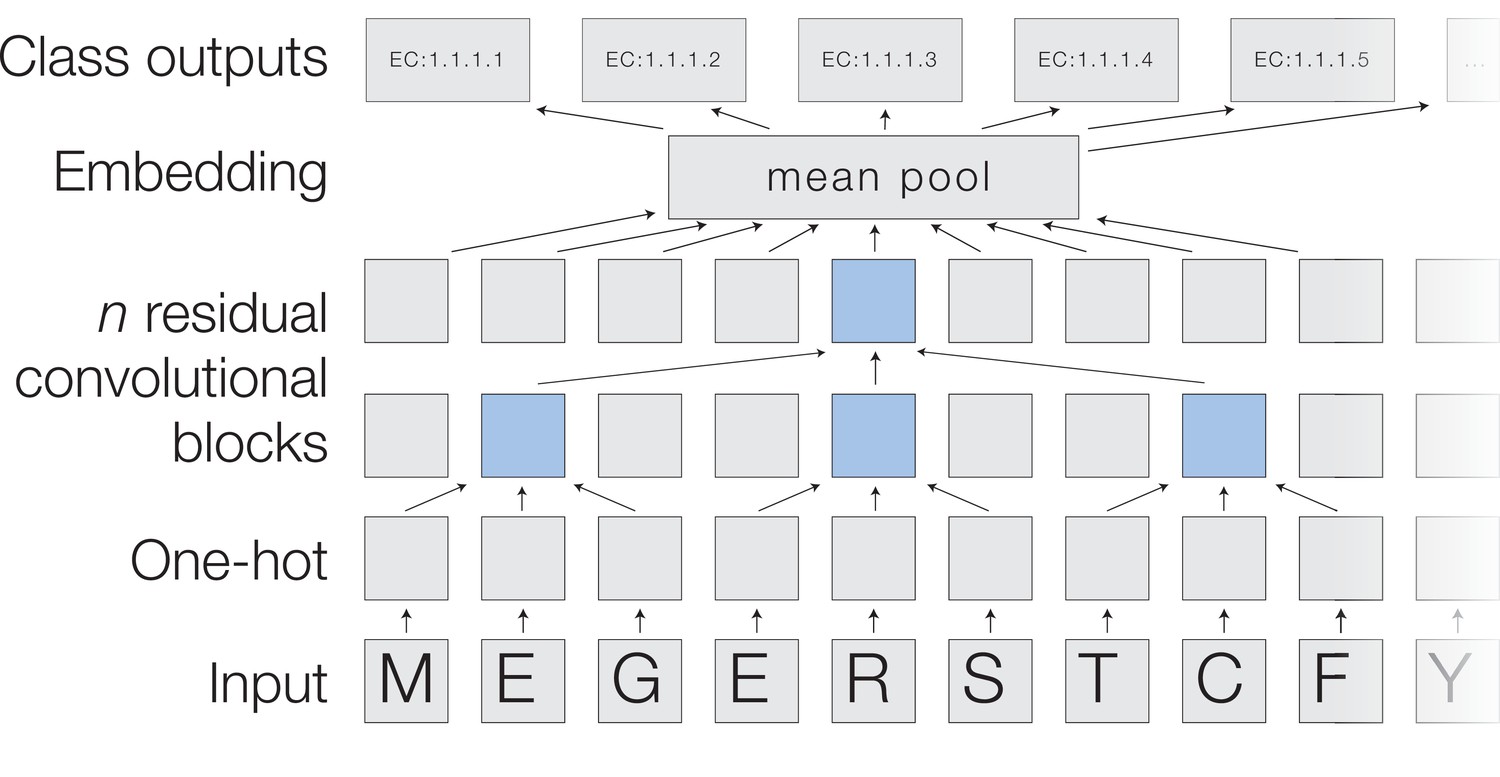
A deep dilated convolutional architecture for protein function prediction.
Amino acids are one-hot encoded, then pass through a series of convolutions implemented within residual blocks. Successive filters are increasingly dilated, allowing the top residual layer of the network to build up a representation of high-order protein features. The positional embeddings in this layer are collapsed by mean-pooling to a single embedding of the entire sequence, which is converted into probabilities of each functional classification through a fully connected layer with sigmoidal activations.
Scheme 1
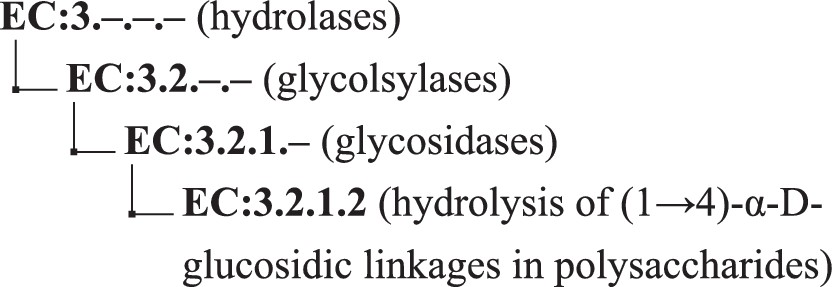
The EC hierarchy.
Figure 3 with 12 supplements
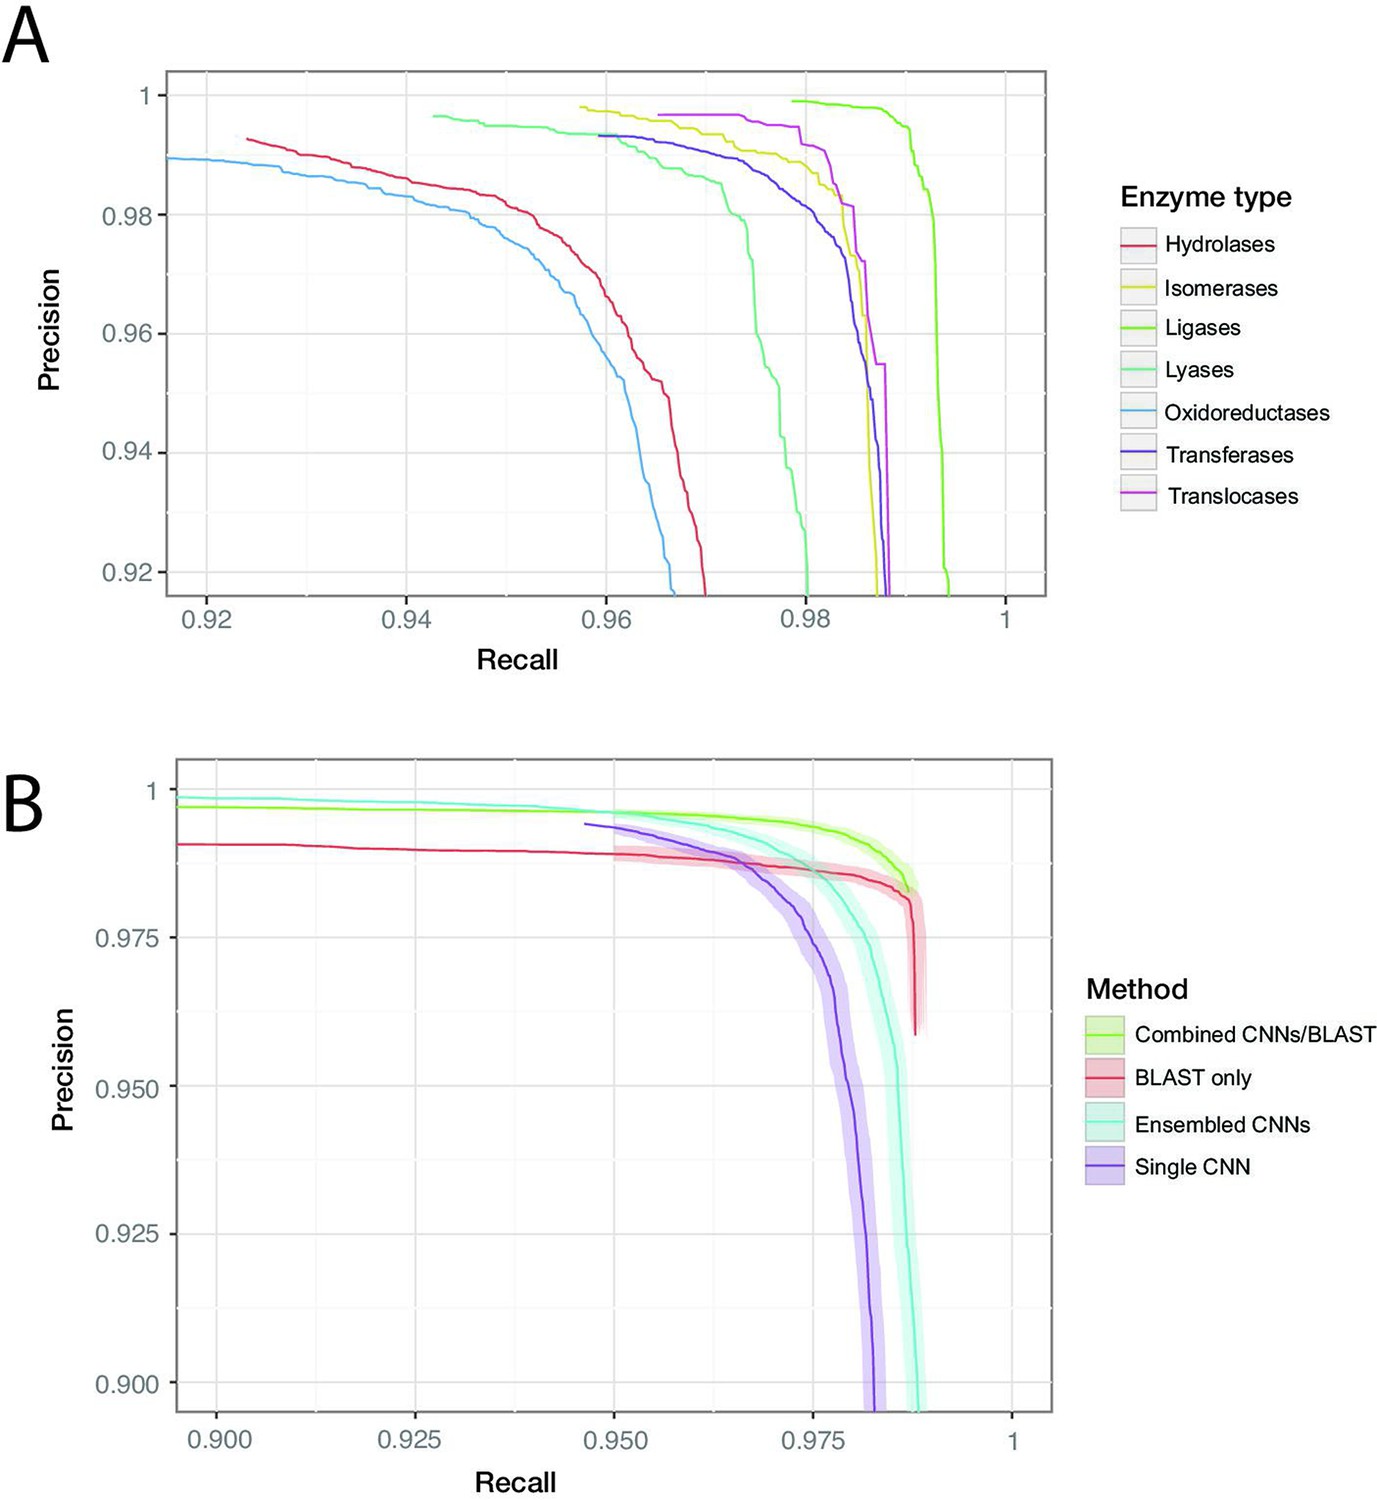
ProteInfer performance (A) for all seven top-level enzyme groups from a single CNN model (B) compared between methods: a single ProteInfer CNN, an ensemble of ProteInfer CNNs, a BLAST-based baseline, and an ensemble of BLAST predictions combined with ProteInfer CNNs.
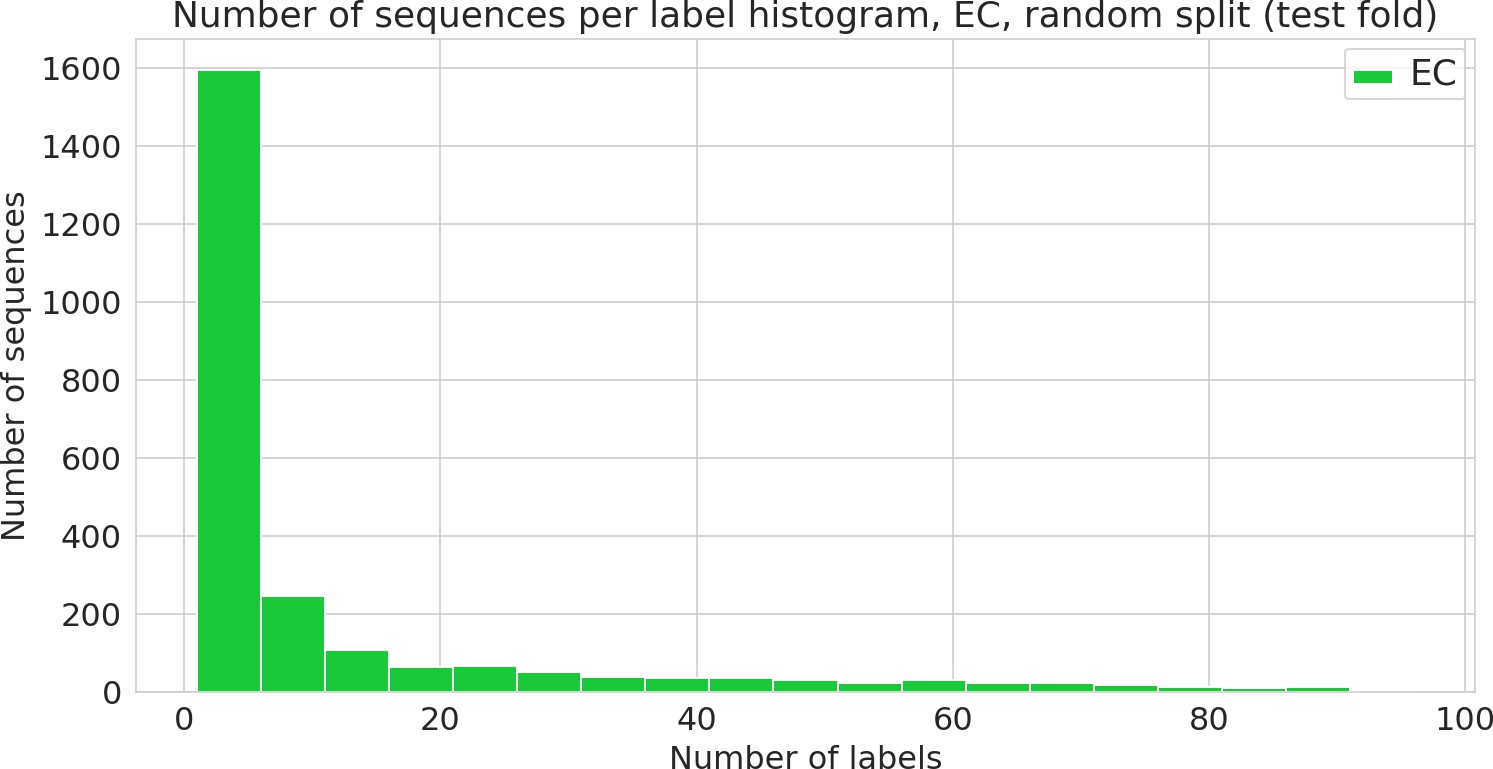
Figure 3—figure supplement 1
Histogram of number of labels per sequence, including hierarchical labels, on the random dataset.
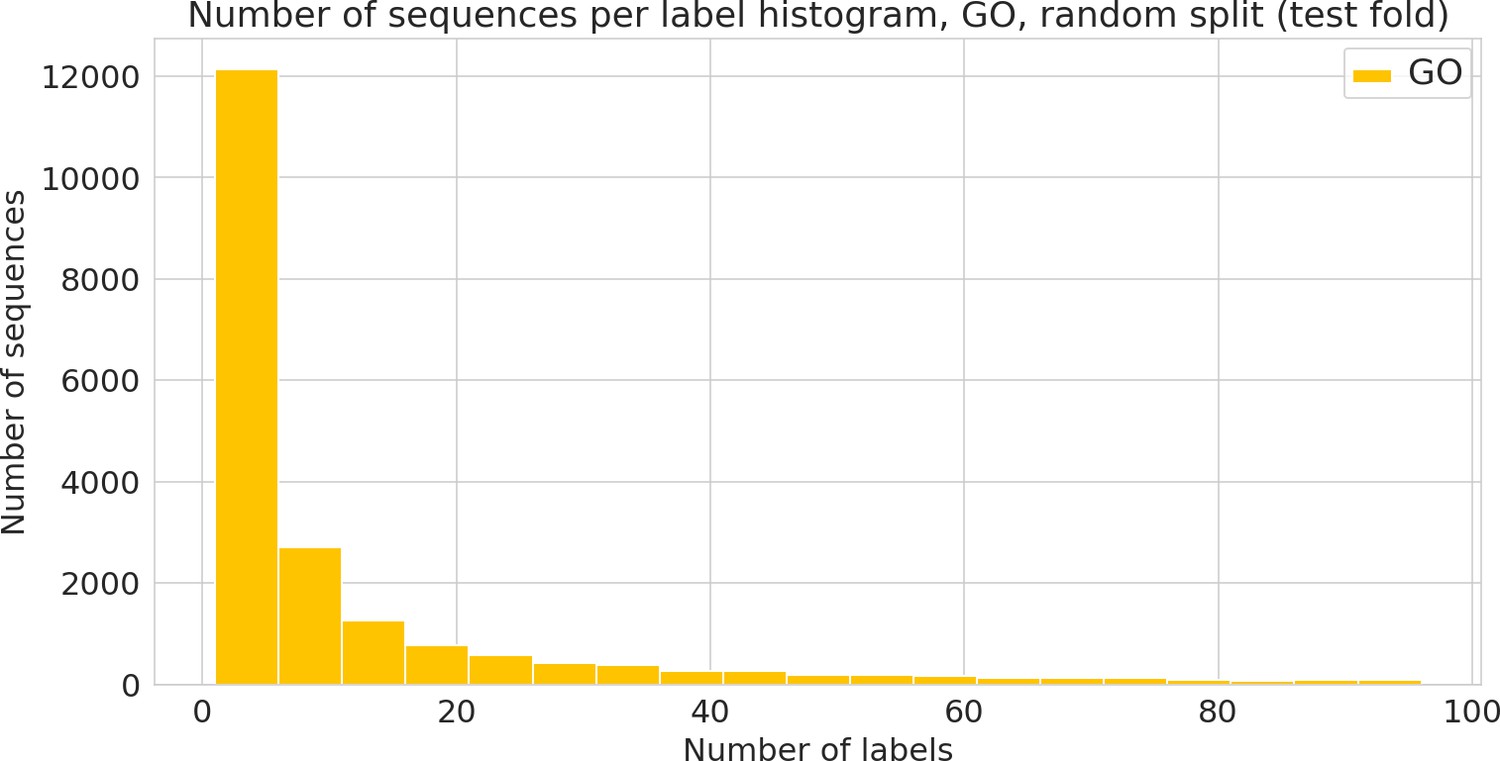
Figure 3—figure supplement 2
Histogram of number of labels per sequence, including hierarchical labels, on the random dataset.
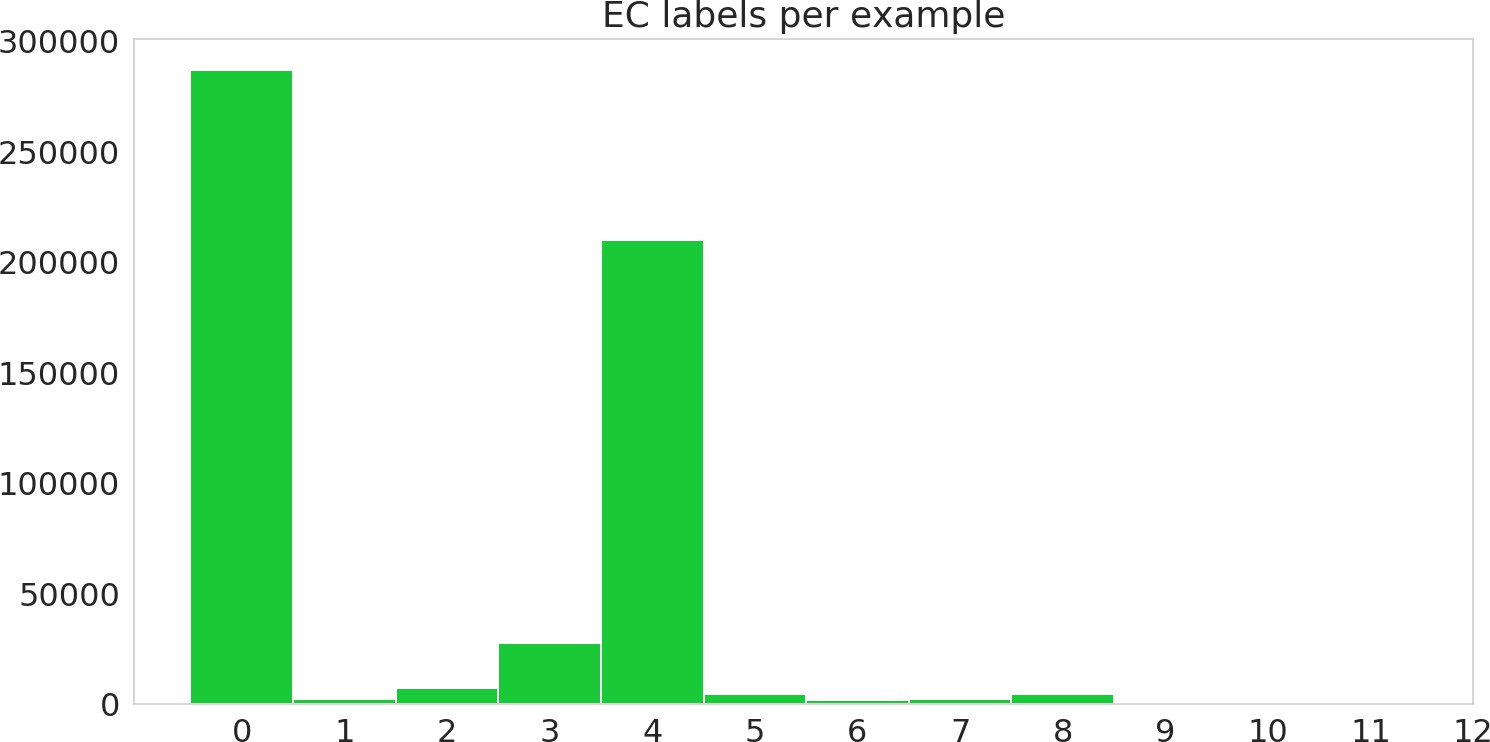
Figure 3—figure supplement 3
Number of sequences annotated with a given functional label (Enzyme Commission [EC] class) in the random dataset.
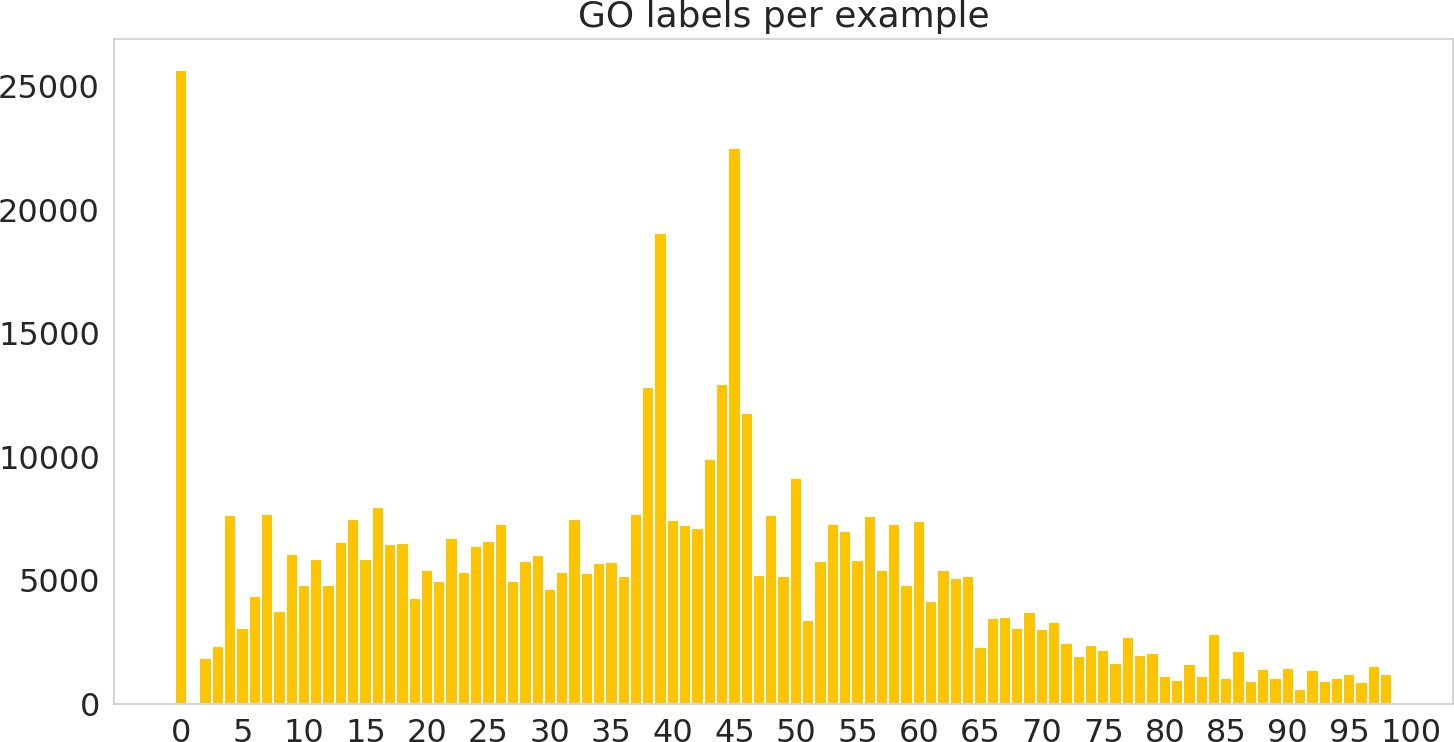
Figure 3—figure supplement 4
Number of sequences annotated with a given functional label (Gene Ontology [GO] label) in the random dataset.
Figure 3—figure supplement 5
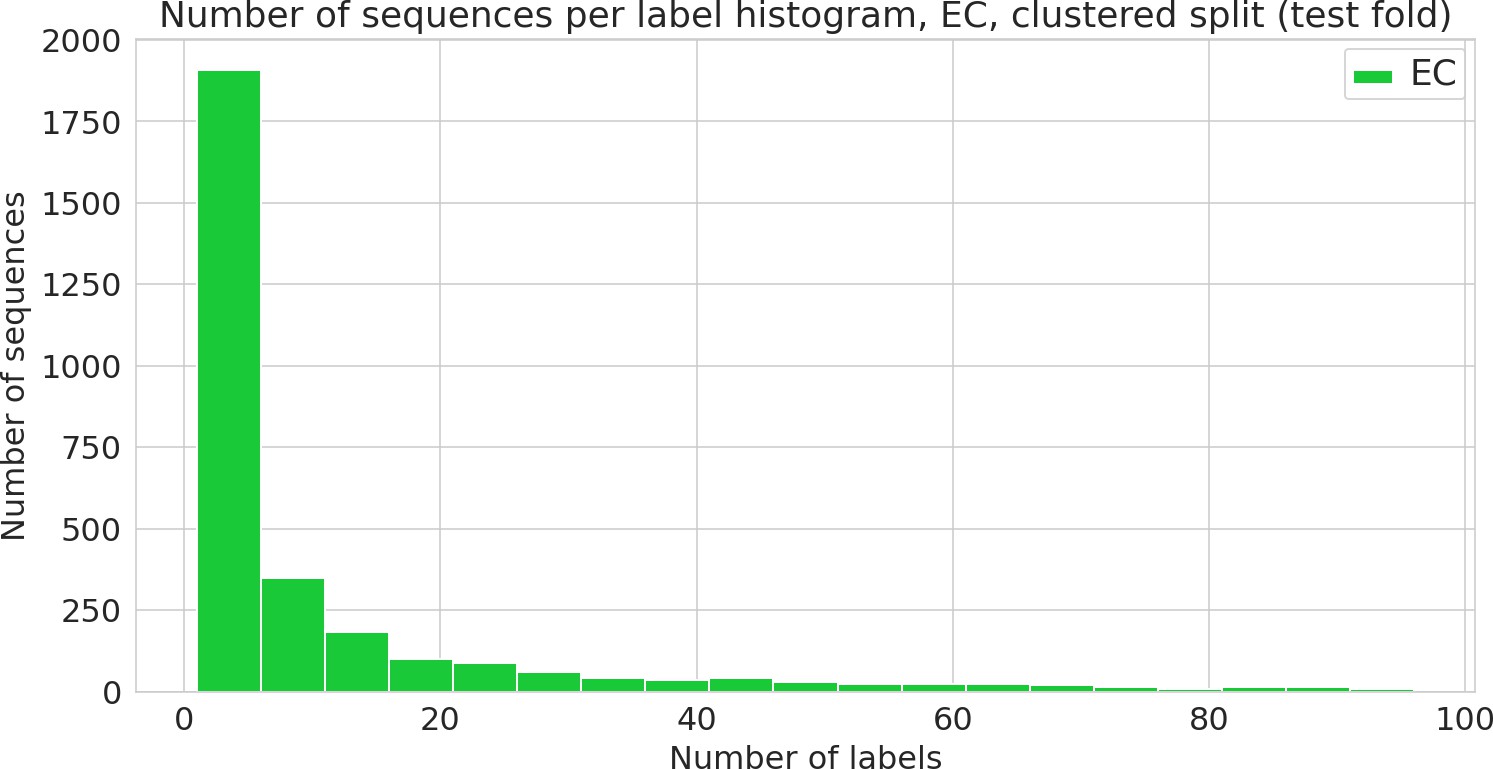
Number of sequences annotated with a given functional label (Enzyme Commission [EC] class) in the clustered dataset.
Figure 3—figure supplement 6
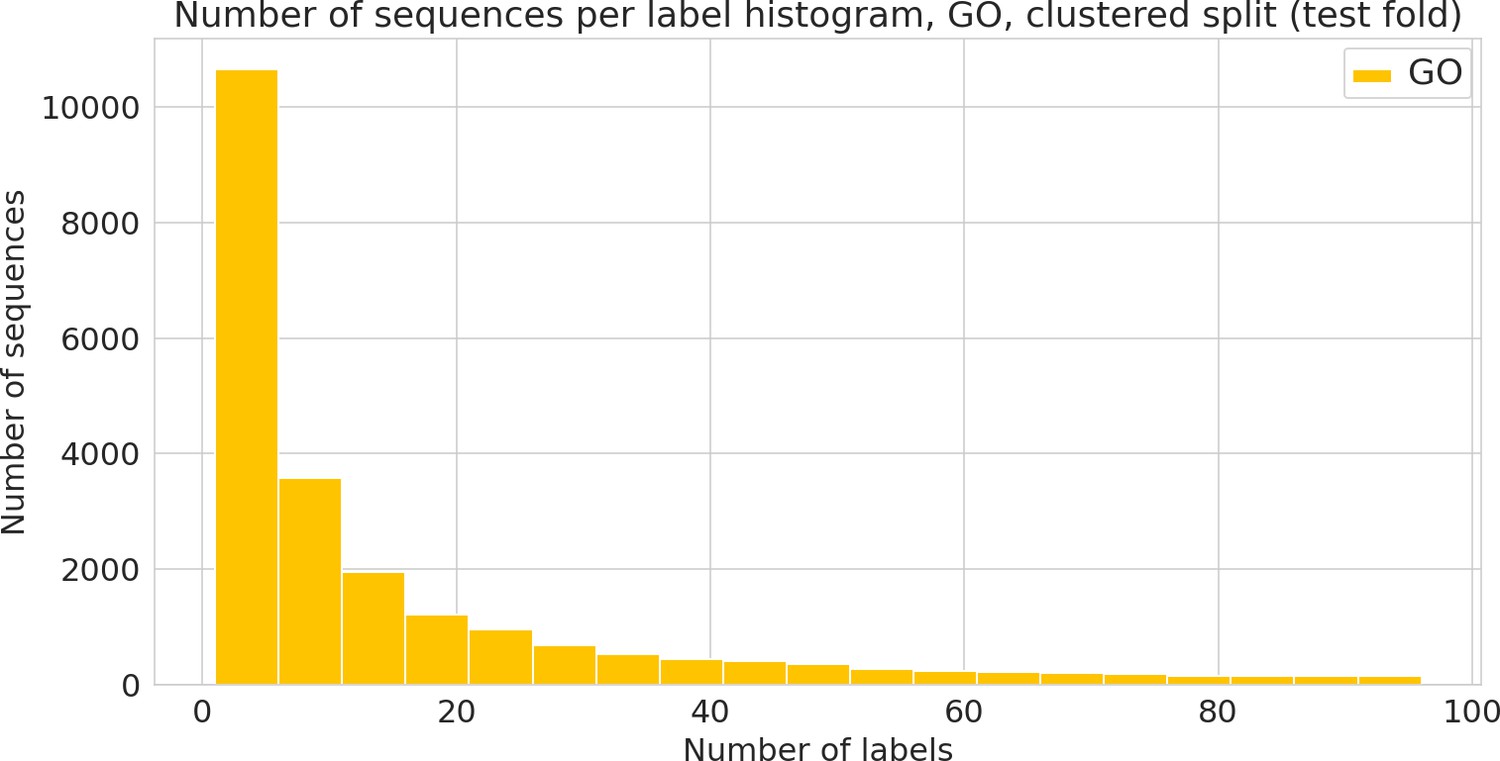
Number of sequences annotated with a given functional label.
(Gene Ontology [GO] label) in the clustered dataset.
Figure 3—figure supplement 7
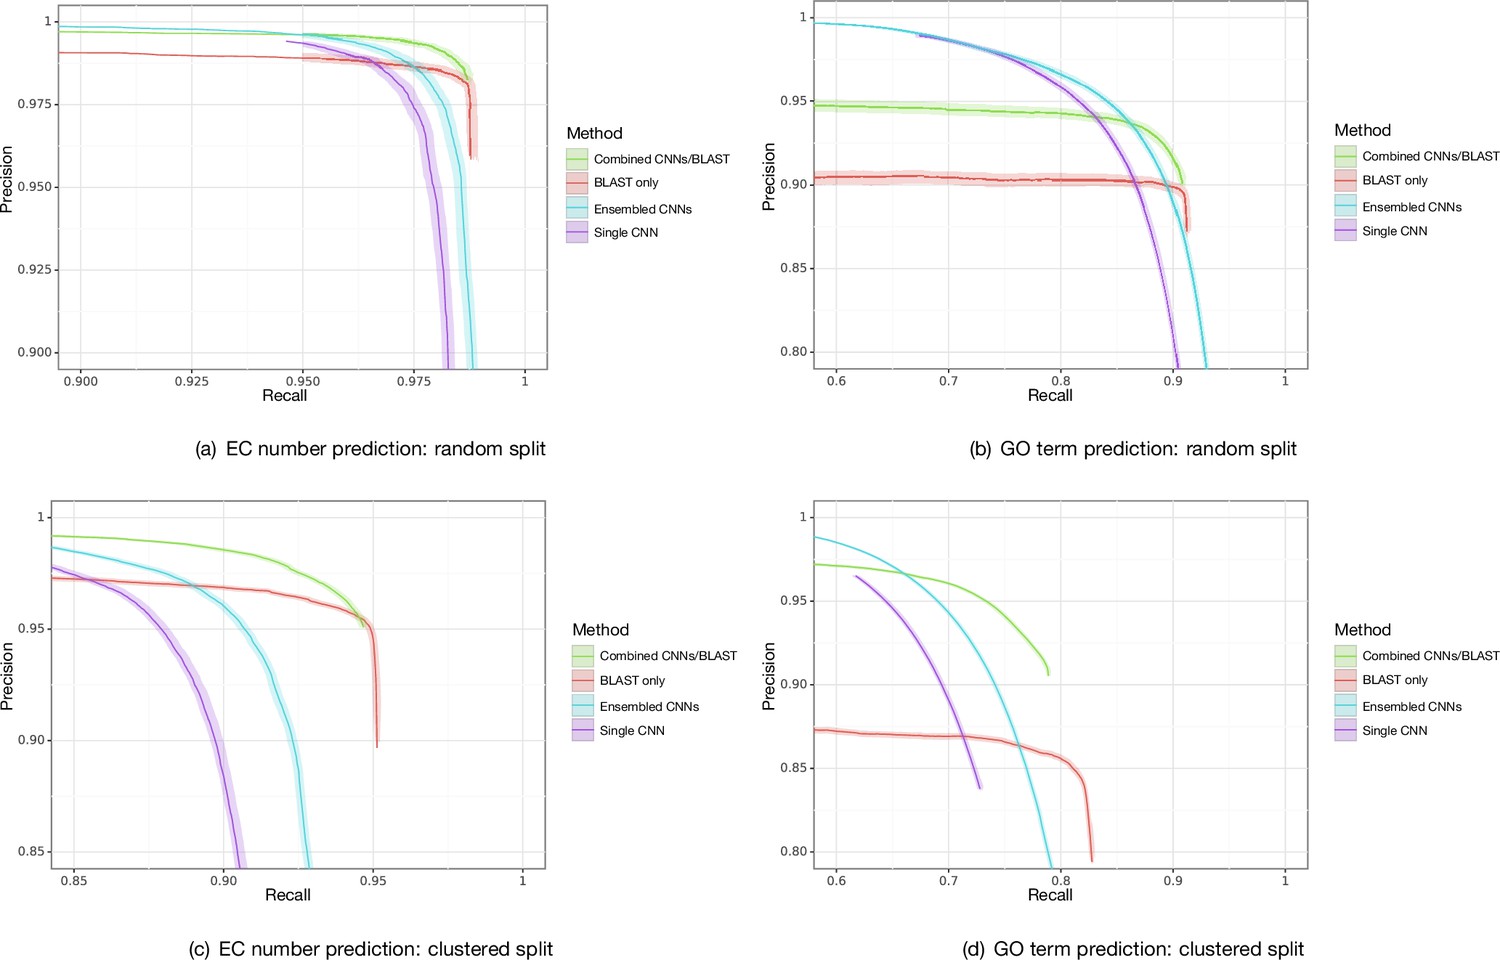
Bootstrapped precision–recall curves for Enzyme Commission (EC) number prediction and Gene Ontology term prediction for random and clustered splits for four methods: BLAST top pick, single ProteInfer CNN, ensembled ProteInfer CNNs, and ensembled ProteInfer CNNs scaled by BLAST score.
Figure 3—figure supplement 8
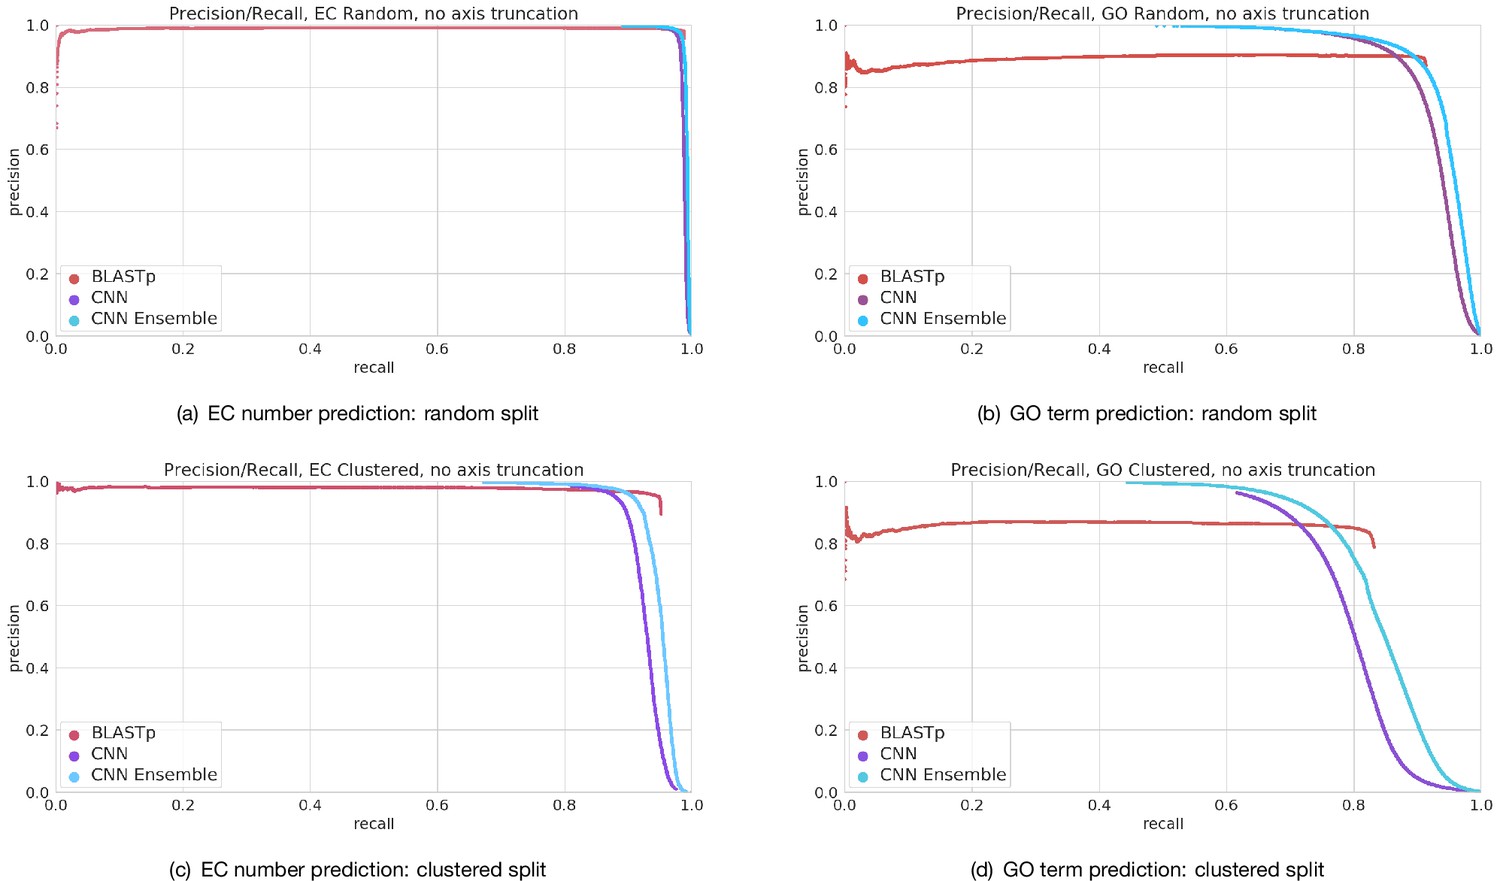
Full precision–recall curves for Enzyme Commission (EC) number prediction and Gene Ontology term prediction for random and clustered splits for four methods: BLAST top pick, single ProteInfer CNN, ensembled ProteInfer CNNs.
Figure 3—figure supplement 9
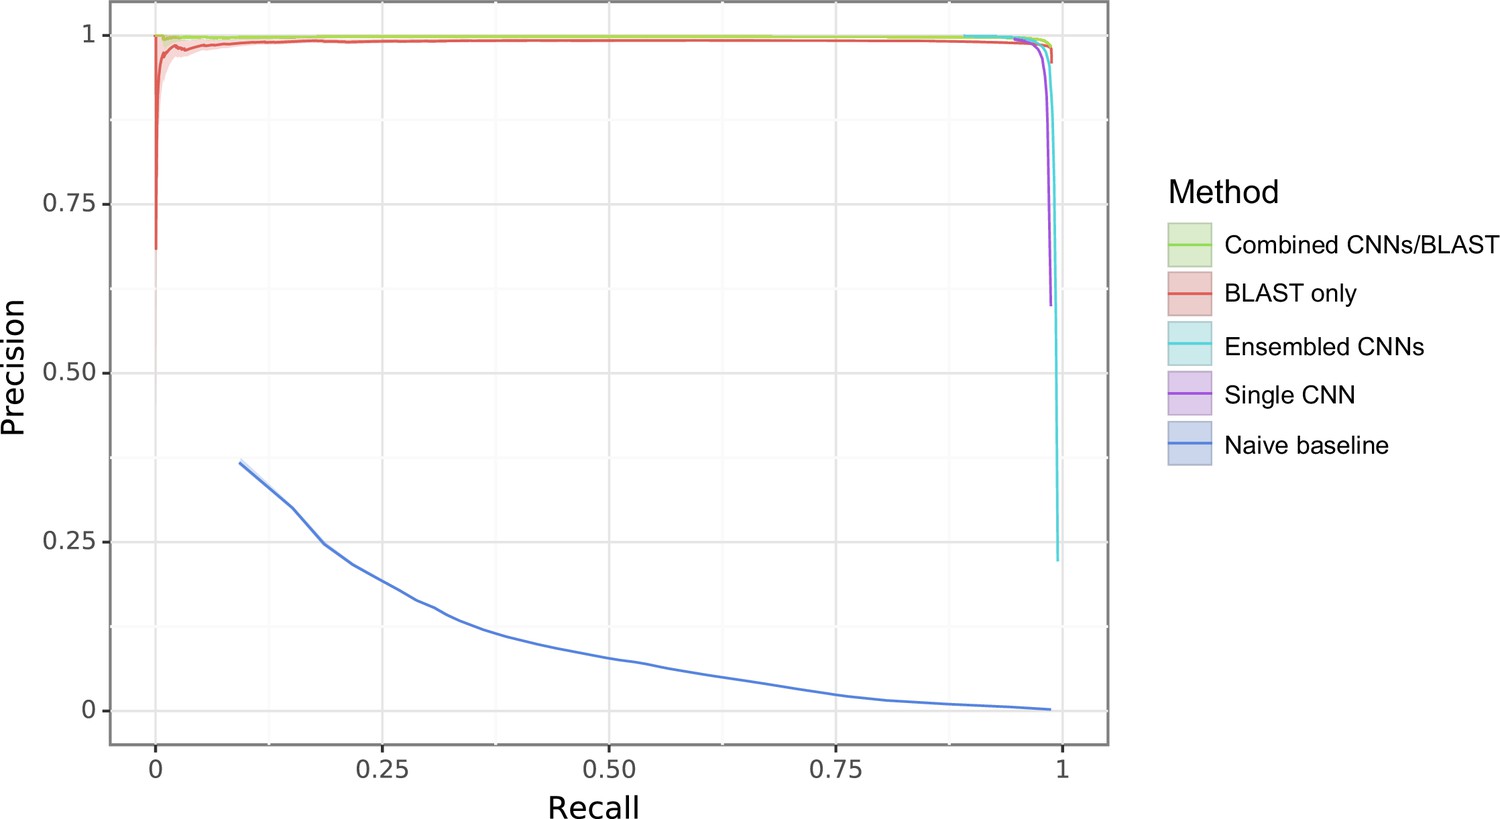
Enzyme Commission (EC) random task with different methods compared against a naive baseline where the predictor is simply the frequency in the training set.
Figure 3—figure supplement 10
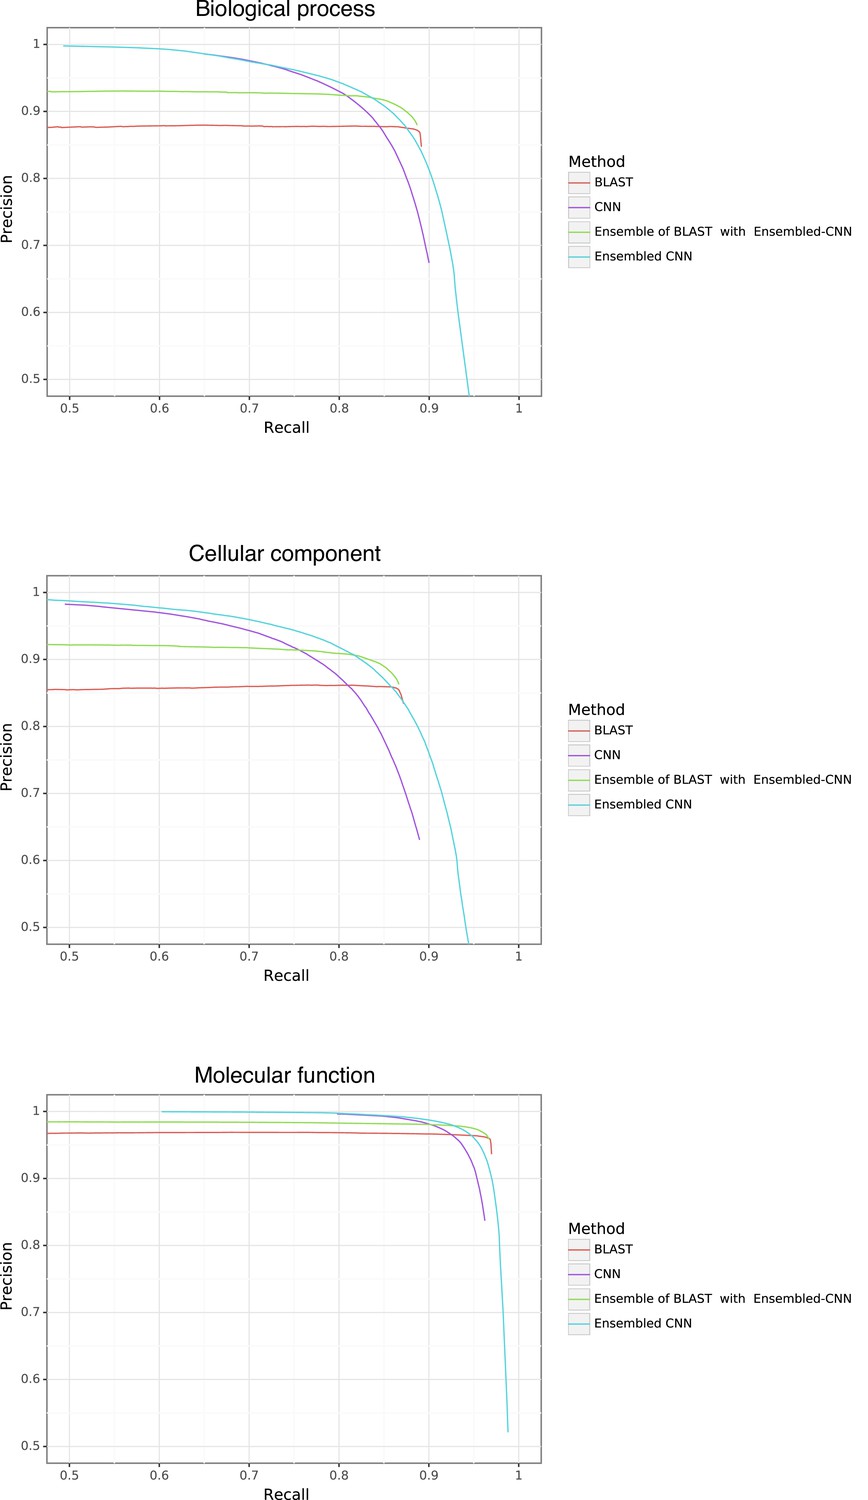
Gene Ontology (GO) performance stratified by method and ontology type.
Figure 3—figure supplement 11
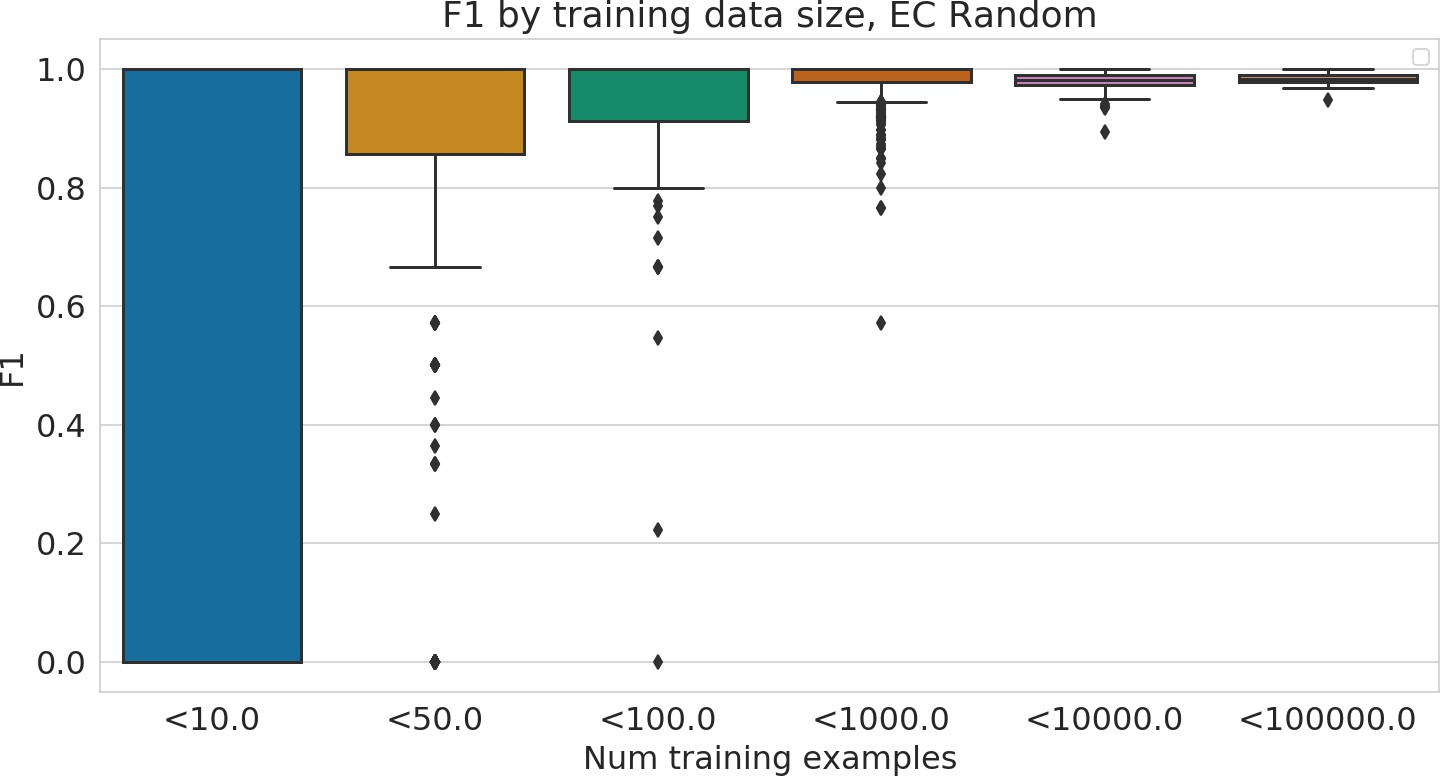
Performance of Enzyme Commission (EC) model stratified by number of training examples available for each test example.
Figure 3—figure supplement 12
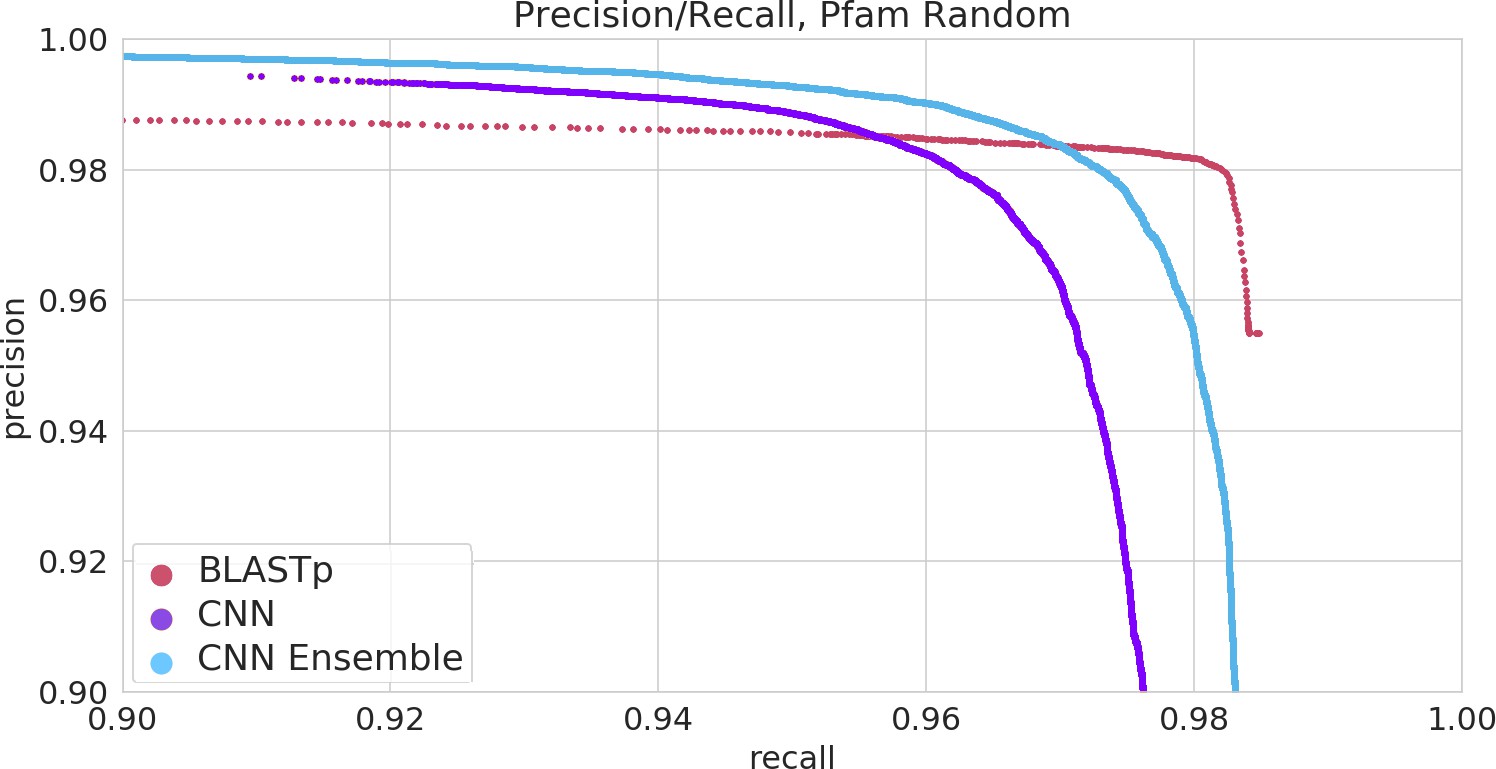
The ProteInfer algorithm is set up to allow any desired training vocabulary to be used.
We demonstrated this by additionally training a model for predicting Pfam families from full-length protein sequences, which is available through our CLI-tool, and performs as shown here.
Figure 4
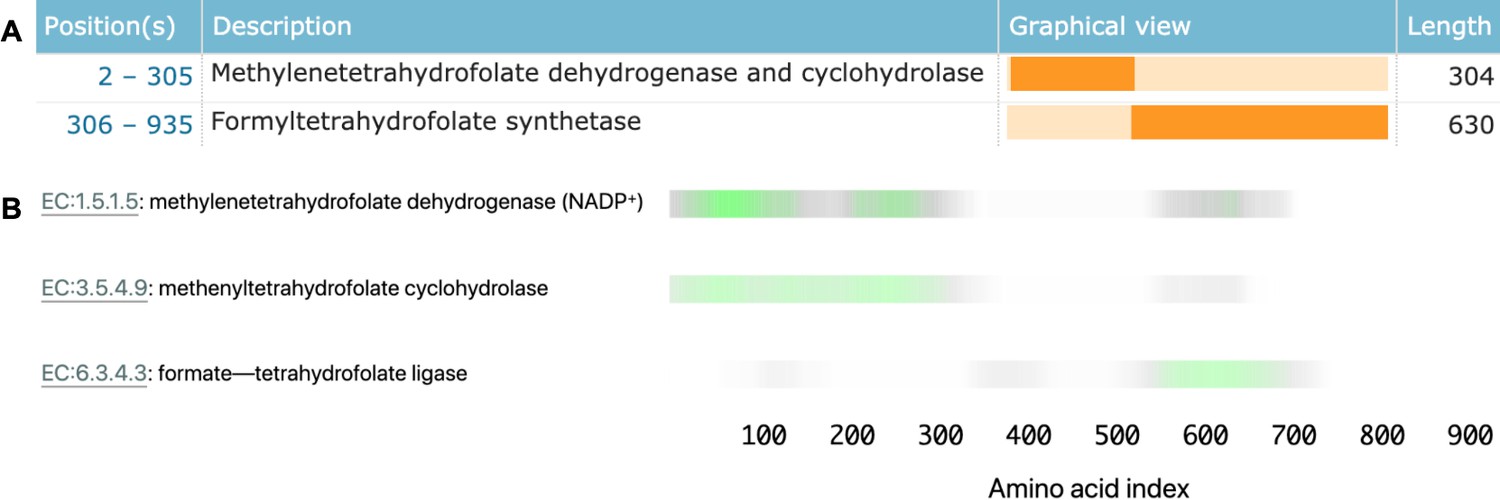
Linking sequence regions to function with class activation mapping for C-1-tetrahydrofolate synthase (accession P11586).
(A) Ground-truth annotation of function on UniProt (UniProt Consortium, 2019b). (B) The three horizontal bars are the sequence region ProteInfer predicts are most involved in each corresponding reaction. This concurs with the known function localisation.
Figure 5
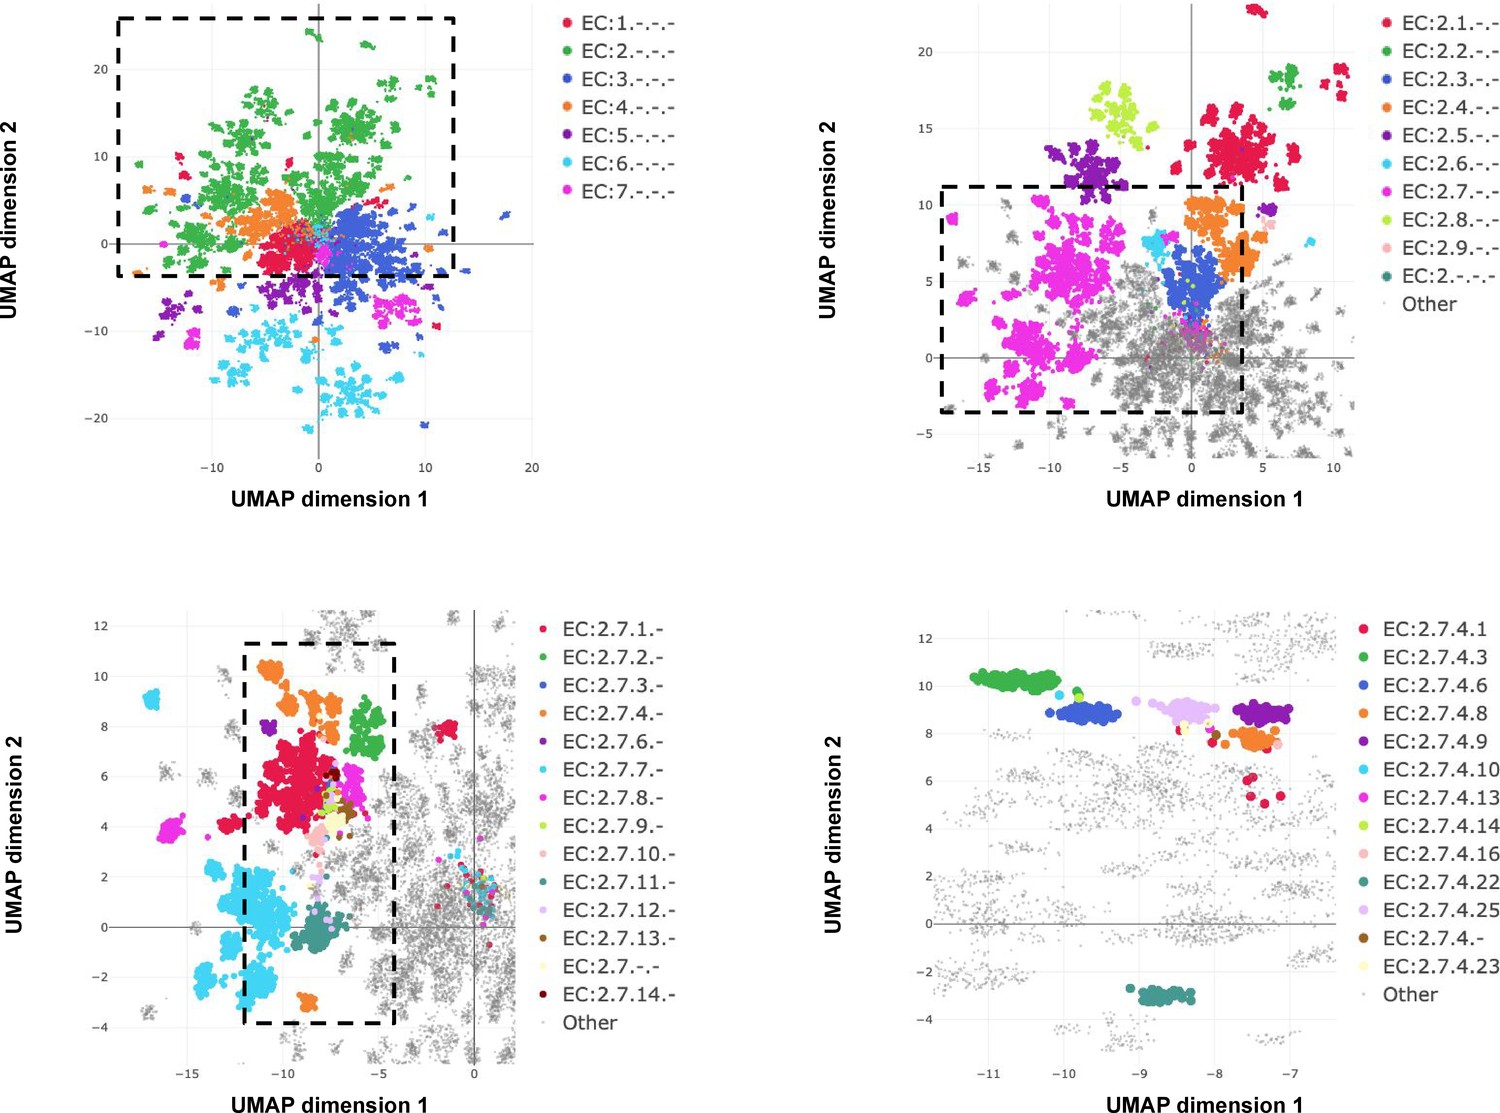
Embedding reflects enzyme functional hierarchy.
UMAP projection of embeddings for the subset of test set sequences which have only one leaf-level Enzyme Commission (EC) classification. Points are colour-coded at successive levels of the EC hierarchy in each panel. (A) colours denote top level EC groups, (B) colours denote second level EC groups within EC2*, (C) colours denote third level EC groups within EC:2.7*, and (D) colours depict terminal EC groups within EC:2.7.4*.
Figure 6
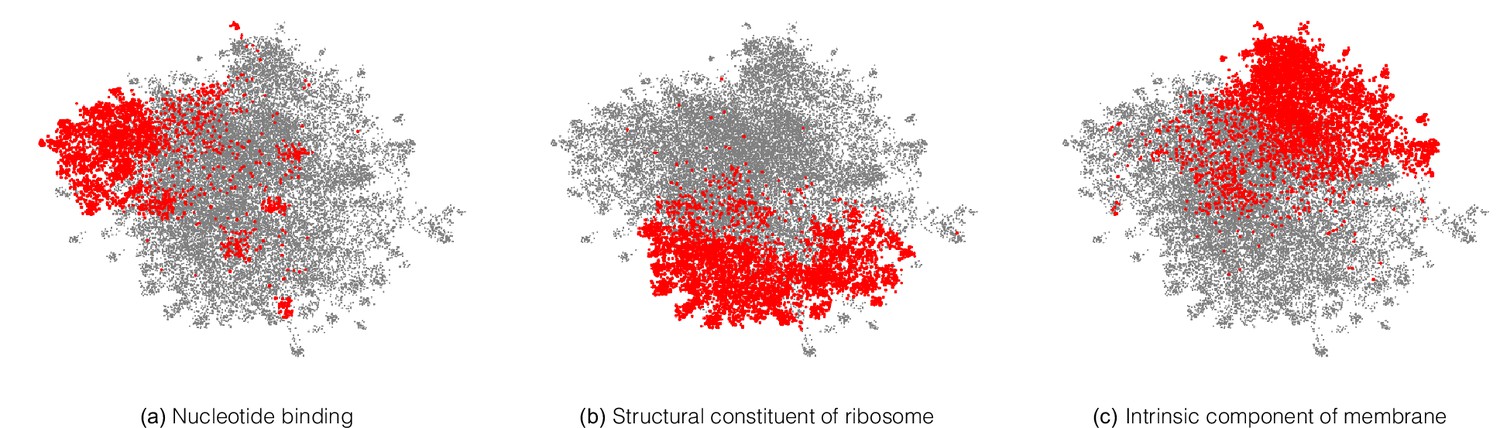
A neural network trained on enzyme function learns general protein properties, beyond enzymatic activity.
This figure shows Enzyme Commission (EC)-trained ProteInfer embeddings for all non-enzymatic sequences in the test set, projected using UMAP. To illustrate the structure contained in these embeddings, we highlight genes based on Gene Ontology (GO) labels (on which this network was never trained) - (a): Nucleotide binding, (b): Structural constituent of ribosome and (c): Intrinsic component of membrane .
Figure 7
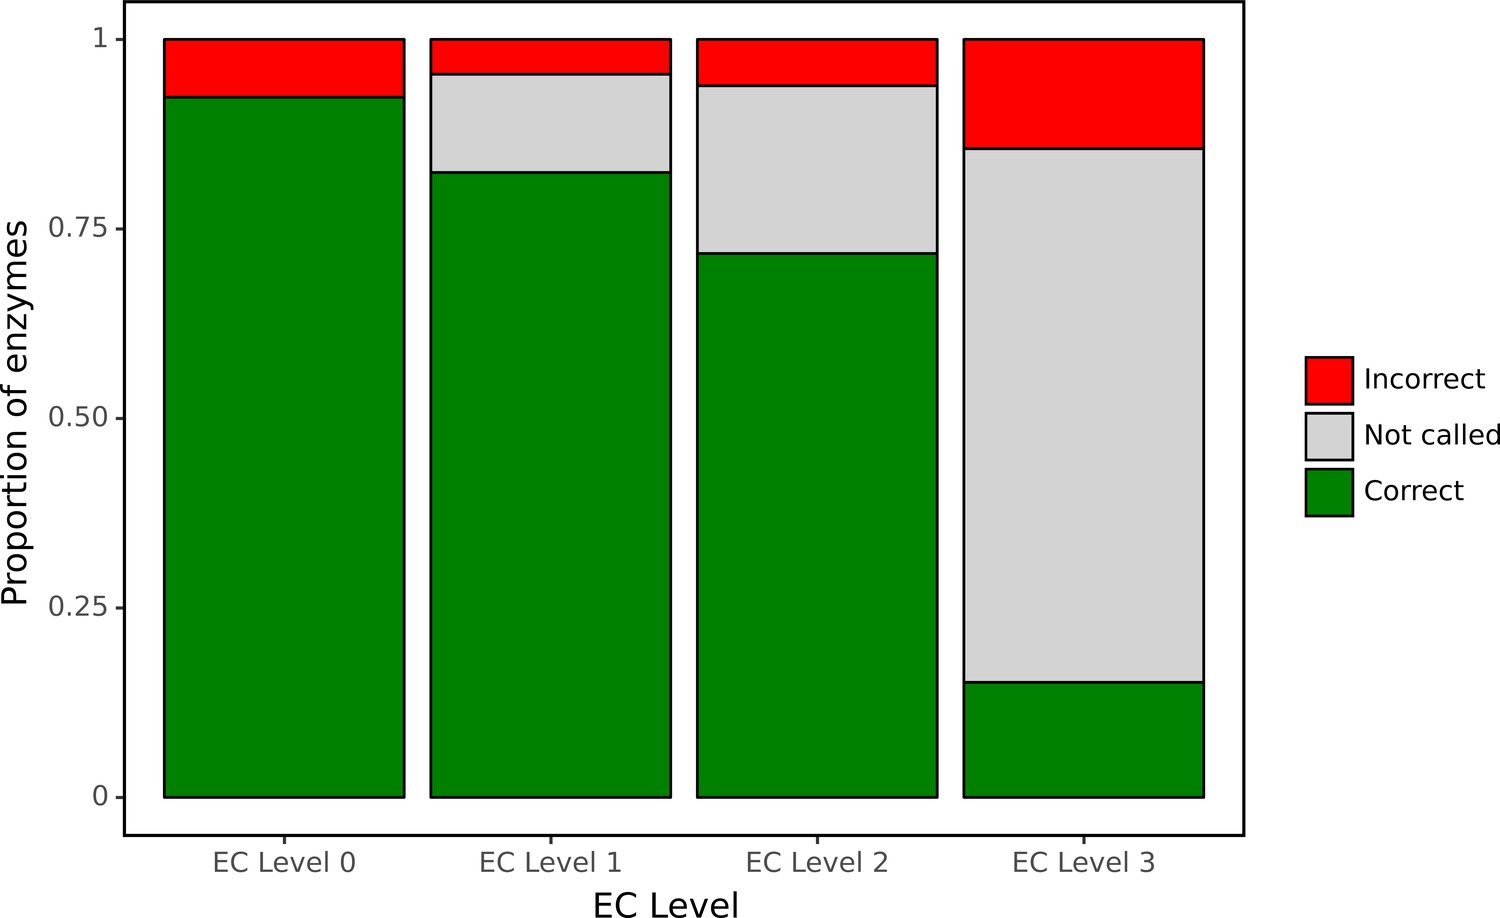
ProteInfer predictions for a set of genes recently experimentally reannotated by high-throughput phenotyping.
ProteInfer makes confident and largely accurate predictions at the earliest levels of the Enzyme Commission (EC) hierarchy. Accuracy falls at the finest levels of classification (for this set of challenging genes) but fortunately the network declines to make a prediction in most cases, with every label failing to meet the threshold for positive classification.
Tables
Table 1
Hyperparameters used in convolutional neural networks.
We note that hyperparameters for single-GPU training are available in github.com/google-research/proteinfer/blob/master/hparams_sets.py.
| CNN | |
|---|---|
| Concurrent batches (data parallelism) | 8 |
| Batch size | 40 (per each GPU) Dynamic based on sequence length |
| Dilation rate | 3 |
| Filters | 1100 |
| First dilated layer | 2 |
| Gradient clip | 1 |
| Kernel size | 9 |
| Learning rate | 1.5E-3 |
| Learning rate decay rate | 0.997 |
| Learning rate decay steps | 1000 |
| Learning rate warmup steps | 3000 |
| Adam | .9 |
| Adam | .999 |
| Adam | 1E-8 |
| Number of ResNet layers | 5 |
| Pooling | Mean |
| ResNet bottleneck factor | 0.5 |
| Train steps | 500,000 |
Table 2
In our random split of the training data, we allocate about 80% to the training fold, 10% to the development fold, and 10% to the test fold.
| Fold | Number of sequences |
|---|---|
| Train | 438,522 |
| Dev | 55,453 |
| Test | 54,289 |
| All together | 548,264 |
Table 3
In our clustered split of the training data, we use UniRef50 and allocate approximately equal numbers of sequences to each fold.
| Fold | Number of sequences |
|---|---|
| Train | 182,965 |
| Dev | 180,309 |
| Test | 183,475 |
| All together | 546,749 |
Table 4
Clustered dataset statistics for Enzyme Commission (EC) labels.
| Type | Number |
|---|---|
| Train labels | 3411 |
| Test labels | 3414 |
| Impossible test labels | 1043 |
| Train example-label pairs | 348,105 |
| Test example-label pairs | 348,755 |
| Impossible test example-label pairs | 3415 |
Table 5
Clustered dataset statistics for Gene Ontology (GO) labels.
| Type | Number |
|---|---|
| Train labels | 26,538 |
| Test labels | 26,666 |
| Impossible test labels | 3739 |
| Train example-label pairs | 8,338,584 |
| Test example-label pairs | 8,424,299 |
| Impossible test example-label pairs | 11,137 |
Table 6
Vocabulary sizes in models trained for Enzyme Commission (EC) and Gene Ontology (GO).
| Vocabulary | Number of terms |
|---|---|
| EC | 5134 |
| GO | 32,109 |
Table 7
In Swiss-Prot, there are 16 candidate domain architectures available for our Enzyme Commission (EC) functional localisation experiment.
Among these, all domain architectures with more than three instances in Swiss-Prot (seven of them) are 100% correctly ordered by our class activation mapping (CAM) method.
Domain architecture diversity in bifunctional enzymes.
| First domain | Second domain | Number ordered correctly | Number times seen | Percent correct |
|---|---|---|---|---|
| EC:2.7.7.60 | EC:4.6.1.12 | 94 | 94 | 100 |
| EC:4.1.99.12 | EC:3.5.4.25 | 83 | 83 | 100 |
| EC:3.5.4.19 | EC:3.6.1.31 | 59 | 59 | 100 |
| EC:1.8.4.11 | EC:1.8.4.12 | 20 | 20 | 100 |
| EC:4.1.1.48 | EC:5.3.1.24 | 18 | 18 | 100 |
| EC:5.4.99.5 | EC:4.2.1.51 | 12 | 12 | 100 |
| EC:5.4.99.5 | EC:1.3.1.12 | 4 | 4 | 100 |
| EC:4.2.1.10 | EC:1.1.1.25 | 3 | 3 | 100 |
| EC:2.7.7.61 | EC:2.4.2.52 | 0 | 3 | 0 |
| EC:2.7.1.71 | EC:4.2.3.4 | 0 | 2 | 0 |
| EC:1.1.1.25 | EC:4.2.1.10 | 0 | 1 | 0 |
| EC:2.7.2.3 | EC:5.3.1.1 | 1 | 1 | 100 |
| EC:4.1.1.97 | EC:1.7.3.3 | 1 | 1 | 100 |
| EC:4.1.3.1 | EC:2.3.3.9 | 1 | 1 | 100 |
| EC:5.1.99.6 | EC:1.4.3.5 | 0 | 1 | 0 |
| EC:1.8.4.12 | EC:1.8.4.11 | 0 | 1 | 0 |
Table 8
Clustered dataset statistics for EC labels.
| Type | Number |
|---|---|
| Train labels | 3411 |
| Test labels | 3414 |
| Impossible test labels | 1043 |
| Train example-label pairs | 348,105 |
| Test example-label pairs | 348,755 |
| Impossible test example-label pairs | 3415 |
Additional files
Download links
A two-part list of links to download the article, or parts of the article, in various formats.
Downloads (link to download the article as PDF)
Open citations (links to open the citations from this article in various online reference manager services)
Cite this article (links to download the citations from this article in formats compatible with various reference manager tools)
ProteInfer, deep neural networks for protein functional inference
eLife 12:e80942.
https://doi.org/10.7554/eLife.80942


