GluA3 subunits are required for appropriate assembly of AMPAR GluA2 and GluA4 subunits on cochlear afferent synapses and for presynaptic ribbon modiolar–pillar morphology
- Department of Otolaryngology, Washington University School of Medicine, United States
- Department of Neurobiology, University of Pittsburgh School of Medicine, United States
- Department of Otolaryngology, University of Pittsburgh School of Medicine, United States
Figures
Figure 1
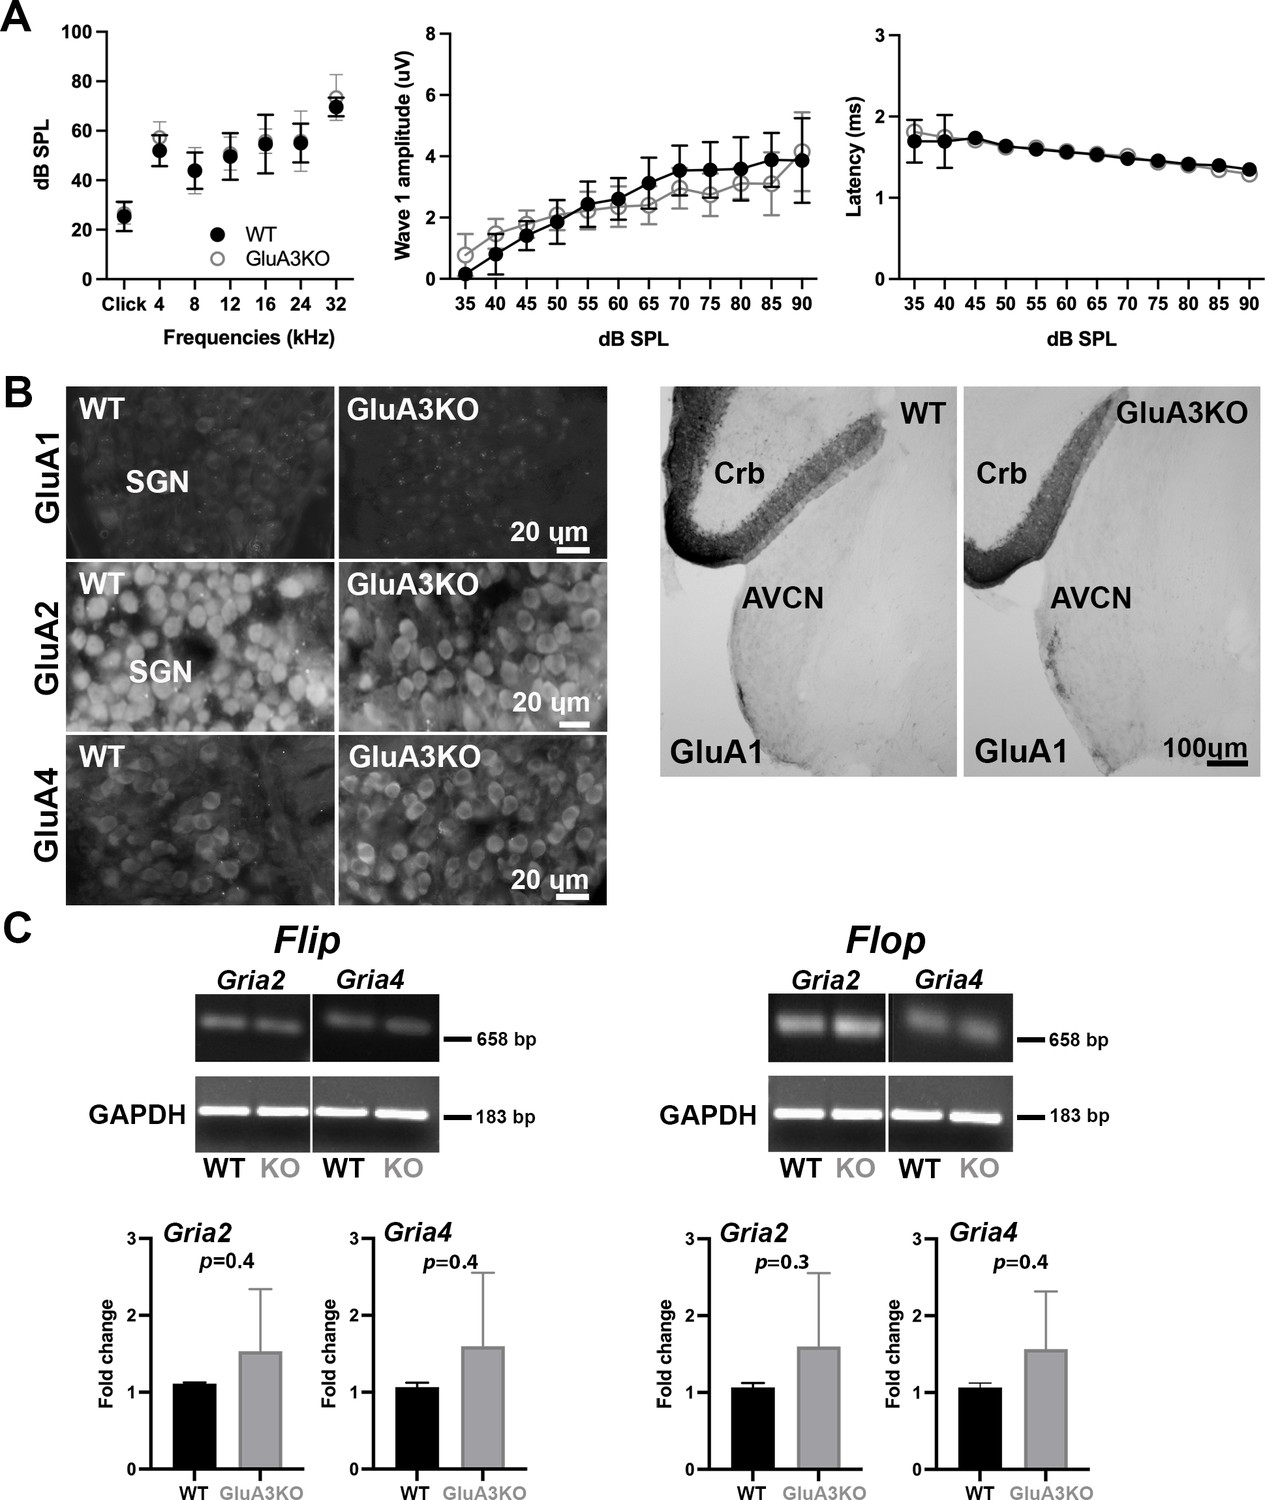
ABRs, GluA1 and GluA2 immunolabeling and qRT-PCR in GluA3WT and GluA3KO.
(A) Mean ABR thresholds ( ± standard deviation [SD]) were similar between male GluA3WT and GluA3KO mice (F(1, 168) = 2.659, p = 0.11; two-way analysis of variance (ANOVA); GluA3WT n = 13; GluA3KO n = 13). In GluA3WT and GluA3KO, there was a main effect of sound frequency (F(6, 168) = 78.78, p < 0.0001). For ABR wave-1 amplitudes ( ± SD), there was an effect of sound ilevel (F(11, 192) = 49.62, p < 0.0001), but mean amplitudes were similar between genotypes (F(1, 292) = 2.458, p = 0.118; two-way ANOVA). For ABR wave-1 latencies ( ± SD), there was a main effect of sound level in both genotypes (F(1, 288) = 47.11, p < 0.0001) and mean latencies were similar between GluA3WT and GluA3KO mice (F(1, 288) = 0.1273, p = 0.7215; two-way ANOVA). (B) Micrographs show immunolabeling for GluA1, GluA2, and GluA4 on spiral ganglion neuron (SGN) somata, and for GluA1 on the anteroventral cochlear nucleus (AVCN) and cerebellum (Crb) of GluA3WT and GluA3KO mice. Immunolabeling for GluA2 and GluA4 is observed on SGNs of both genotypes. In contrast, immunolabeling for GluA1 was not observed on SGNs nor in the AVCN of GluA3WT or GluA3KO mice, but was observed in the cerebellar Bergmann glia of both genotypes. Scale bars: 20 and 100 µm. (C) Images of Gria2 and Gria4 flip and flop, and GAPDH gels of GluA3WT and GluA3KO inner ears. Histograms show fold change ( ± SD) of qRT-PCR product. Paired t-test, two-tailed; bp: base pairs.
-
Figure 1—source data 1
Data and statistical analysis for the ABR, PCR gels and qRT-PCR for GluA3WT and GluA3KO mice.
- https://cdn.elifesciences.org/articles/80950/elife-80950-fig1-data1-v2.zip
-
Figure 1—source data 2
Raw unedited PCR acrylamide gels for Gria2 and Gria4 flip/flop in GluA3WT and GluA3KO.
- https://cdn.elifesciences.org/articles/80950/elife-80950-fig1-data2-v2.zip
-
Figure 1—source data 3
Figures of the uncropped PCR acrylamide gels for Gria2 and Gria4 flip/flop in GluA3WT, and GluA3KO with relevant bands and lanes clearly labeled.
- https://cdn.elifesciences.org/articles/80950/elife-80950-fig1-data3-v2.zip
Figure 2
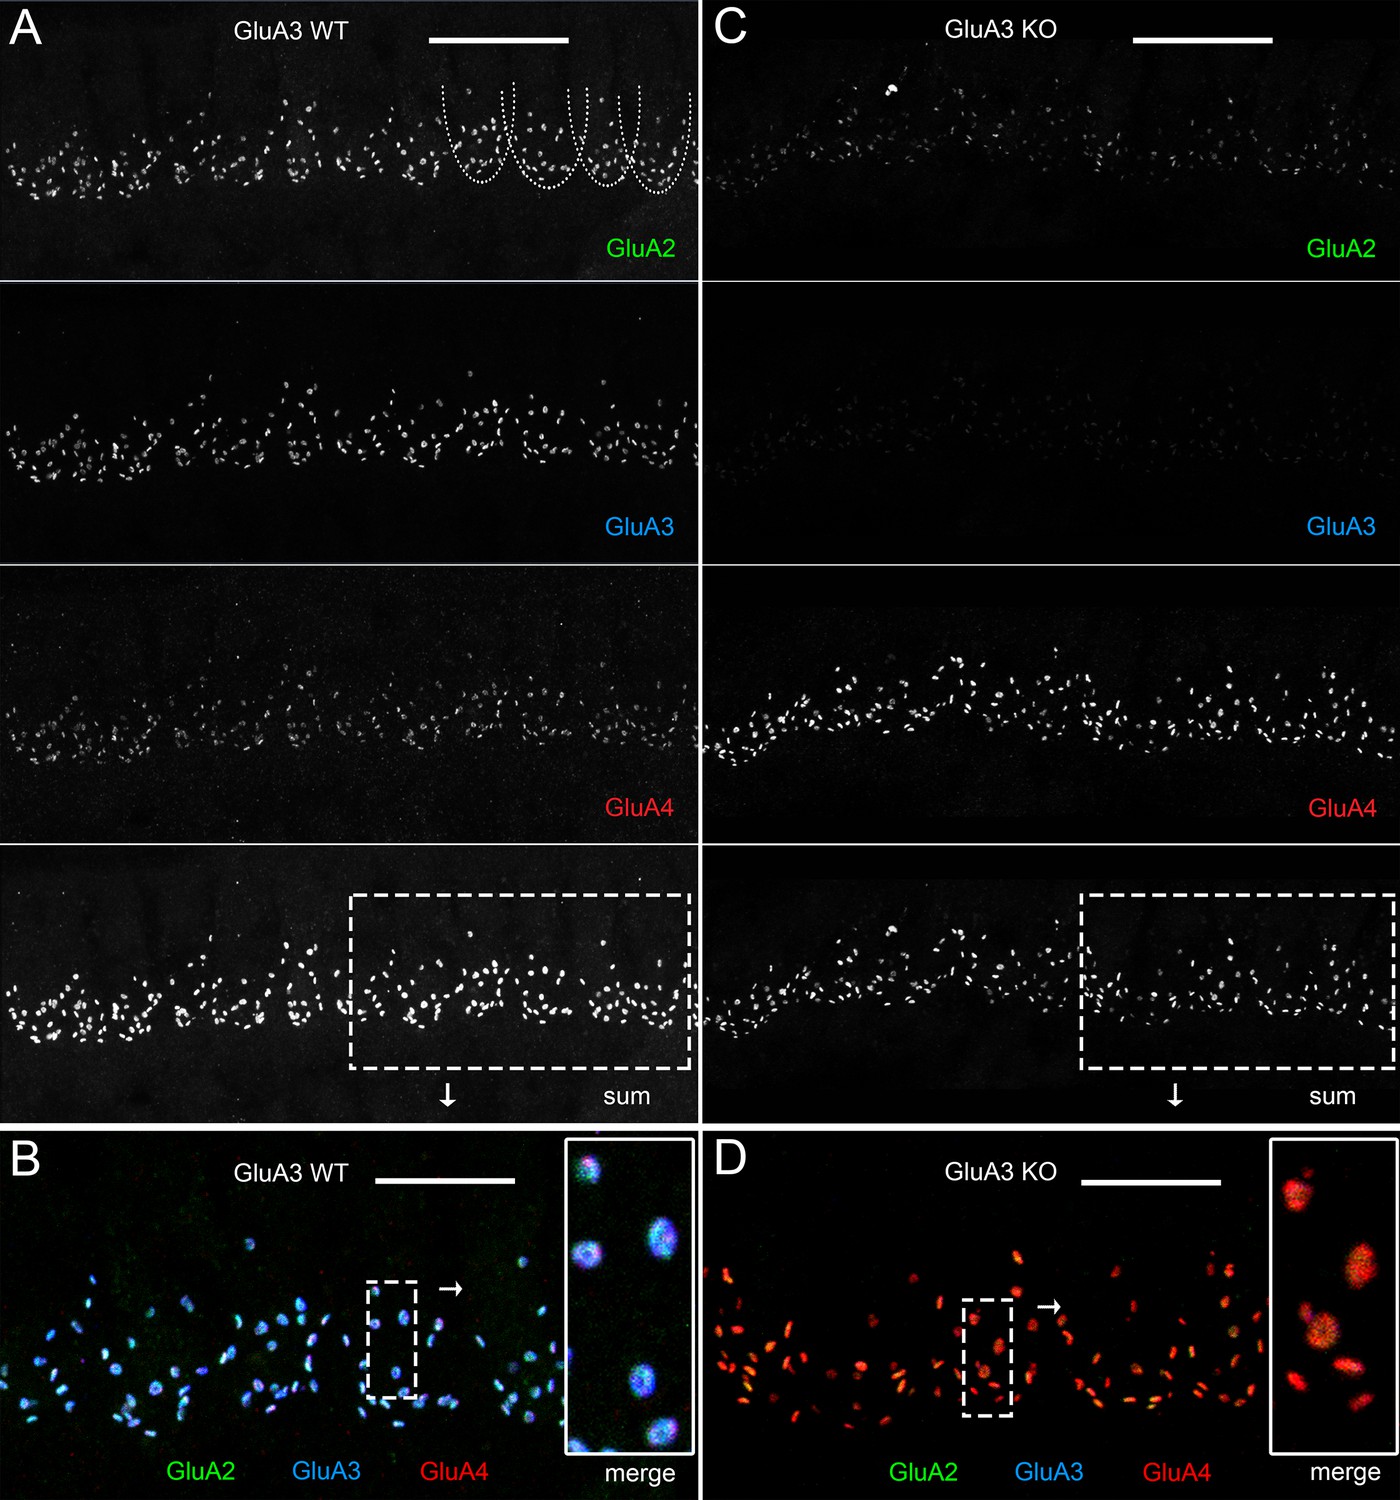
Immunohistofluorescence of α-amino-3-hydroxy-5-methyl-4-isoxazole propionic acid receptor (AMPAR) pore-forming subunits GluA2, 3, and 4 on spiral ganglion neuron postsynaptic terminals in the organ of Corti.
Confocal microscope immunofluorescence images of afferent ribbon synapses in organ of Corti whole-mount samples from GluA3WT (left) and GluA3KO mice (right) in the mid-cochlea. Anti-GluA2 (green), -GluA3 (blue), and -GluA4 (red) labels the postsynaptic AMPAR subunits encoded by the Gria2, Gria3, and Gria4 genes, respectively. Each subpanel displays synaptic puncta of approximately 12 inner hair cells (IHCs). Scale bars: 20 µm (A, C); 10 µm (B, D). (A) From top to bottom: GluA3WT in grayscale for anti-GluA2, 3, 4, and the sum of the three. In the GluA2 subpanel, the basolateral membranes of four IHCs are indicated by dashed curves. (B) Merged color image of the region of interest indicated by the dashed rectangle in panel A. Inset on right: enlargement of the dashed rectangular region of interest on left shows five postsynaptic AMPA receptor arrays of ribbon synapses from one IHC. (C) From top to bottom: GluA3KO in grayscale for anti-GluA2, 3, 4, and the sum of the three. (D) Merged color image of the region of interest indicated in panel C. Inset: enlargement of a rectangular region of interest shows several postsynaptic AMPAR arrays of ribbon synapses from one IHC.
Figure 3 with 1 supplement
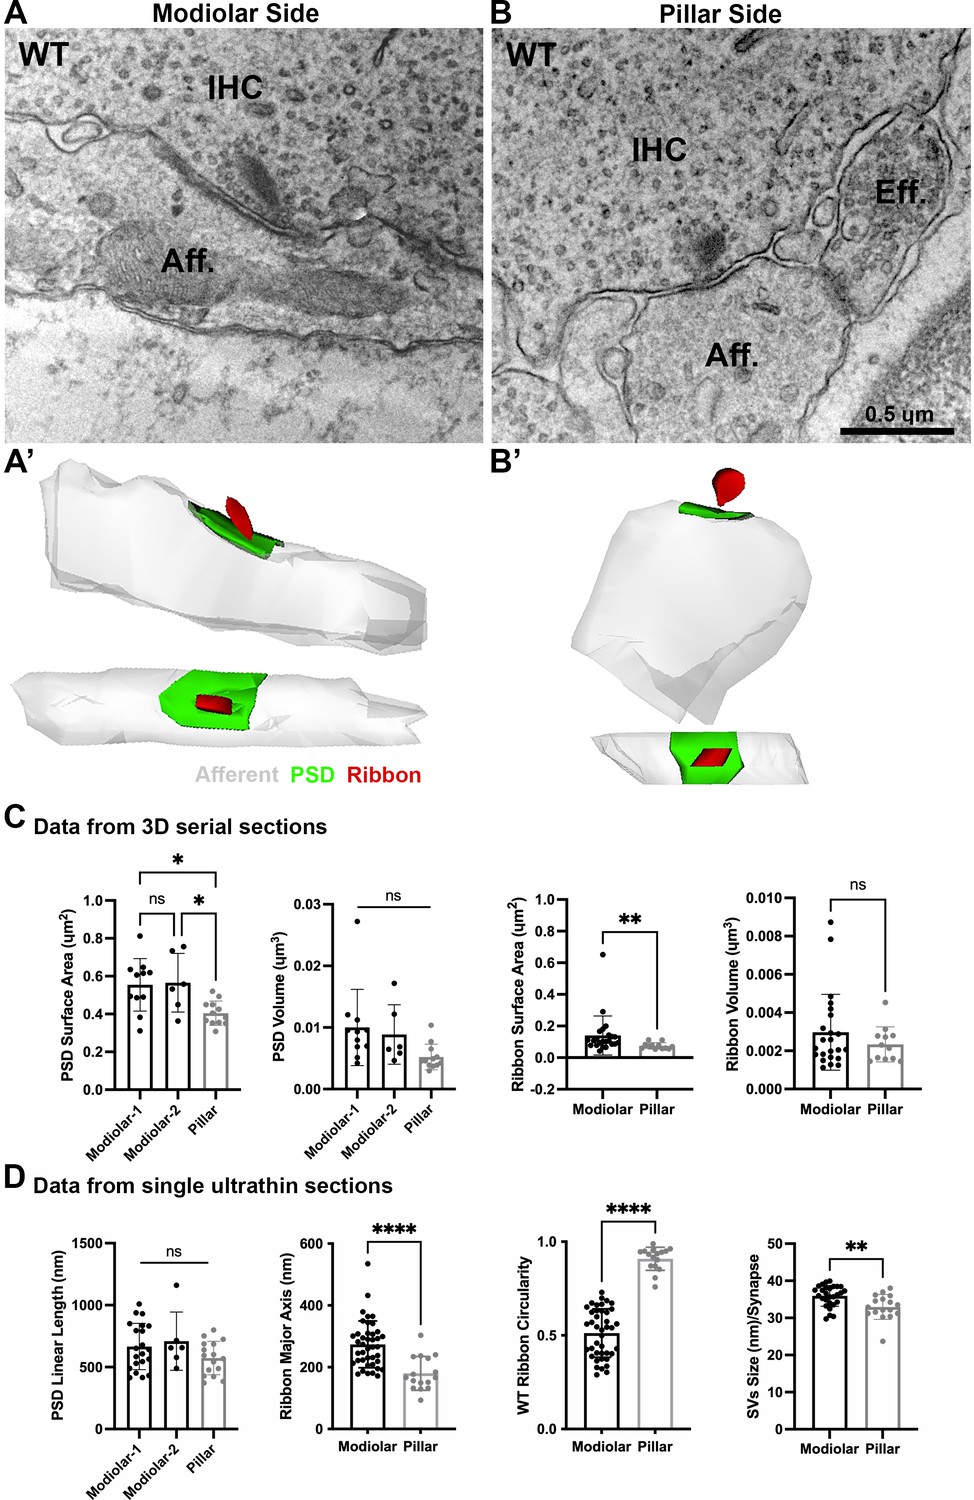
Ultrastructural features of GluA3WT IHC-ribbon mid-cochlear synapses.
Transmission electron microscopy (TEM) micrographs of IHC synapses on the modiolar (A) and pillar sides (B). Aff.: afferent; IHC: inner hair cell; Eff.: efferent terminal. Scale bar: 0.5 µm. (A’, B’) Three-dimensional (3D) reconstructions of the IHC-ribbon synapses are shown in A and B. Representative serial electron micrograph images of modiolar- and pillar-side ribbon synapses are shown in Figure 3—figure supplement 1. (C) Plots of the quantitative data of the surface area, and volume of the postsynaptic densities (PSDs) and ribbons obtained from the 3D reconstructions of GluA3WT mice. The error bar corresponds to ± standard deviation (SD). (D) Plots of the quantitative data from single ultrathin sections of the linear length of the PSD, major axis, and circularity of the ribbons, and the average size of synaptic vesicles (SVs)/synapse of GluA3WT mice. The error bar corresponds to ± SD; one-way Anova * p < 0.05, ns: not significant; Mann-Whitney two-tailed U-test, ** p < 0.01, *** p < 0.0001, ns: not significant.
-
Figure 3—source data 1
Data and statistical analysis for the ultrastuctural analysis of GluA3WT mice.
- https://cdn.elifesciences.org/articles/80950/elife-80950-fig3-data1-v2.zip
Figure 3—figure supplement 1
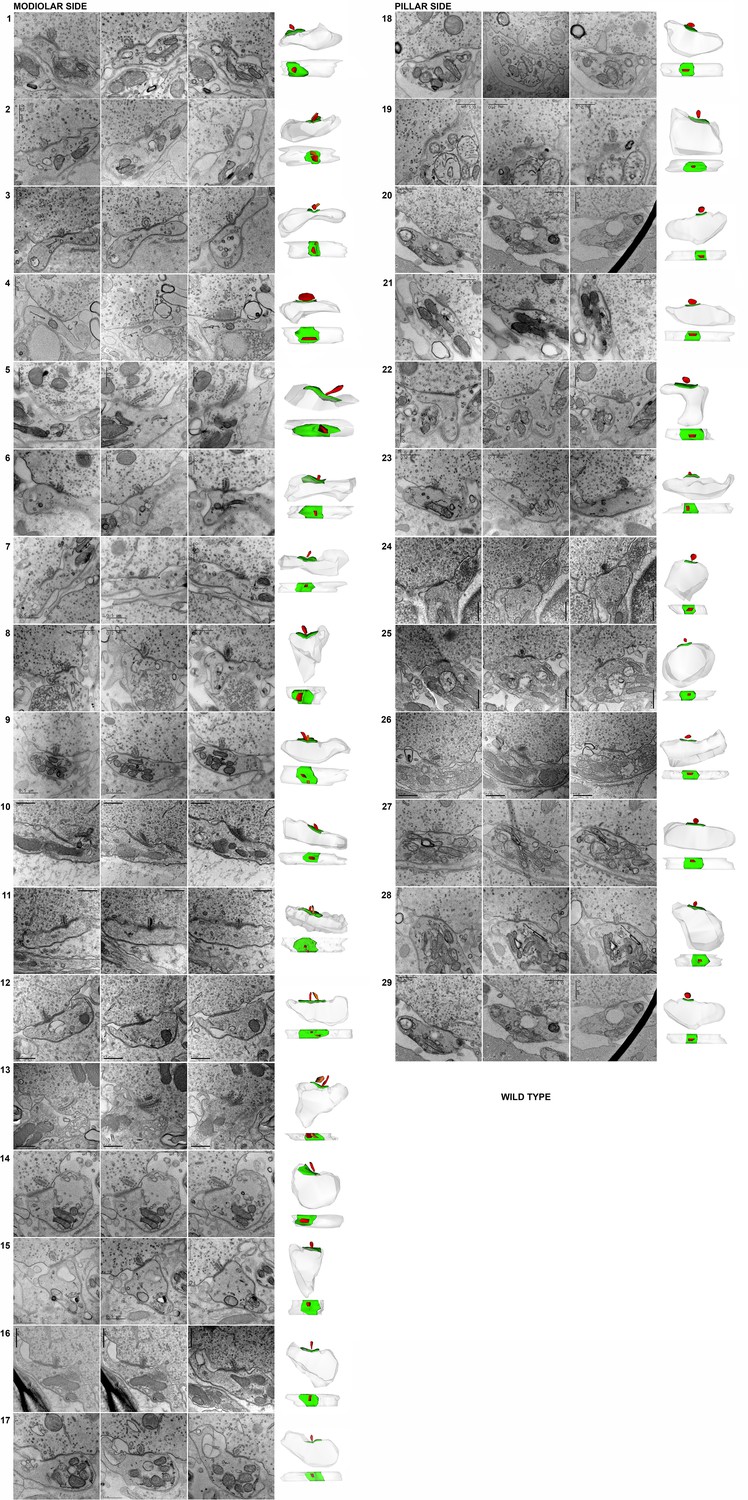
Representative serial electron micrographs and corresponding three-dimensional (3D) reconstructions of modiolar- or pillar-side inner hair cell (IHC)-ribbon synapses of the GluA3WT mice.
Synapses #10 and #24 correspond to the synapses shown in Figure 3. Scale bar: 0.5 μm.
Figure 4 with 1 supplement
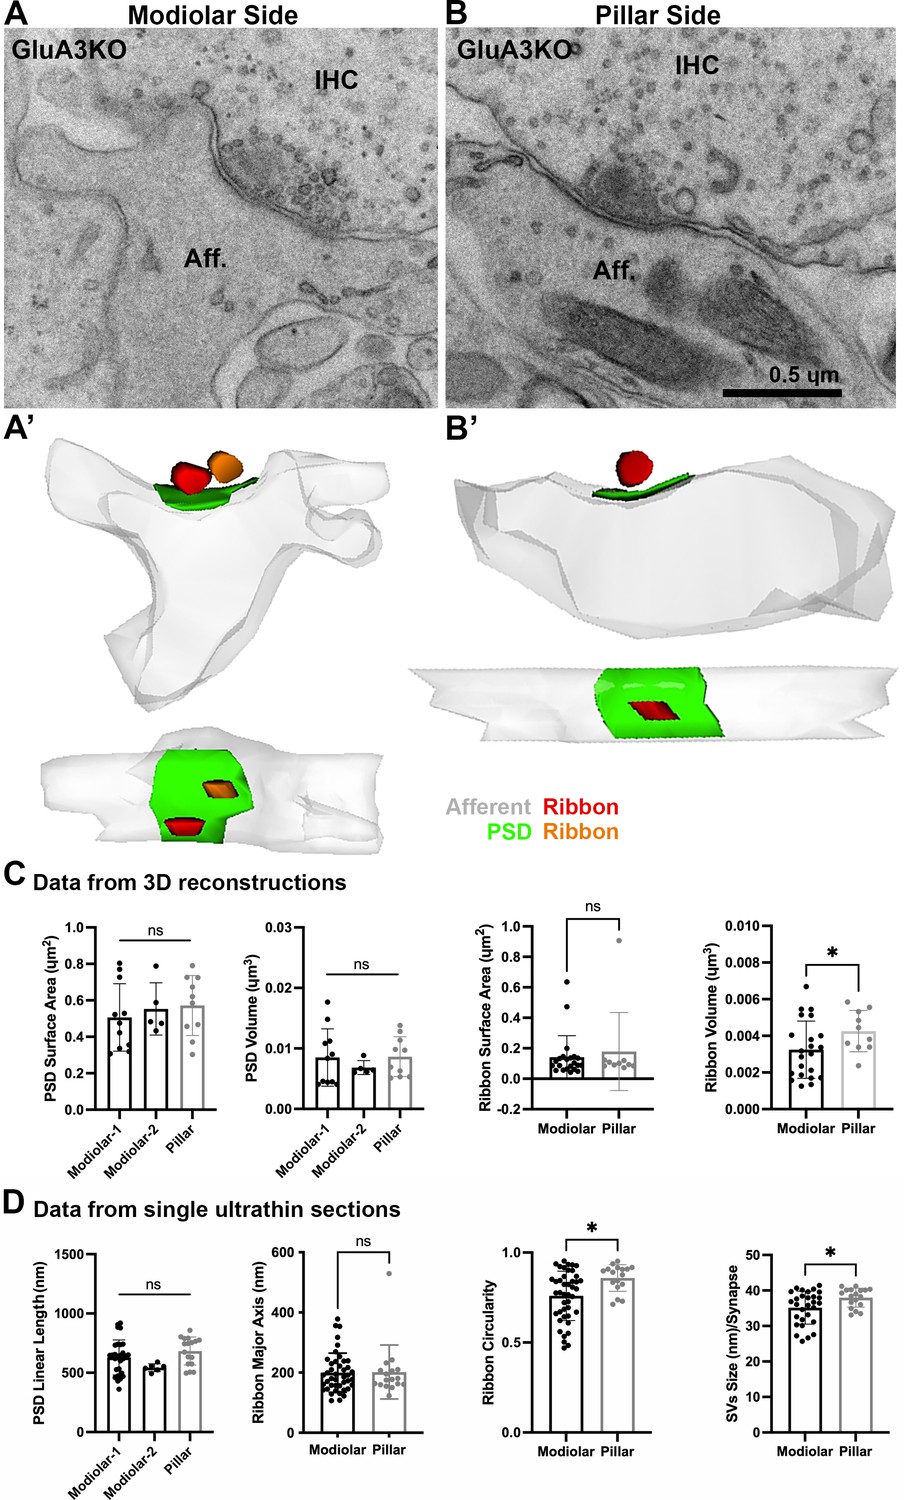
Ultrastructural features of GluA3KO IHC-ribbon mid-cochlear synapses.
Transmission electron microscopy (TEM) micrographs of IHC synapses on the modiolar (A) and pillar sides (B) of GluA3KO mice. Aff.: afferent; IHC: inner hair cell. Scale bar: 0.5 µm. (A’, B’) Three-dimensional reconstructions of the IHC-ribbon synapses are shown in A and B. Representative serial electron micrograph images of modiolar- and pillar-side ribbon synapses are shown in Figure 4—figure supplement 1. (C) Plots of the quantitative data of the surface area and volume of the postsynaptic densities (PSDs) and ribbons obtained from the 3D reconstructions of GluA3KO mice. The error bar corresponds to ± standard deviation (SD). (D) Plots of the quantitative data from single ultrathin sections of the linear length of the PSD, major axis and circularity of the ribbons and the average size of synaptic vesicles (SVs)/synapse of GluA3KO mice. The error bar corresponds to ± SD; one-way ANOVA, ns: not significant; Mann-Whitney two-tailes U-test, * p < 0.05, ns: not significant.
-
Figure 4—source data 1
Data and statistical analysis for the ultrastuctural analysis of GluA3KO mice.
- https://cdn.elifesciences.org/articles/80950/elife-80950-fig4-data1-v2.zip
Figure 4—figure supplement 1
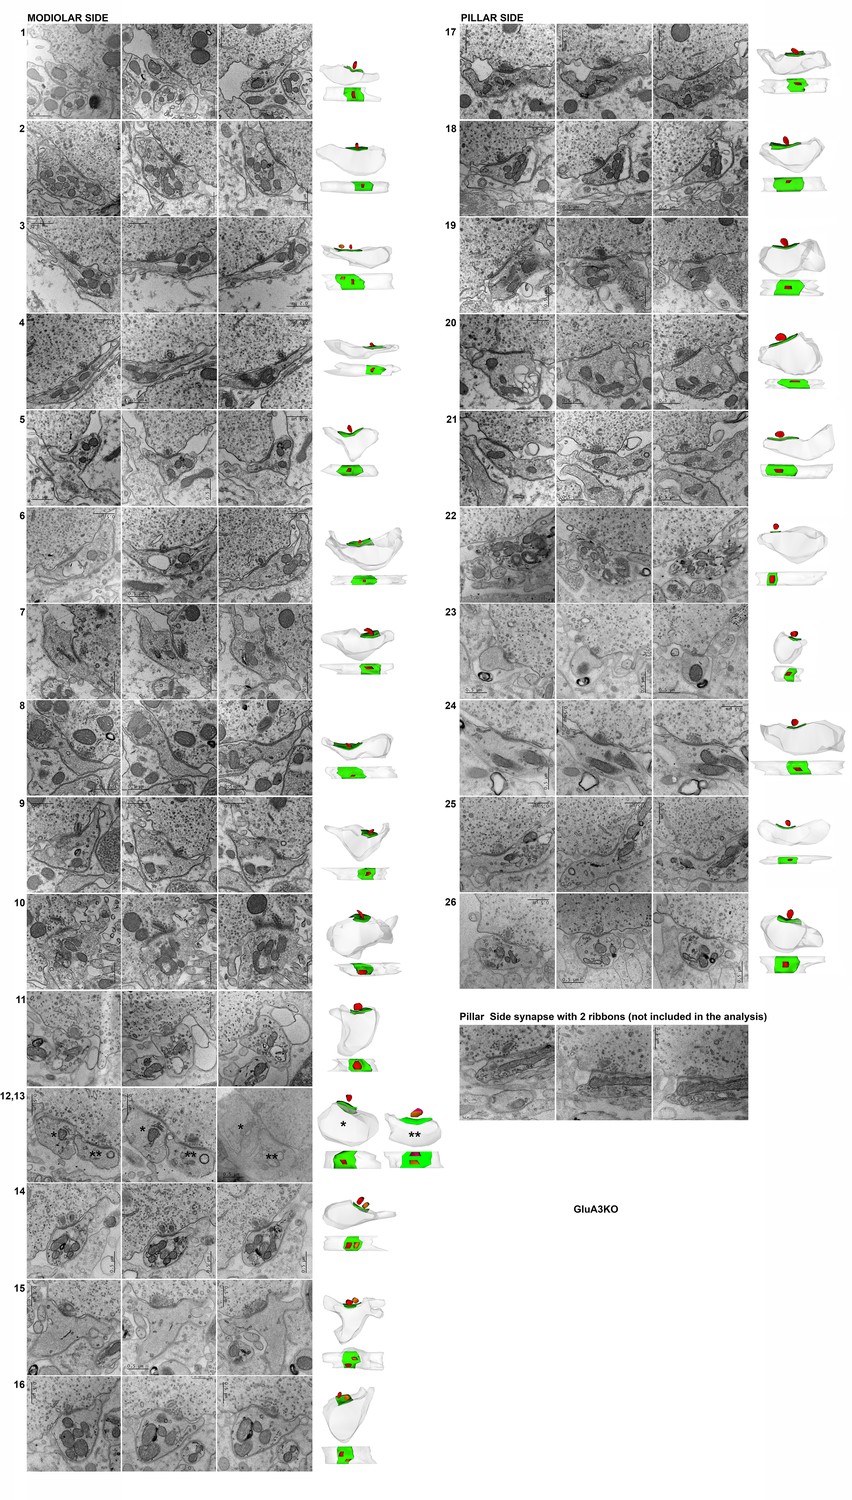
Representative serial electron micrographs and corresponding three-dimensional (3D) reconstructions of modiolar- or pillar-side inner hair cell (IHC)-ribbon synapses of the GluA3KO mice.
Synapses #15 and #24 correspond to the synapses shown in Figure 4. Representative serial electron micrographs of one pillar-side synapse with two ribbons; this synapse was not included in our analysis. Scale bar: 0.5 μm.
Figure 5
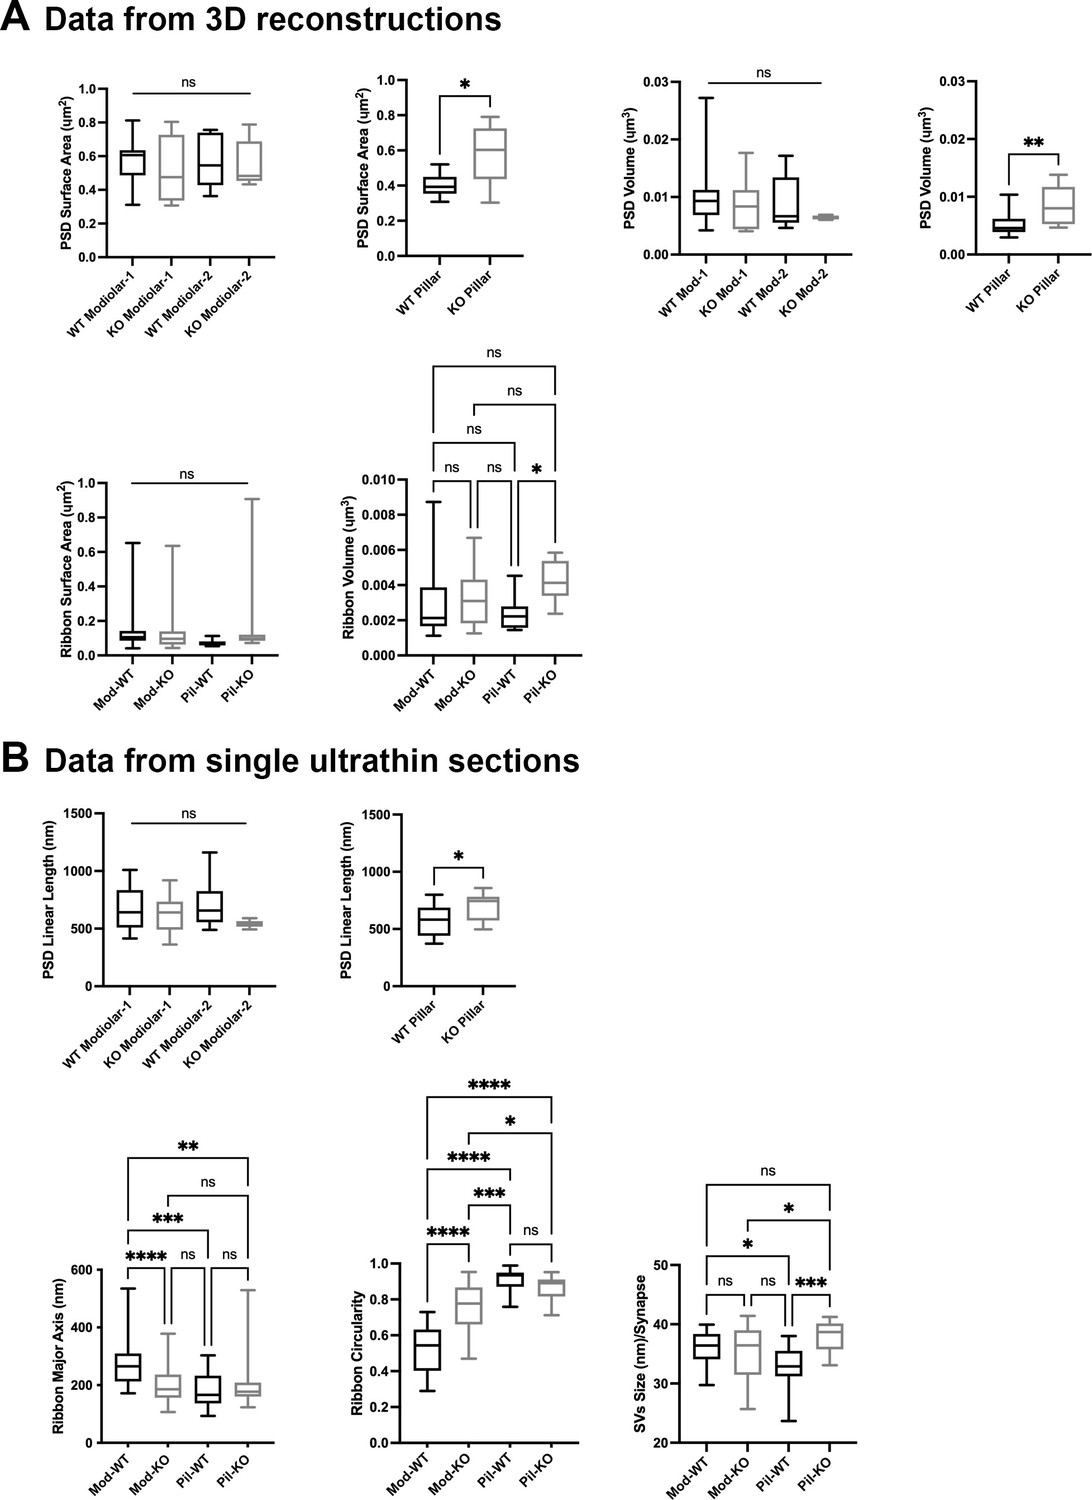
Inner hair cell (IHC) modiolar–pillar structural differences in presynaptic ribbon size, ribbon shape, and vesicle size seen in GluA3WT were diminished or reversed in GluA 3KO.
(A) Whisker plots show the quantitative data of the surface area and volume of the postsynaptic density (PSD) and ribbon volume of GluA3WT (black) and GluA3KO (gray) mice. The error bar corresponds to ± standard deviation (SD). (B) Whisker plots of the linear length of the PSD, major axis, and circularity of the ribbons of GluA3WT (black) and GluA3KO (gray) mice. Column histogram of the size of synaptic vesicles (SVs) of GluA3WT (black) and GluA3KO (gray). The error bar corresponds to ± SD; one-way ANOVA, * p < 0.05, ** p < 0.01, *** p < 0.005, p < 0.0001, ns: not significant; Mann-Whitney two-tailed U-test, * p < 0.05, ** p < 0.001.
-
Figure 5—source data 1
Data and statistical analysis for the comparison of the ultrastructural analysis of WT vs. GluA3KO mice.
- https://cdn.elifesciences.org/articles/80950/elife-80950-fig5-data1-v2.zip
Figure 6
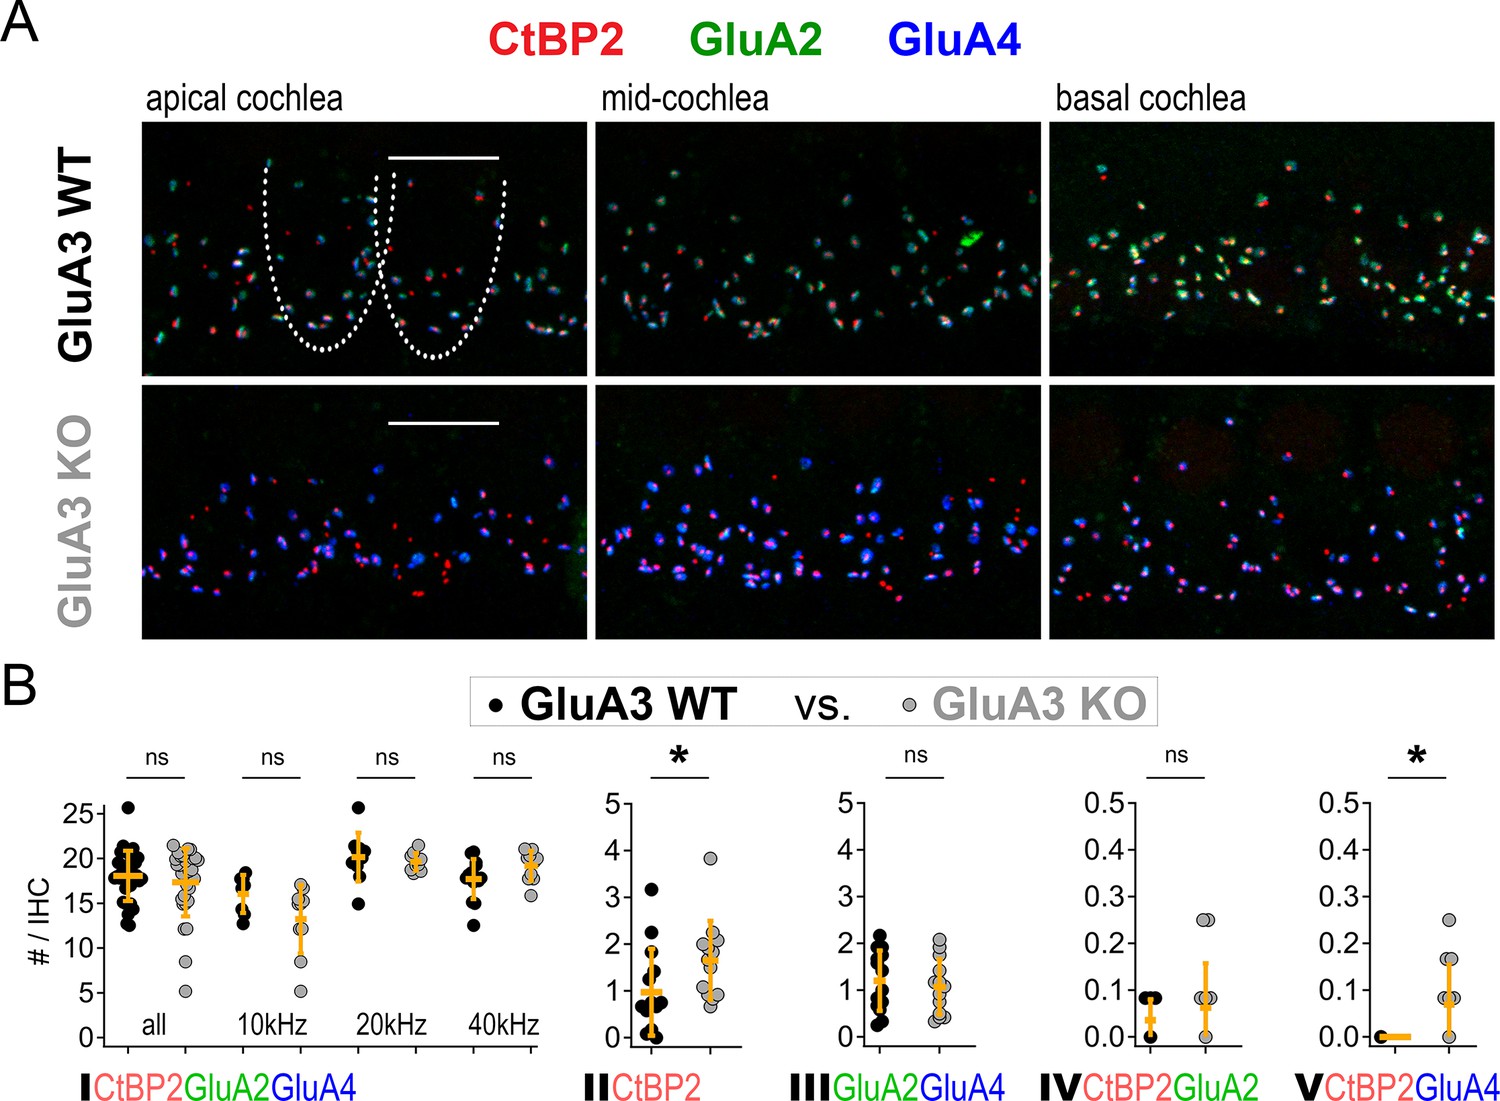
Inner hair cell (IHC)-ribbon synapse counts in 5-week-old male GluA3WT and GluA3KO mice.
(A) Confocal microscope immunofluorescence images of afferent ribbon synapses in organ of Corti whole-mount samples from GluA3WT (upper) and GluA3KO mice (lower) in the apical, middle, and basal cochlea (left, middle, and right). Anti-CtBP2 labels the Ribeye protein in presynaptic ribbons (red); Anti-GluA2 labels the postsynaptic α-amino-3-hydroxy-5-methyl-4-isoxazole propionic acid receptor (AMPAR) subunit encoded by the Gria2 gene (green); Anti-GluA4 labels the AMPAR subunit encoded by Gria4 (blue). Each subpanel displays synaptic puncta of approximately four IHCs. Scale bar: 10 µm. (B) Quantification of ribbon synapse numbers in images from GluA3WT (black: 2990 synapses; n = 32 images; 5 mice) and GluA3KO (gray: n = 2814 synapses; n = 30 images; 5 mice). Each point represents the mean number of synapses per IHC per image; approximately 12 IHCs per image and 6 images per cochlea. (I) Paired synapses per IHC were similar in number for the whole cochlea (p = 0.94, U: 484, nWT = 32, nKO = 30) and in each of three tonotopic regions centered at 10 kHz (p = 0.08, U: 59, nWT = 8, nKO = 10), 20 kHz (p = 0.41, U: 61, nWT = 10, nKO = 10), or 40 kHz (p = 0.10, U: 42, nWT = 14, nKO = 10). (II) Lone or ‘orphaned’ ribbons (CtBP2-only) were significantly more frequent in GluA3KO (p = 0.021, U: 44, nWT = 14, nKO = 13). (III) Ribbonless synapses (GluA2 + GluA4) were similar in number (p = 0.67, U: 100, nWT = 14, nKO = 13). (IV) Paired synapses lacking GluA4 (CtBP2 + GluA2) were similar in number (p = 0.81, U: 39, nWT = 7, nKO = 12). (V) Paired synapses lacking GluA2 (CtBP2 + GluA4) were observed in GluA3KO (p = 0.028, U: 21, nWT = 7, nKO = 12) but not in GluA3WT. Mann-Whitney two-tailed U-test; * p < 0.05, ns: not significant.
-
Figure 6—source data 1
Confocal data and statistics of synapse counts for GluA3WT and GluA3KO.
- https://cdn.elifesciences.org/articles/80950/elife-80950-fig6-data1-v2.zip
Figure 7

Alteration of α-amino-3-hydroxy-5-methyl-4-isoxazole propionic acid receptor (AMPAR) subunit expression in GluA3KO mice.
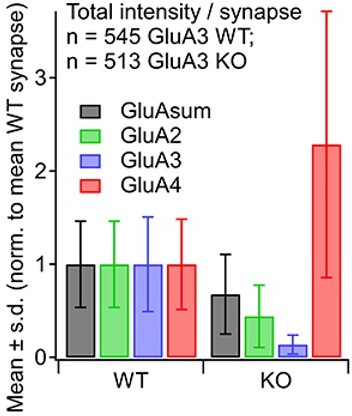
(A) From images like in Figure 2: Summed pixel intensity per synapse (raw values, a.u.) for GluA2 (green), GluA4 (blue), and GluASum (black). In each subpanel, GluA3WT is on left and GluA3KO is on right. Bars show mean ± standard deviation (SD); n = 3 mid-cochlear images per genotype, assessed further in panels E–H. (B) Volume analysis of two exemplar images showing GluA4 vs. GluA2 volume per synapse (µm3) in the mid-cochlea of GluA3WT (black, n = 148 synapses) and GluA3KO (gray, n = 166 synapses). The distribution of GluA4 and GluA2 puncta are shifted to smaller volumes in GluA3KO, although the upper ranges are unchanged. (C) Intensity analysis of the synapses in panel B (summed pixel intensity per synapse) reveals an increase in GluA4 and decrease in GluA2 immunofluorescence in GluA3KO. Intensity values were normalized to the maximum synapse intensity for GluA4. (D) Volume (µm3) vs. summed pixel intensity (norm.) per synapse for GluA3WT (filled circles) and GluA3KO (open circles) for GluA2, 3, and 4 puncta (green, blue, and red). The positive correlation is slightly sublinear. (E) Intensity analysis (sum of pixel intensities per synapse) of postsynaptic puncta grouped from GluA3WT (n = 545 synapses from 3 images) or GluA3KO cochlea (n = 513 synapses from 3 images) shows reduction of overall GluA intensity (GluASum = GluA2 + GluA3 + GluA4, gray) and reduction in GluA2 intensity (green) with increase in GluA4 intensity (red) in GluA3KO. Data are normalized to the mean WT synapse intensity per group for GluA2, GluA4, or GluASum. (F) Normalized data as in panel E displayed as cumulative distributions for GluA3WT (solid line) and GluA3KO (dashed lines). The overall intensity in GluA3KO (black dashed line, GluASum) is reduced relative to GluA3WT (solid black line) due to lack of GluA3 and reduction in GluA2 (green) despite the relatively large increase in GluA4 (red). (G) GluA puncta volume analysis reveals a reduction of GluA2 and GluA4 volume per synapse in GluA3KO relative to GluA3WT. Data are normalized to the mean WT synapse volume per group for GluA2, GluA4, or GluASum. (H) Data in panel G displayed as cumulative distributions. Instead of normalizing to the WT group mean as in panels E–G, here data were normalized to each image mean to visualize differences in the shape of the distributions between GluA3WT and GluA3KO.
Figure 8 with 1 supplement

Modiolar- and pillar-side volume, intensity, and density of presynaptic ribbon and postsynaptic α-amino-3-hydroxy-5-methyl-4-isoxazole propionic acid receptor (AMPAR) subunits.
(A) Quantification of CtBP2, GluA2, or GluA4 mean volume per image for GluA3WT (black, n = 2990 synapses from 14 images) compared to GluA3KO (gray, n = 2814 synapses from 14 images). Each point represents an image mean. Gold bars are mean ± standard deviation (SD). For CtBP2, there is an overall reduction in volume in GluA3KO (p = 0.008, U: 144, nWT = 14, nKO = 13). For GluA2, the overall volume reduction in GluA3KO (p = 0.0001, U: 168, nWT = 14, nKO = 13) resulted from smaller puncta on the pillar side of GluA3KO relative to GluA3WT (p = 0.0083; U: 90, nWT = 7, nKO = 10) but not on the modiolar side (p = 0.063). For GluA4, the overall volume reduction in GluA3KO (p = 4.9e−6; U: 176, nWT = 14, nKO = 13) resulted from smaller puncta on the pillar side of GluA3KO (p = 0.0004; U: 96, nWT = 7, nKO = 10) and on the modiolar side of GluA3KO (p = 0.0058; U: 62, nWT = 7, nKO = 10) relative to GluA3WT. See Figure 8—figure supplement 1. (B) Quantification of median intensities per image for data in panel A. CtBP2 intensity increased in GluA3KO (p = 0.0001; U: 17, nWT = 14, nKO = 13); GluA2 intensity decreased in GluA3KO (p = 0.01; U: 143, nWT = 14, nKO = 13); and GluA4 intensity decreased in GluA3KO (p = 5e−6; U: 6, nWT = 14, nKO = 13). (C) Increase in CtBP2 (p = 5e−5; U: 14, nWT = 14, nKO = 13) and GluA4 median density per synapse (p = 5e−6; U: 6, nWT = 14, nKO = 13) in GluA3KO relative to GluA3WT, but not GluA2 (p = 0.63; U: 101, nWT = 14, nKO = 13). (D) Increase in GluA4:GluA2 intensity ratio in GluA3KO relative to GluA3WT (p = 6e−7; U: 0, nWT = 14, nKO = 13). Mann-Whitney two-tailed U-test; ** p < 0.01, *** p < 0.001, ns: not significant.
-
Figure 8—source data 1
Confocal data and statistics of synapse volumes and intensities for GluA3WT and GluA3KO.
- https://cdn.elifesciences.org/articles/80950/elife-80950-fig8-data1-v2.zip
Figure 8—figure supplement 1
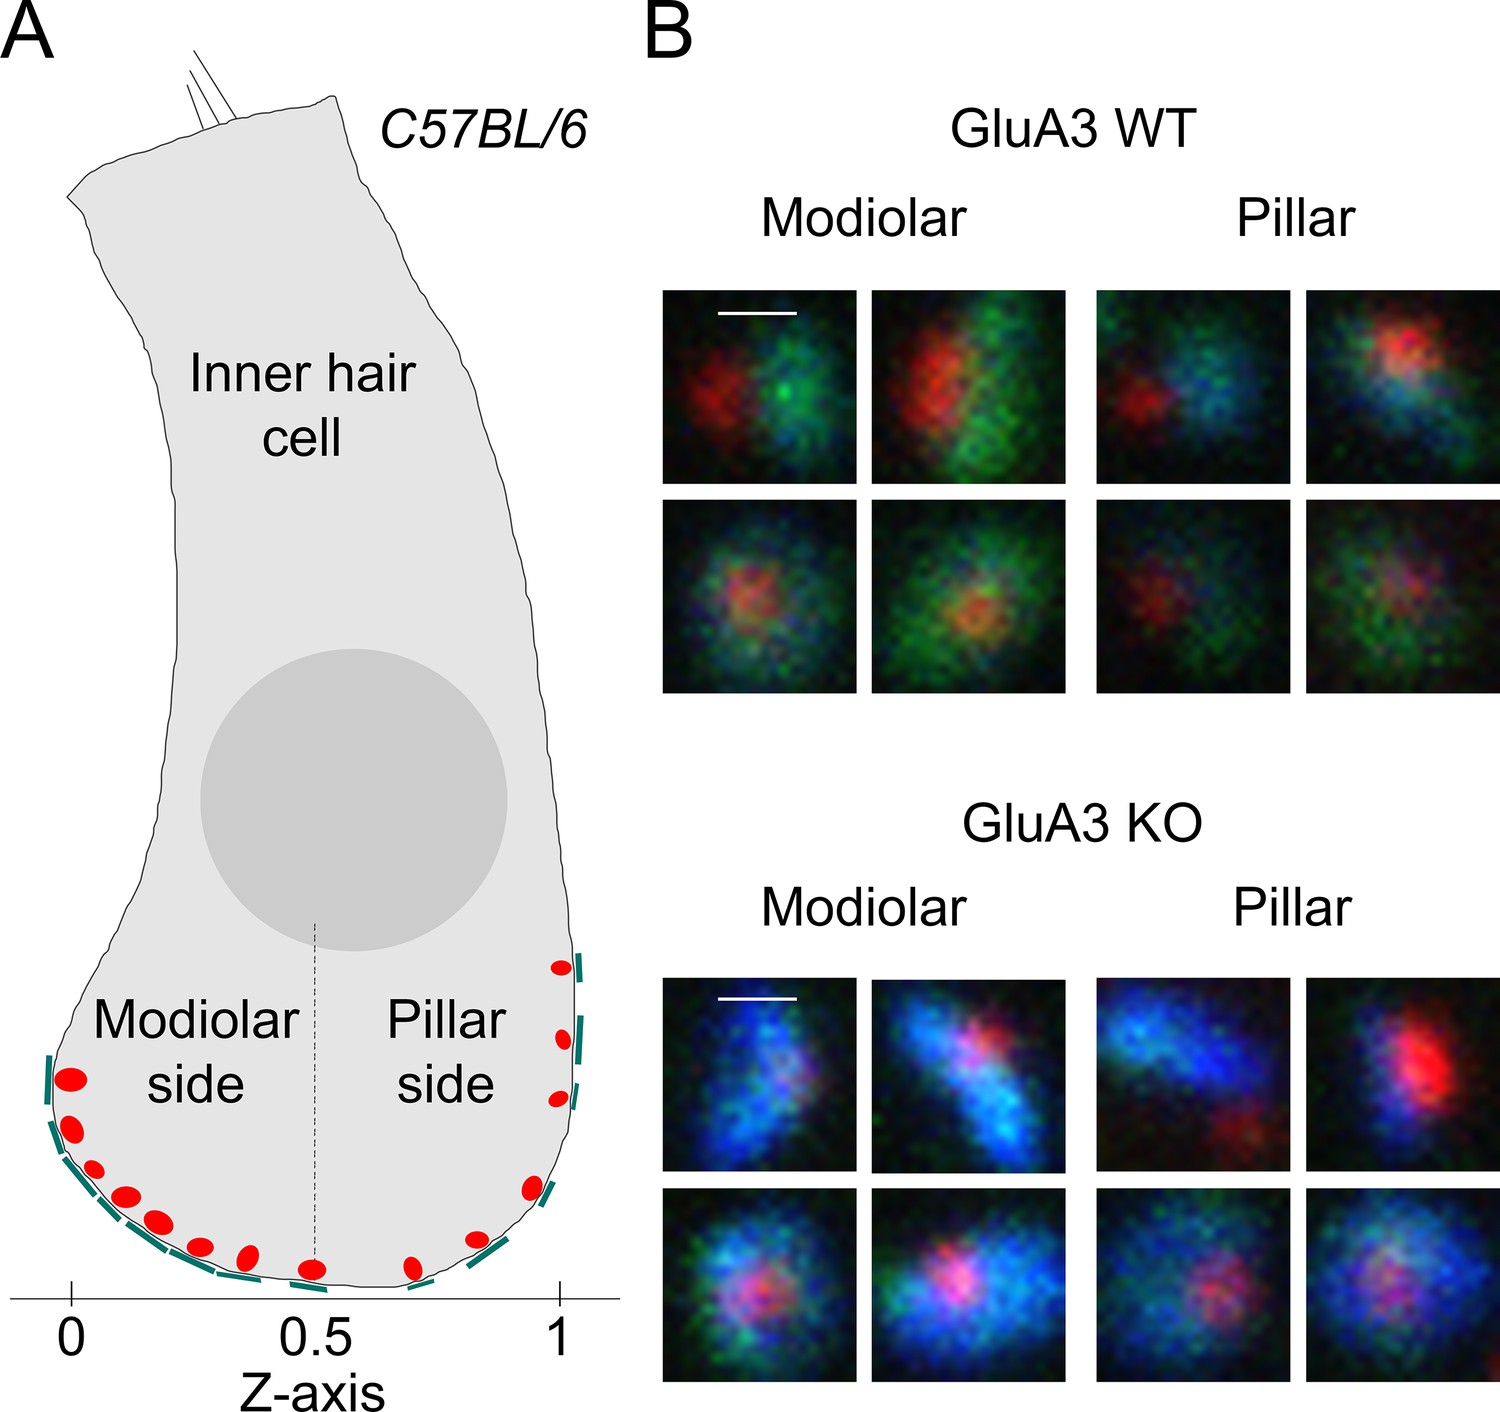
Modiolar-, pillar-side groupings and example synapses from GluA3WT and GluA3KO.
(A) Schematic of an inner hair cell (IHC) when mounted with long axis parallel to the glass coverslip, such that the modiolar–pillar dimension of the cell is orthogonal to the coverslip. Per image, the synapses were divided into modiolar and pillar groups on either side of a dividing line defined by the midway point of the spatial extent of synapses in the modiolar–pillar dimension (Z-axis) of the image volume. (B) Examples of modiolar- and pillar-side synapses in GluA3WT (upper) and GluA3KO (lower). (C) Examples of modiolar- and pillar-side synapses in GluA3KO.
Figure 9
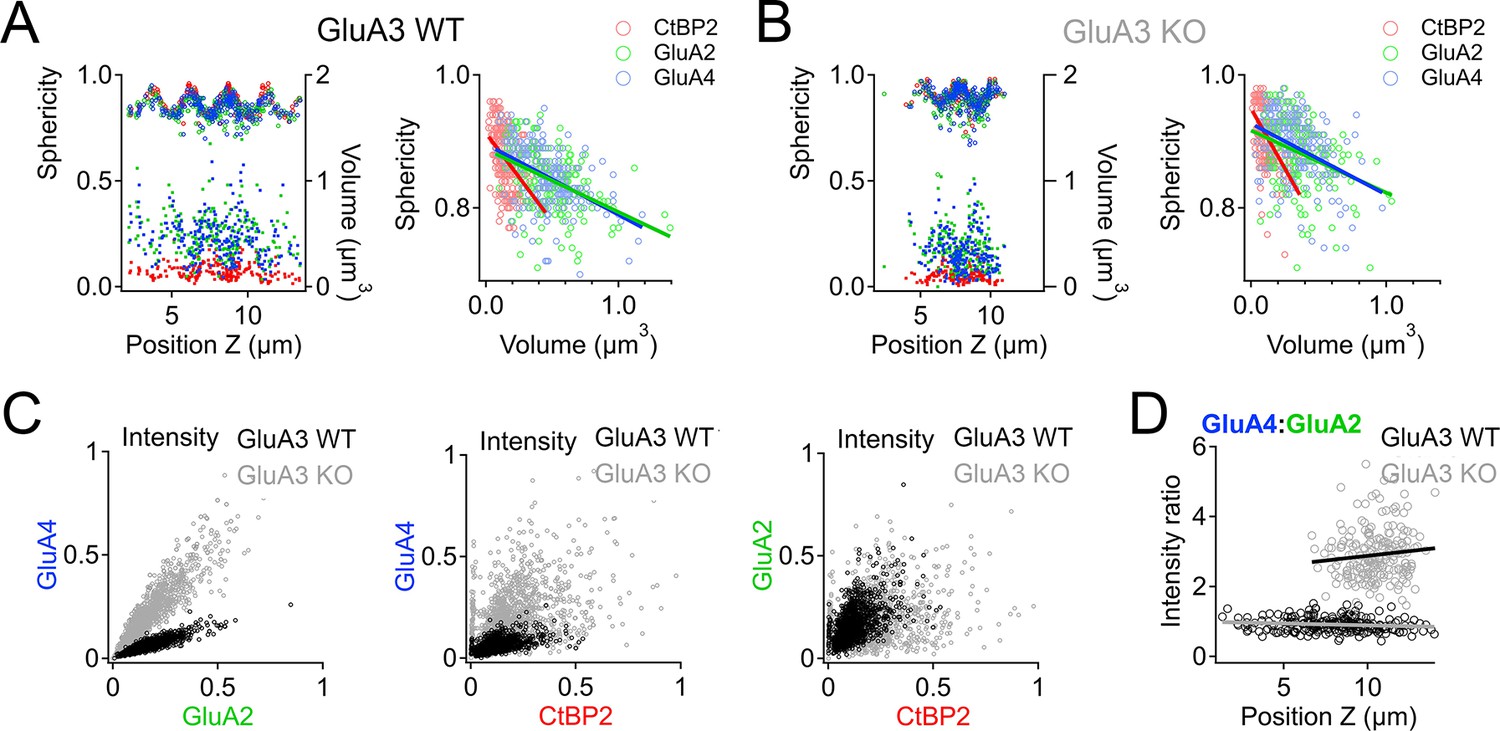
Spatial trends of synapse sphericity, volume, and α-amino-3-hydroxy-5-methyl-4-isoxazole propionic acid receptor (AMPAR) subunit relative abundance in the organ of Corti.
(A) Volume and sphericity per synapse vs. Z-axis position for an exemplar GluA3WT image from Figure 7 showing spatial oscillations in CtBP2, GluA2, and GluA4. Right: Inverse relationship between synapse sphericity and volume for CtBP2, GluA2, and GluA4. (B) For GluA3KO, as in panel A. (C) Left: Normalized intensity of GluA4 vs. normalized intensity of GluA2 for GluA3WT (black) and GluA3KO (gray). Center: Normalized intensity of GluA4 vs. normalized intensity of CtBP2. Right: Normalized intensity of GluA2 vs. normalized intensity of CtBP2. (D) GluA4:GluA2 intensity ratio vs. Z-axis position. Panels C and D for six WT and six KO images from the mid-cochlea.
Author response image 1
Additional files
Download links
A two-part list of links to download the article, or parts of the article, in various formats.
Downloads (link to download the article as PDF)
Open citations (links to open the citations from this article in various online reference manager services)
Cite this article (links to download the citations from this article in formats compatible with various reference manager tools)
GluA3 subunits are required for appropriate assembly of AMPAR GluA2 and GluA4 subunits on cochlear afferent synapses and for presynaptic ribbon modiolar–pillar morphology
eLife 12:e80950.
https://doi.org/10.7554/eLife.80950


