Nuclear export inhibition jumbles epithelial–mesenchymal states and gives rise to migratory disorder in healthy epithelia
- Department of Biomedical Engineering, Washington University in St. Louis, United States
- Department of Computer Science and Engineering, Washington University in St. Louis, United States
- Department of Mechanical Engineering and Materials Science, Washington University in St. Louis, United States
Figures
Figure 1
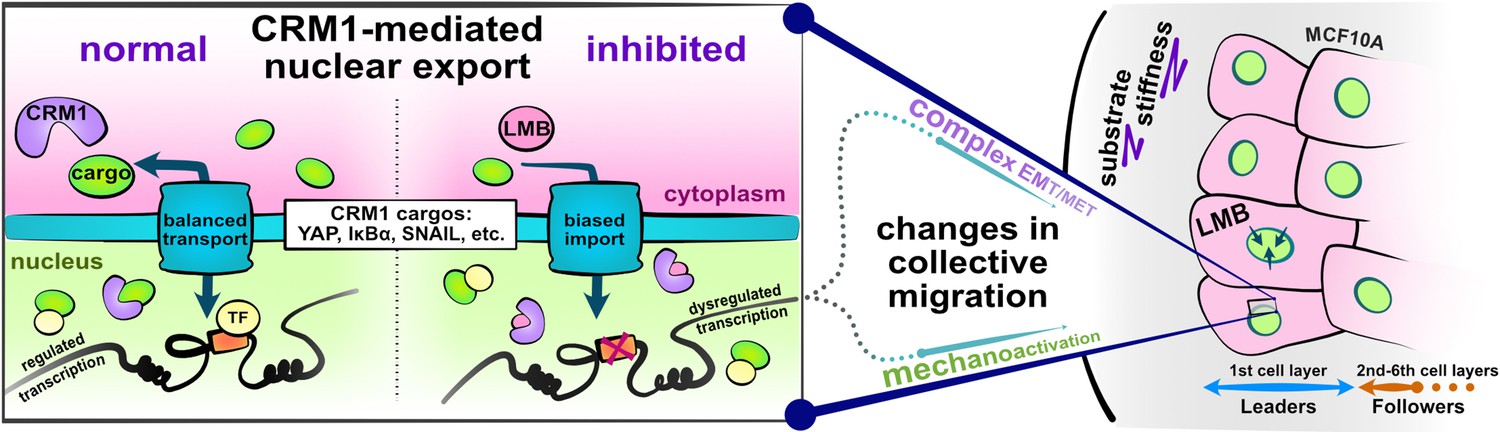
Schematic depicting experimental design and study hypotheses.
The enlarged panel illustrates normal nucleocytoplasmic transport and accompanying well-regulated gene transcription (left). Changes following CRM1 inhibition (right) enable examination of the interaction between opposing epithelial–mesenchymal transition (EMT)-related proteins in the development of collective cell phenotypes and migration characteristics. Depicted cells denote the experimental setup: MCF10A epithelial monolayers on polyacrylamide gels of varying stiffness, where leptomycin B is used to inhibit CRM1-mediated nuclear export.
Figure 2
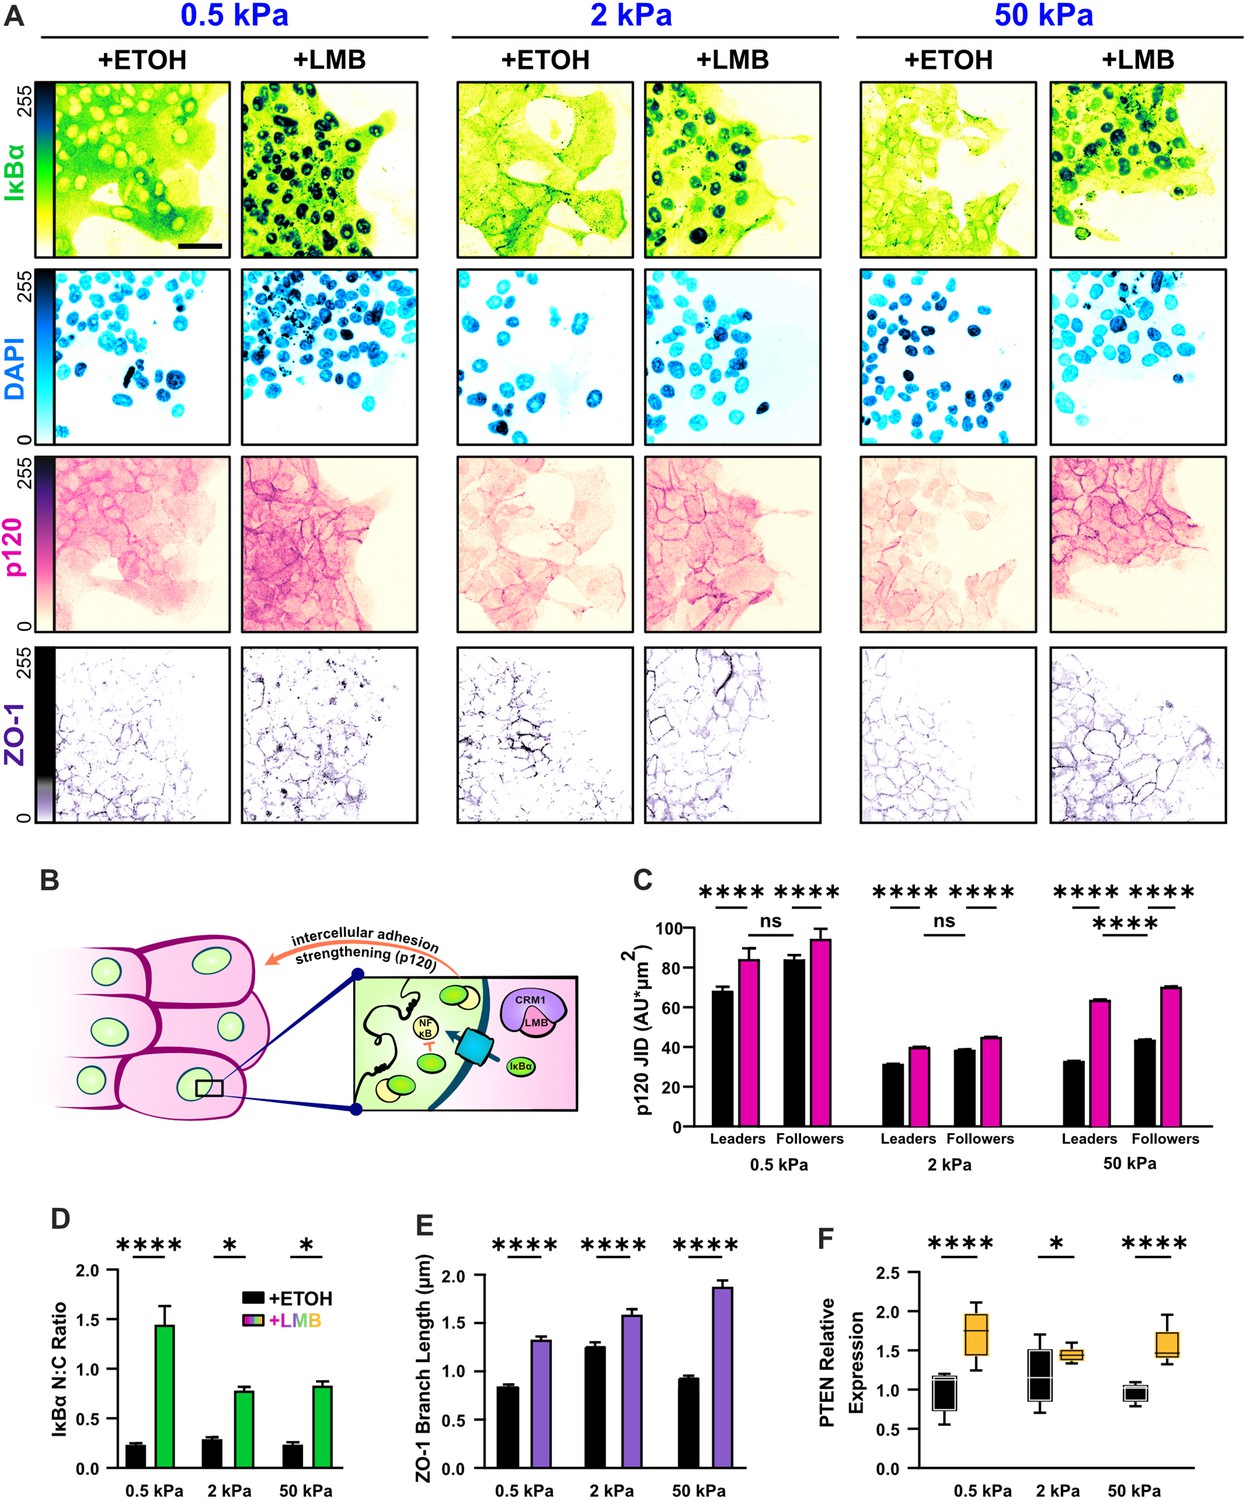
Nuclear export inhibition (NEI) enriches epithelial features in MCF10A collectives.
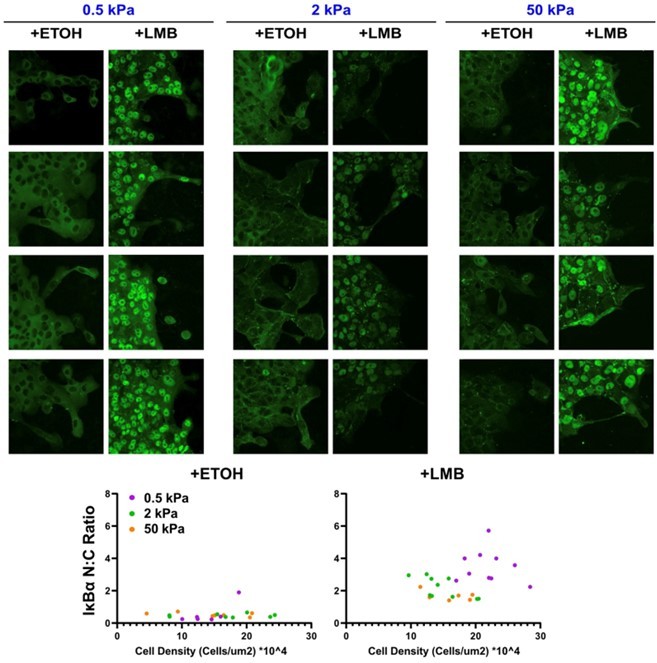
(A) Representative images for epithelial characteristics of WT MCF10A on 0.5, 2, and 50 kPa polyacrylamide gels. Monolayers were treated with ethanol (ETOH) as vehicle or leptomycin B (LMB) for NEI. Images depict nucleocytoplasmic localization of IκBα (left), p120 expression (middle), and DAPI (4′,6-diamidino-2-phenylindole) nuclear signal (right). (B) Schematic illustrating the established relationship between LMB and cell–cell adhesion strengthening, where nuclear accumulation of IκBα promotes inhibition of NFκB. (C) Leader–follower changes in p120 junction integrated density (JID) (n > 39 leaders and 55 followers). (D) Nucleocytoplasmic (N:C) ratio for IκBα (n = 8). (E) ZO-1 branch length (n > 4500). (F) Relative gene expression for epithelial marker PTEN (n = 12). Data were analyzed using a two-way analysis of variance (ANOVA) to evaluate NEI and stiffness effects. Data were analyzed using a three-way ANOVA with Tukey post hoc analyses to evaluate NEI, stiffness, and leader–follower differences. Significance levels: * < .0332, **** < 0.0001. Bars represent mean ± standard error of the mean (SEM). Scale bar: 50 μm.
Figure 3 with 3 supplements

Mechanoactive and mesenchymal features develop in MCF10A epithelia during nuclear export inhibition (NEI).
(A–C) Relative gene expression for mesenchymal markers ZEB1, SNAIL1, and TWIST1 on 0.5, 2, and 50 kPa polyacrylamide gels. (D) Representative images for mesenchymal characteristics of WT MCF10A across stiffness. Monolayers were treated with ethanol (ETOH) as vehicle or leptomycin B (LMB) for NEI. Images depict vimentin expression, nucleocytoplasmic localization of YAP, phosphorylated myosin light chain (pMLC) expression, and F-actin. (E) Vimentin integrated density, expressed per cell (n = 10), (F) nucleocytoplasmic (N:C) ratio for YAP (n > 55 leaders and 220 followers), (G) pMLC intensity (n = 8), and (H) actin coherency (n > 1000) for all stiffnesses. Data were analyzed using a two-way analysis of variance (ANOVA) with Tukey post hoc analyses to evaluate NEI and stiffness effects. Significance levels: ** < 0.0021, *** < .0002, **** < 0.0001. Bars represent mean ± standard error of the mean (SEM). Scale bar: 50 μm.
Figure 3—figure supplement 1
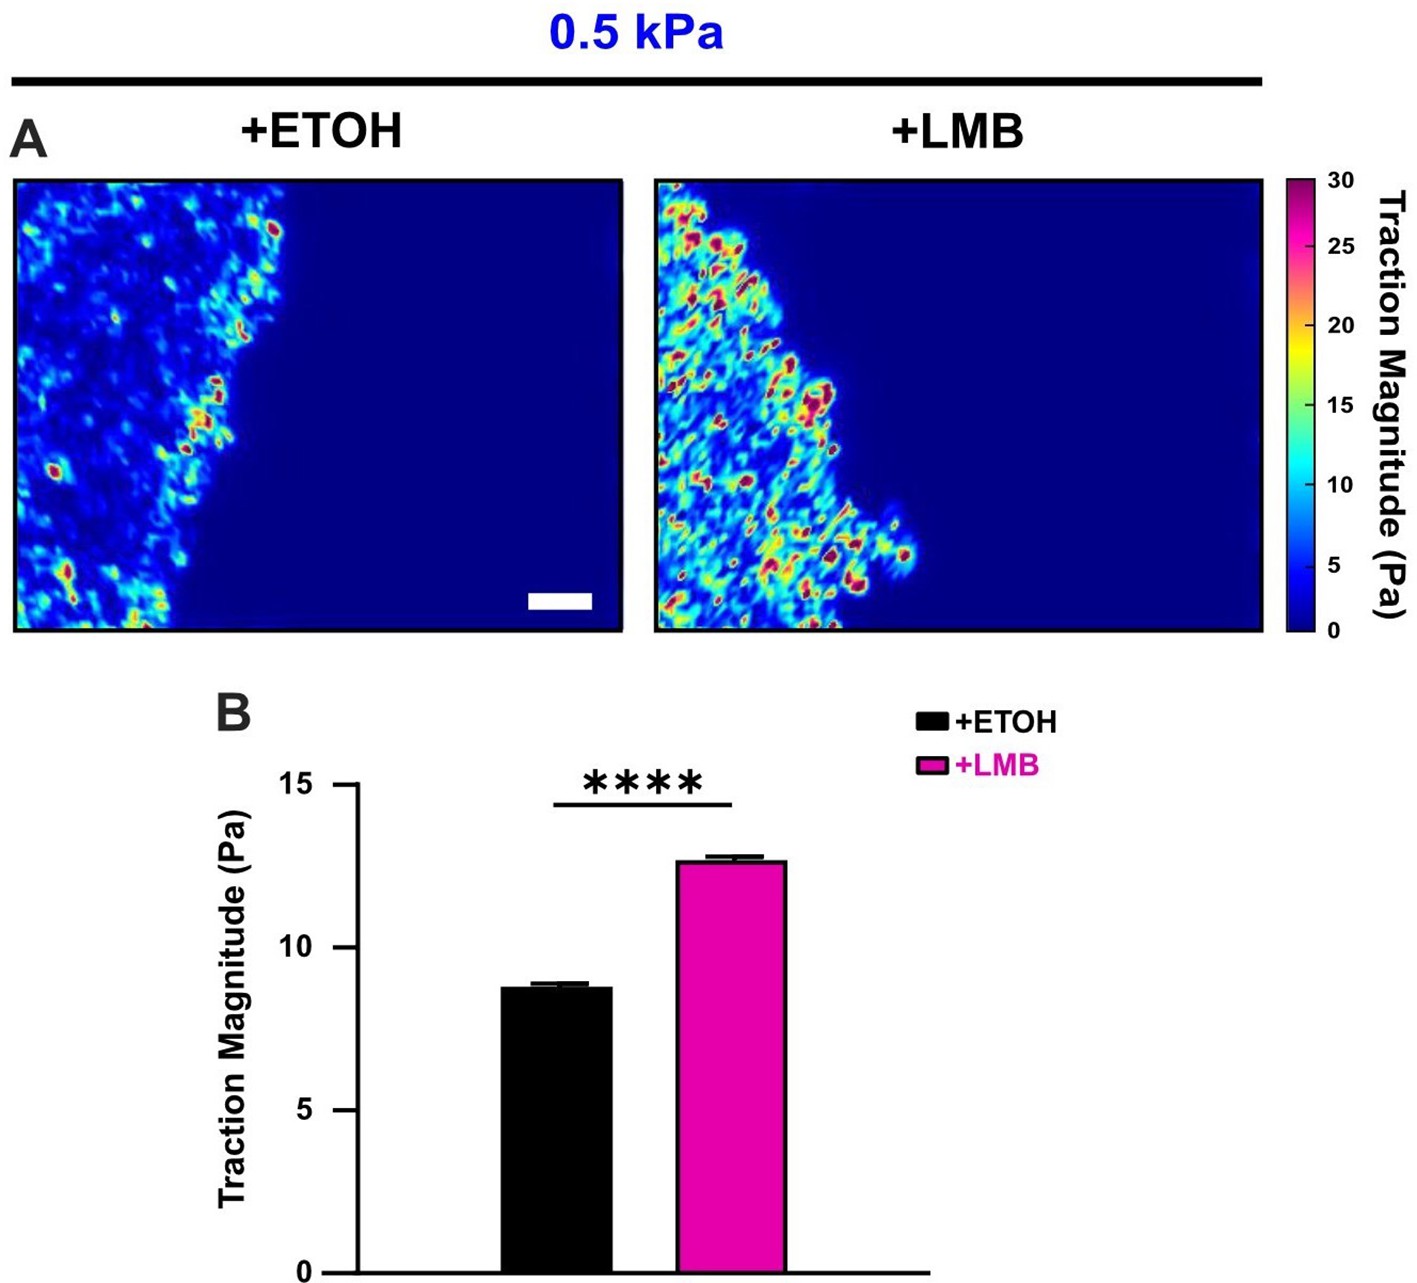
Nuclear export inhibition (NEI) increases cell-generated tractions.
(A) Traction heat maps and (B) quantified tractions for vehicle (n = 11)- and NEI (n = 15)-treated cells on 0.5 kPa polyacrylamide gel. Differences were assessed via two-tailed t-test. Significance level: **** < 0.0001. Bars represent mean ± standard error of the mean (SEM). Scale bar: 100 μm.
Figure 3—figure supplement 2
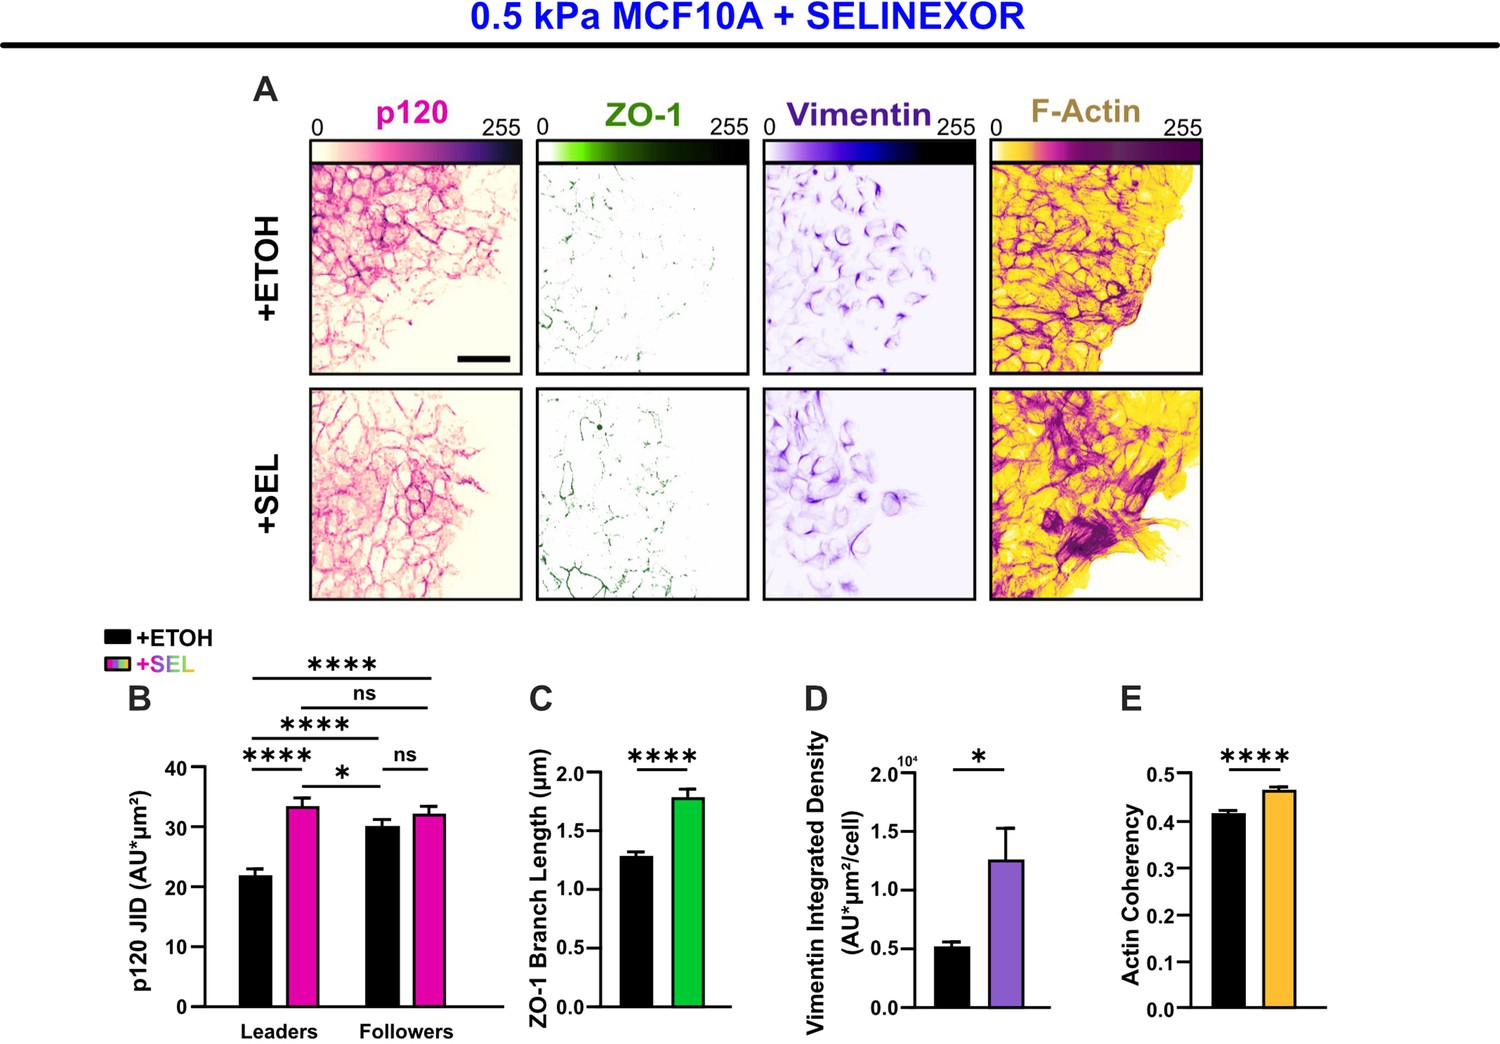
The alternate nuclear export inhibition (NEI)-promoting drug, Selinexor, reproduces the concurrent phenotype in WT MCF10A cells.
(A) Epithelial characteristics for MCF10A cells treated with vehicle or Selinexor (left). Images depict p120 and ZO-1 expression. Mesenchymal characteristics (right). Images depict vimentin expression and F-actin fiber orientation. Quantification comparing (B) changes in p120 junction integrated density (JID) (n = 56 leaders and 56 followers per condition), (C) ZO-1 branch length (n > 6500), (D) vimentin expression (n = 10), and (E) actin coherency (n > 1600). p120 data were analyzed using a two-way analysis of variance (ANOVA) with Tukey post hoc analyses to evaluate NEI and leader–follower effects. All other data were analyzed via two-tailed unpaired t-test to determine differences arising from NEI. Significance levels: * < .0332, **** < 0.0001. Bars represent mean ± standard error of the mean (SEM). Scale bars: 50 μm.
Figure 3—figure supplement 3
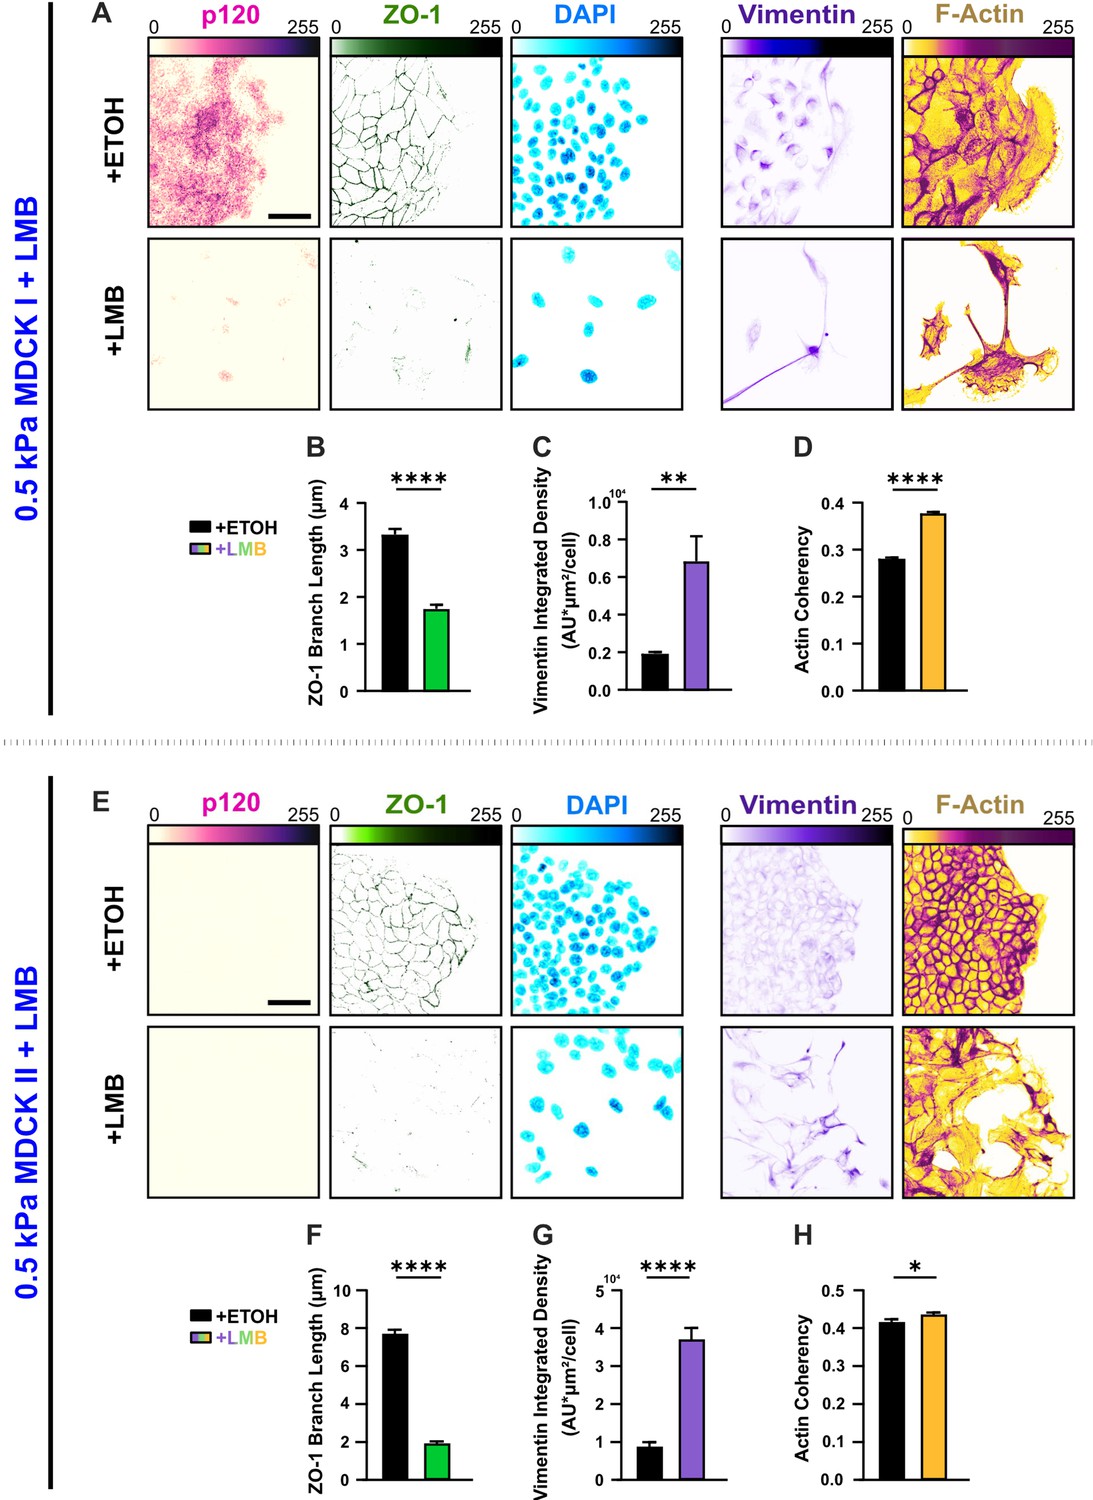
Distinct cell types undergo diverse E-M responses to nuclear export inhibition (NEI).
(A) Epithelial characteristics for MDCK I cells treated with vehicle or leptomycin B (LMB) (left). Images depict p120 and ZO-1 expression with corresponding DAPI nuclear signal. Mesenchymal characteristics (right). Images depict vimentin expression and F-actin fiber orientation. Quantification comparing (B) ZO-1 branch length (n > 3300), (C) vimentin expression (n > 10), and (D) actin coherency (n > 4100). (E) Epithelial characteristics for MDCK II cells treated with LMB (left). Images depict p120 and ZO-1 expression with corresponding DAPI nuclear signal. p120 expression was below detectable limits for untreated and treated groups. Mesenchymal characteristics (right). Images depict vimentin expression and F-actin fiber orientation. Quantification comparing (F) ZO-1 branch length (n > 2000), (G) vimentin expression (n = 10), and (H) actin coherency (n > 500). Data were analyzed via two-tailed unpaired t-test to determine differences arising from NEI. Significance levels: * < .0332, ** < 0.0021, **** < 0.0001. Bars represent mean ± standard error of the mean (SEM). Scale bars: 50 μm.
Figure 4
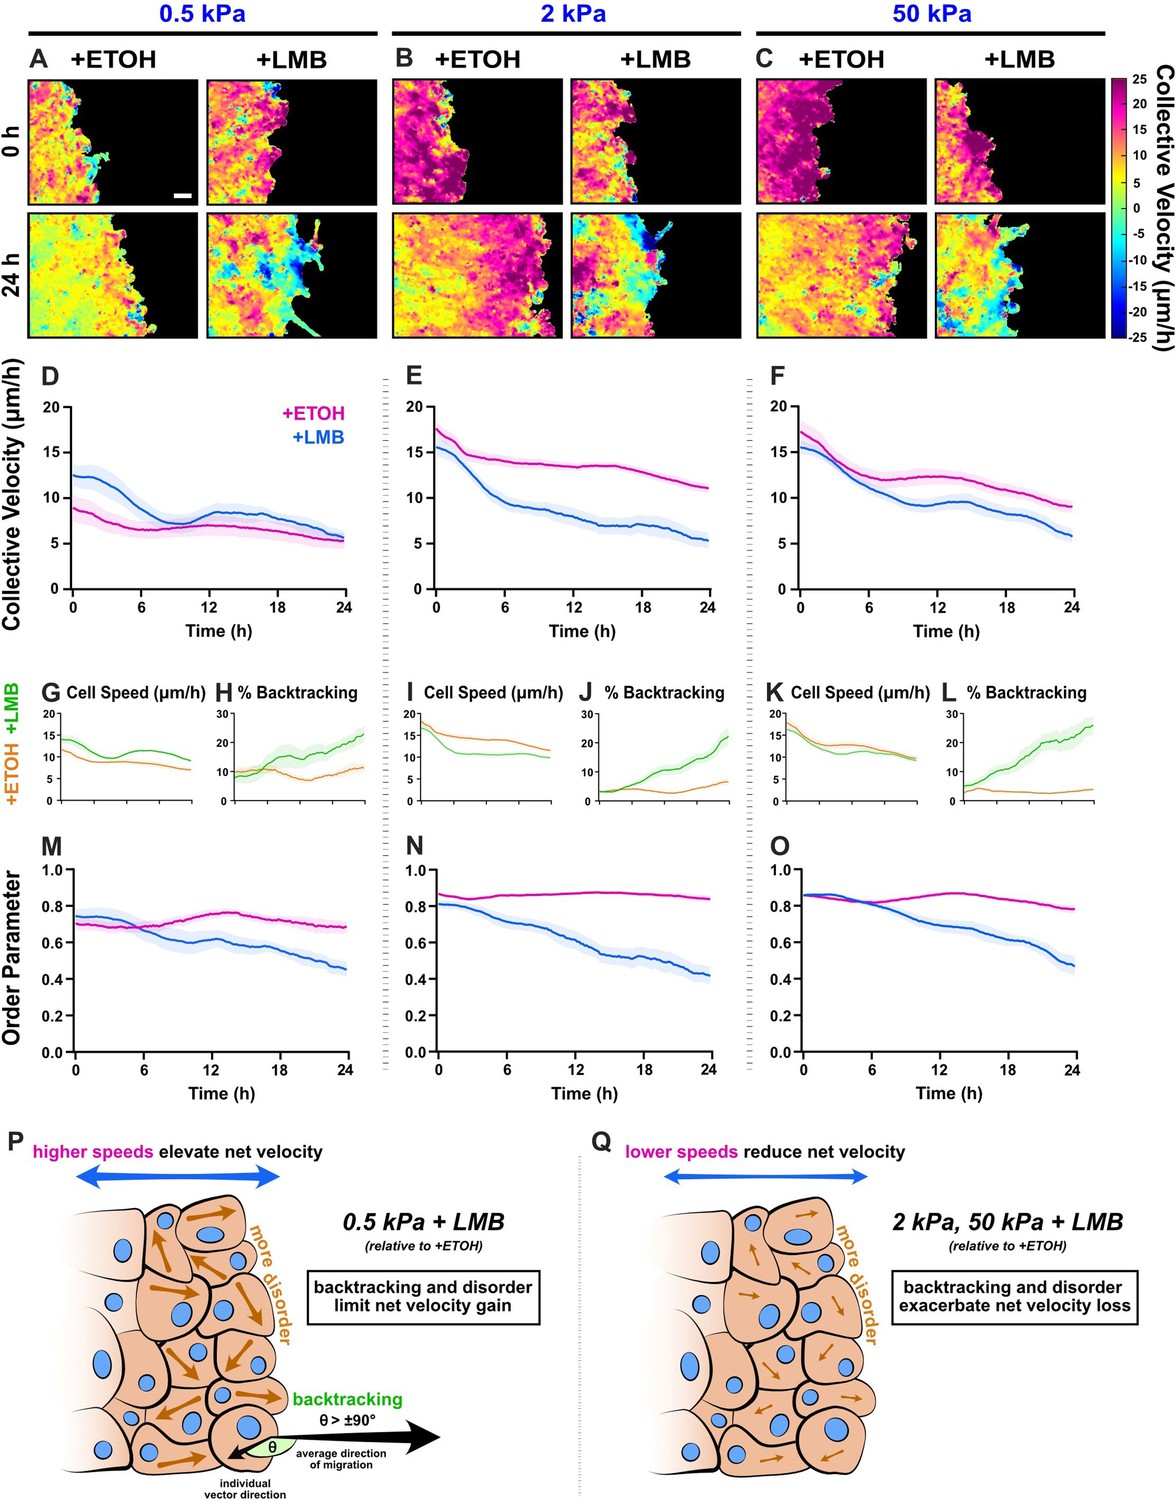
Collective migration changes from nuclear export inhibition (NEI) are stiffness dependent.
Velocity heat maps generated from particle image velocimetry analysis of 24 hr migration for (A) 0.5 kPa, (B) 2 kPa, and (C) 50 kPa (n ≥ 6). (D–F) Respective quantifications of net velocity over time. Average speeds for (G) 0.5 kPa, (I) 2 kPa, and (K) 50 kPa, along with the % of backtracking vectors (H, J, L), respectively. Order parameter for (M) 0.5 kPa, (N) 2 kPa, and (O) 50 kPa. Schematics describing how NEI changes migration characteristics for (P) 0.5 kPa and (Q) 2 and 50 kPa. Lines represent mean ± standard error of the mean (SEM). Scale bar: 100 μm.
Figure 5
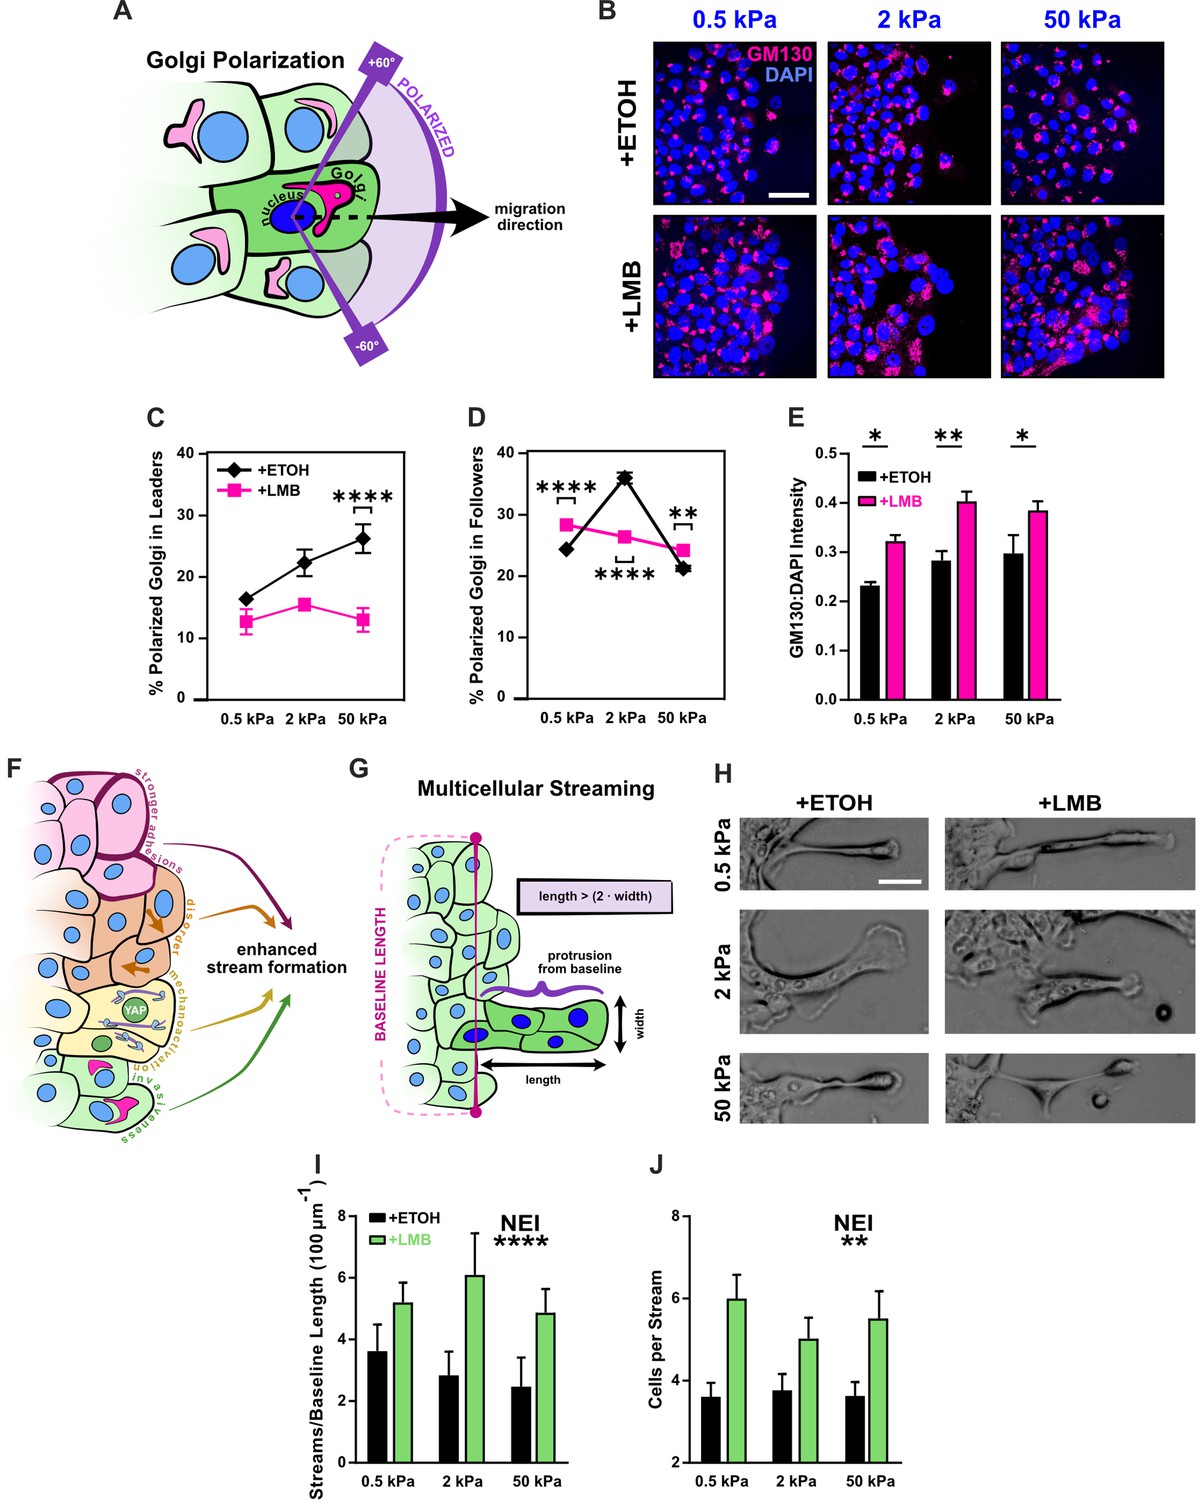
Disrupted Golgi polarization and GM130 expression underlie disordered migration while the combined epithelial–mesenchymal features support multicellular streaming.
(A) Schematic definition for Golgi polarization, where a polarized Golgi is one whose centroid lies within 60° of the line drawn from the nuclear centroid in the average direction of migration. (B) Representative images for gm130 and DAPI across substrate stiffnesses and cell treatments. Quantification of Golgi polarization in (C) leaders (n > 50) and (D) followers (n > 250). Shapes represent mean and error bars represent standard error of the mean (SEM). (E) Quantification of gm130 intensity across substrate stiffnesses (n = 8). (F) Schematic depicting nuclear export inhibition (NEI)-induced changes in cell phenotype and migration, which imply the potential for enhanced stream formation. (G) Schematic definition for multicellular streams. (H) Example images for multicellular streams seen across stiffnesses and treatment conditions. Accompanying quantification for the number of (I) streams per baseline length and (J) cells per stream. Bars represent mean ± SEM. Data were analyzed using two-way analyses of variance (ANOVAs) with Tukey post hoc analyses to evaluate NEI and stiffness effects. *’s denote the significance level for NEI effects. Significance levels: * < .0332, ** < 0.0021, *** < .0002, **** < 0.0001. Scale bar: 50 μm.
Figure 6 with 3 supplements
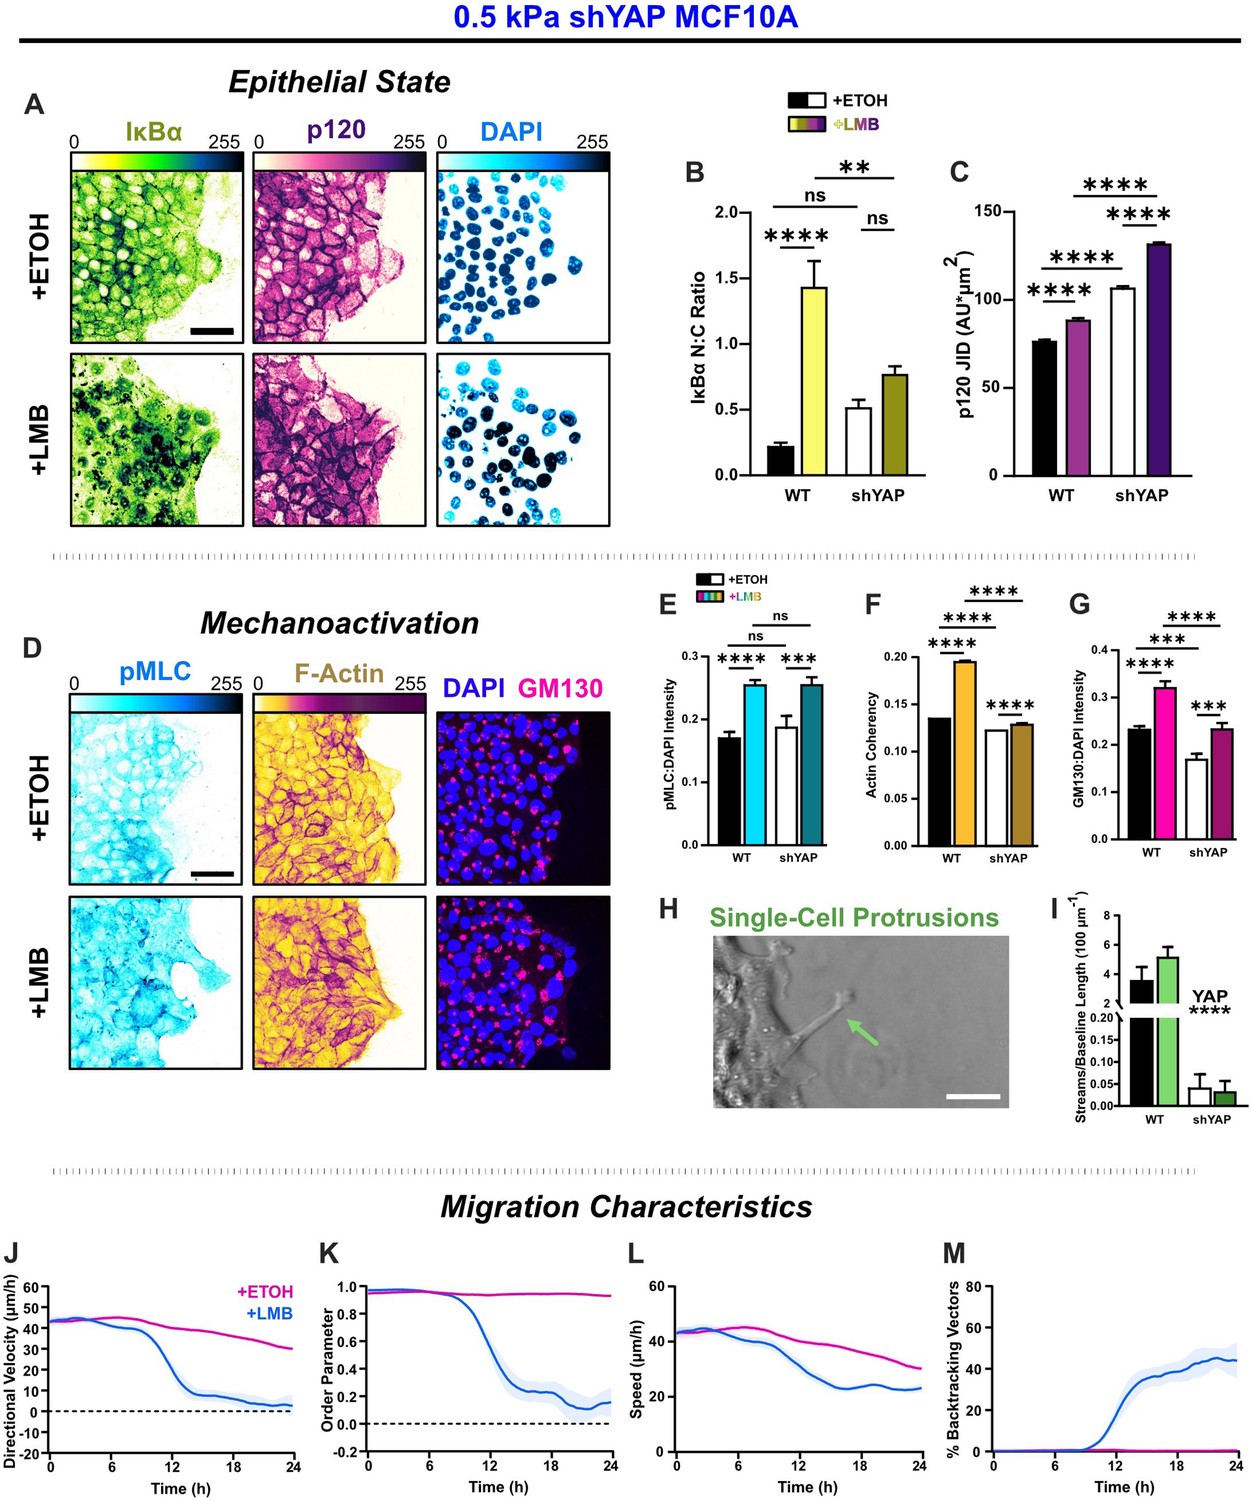
YAP silencing enhances epithelial characteristics and attenuates mechanoactivation.
(A) Epithelial characteristics for shYAP MCF10A. Images depict nucleocytoplasmic localization of IκBα (left), p120 expression (middle), and DAPI nuclear signal (right). (B) Nucleocytoplasmic (N:C) ratio for IκBα (n = 8). (C) Changes in p120 junction integrated density (JID) (n = 8). (D) Mechanoactive characteristics for shYAP MCF10A. Images depict phosphorylated myosin light chain (pMLC) (left), F-actin (middle), and gm130 expression (right). Quantification comparing WT and shYAP (E) pMLC expression (n = 8), (F) actin coherency (n > 1000), and (G) gm130 expression (n = 8). (H) Representative image showing single-cell protrusions at the leading edge. (I) Quantification of multicellular streams per baseline length for WT and shYAP cells (n ≥ 6). Bars represent mean ± standard error of the mean (SEM). All data were analyzed using two-way analyses of variance (ANOVAs) with Tukey post hoc analyses to evaluate nuclear export inhibition (NEI) and YAP effects. For streams, *’s denote the significance level for YAP effects. Significance levels: ** < 0.0021, *** < .0002, **** < 0.0001. Time plots of migration characteristics (n ≥ 6): (J) net velocity, (K) order parameter, (L) speed, and (M) percentage of backtracking vectors for shYAP monolayers on 2 kPa polyacrylamide gel. Lines represent mean ± SEM. Scale bars: 50 μm.
Figure 6—figure supplement 1
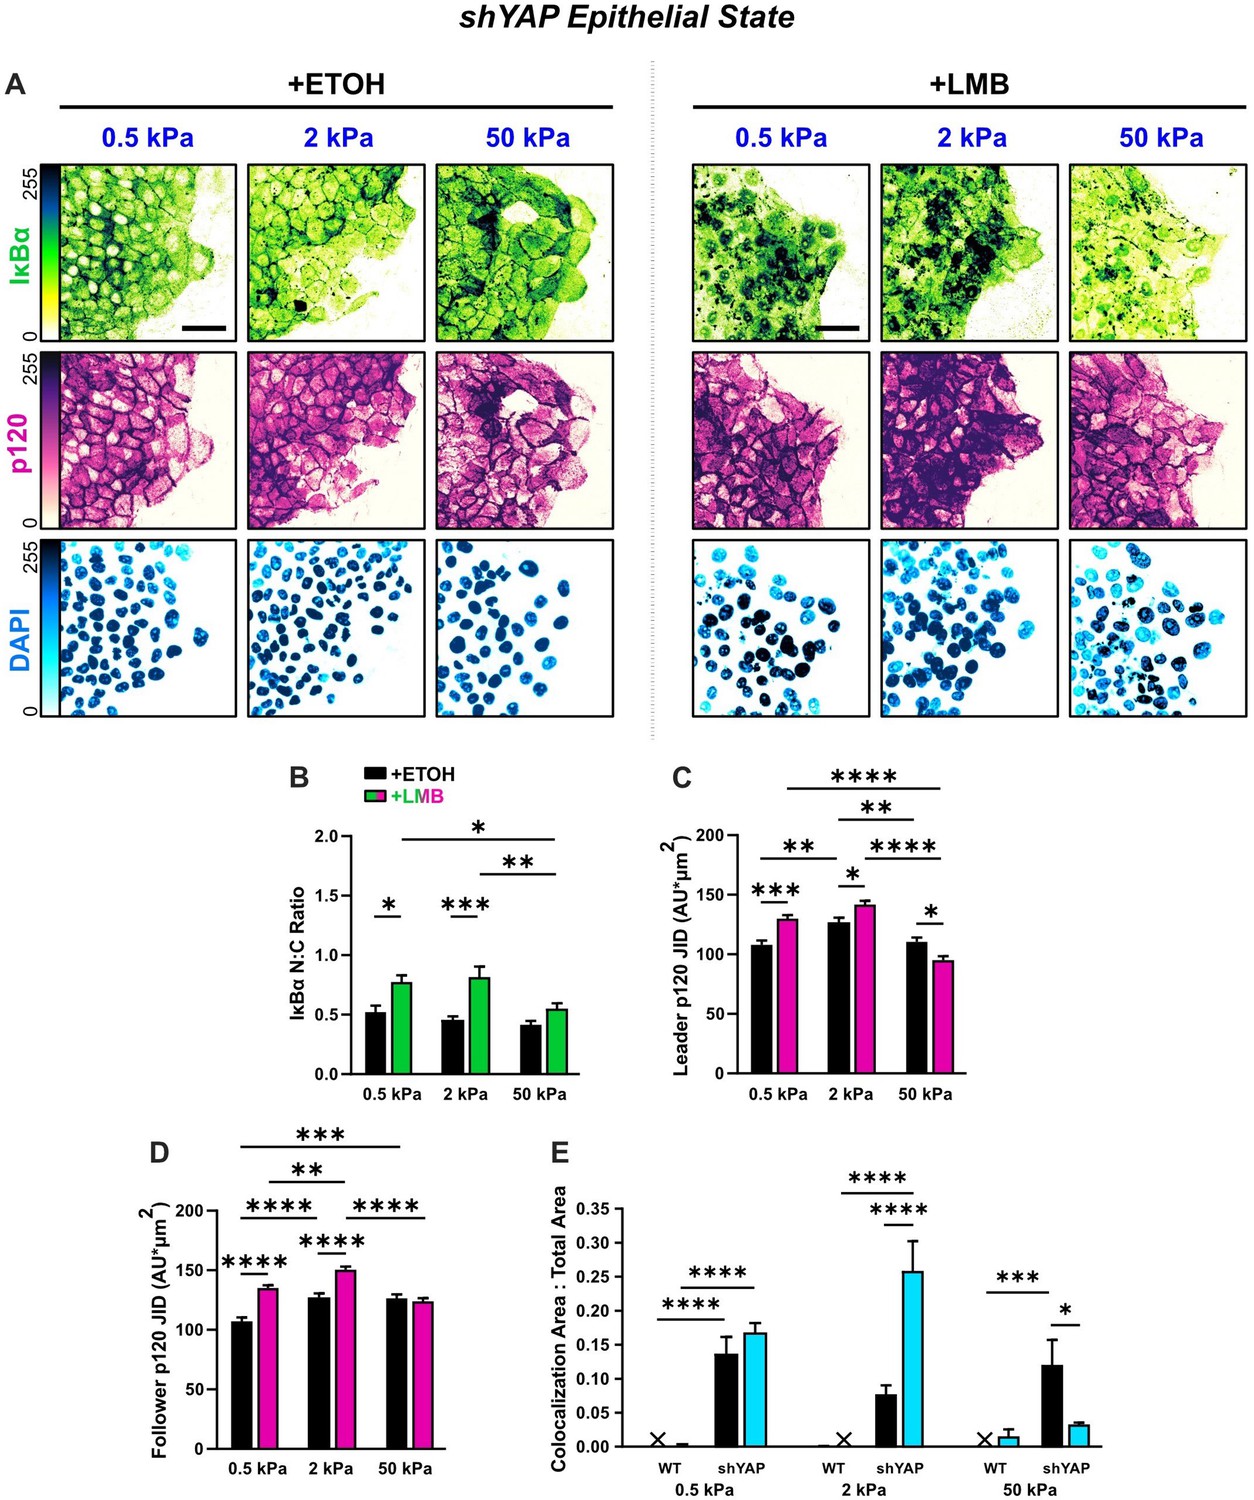
Epithelial characteristics for shYAP cells for all stiffnesses.
(A) Representative images for epithelial characteristics of shYAP MCF10A on 0.5, 2, and 50 kPa polyacrylamide gels. Monolayers were treated with ethanol (ETOH) as vehicle or leptomycin B (LMB) for nuclear export inhibition (NEI). Images depict nucleocytoplasmic localization of IκBα (top), p120 expression (middle), and DAPI nuclear signal (bottom). (B) shYAP nucleocytoplasmic (N:C) ratio for IκBα (n > 6). (C) Leader and (D) follower changes in p120 junction integrated density (JID) for shYAP cells (n = 55 leaders and 55 followers). Data were analyzed using two-way analysis of variance (ANOVA) with Tukey post hoc analyses to evaluate NEI and stiffness differences. Significance levels: * < .0332, ** < 0.0021, *** < .0002, **** < 0.0001. Bars represent mean ± standard error of the mean (SEM). Scale bars: 50 μm.
Figure 6—figure supplement 2
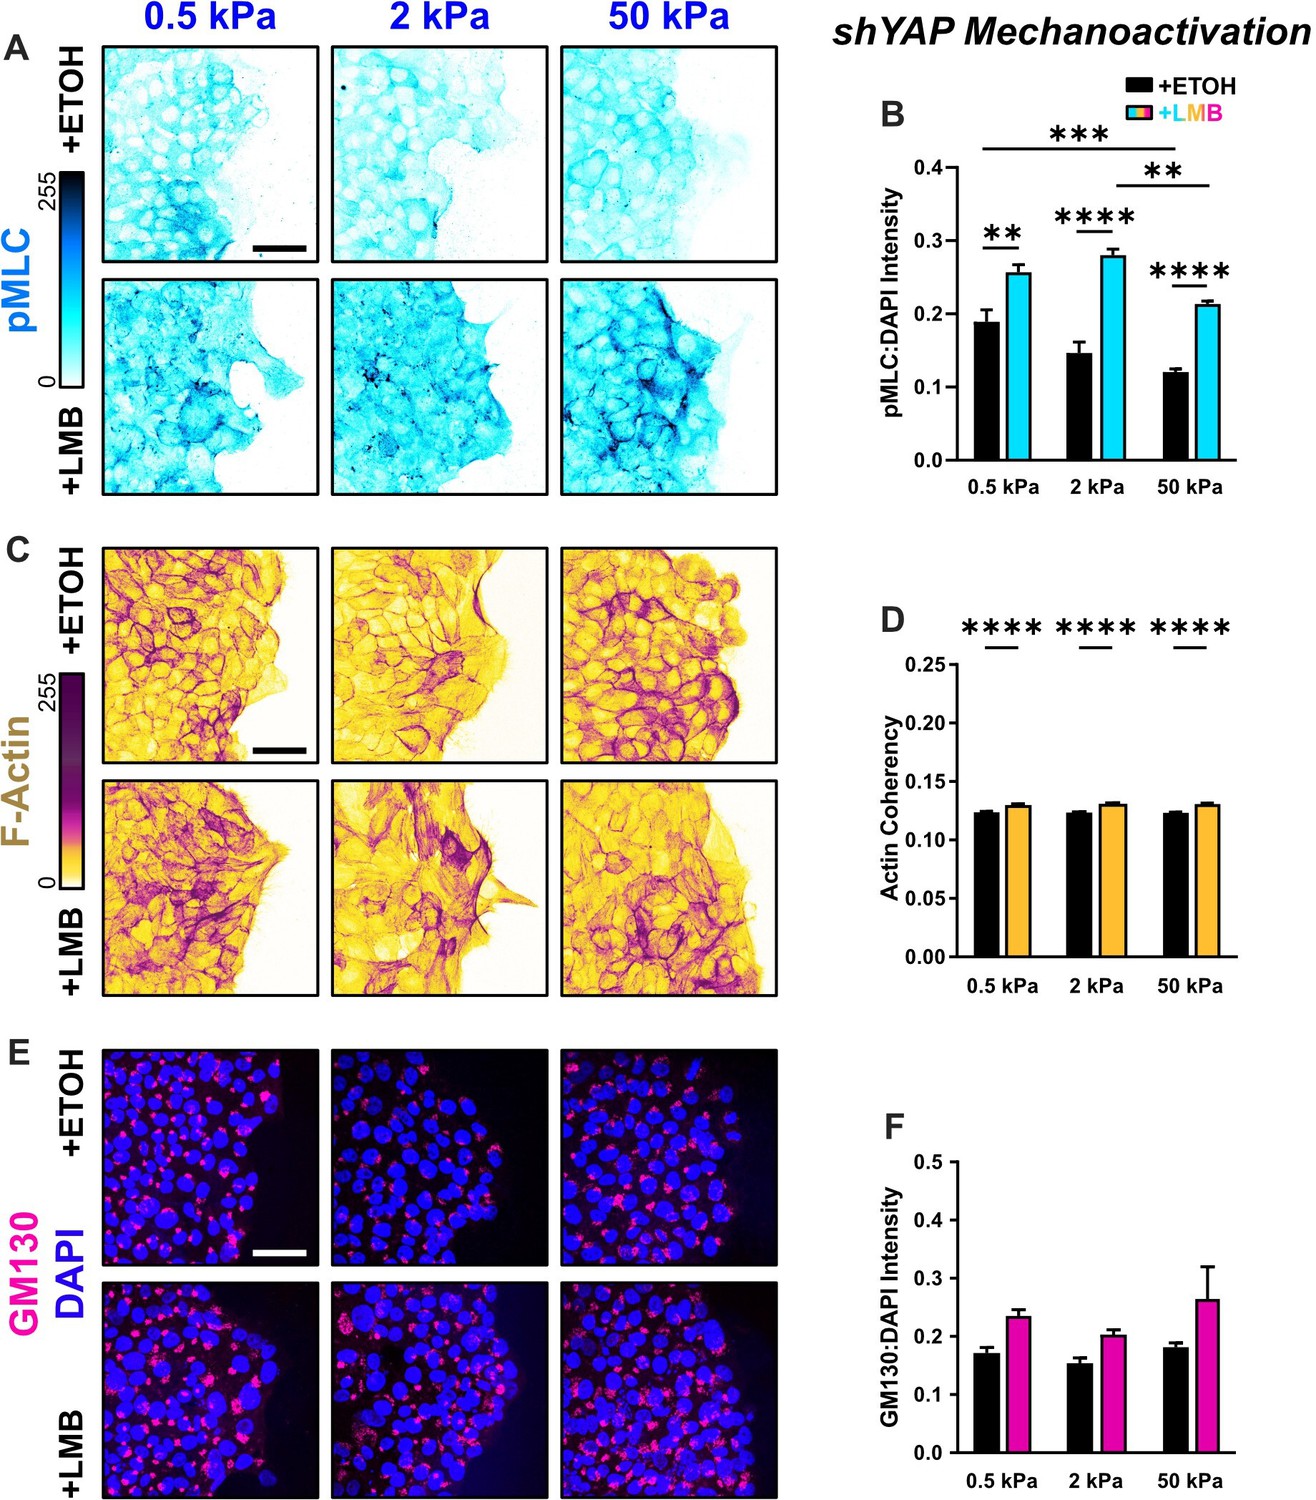
Mechanoactive characteristics for shYAP cells for all stiffnesses.
(A) Representative images of shYAP cells for phosphorylated myosin light chain (pMLC) expression across stiffnesses. (B) Quantification of pMLC intensity (n > 6). (C) Representative images of shYAP cells for F-actin across stiffnesses. (D) Quantification of actin coherency (n > 1000). (E) Representative images of shYAP cells for gm130 across stiffnesses. (F) Quantification of gm130 intensity (n = 8). Data were analyzed using two-way analyses of variance (ANOVAs) to evaluate with Tukey post hoc analyses effects from nuclear export inhibition (NEI) and stiffness. Significance levels: ** < 0.0021, *** < .0002, **** < 0.0001. Bars represent mean ± standard error of the mean (SEM). Scale bars: 50 μm.
Figure 6—figure supplement 3
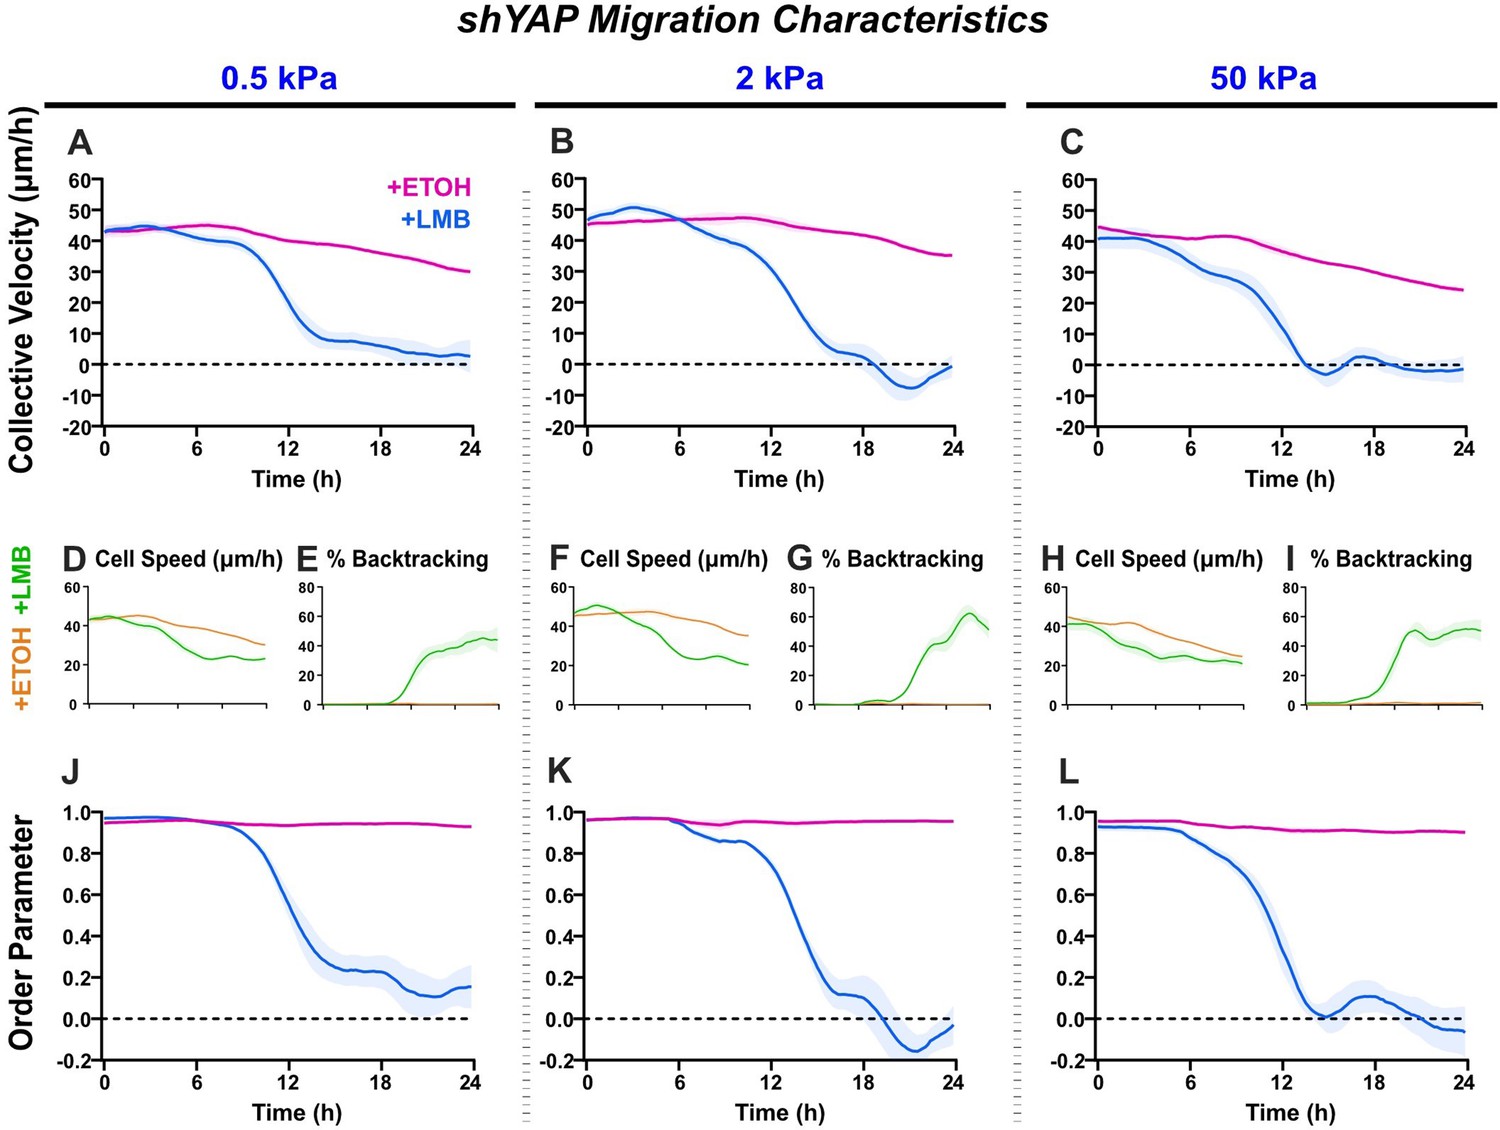
shYAP migration characteristics across stiffnesses.
Net migration velocity for shYAP on (A) 0.5 kPa, (B) 2 kPa, and (C) 50 kPa (n ≥ 6 each). Accompanying speeds (D, F, H), percentages of backtracking vectors (E, G, I), and order parameters (J–L).
Figure 7 with 3 supplements
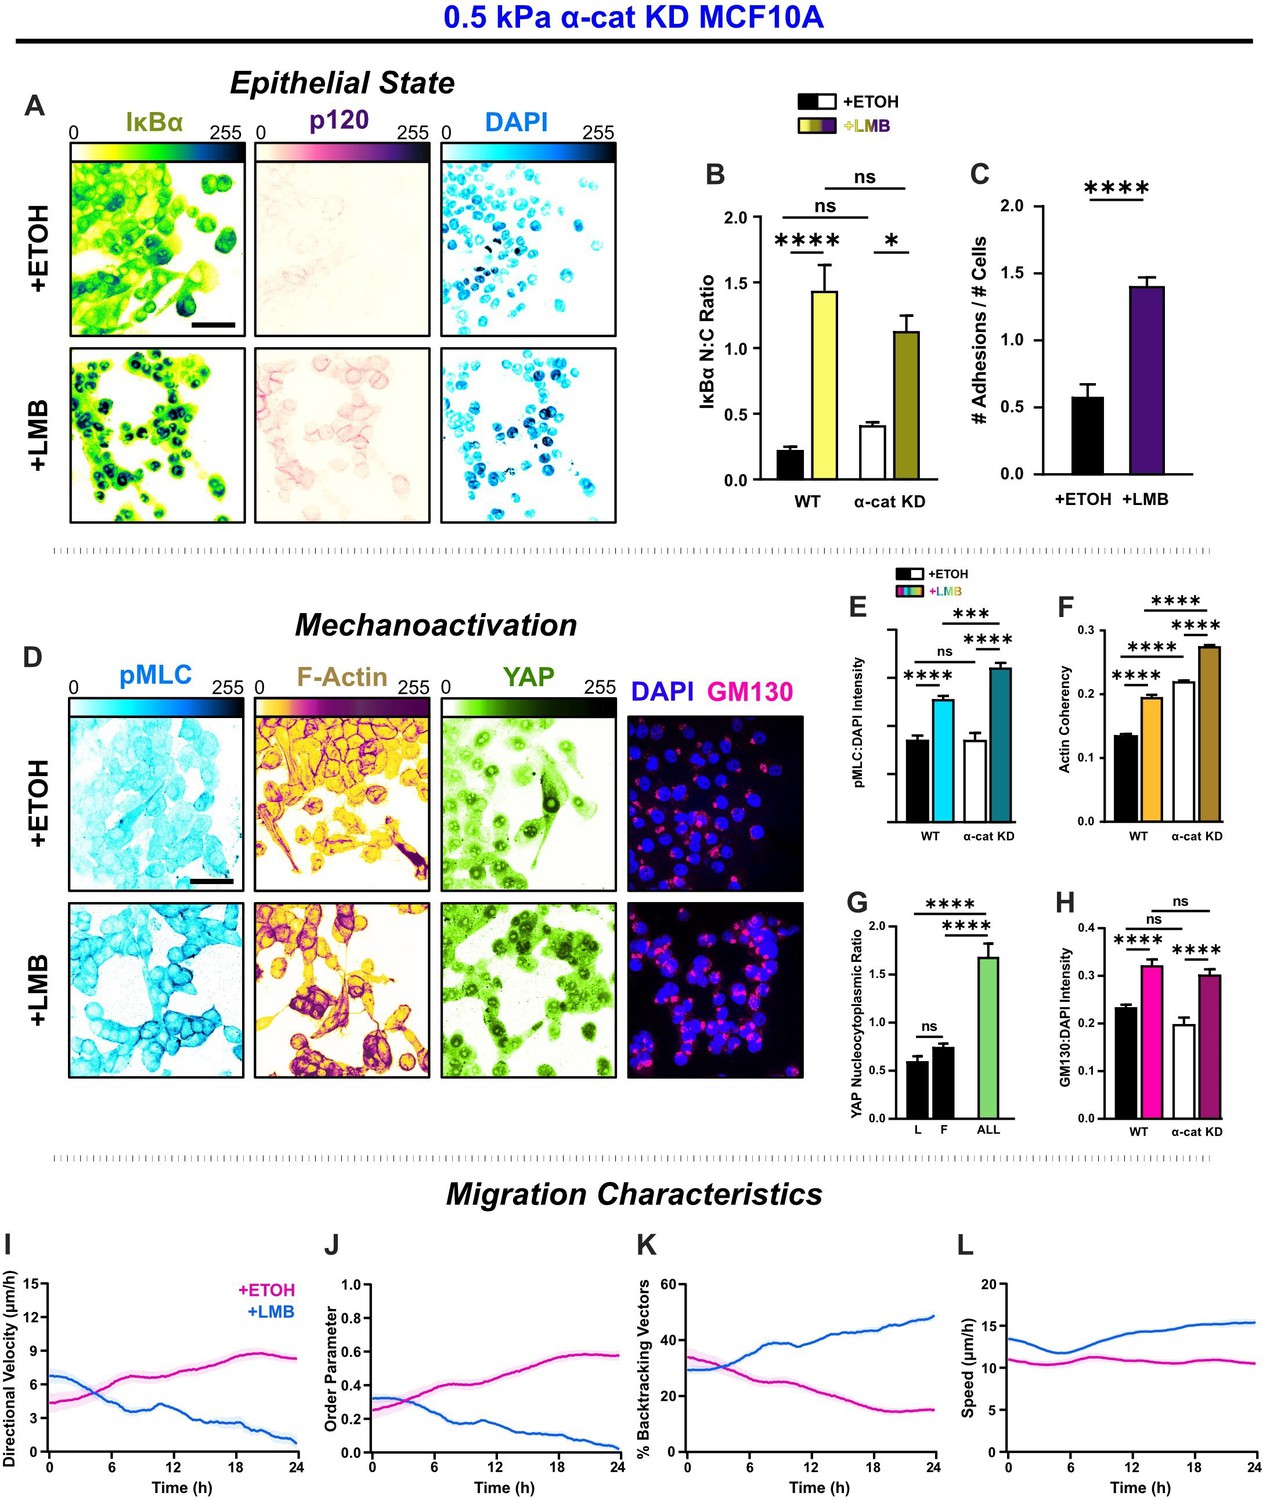
α-Catenin knockdown prevents the transfer of mechanoactive features to collective cell behavior.
(A) Epithelial characteristics for α-cat KD MCF10A. Images depict nucleocytoplasmic localization of IκBα (left), p120 expression (middle), and DAPI nuclear signal (right). (B) Nucleocytoplasmic (N:C) ratio for IκBα (n = 8). (C) Changes in the number of discernible p120-marked junctions (n = 8). (D) Mechanoactive characteristics for α-cat KD MCF10A. Images depict phosphorylated myosin light chain (pMLC) (left), F-actin (middle), and gm130 expression (right). Quantification comparing WT and α-cat KD (E) pMLC expression (n = 8), (F) actin coherency (n > 1000), (G) nucleocytoplasmic (N:C) YAP ratio, and (H) gm130 expression (n = 8). Bars represent mean ± standard error of the mean (SEM). All data were analyzed using two-way analyses of variance (ANOVAs) with Tukey post hoc analyses to evaluate nuclear export inhibition (NEI) and α-catenin effects.Significance levels: * < .0332, *** < .0002, **** < 0.0001. Time plots of migration characteristics (n ≥ 6): (I) net velocity, (J) order parameter, (K) percentage of backtracking vectors, and (L) speed for α-cat KD monolayers on 2 kPa polyacrylamide gel. Lines represent mean ± SEM. Scale bars: 50 μm.
Figure 7—figure supplement 1
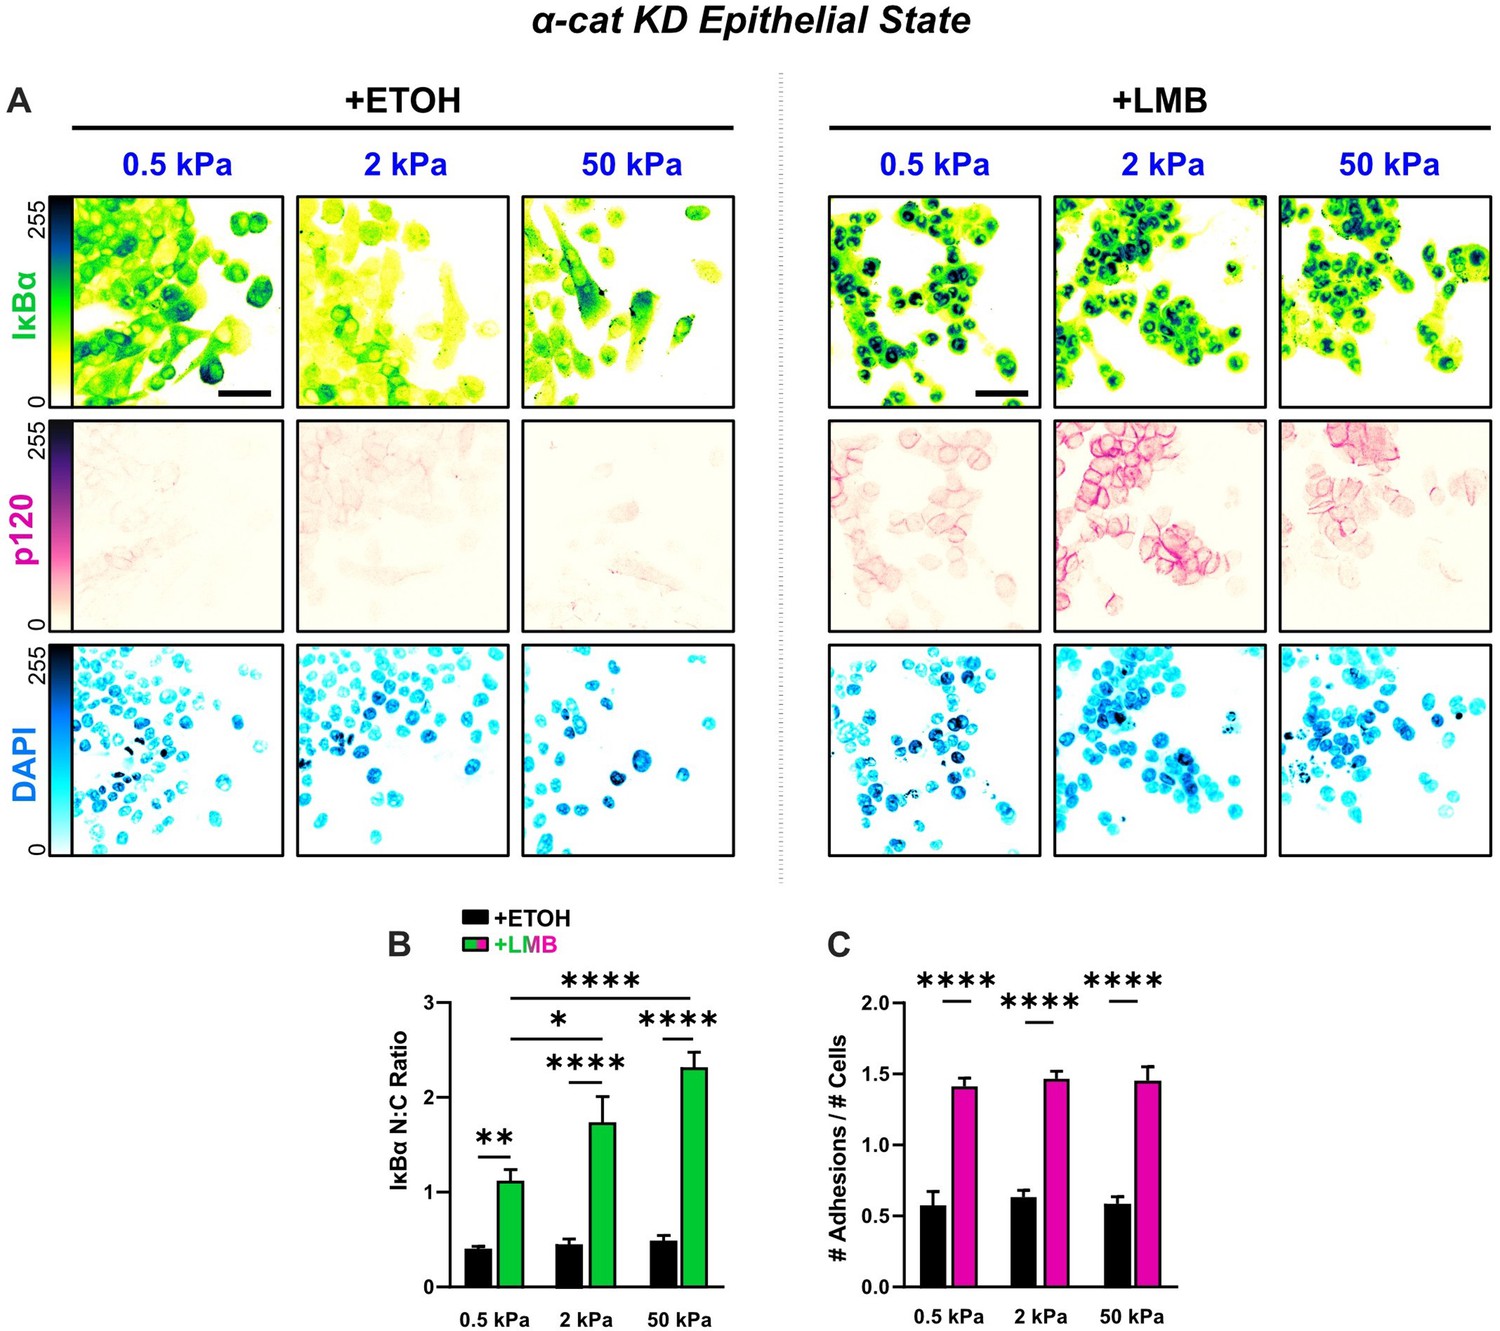
Epithelial characteristics for α-cat KD cells for all stiffnesses.
(A) Representative images for epithelial characteristics of α-cat KD MCF10A on 0.5, 2, and 50 kPa polyacrylamide gels. Monolayers were treated with ethanol (ETOH) as vehicle or leptomycin B (LMB) for nuclear export inhibition (NEI). Images depict nucleocytoplasmic localization of IκBα (top), p120 expression (middle), and DAPI nuclear signal (bottom). (B) α-cat KD nucleocytoplasmic (N:C) ratios for IκBα (n > 6). (C) Differences in the number of discernible p120-marked junctions (n > 6). Data were analyzed using a two-way analysis of variance (ANOVA) with Tukey post hoc analyses to evaluate NEI and stiffness effects. Significance levels: * < .0332, ** < 0.0021, **** < 0.0001. Bars represent mean ± standard error of the mean (SEM). Scale bar: 50 μm.
Figure 7—figure supplement 2
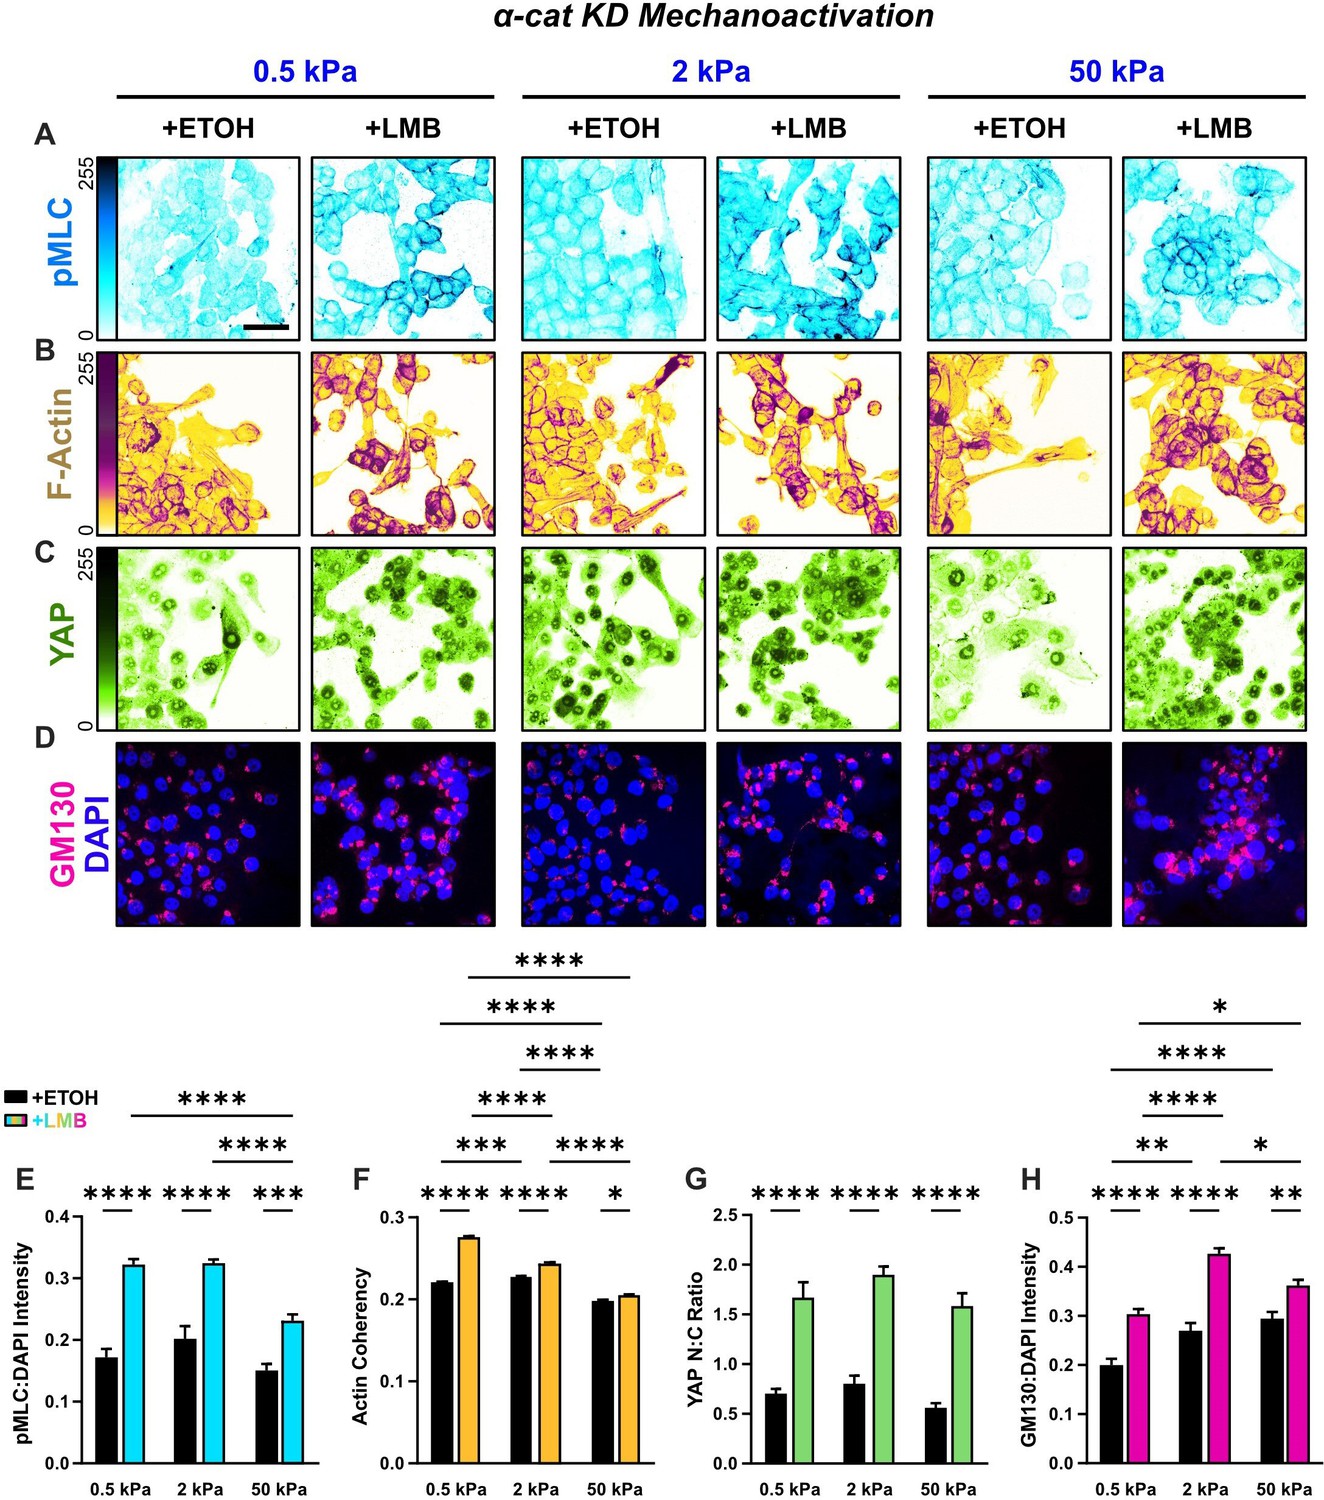
Mechanoactive characteristics for α-cat KD cells for all stiffnesses.
Representative images of α-cat KD cells for (A) phosphorylated myosin light chain (pMLC), (B) F-actin, (C) YAP, and (D) gm130 across stiffnesses. (E) α-cat KD quantification of pMLC expression (n = 8), (F) YAP nucleocytoplasmic (N:C) ratio, (G) actin coherency (n > 1000), and (H) gm130 expression (n = 8) across stiffnesses. Data were analyzed using two-way analyses of variance (ANOVAs) with Tukey post hoc analyses to evaluate effects from nuclear export inhibition (NEI) and stiffness. Significance levels: * < .0332, ** < 0.0021, *** < .0002, **** < 0.0001. Bars represent mean ± standard error of the mean (SEM). Scale bar: 50 μm.
Figure 7—figure supplement 3
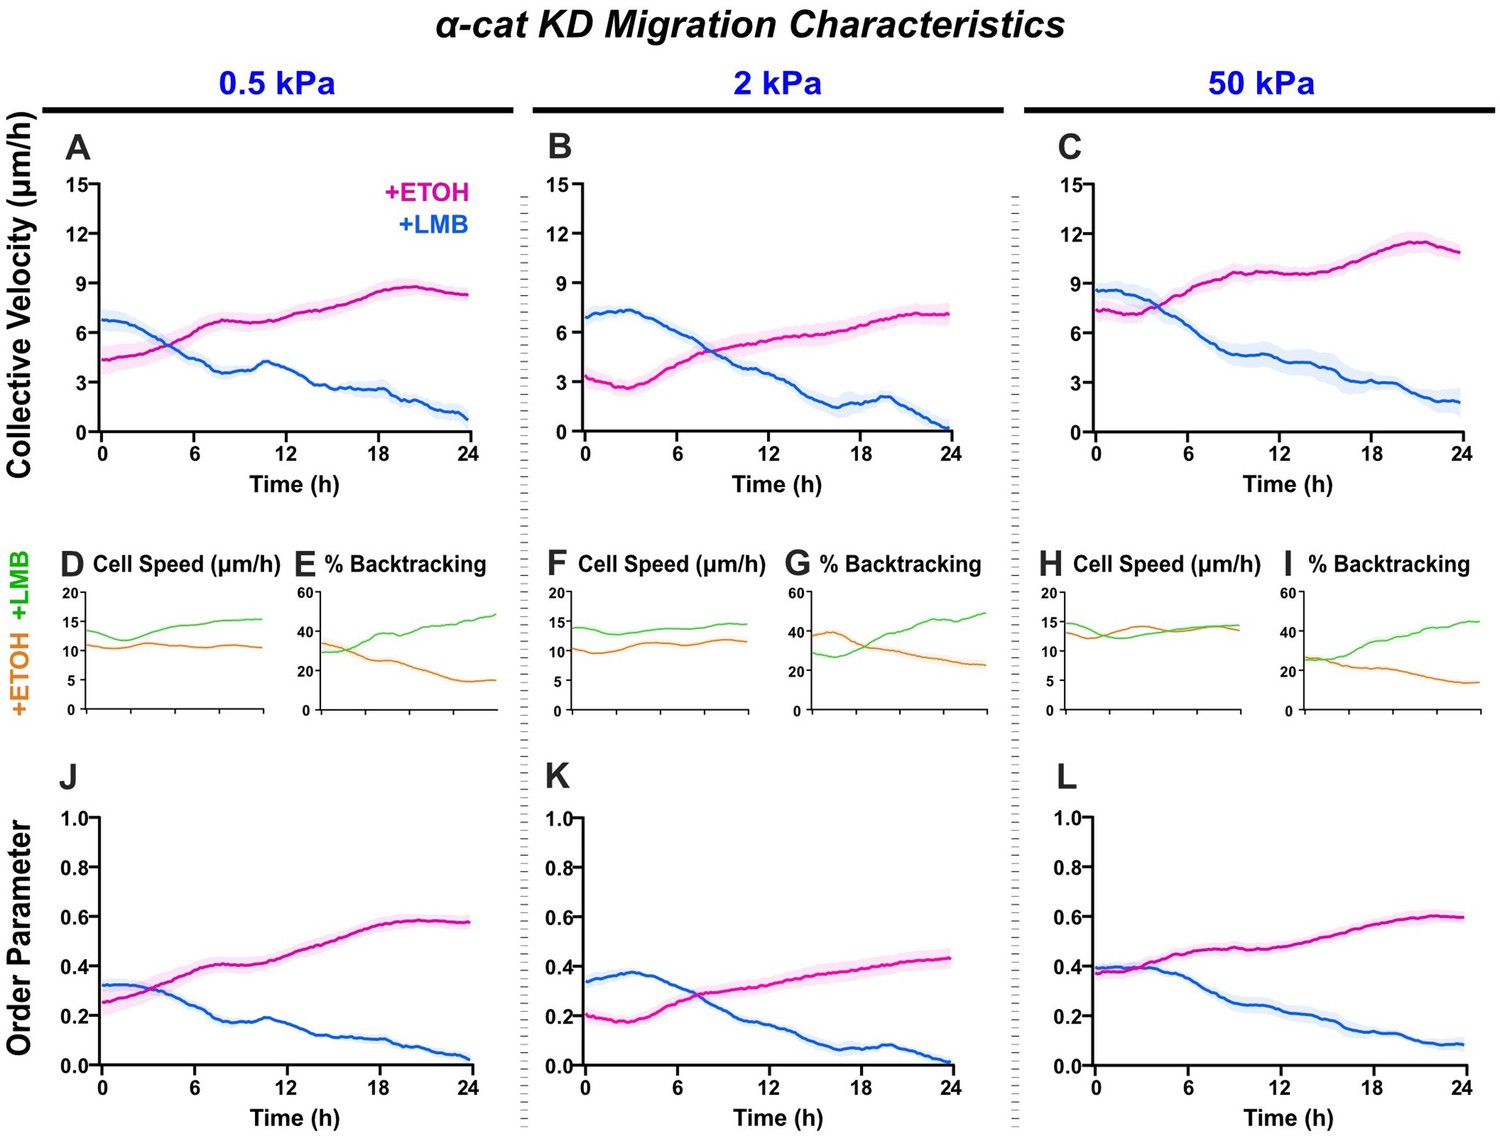
α-cat KD migration characteristics across stiffnesses.
Net migration velocity for shYAP on (A) 0.5 kPa, (B) 2 kPa, and (C) 50 kPa (n ≥ 6 each). Accompanying speeds (D, F, H), percentages of backtracking vectors (E, G, I), and order parameters (J–L).
Figure 8 with 1 supplement
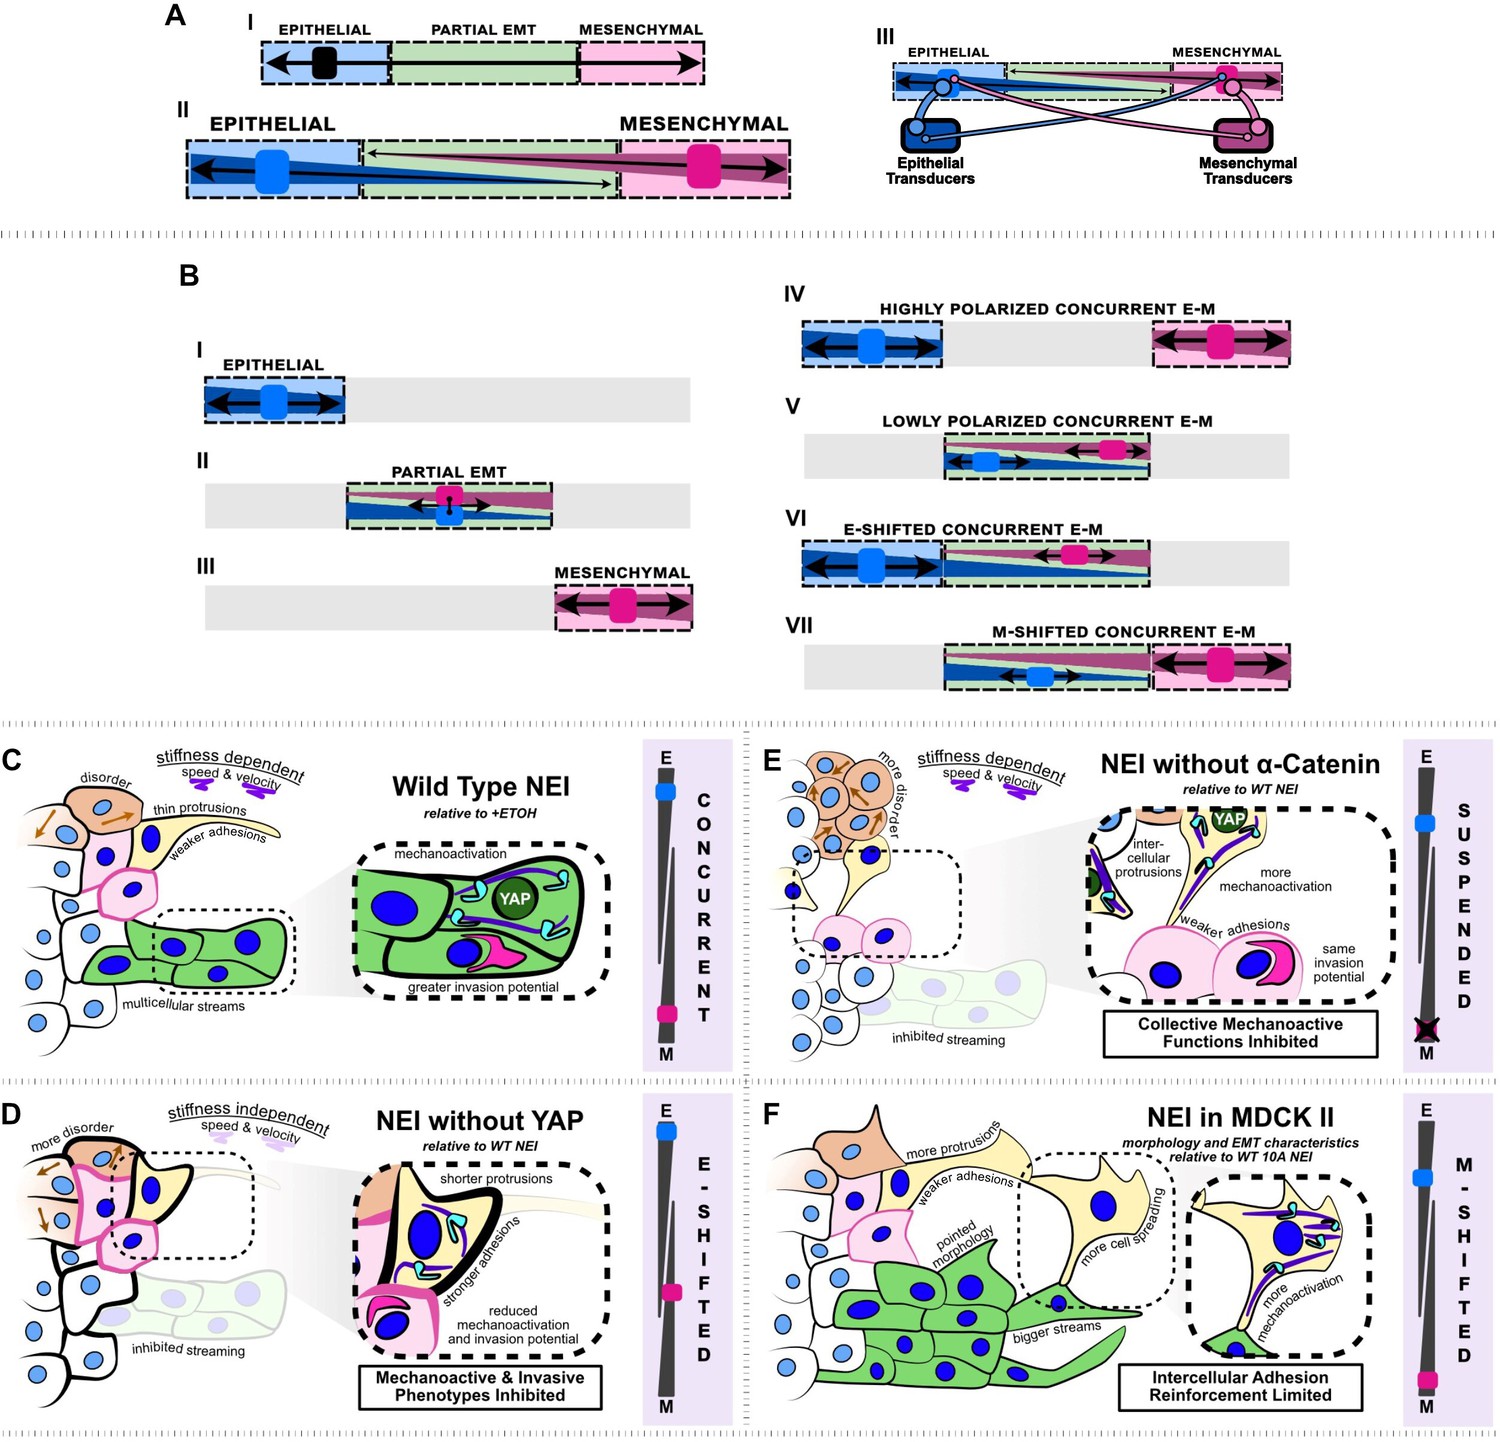
Summary schematic depicting nuclear export inhibition (NEI) outcomes for WT MCF10A, shYAP MCF10A, α-catenin knockdown MCF10A, and MDCK II cells.
(A.I) Schematic depicting the current understanding of the epithelial–mesenchymal (E-M) continuum, which requires that cells must lose epithelial traits as they acquire mesenchymal ones. (A.II) Simplified schematic depicting our proposed conceptual model where epithelial and mesenchymal traits exist on separate continua, allowing for concurrent E-M states (bottom). (A.III) Schematic depicting the implied conceptual mechanism, whereby individual epithelial and mesenchymal markers may pull the phenotype in separate directions. The individual number and strength of epithelial and mesenchymal transducers determines the ultimate cellular phenotype. (B.I–III) Established epithelial and mesenchymal states shown on the proposed continua. (B.IV–VII) Epithelial and mesenchymal states exhibiting concurrent behavior, shown on the proposed continua. (C) Relative to vehicle, WT MCF10A exhibit stronger intercellular adhesions, together with higher mechanoactivation and invasion potential. Cells exhibit thin protrusive morphology as single cells and form more multicellular streams at the leading edge. We propose this is a highly polarized concurrent epithelial–mesenchymal (E-M) state. NEI disrupts collective migration, causing stiffness-dependent changes in speed and velocity, and overall migratory disorder. (D) Relative to WT NEI, NEI for shYAP yields stronger intercellular adhesions while lowering mechanoactivation and invasion potential. Cells form shorter protrusions and are unable to form multicellular streams. We propose this is an E-shifted concurrent state. (E) Relative to WT NEI, NEI for α-cat KD MCF10A yields weaker intercellular adhesions and more mechanoactivation. Cells protrude to form more intercellular connections, but collective mechanoactive function is inhibited. Given the strong mechanoactive signatures, but low mechanoactive behavior, we propose that α-cat KD suspends the concurrent E-M state. (F) Relative to WT MCF10A, NEI for MDCK II cells increases mesenchymal characteristics further, with cells exhibiting highly spread and protrusive morphology. Cells exhibit fewer epithelial characteristics in the absence of p120-mediated intercellular adhesion reinforcement; however, cells still retain adhesion and form bigger multicellular streams. We propose this is an M-shifted concurrent state.
Figure 8—figure supplement 1
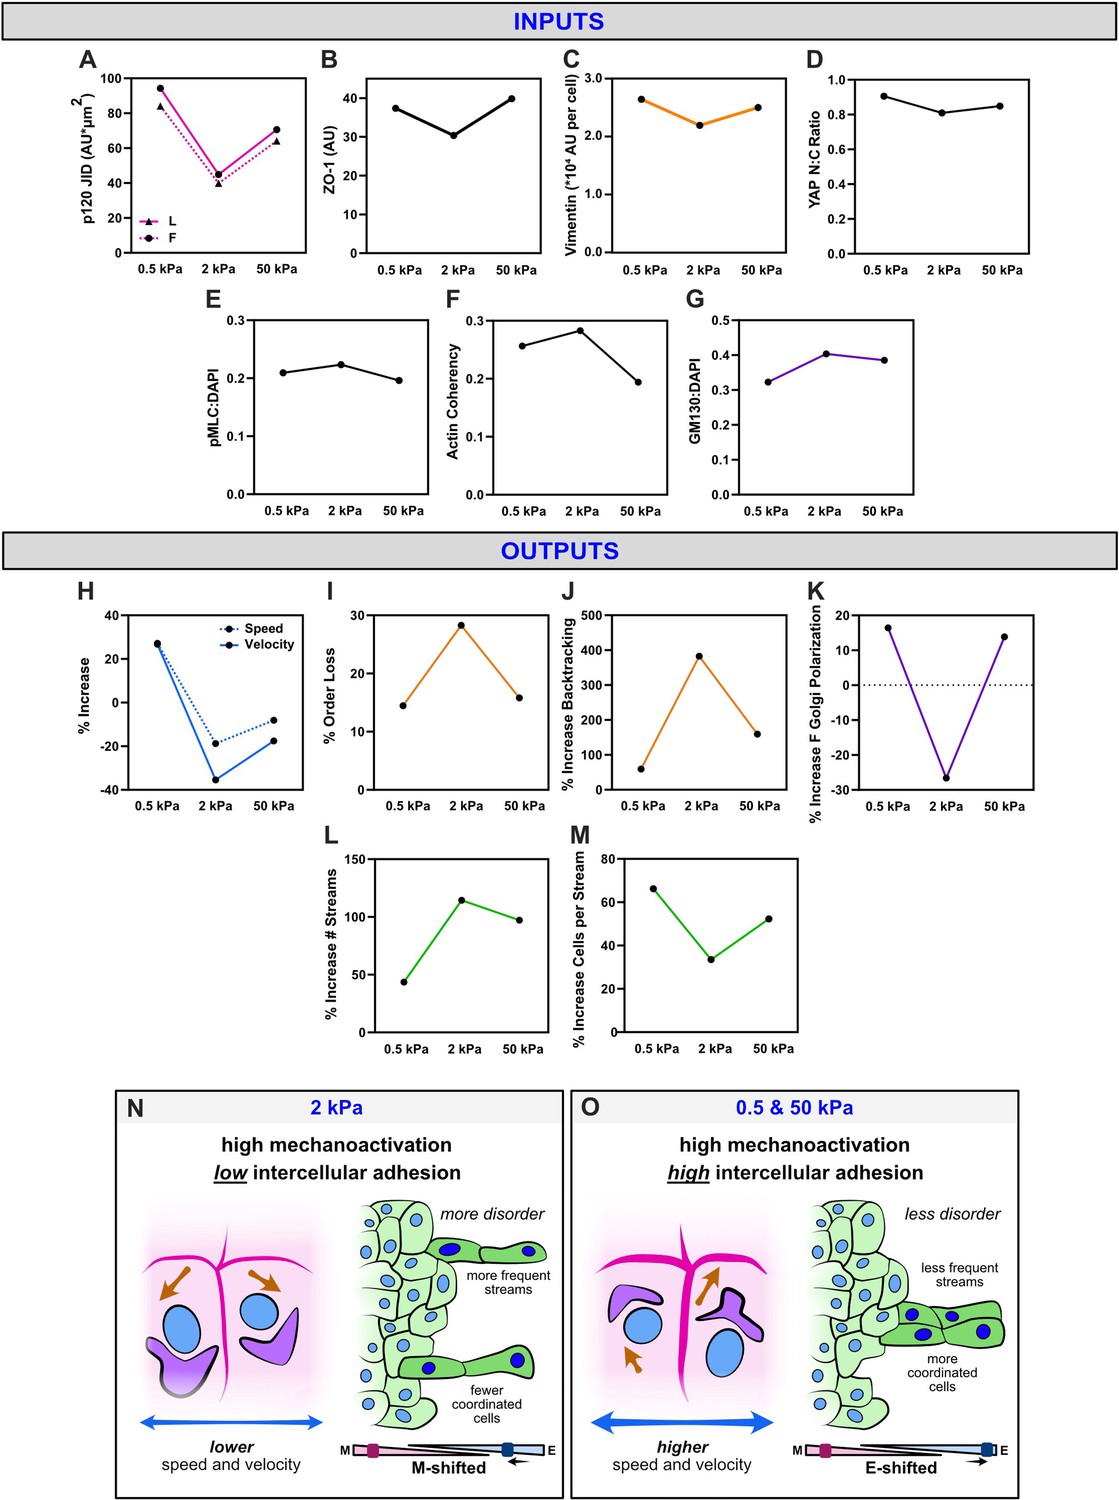
Outcomes from WT nuclear export inhibition (NEI) are biphasic with substrate stiffness and may derive from shifts in the balance between intercellular adhesion and mechanoactivation.
Average measures of (A) p120 adhesion strength, (B) ZO-1 intensity, (C) vimentin expression, (D) YAP N:C ratio, (E) phosphorylated myosin light chain (pMLC) expression, (F) actin coherency, and (G) gm130 expression for each stiffness. Accompanying percentage changes for (H) speed and velocity, (I) order parameter, (J) backtracking, (K) follower Golgi polarization, (L) stream formation, and (M) the number of cells per stream. (N) Schematic illustrating relationships on 2 kPa, where lower adhesion strength correlates with the overall higher disorder. (O) Schematic illustrating relationships on 0.5 and 50 kPa, where higher adhesion strength correlates with the overall lower disorder.
Author response image 1
Tables
Key resources table
| Reagent type (species) or resource | Designation | Source or reference | Identifiers | Additional information |
|---|---|---|---|---|
| Cell line (Homo sapiens) | MCF10A breast, epithelial | ATCC | Cat. #: CRL-10317 | N/A |
| Cell line (Homo sapiens) | shYAP MCF10A breast, epithelial | Dr. Gregory Longmore Nasrollahi, S., Walter, C., Loza, A. J., Schimizzi, G. v., Longmore, G. D., & Pathak, A. (2017). Past matrix stiffness primes epithelial cells and regulates their future collective migration through a mechanical memory. Biomaterials, 146, 146–155. https://doi.org/10.1016/j.biomaterials.2017.09.012 | N/A | N/A |
| Cell line (Homo sapiens) | α-catenin KD MCF10A breast, epithelial | Dr. Gregory Longmore Loza, A. J., Koride, S., Schimizzi, G. v., Li, B., Sun, S. X., & Loza et al., 2016. Cell density and actomyosin contractility control the organization of migrating collectives within an epithelium. Molecular Biology of the Cell, 27(22), 3459–3,470. https://doi.org/10.1091/mbc.e16-05-0329 | N/A | N/A |
| Cell line (Canis familiaris) | MDCK I kidney, epithelial | ECACC | Cat. #: 00062106 | N/A |
| Cell line (Canis familiaris) | MDCK II kidney, epithelial | WashU Tissue Culture Center | N/A | N/A |
| Commercial assay or kit | RNeasy Mini Kit | Qiagen | Cat. #: 74106 | N/A |
| Commercial assay or kit | High-Capacity RNA-to-cDNA Kit | Thermo Fisher Scientific | Cat. #: 4368814 | N/A |
| Commercial assay or kit | TaqMan Fast Advanced Master Mix | Thermo Fisher Scientific | Cat. #: 4444556 | N/A |
| Sequence-based reagent | PTEN Hs02621230-s1 | Thermo Fisher Scientific | PCR primers | N/A |
| Sequence-based reagent | ZEB1 Hs00232783-m1 | Thermo Fisher Scientific | PCR primers | N/A |
| Sequence-based reagent | SNAIL1 Hs00195591-m1 | Thermo Fisher Scientific | PCR primers | N/A |
| Sequence-based reagent | TWIST1 Hs01675818-s1 | Thermo Fisher Scientific | PCR primers | N/A |
| Sequence-based reagent | GAPDH Hs02758991-g1 | Thermo Fisher Scientific | PCR primers | N/A |
| Sequence-based reagent | B2M Hs00187842-m1 | Thermo Fisher Scientific | PCR primers | N/A |
| Antibody | Anti-IκBα, mouse, monoclonal | Cell Signaling Technology | Cat. #: L35A5 | IF (1:400) |
| Antibody | Anti-catenin delta 1 (p120), rabbit, monoclonal | Cell Signaling Technology | Cat. #: D7S2M | IF (1:800) |
| Antibody | Anti-YAP, rabbit, monoclonal | Cell Signaling Technology | Cat. #: D8H1X | IF (1:100) |
| Antibody | Anti-P Myosin Light Chain 2, mouse, monoclonal | Cell Signaling Technology | Cat. #: 519 | IF (1:200) |
| Antibody | Anti-GM130, rabbit, monoclonal | Cell Signaling Technology | Cat. #: D6B1 | IF (1:200) |
| Antibody | Anti-Vimentin, rabbit, monoclonal | Cell Signaling Technology | Cat. #: 5741 S | IF: (1:100) |
| Antibody | Anti-ZO-1, mouse, monoclonal | Thermo Fisher Scientific | Cat. #: 33-9100 | IF: (1:100) |
| Antibody | AlexaFluor 488, goat anti-mouse, secondary | Life Technologies | Cat. #: A11001 | IF (1:500); secondary for IκBα, pMLC, ZO-1 |
| Antibody | AlexaFluor 488, goat anti-rabbit, secondary | Life Technologies | Cat. #: A11008 | IF (1:500); secondary for YAP |
| Antibody | AlexaFluor 647, goat anti-rabbit, secondary | Invitrogen | Cat. #: A31634 | IF (1:500); secondary for p120, GM130, vimentin |
| Chemical compound, drug | Rhodamine Phalloidin | Invitrogen | Cat. #: R415 | (1:250) |
| Chemical compound, drug | 40% Acrylamide Solution | BIORAD | Cat. #:1610140 | N/A |
| Chemical compound, drug | 2% Bis Solution | BIORAD | Cat. #: 1610142 | N/A |
| Chemical compound, drug | Bind silane | GE Healthcare Life Sciences | Cat. #: 17-1330-01 | N/A |
| Chemical compound, drug | Sigmacote | Sigma | Cat. #: SL2 | N/A |
| Chemical compound, drug | Ammonium persulfate | BIORAD | Cat. #: 1610700 | N/A |
| Chemical compound, drug | TEMED | Sigma | Cat. #: T7024 | N/A |
| Chemical compound, drug | HEPES sodium salt solution | Sigma | Cat. #: H3662 | N/A |
| Chemical compound, drug | Sulfo-SANPAH | Fisher Scientific, Proteochem | Cat. #: NC1314883 | N/A |
| Chemical compound, drug | Collagen I, rat tail | ChemCruz | Cat. #: sc-136157 | N/A |
| Chemical compound, drug | Leptomycin B | ChemCruz | Cat. #: sc-358688 | N/A |
| Chemical compound, drug | Selinexor | Selleck Chemicals | Cat. #: S7252 | N/A |
| Chemical compound, drug | Triton X-100 | Sigma | Cat. #: X100 | N/A |
| Chemical compound, drug | Bovine serum albumin | Sigma | Cat. #: A7906 | N/A |
Additional files
-
MDAR checklist
- https://cdn.elifesciences.org/articles/81048/elife-81048-mdarchecklist1-v1.pdf
-
Source code 1
Code for extracting migration parameters from timelapse and particle image velocimetry data.
- https://cdn.elifesciences.org/articles/81048/elife-81048-code1-v1.zip
Download links
A two-part list of links to download the article, or parts of the article, in various formats.
Downloads (link to download the article as PDF)
Open citations (links to open the citations from this article in various online reference manager services)
Cite this article (links to download the citations from this article in formats compatible with various reference manager tools)
Nuclear export inhibition jumbles epithelial–mesenchymal states and gives rise to migratory disorder in healthy epithelia
eLife 12:e81048.
https://doi.org/10.7554/eLife.81048


